Abstract
Alzheimer's disease (AD) is a neurodegenerative ailment, which gradually deteriorates memory and weakens the cognitive functions and capacities of the body, such as recall and logic. To diagnose this disease, CT, MRI, PET, etc. are used. However, these methods are time-consuming and sometimes yield inaccurate results. Thus, deep learning models are utilized, which are less time-consuming and yield results with better accuracy, and could be used with ease. This article proposes a transfer learning-based modified inception model with pre-processing methods of normalization and data addition. The proposed model achieved an accuracy of 94.92 and a sensitivity of 94.94. It is concluded from the results that the proposed model performs better than other state-of-the-art models. For training purposes, a Kaggle dataset was used comprising 6,200 images, with 896 mild demented (M.D) images, 64 moderate demented (Mod.D) images, and 3,200 non-demented (N.D) images, and 1,966 veritably mild demented (V.M.D) images. These models could be employed for developing clinically useful results that are suitable to descry announcements in MRI images.
Introduction
Alzheimer's disease (AD) is a neurological condition that damages the neurons and slowly deteriorates memory and hampers basic cognitive functions and abilities. This disease is detected by monitoring changes in the brain, which eventually result in neuron loss and their connections. According to the WHO, around 50 million people suffer from dementia, and nearly 10 million new cases of AD are reported every year. Ultimately, AD destroys the part of the brain that controls breathing and heart monitoring, eventually leading to fatality. AD involves three stages: very mild, mild, and moderate (Feng et al., 2020; Rallabandi et al., 2020). However, an individual affected by AD begins to show symptoms at the moderate stage. This disease affects the communication between neurons.
In the mild stage, progressive deterioration eventually hinders independence, with patients unable to perform most of the common activities of daily living. Speech difficulties become evident due to an inability to recall vocabulary, which leads to frequent incorrect word substitutions. Reading and writing skills are also progressively lost. Complex motor sequences become less coordinated with time as the disease progresses, so the risk of falling increases. During this phase, memory problems worsen, and the patients may fail to recognize even close relatives. Long-term memory, which was previously intact, becomes impaired. Moreover, old age alone does not cause AD, several health, environmental, and lifestyle factors also contribute to AD (Ebrahimi-Ghahnavieh et al., 2019; Talo et al., 2019; Nakagawa et al., 2020), including heart disease, lack of social engagement, and sleep (Hon and Khan, 2017; Aderghal et al., 2018; Islam and Zhang, 2018).
This study utilizes a novel modified inception-based model that classifies AD into four sub-categories: V.M.D, M.D, Mod.D, and N.D. The model was run on a large MRI dataset (Jha et al.,
2017). The following research points can be inferred from the study:
A modified inception v3 model was implemented to classify AD into four classes.
This model was modified by adding six convolutional layers, four dense block layers, two dropout layers, one flattening layer, and one layer with an activation function.
Image enhancement and augmentation processes were utilized to expand the image quantities in the dataset.
The proposed model was implemented using an Adam optimizer and 1,000 epochs.
Background literature
Most of the research work has applied the binary classification of AD (Jha et al., 2017; Aderghal et al., 2018; Ebrahimi-Ghahnavieh et al., 2019; Rallabandi et al., 2020) and a smaller dataset to design their proposed model, which may not be adaptable. The researchers (Hon and Khan, 2017; Talo et al., 2019; Feng et al., 2020; Nakagawa et al., 2020; Rallabandi et al., 2020) working on a large dataset have implemented two output-based classifications (Ali et al., 2016) or classifications of binary inputs (Bin. C) (Kang et al., 2021), which resulted in only marginal accuracy (Li et al., 2021). Table 1 compares the existing state-of-the-art models.
Table 1
| Ref. | Journal | Techniques | Aim | Challenges of the approach |
|---|---|---|---|---|
| Rallabandi et al. (2020) | Informatics in Medicine Unlocked | Non-Linear SVM with 2D CNN | To develop an automated technique to classify normal, early and late mild AD individuals | Dataset contained 1,167 brain MRI images. It utilized Bin.C and showed 75% accuracy |
| Feng et al. (2020) | International Journal of Neural Systems | 3D CNN-SVM | To distinguish Mod. D and M.D individuals from N.D individuals, for improving value-related care of Mod. D individuals in medical facilities | Dataset contained 3,127, 3T T1-weighted MRI brain images. It utilized classification of three inputs and showed 88.9% accuracy. It also aims to focus on regressing Mod. D individuals to healthy individuals predict Mod. D progression and improve in diagnosis of AD in future |
| Nakagawa et al. (2020) | Brain Communications | Cox, DeepHit | To diagnose conversion time from normal individual to AD individual by using deep survival analysis model | Dataset contained 2,142, T1-weighted images. It utilized classification of three inputs and showed 92.3% accuracy. It aims to diagnose the group of M.D individuals that would convert to AD in future |
| Ebrahimi-Ghahnavieh et al. (2019) | IAICT | GoogleNet, AlexNet, VGGNet16, VGGNet19, SqueezeNet, ResNet18, ResNet50, ResNet101, inceptionv3 | To detect AD on MRI scans using D.L techniques | Dataset contained 177 images. It utilized Bin.C and showed 84.38% accuracy. To comprise PET scans in the system to examine several aspects of AD |
| Talo et al. (2019) | Computerized Medical Imaging and Graphics | AlexNet, VGGNet16, ResNet18, ResNet34, ResNet50 | To diagnose MRI images into N.D and Mod.D | Dataset contained 1,074; T2-weighted MRI images and it utilized classification of multiple inputs and showed 95.59% accuracy |
| Islam and Zhang (2018) | Brain Informatics | inceptionV4, ResNet, ADNet | To diagnose AD by utilizing Deep-CNN ensemble | Dataset contained 416; T1-weighted sMRI scans and it utilized classification of multiple inputs and showed 93.18% accuracy. To predict AD from proposed model other brain diseases |
| Aderghal et al. (2018) | CBMS | Data Augmentation, CNN | To classify AD analysis by using Cross-Modal Transfer Learning | Dataset contained 416; sMRI image scans and it utilized Bin.C and showed 82.1% accuracy. To utilize a longitudinal dataset and implement cross modal method based on ROI spatial optimization |
| Hon and Khan (2017) | BIBM | CNN, Transfer Learning | To classify AD by using cross modal transfer learning algorithms | Dataset contained 6,400 brain images and yielded 92.3% accuracy while utilizing binary classification |
| Jha et al. (2017) | Journal of Healthcare Engineering | DTCWT, PCA, (FNN) | To develop a CAD system to early diagnose AD individulas | Dataset contained 416; T1- weighted image scans and it implemented binary classification and yielded an accuracy of 90.06%. To test 3D-DTCWT, wavelet packet analysis, utilize ICA, LDA and PCA |
| Ali et al. (2016) | International Journal of Computer Applications | VGG16, inceptionV4 | To classify AD by utilizing transfer learning algorithms in pre-trained models | Dataset contained 416; MRI AD and MCI image scans were utilized and utilized Bin.C and showed 74.12% accuracy by scratch and 92.3% by transfer learning algorithms |
| Kang et al. (2021) | CBM | 2D-CNN, VGG16 | To classify AD by using ensemble based CNN | Dataset contained 798; T1-weighted image scans and it utilized Bin.C and showed 90.36% accuracy. To distinguish AD from MCI images by using 2D-CNN |
| Li et al. (2021) | BMRI | SVM, CNN | To distinguish MCI from AD by using SVM classifier with linear kernel | Dataset contained 1,167; T1-weighted image scans and it utilized Bin.C and showed 69.37% accuracy. To distinguish AD from MCI images by using SVM-CNN |
| Venugopalan et al. (2021) | SR | SVM, k-NN, CNN | To distinguish MCI from AD by using SVM and k-NN | Dataset contained 1,311; T1 and T2 weighted image scans and utilized Bin.C and showed 75% accuracy. To distinguish AD from MCI images by using SVN-CNN, KNN |
Literature survey of existing models.
Materials and methods
This model classifies AD into ND, VMD, MD, and Mod D classes (Sarraf and Tofighi, 2016). The proposed model utilizes the Kaggle dataset containing 6,200 AD images. The model involves augmentation of data (Zhao et al., 2017) and extraction of features using a modified inception model (Fan et al., 2008), as shown in Figure 1. The model is executed using the Keras package in Python with Tensorflow, which is used at the backend of Intel(R) Core (TM) i5-6400 CPU 2.70 GHz processors and 12GB RAM.
Figure 1
Input dataset
The database used in this study consists of a total of 6,200 AD images that are retrieved from the Kaggle database. It comprises grayscale images of 896 MD, 64 Mod D, 3,200 ND, and 1,966 VMD images, with a dimension of (208 × 176 × 3) pixels. The dataset for evaluation is divided in such a way that 80% of the image samples are utilized for training the model and the remaining 20% are utilized for testing the model (Filipovych et al., 2011). Figure 2 shows the database of MRI images. Table 2 shows the publicly available AD dataset.
Figure 2
Table 2
| Dataset | Classes | Class name | Class images | Total images |
|---|---|---|---|---|
| OASIS | 4 | N.D | 292 | 416 |
| V.M.D | 24 | |||
| M.D | 28 | |||
| Mod.D | 72 | |||
| ADNI | 3 | ND | 159 | 469 |
| MD | 157 | |||
| Mod.D | 153 | |||
| Harvard Medical School | 4 | Mod.D | 378 | 1,680 |
| Kaggle | 4 | M.D | 896 | 6,126 |
| Mod.D | 64 | |||
| V.M.D | 1,966 | |||
| N.D | 3,200 |
Publicly available Alzheimer's disease dataset.
Table 3 shows the dataset description in which the number of training images, testing images, and validation images are given for AD classes. The total number of images in the dataset is 6,200, of which 179 are MD, 12 are Mod.D, 640 are ND, and 448 are VMD images. The complete dataset is divided into training and validation (Misra et al., 2009; Moradi et al., 2015).
Table 3
| S.No. | Alzheimer | Training | Validating | Before | After | Training | Validating |
|---|---|---|---|---|---|---|---|
| images | images | augmentation | augmentation | images | images | ||
| 1 | M.D | 717 | 179 | 896 | 2,688 | 2,150 | 538 |
| 2 | Mod.D | 52 | 12 | 64 | 640 | 512 | 128 |
| 3 | N.D | 2,560 | 640 | 3,200 | 3,500 | 2,800 | 700 |
| 4 | V.M.D | 1,518 | 448 | 1,966 | 3,932 | 3,145 | 787 |
Alzheimer's dataset description.
Normalization
Data normalization preserves the numerical stability of the modified inception model (Serra et al., 2016; Rathore et al., 2017). The MRI images have values ranging from 0 to 255. By utilizing the normalization technique, the images in the proposed model are trained faster (Rashid et al., 2022).
Augmentation
To enhance usefulness, a dataset with the maximum number of samples is required, but numerous site, privacy, and data restrictions often accompany while acquiring the dataset.
Therefore, to overcome these issues, augmentation of data is performed, which increases the original data quantity. Augmentation includes flipping (FL), rotation (Ro), and brightness (Bss). Both vertical (VF) and horizontal flipping (HF) techniques (Dhankhar et al., 2021; Juneja A. et al., 2021; Juneja S. et al., 2021) are shown in Figure 3. The Ro technique, as shown in Figure 4, is implemented in an anticlockwise direction by an angle of 90 degrees each. Bss, as shown in Figure 5, is also applied to the image dataset by taking brightness factor values as 0.3 and 0.7.
Figure 3
Figure 4
Figure 5
Table 3 exhibits the number of images before and after data augmentation. Furthermore, a disproportion in the number of images was found in every class. To improve this disproportion (Sharma et al., 2022c), augmentation of data was performed, as mentioned before. After their execution, the samples increased from 6,200 to 10,760 images, which represent the updated images. This is applied only to the training images. Before augmentation, the training images of MD, Mod D, ND, and VMD were 896, 64, 3,200, and 1,966, respectively. After the augmentation, the total number of training images became 10,760, which represents the total number of images of training and validation data after augmentation.
Feature extraction using the modified inception model
In the proposed model, input images with a dimension of 208 * 176 pixels were applied, as shown in Figure 6. The modified inception architecture consisted of 12 blocks. In the first and second blocks, two inception layers of size 3 and one max pooling layer of size 2 with 32, 64, and 128 filters, respectively; in the third and fourth blocks, two convolution layers with 32 filters; and in the fifth and sixth blocks with one convolution layer with 256 and 128 filters, respectively, were applied. These layers were followed by a dropout layer with 128 filters. The seventh and eighth layers consisted of 256 and 512 filters, respectively, followed by another dropout layer with 128 filters. Then, the flattened layer was connected with 512 filters, and the ninth, 10th, 11th, and 12th dense layers consisted of 512, 128, 64, and 32 filters, respectively. At last, the fully connected layers were implemented, and the classified output was obtained.
Figure 6
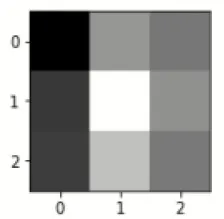
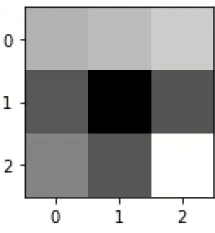
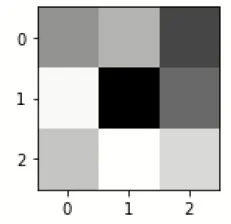
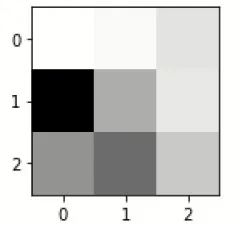
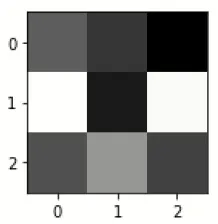
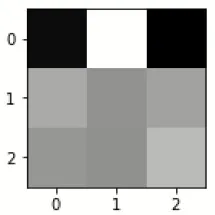
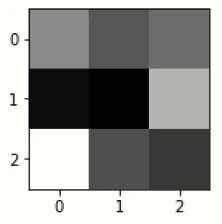
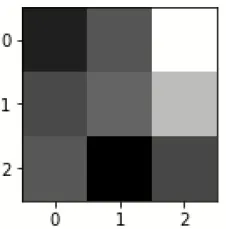
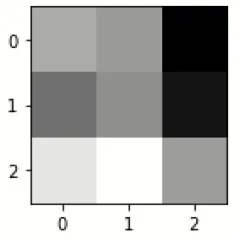
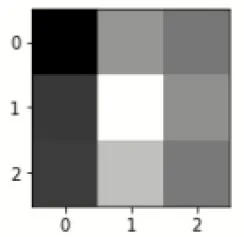
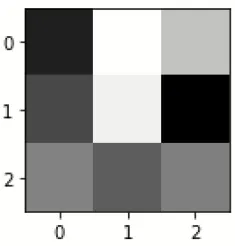
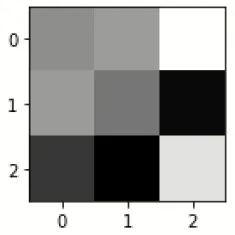
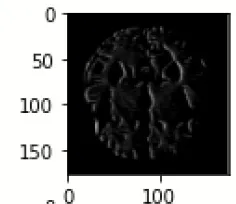
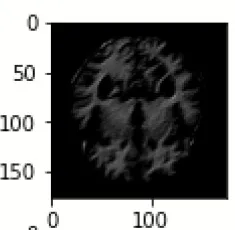
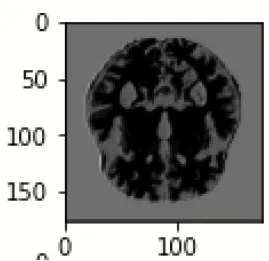
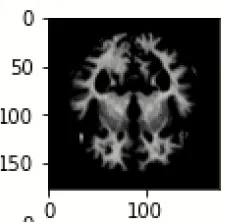
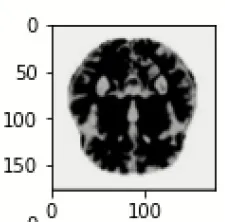
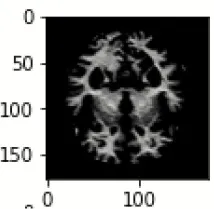
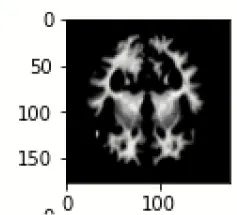
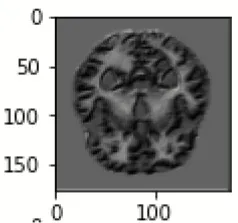
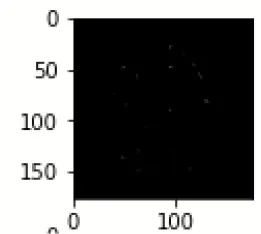
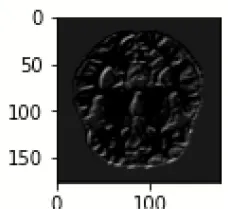
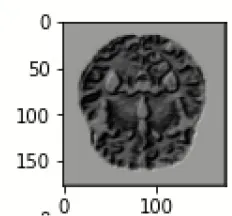
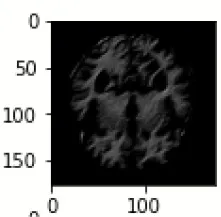
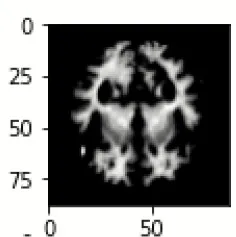
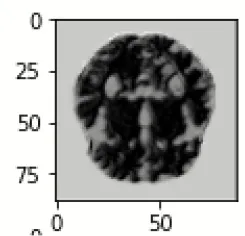
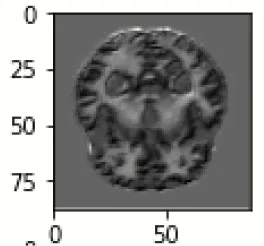
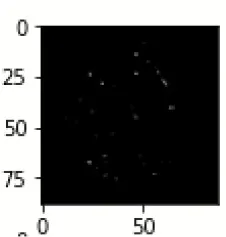
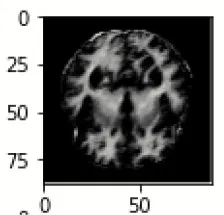
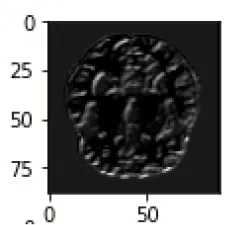
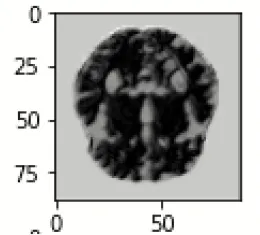
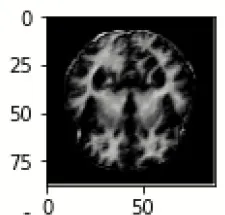
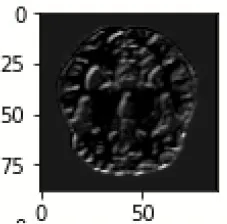
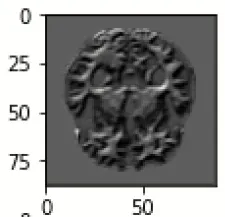
Table 4 exhibits the filter visualization image of every convolution layer. The single kernel or filter for each convolutional layer is mentioned.
Table 4
| First convolution layer | |||||
|---|---|---|---|---|---|
| inception_v3_input | inception_v3 | inception_v3_1 | max_pooling2d | sequential | sequential_1 |
 |  |  |  |  |  |
| Last convolution layer | |||||
 |  |  |  |  |  |
| Filter for first convolution layer | |||||
| sequential_2 | sequential_3 | dropout | sequential_4 | sequential_5 | dropout_1 |
 |  |  |  |  |  |
| Filter for last convolution layer | |||||
| sequential_2 | sequential_3 | dropout | sequential_4 | sequential_5 | dropout_1 |
 |  | 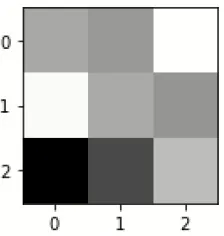 | 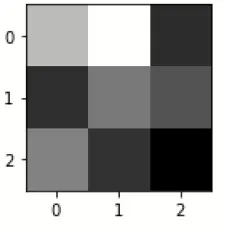 | 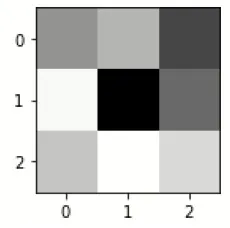 | 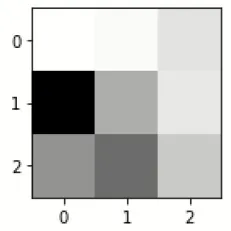 |
Filter visualization for every convolution layers.
The images are filtered with the help of kernels, as given in Table 5 as it displays the feature-visualized images of each convolutional layer (Chugh et al., 2022; Dhiman et al., 2022). It displays the first and last feature-visualized images for every convolutional layer (Sharma et al., 2022a,b).
Table 5
| Filter for first convolution layer | |||||
|---|---|---|---|---|---|
| inception_v3_input | inception_v3 | inception_v3_1 | max_pooling2d | sequential | sequential_1 |
 |  |  |  |  |  |
| Filter for last convolution layer | |||||
| inception_v3_input | inception_v3 | inception_v3_1 | max_pooling2d | sequential | sequential_1 |
 |  |  |  |  |  |
| Filter for first convolution layer | |||||
| sequential_2 | sequential_3 | dropout | sequential_4 | sequential_5 | dropout_1 |
 |  |  |  |  |  |
| Filter for last convolution layer | |||||
| sequential_2 | sequential_3 | dropout | sequential_4 | sequential_5 | dropout_1 |
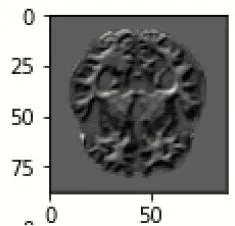 | 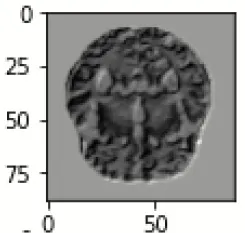 |  |  |  |  |
Images after each dense block.
Results
Various tuning parameters were applied to AD images, like optimizer, batch size (BS), and epochs, which modified neural network features and thus minimized the losses. The Adam optimizer was used in this model. BS specifies managed images in a single iteration. BS 32 was utilized in these models. A total of 1,000 epochs were used in these models. The Adam optimizer was used for training the deep learning algorithms as it includes both functionalities of AdaGrad and RMSProp optimizers. Large BS results in heavy computational processes during deep learning model training, whereas small BS results in a faster computational process. Hence, there is always a trade-off between large and small BS. The number of epochs should be more so that error can be minimized during model training; however, a large number of epochs increase the computational time. In this study, the simulation of the proposed model is carried out using 1,000 epochs. Table 8 shows the name of hypertuning parameters and their values.
Confusion matrix
Figure 7 shows the confusion matrix, which represents classification predictions. The accuracy of the entire model is 94.92%. The confusion matrix parameters are converted by classification report. These confusion matrix parameters are given as follows:
Accuracy (Acc) is the ratio of true predictions to observed predictions, as in Equation 1:
Precision (Prec) is the ratio of correct positive predictions to the total positive predictions, which can be given by Equation 2:
Specificity (Spec) is the ratio of correct negative predictions to the total negatives, which can be given by Equation 3:
Sensitivity (Sens) is the ratio of correct positive predictions to the total positives, which is given by Equation 4:
Figure 7 displays the confusion matrix for the modified inception model. The accuracy value of the proposed model is 94.92%.
Figure 7
Figure 8 exhibits the precision, sensitivity, and specificity values for all AD classes for a batch size of 32 with the Adam optimizer. In Figure 8, V.M.D exhibits a maximum precision of 100%, followed by ND, with a maximum precision of 97.51%. Also, V.M.D exhibits a sensitivity of 100%, followed by N.D, with a sensitivity of 97.97%. Furthermore, V.M.D displays a specificity of 100%, followed by N.D with a specificity of 99.16%. The average Prec, Sens, and Spec of a batch size model of 32 with Adam, Adadelta, and SGD optimizers are exhibited in Tables 6–8, respectively.
Figure 8
Table 6
| AD type | Precision | Sensitivity | Specificity | F1-score |
|---|---|---|---|---|
| N.D | 97.51 | 97.97 | 99.16 | 97 |
| V.M.D | 100 | 100 | 100 | 100 |
| M.D | 92.19 | 90.93 | 97.31 | 91 |
| Mod.D | 90 | 90.86 | 96.74 | 91 |
| Avg. precision | 94.93 | – | – | – |
| Avg. sensitivity | – | 94.94 | – | – |
| Avg. specificity | – | – | 98.3 | – |
| 94.75 |
Confusion matrix constituents of the modified inception model with the Adam optimizer.
Table 7
| AD Type | Precision | Sensitivity | Specificity |
|---|---|---|---|
| N.D | 94.23 | 96.13 | 97.52 |
| V.M.D | 100 | 100 | 100 |
| M.D | 91.7 | 88.57 | 95.21 |
| Mod.D | 84.43 | 86.61 | 92.5 |
| Avg. precision | 92.59 | – | – |
| Avg. sensitivity | – | 92.83 | – |
| Avg. specificity | – | – | 96.31 |
Confusion matrix constituents of the modified inception model with the Adadelta optimizer.
Table 8
| AD type | Precision | Sensitivity | Specificity |
|---|---|---|---|
| N.D | 97.62 | 98.6 | 99.2 |
| V.M.D | 100 | 100 | 100 |
| M.D | 94.5 | 92.27 | 98.33 |
| Mod.D | 91.7 | 92.5 | 96.2 |
| Avg. precision | 95.9 | – | – |
| Avg. sensitivity | – | 95.84 | – |
| Avg. specificity | – | – | 98.43 |
Confusion matrix constituents of the modified inception model with the SGD optimizer.
A comparison of all the optimizers is shown in Table 9, where the SGD optimizer showed better average precision, average sensitivity, and average specificity than both Adam and Adadelta optimizers.
Table 9
| Optimizers | Avg. precision | Avg. sensitivity | Avg. specificity |
|---|---|---|---|
| SGD | 95.9 | 95.84 | 98.43 |
| Adam | 94.93 | 94.94 | 98.3 |
| Adadelta | 92.59 | 92.83 | 96.31 |
Confusion matrix constituents of the modified inception model with the SGD optimizer.
Similarly, the average Prec, Sens, and Spec of a batch size of 64 in the inception model with Adam, Adadelta, and SGD optimizers are exhibited in Tables 10–12, respectively. By adding Gaussian NB to the last layer of the inception model of a batch size of 32 with the Adam optimizer, the results denote a significant increase in performance parameters, as shown in Table 13.
Table 10
| AD type | Precision | Sensitivity | Specificity |
|---|---|---|---|
| N.D | 91.6 | 92.5 | 96.3 |
| V.M.D | 100 | 100 | 100 |
| M.D | 90.11 | 88.7 | 95.17 |
| Mod.D | 85.7 | 86.2 | 92.8 |
| Avg. precision | 91.85 | – | – |
| Avg. sensitivity | – | 91.86 | – |
| Avg. specificity | – | – | 96.06 |
| Avg. F1-score | – | – | – |
Confusion matrix constituents of the modified inception model with the Adam optimizer.
Table 11
| AD type | Precision | Sensitivity | Specificity |
|---|---|---|---|
| N.D | 89.38 | 91.13 | 93.71 |
| V.M.D | 100 | 100 | 100 |
| M.D | 87.32 | 88.57 | 94.93 |
| Mod.D | 84.43 | 85.14 | 91.17 |
| Avg. precision | 90.28 | – | – |
| Avg. sensitivity | – | 91.21 | – |
| Avg. specificity | – | – | 94.95 |
Confusion matrix constituents of the modified inception model with the Adadelta optimizer.
Table 12
| AD type | Precision | Sensitivity | Specificity |
|---|---|---|---|
| N.D | 95.13 | 96.5 | 97.51 |
| V.M.D | 100 | 100 | 100 |
| M.D | 93.91 | 90.2 | 95.8 |
| Mod.D | 89.18 | 89.82 | 92.13 |
| Avg. precision | 94.55 | – | – |
| Avg. sensitivity | – | 94.13 | – |
| Avg. specificity | – | – | 96.36 |
Confusion matrix constituents of the modified inception model with the SGD optimizer.
Table 13
| AD type | Precision | Sensitivity | Specificity |
|---|---|---|---|
| N.D | 97.8 | 98.21 | 99.38 |
| V.M.D | 100 | 100 | 100 |
| M.D | 96.25 | 91.97 | 98.5 |
| Mod.D | 93.12 | 93.8 | 96.41 |
| Avg. precision | 96.79 | – | – |
| Avg. sensitivity | – | 95.9 | – |
| Avg. specificity | – | – | 98.57 |
Confusion matrix constituents of the modified inception model with the Gaussian NB classifier.
Discussion
For the training of the proposed model, the Adam optimizer was utilized. Confusion matrix parameters and training performance parameters for the model are shown in Figure 8. From Figure 9, it can be inferred that this model obtained the comparatively highest parametric values with a Prec of 94.93%, a Sens of 94.94%, a Spec of 98.3%, and a yielded Acc of 94.92%. Model accuracy was used for evaluating classification models, and model loss was used for optimizing parameter values. Figure 9A displays the graphs of training accuracy and validation accuracy for the modified inception model, from which it can be inferred that training accuracy was better than validation accuracy for all the epochs. Figure 9B shows the graphs of the training area under the curve (AUC) and validation area under the curve, from which it can be deduced that the AUC for training data was 1, whereas the AUC was <1 for validation data. Figure 9C shows the graphs of training loss and validation loss for the modified inception model, from which it can be inferred that validation loss is high only at the 800th epoch; otherwise, its value is <0.5.
Figure 9
From Table 14, it can be deduced that at the 1,000th epoch, the training Acc value is maximum at BS 32, that is, 95.11%, whereas training loss is minimum, that is, 0.3483. Furthermore, at the 1,000th epoch, the training Acc value is maximum at BS 64, that is, 93.57%, whereas training loss is minimum, that is, 0.3442.
Table 14
| Epoch | Train | Train | Validation | Val |
|---|---|---|---|---|
| value | loss | accuracy | loss | accuracy (%) |
| For batch size 32 | ||||
| 200 | 0.0182 | 0.9964 | 0.2894 | 0.9413 |
| 400 | 0.0111 | 0.9969 | 0.3890 | 0.9482 |
| 600 | 0.0067 | 0.9987 | 0.3421 | 0.9502 |
| 800 | 0.0022 | 0.9996 | 0.7948 | 0.9419 |
| 1,000 | 0.0017 | 0.9998 | 0.3483 | 0.9517 |
| For batch size 64 | ||||
| 200 | 0.0212 | 0.9836 | 0.3577 | 0.9223 |
| 400 | 0.0152 | 0.9897 | 0.3463 | 0.9267 |
| 600 | 0.0082 | 0.9923 | 0.3861 | 0.9109 |
| 800 | 0.0065 | 0.9946 | 0.3458 | 0.9291 |
| 1,000 | 0.0023 | 0.9971 | 0.3442 | 0.9357 |
Training performance of the modified inception model with the Adam optimizer.
Performance evaluation with previous implementations
Results obtained from the model are displayed in Table 10 which shows that the model achieved better parametric values than previous models due to several pre-processing methods. However, some studies have utilized comparatively larger image datasets to validate their models (Hon and Khan, 2017; Talo et al., 2019; Feng et al., 2020; Nakagawa et al., 2020; Rallabandi et al., 2020). Furthermore, Bin.C was achieved in most studies; previous studies have also performed tertiary or multiclass classification (Talo et al., 2019; Feng et al., 2020; Nakagawa et al., 2020). Table 15 displays the comparison between the proposed and existing models.
Table 15
| Authors | Database | Images | Techniques | Weighted Acc |
|---|---|---|---|---|
| Rallabandi et al. (2020) | ADNI | 1,167 | SVM with D.L | 75% |
| Feng et al. (2020) | ADNI | 3,127 | 2D-CNN with D.L | 82.57% |
| Nakagawa et al. (2020) | ADNI | 2,142 | Cox model with D.L | 92% |
| Ebrahimi-Ghahnavieh et al. (2019) | ADNI | 177 | DenseNet-201 ResNet50 | 84.38% 81.25% |
| Talo et al. (2019) | Harvard Medical School | 1,074 | VGG16 | 92.49% |
| Islam and Zhang (2018) | OASIS | 416 | ResNet50 | 93.18% |
| Aderghal et al. (2018) | OASIS | 416 | Cross-Modal Transfer Learning | 83.57% |
| Hon and Khan (2017) | Kaggle | 6,400 | VGG16 | 92.3% |
| Jha et al. (2017) | OASIS | 416 | DTCWT and PCA with FNN | 90.06% |
| Ali et al. (2016) | OASIS | 416 | VGG16 | 92.3 |
| Kang et al. (2021) | ADNI | 798 | 2D-CNN, VGG16 | 90.36% |
| Li et al. (2021) | ADNI | 1,167 | SVM, CNN | 69.37% |
| Venugopalan et al. (2021) | ADNI | 1,311 | SVM, k-NN, CNN | 75% |
| Proposed methodology | Kaggle | 6,400 | Transfer Learning Based Modified inception Model | 94.92% |
Comparison with previous implementations.
Conclusion
In this study, the effectiveness of the proposed model for the discovery of announcements has been completely estimated. The dataset for the announcement was acquired from Kaggle by one of the authors (Sarvesh Dubey). The results were attained after the training and analysis of these models. Furthermore, by duly working the optimizer and images, these results demonstrated the effectiveness of the proposed models. Acc and Sens of 94.92 and 94.94 independently were achieved with the proposed model with the Adam optimizer. The study models performed better in both training and testing, with similar results.
A possible limitation would be to guarantee reproducibility; however, this issue could be solved by using a large brain MRI dataset. A transfer learning-based approach places the convolution information into machine learning parts and the AD images into deep learning parts before adding both the results of the processes. This study helps for a more accurate opinion for the development of D.L model. Different transfer learning-based models and optimization processes would also be employed to further enhance the effectiveness of the proposed model. Medical image analysis is one of the grueling tasks with useful computational methods on the scale of imaging operations.
Funding
This work was supported by the National Research Foundation of Korea through a grant funded by the Korean government (Ministry of Science and ICT)-NRF-2020R1A2B5B02002478.
Publisher's note
All claims expressed in this article are solely those of the authors and do not necessarily represent those of their affiliated organizations, or those of the publisher, the editors and the reviewers. Any product that may be evaluated in this article, or claim that may be made by its manufacturer, is not guaranteed or endorsed by the publisher.
Statements
Data availability statement
The raw data supporting the conclusions of this article will be made available by the authors, without undue reservation.
Author contributions
SS, SG, DG, and SJ contributed to conception and design of the study. AM organized the database and performed the statistical analysis. SE–S wrote the first draft of the manuscript. K-SK wrote sections of the manuscript. All authors contributed to manuscript revision, read, and approved the submitted version.
Conflict of interest
The authors declare that the research was conducted in the absence of any commercial or financial relationships that could be construed as a potential conflict of interest.
References
1
AderghalK.KhvostikovA.KrylovA.Benois-PineauJ.AfdelK.CathelineG.et al. (2018). Classification of Alzheimer disease on imaging modalities with deep CNNs using cross-modal transfer learning, in In 2018 IEEE 31st international symposium on computer-based medical systems (CBMS), Vol. 1 (Bordeaux: IEEE), 345–350. 10.1109/CBMS.2018.00067
2
AliE. M.SeddikA. F.HaggagM. H. (2016). Automatic detection and classification of Alzheimer's disease from MRI using TANNN. Int. J. Comput. Appl.148, 30–34. 10.5120/ijca2016911320
3
ChughH.GuptaS.GargM.GuptaD.JunejaS.TurabiehH.et al. (2022). Image retrieval using different distance methods and color difference histogram descriptor for human healthcare. J. Healthc. Eng.2022, 9523009. 10.1155/2022/9523009
4
DhankharA.JunejaS.JunejaA.BaliV. (2021). Kernel parameter tuning to tweak the performance of classifiers for identification of heart diseases. Int. J. E-Health Med. Commun.12, 1–16. 10.4018/IJEHMC.20210701.oa1
5
DhimanG.JunejaS.ViriyasitavatW.MohafezH.HadizadehM.IslamM. A.et al. (2022). A novel machine-learning-based hybrid CNN model for tumor identification in medical image processing. Sustainability14, 1447. 10.3390/su14031447
6
Ebrahimi-GhahnaviehA.LuoS.ChiongR. (2019). Transfer learning for Alzheimer's disease detection on MRI images, in In 2019 IEEE International Conference on Industry 4.0. Artificial Intelligence, and Communications Technology (IAICT) Vol. 1 (Bali: IEEE), 133–138. 10.1109/ICIAICT.2019.8784845
7
FanY.ResnickS. M.WuX.DavatzikosC. (2008). Structural and functional biomarkers of prodromal Alzheimer's disease: a high-dimensional pattern classification study. Neuroimage41, 277–285. 10.1016/j.neuroimage.2008.02.043
8
FengW.Halm-LutterodtN. V.TangH.MecumA.MesregahM. K.MaY.et al. (2020). Automated MRI-based deep learning model for detection of Alzheimer's disease process. Int. J. Neural Syst. 30, 2050032. 10.1142/S012906572050032X
9
FilipovychR.DavatzikosC.Alzheimer's Disease Neuroimaging Initiative. (2011). Semi-supervised pattern classification of medical images: application to mild cognitive impairment (MCI). Neuroimage. 55, 1109–1119. 10.1016/j.neuroimage.2010.12.066
10
HonM.KhanN. M. (2017). November. Towards Alzheimer's disease classification through transfer learning, in 2017 IEEE International conference on bioinformatics and biomedicine (BIBM) Vol. 1 (Kansas City, MO: IEEE), 1166–1169. 10.1109/BIBM.2017.8217822
11
IslamJ.ZhangY. (2018). Brain MRI analysis for Alzheimer's disease diagnosis using an ensemble system of deep convolutional neural networks. Brain Inform. 5, 1–14. 10.1186/s40708-018-0080-3
12
JhaD.KimJ. I.KwonG.-R. (2017). Diagnosis of Alzheimer's disease using dual-tree complex wavelet transform, PCA, and feed-forward neural network. J. Healthc. Eng. 21, 9060124. 10.1155/2017/9060124
13
JunejaA.JunejaS.KaurS.KumarV. (2021). Predicting diabetes mellitus with machine learning techniques using multi-criteria decision making. Int. J. Inf. Retr. Res.11, 38–52. 10.4018/IJIRR.2021040103
14
JunejaS.JunejaA.DhimanG.JainS.DhankharA.KautishS.et al. (2021). Computer vision-enabled character recognition of hand gestures for patients with hearing and speaking disability. Mob. Inf. Syst.2021, 4912486. 10.1155/2021/4912486
15
KangW.LinL.ZhangB.ShenX.WuS.et al. (2021). Multi-model and multi-slice ensemble learning architecture based on 2D convolutional neural networks for Alzheimer's disease diagnosis. Comput. Biol. Med. 36, 104678. 10.1016/j.compbiomed.2021.104678
16
LiY.FangY.WangJ.ZhangH.HuB. (2021). Biomarker extraction based on subspace learning for the prediction of mild cognitive impairment conversion. Biomed Res. Int. 1, 1940–1952. 10.1155/2021/5531940
17
MisraC.FanY.DavatzikosC. (2009). Baseline and longitudinal patterns of brain atrophy in MCI patients, and their use in prediction of short-term conversion to AD: results from ADNI. Neuroimage. 44, 1415–1422. 10.1016/j.neuroimage.2008.10.031
18
MoradiE.PepeA.GaserC.HuttunenH.TohkaJ.Alzheimer's Disease Neuroimaging Initiative. (2015). Machine learning framework for early MRI-based Alzheimer's conversion prediction in MCI subjects. Neuroimage. 104, 398–412. 10.1016/j.neuroimage.2014.10.002
19
NakagawaT.IshidaM.NaitoJ.NagaiA.YamaguchiS.OnodaK.et al. (2020). Prediction of conversion to Alzheimer's disease using deep survival analysis of MRI images. Brain Commun. 2, fcaa057. 10.1093/braincomms/fcaa057
20
RallabandiV. S.TulpuleK.GattuforM.The Alzheimer's Disease Neuroimaging Initiative. (2020). Automatic classification of cognitively normal, mild cognitive impairment and Alzheimer's disease using structural MRI analysis. Inform. Med. Unlocked18, 100305. 10.1016/j.imu.2020.100305
21
RashidJ.BatoolS.KimJ.Wasif NisarM.HussainA.JunejaS.et al. (2022). An augmented artificial intelligence approach for chronic diseases prediction. Front. Public Health10, 860396. 10.3389/fpubh.2022.860396
22
RathoreS.HabesM.IftikharM. A.ShacklettA.DavatzikosC. (2017). A review on neuroimaging-based classification studies and associated feature extraction methods for Alzheimer's disease and its prodromal stages. Neuroimage. 155, 530–548. 10.1016/j.neuroimage.2017.03.057
23
SarrafS.TofighiG. (2016). DeepAD: Alzheimer's disease classification via deep convolutional neural networks using MRI and fMRI. bioRxiv. [preprint]. 10.1101/070441
24
SerraL.CercignaniM.MastropasquaC.TorsoM.SpanòB.MakovacEet al. (2016). Longitudinal changes in functional brain connectivity predicts conversion to Alzheimer's disease. J. Alzheimers Dis. 51, 377–389. 10.3233/JAD-150961
25
SharmaS.GuptaS.GuptaD.JunejaS.GuptaP.DhimanG.et al. (2022a). Deep learning model for the automatic classification of white blood cells. Comput. Intell. Neurosci. 2022, 7384131. 10.1155/2022/7384131
26
SharmaS.GuptaS.GuptaD.JunejaS.SingalG.DhimanG.et al. (2022b). Recognition of Gurmukhi Handwritten City names using deep learning and cloud computing. Sci. Program.2022, 5945117. 10.1155/2022/5945117
27
SharmaS.GuptaS.GuptaD.JunejaS.TurabiehH.SharmaL.et al. (2022c). Optimized CNN-based recognition of district names of Punjab state in Gurmukhi script. J. Math.2022, 1–10. 10.1155/2022/6580839
28
TaloM.YildirimO.BalogluU. B.AydinG.AcharyaU. R. (2019). Convolutional neural networks for multi-class brain disease detection using MRI images. Comput. Med. Imaging Graph. 78, 101673. 10.1016/j.compmedimag.2019.101673
29
VenugopalanJ.TongL.HassanzadehH. R.WangM. D. (2021). Multimodal deep learning models for early detection of Alzheimer's disease stage. Sci. Rep. 11, 3254. 10.1038/s41598-020-74399-w
30
ZhaoY.RaichleM. E.WenJ.BenzingerT. L.FaganA. M.HassenstabJ.et al. (2017). In vivo detection of microstructural correlates of brain pathology in preclinical and early Alzheimer Disease with magnetic resonance imaging. Neuroimage148, 296–304. 10.1016/j.neuroimage.2016.12.026
Summary
Keywords
feature visualization, modified inception, classification, confusion matrix, Alzheimer's disease
Citation
Sharma S, Gupta S, Gupta D, Juneja S, Mahmoud A, El–Sappagh S and Kwak K-S (2022) Transfer learning-based modified inception model for the diagnosis of Alzheimer's disease. Front. Comput. Neurosci. 16:1000435. doi: 10.3389/fncom.2022.1000435
Received
22 July 2022
Accepted
29 August 2022
Published
01 November 2022
Volume
16 - 2022
Edited by
Gaurav Dhiman, Government Bikram College of Commerce Patiala, India
Reviewed by
Asadullah Shaikh, Najran University, Saudi Arabia; Vandana Khanna, The Northcap University, India
Updates
Copyright
© 2022 Sharma, Gupta, Gupta, Juneja, Mahmoud, El–Sappagh and Kwak.
This is an open-access article distributed under the terms of the Creative Commons Attribution License (CC BY). The use, distribution or reproduction in other forums is permitted, provided the original author(s) and the copyright owner(s) are credited and that the original publication in this journal is cited, in accordance with accepted academic practice. No use, distribution or reproduction is permitted which does not comply with these terms.
*Correspondence: Kyung-Sup Kwak kskwak@inha.ac.kr
Disclaimer
All claims expressed in this article are solely those of the authors and do not necessarily represent those of their affiliated organizations, or those of the publisher, the editors and the reviewers. Any product that may be evaluated in this article or claim that may be made by its manufacturer is not guaranteed or endorsed by the publisher.