- 1School of Electronic and Information Engineering, Nanjing University of Information Science and Technology, Nanjing, China
- 2The Key Laboratory of Child Development and Learning Science of Ministry of Education, Southeast University, Southeast University, Nanjing, China
Objectve: Emotional brain-computer interface can recognize or regulate human emotions for workload detection and auxiliary diagnosis of mental illness. However, the existing EEG emotion recognition is carried out step by step in feature engineering and classification, resulting in high engineering complexity and limiting practical applications in traditional EEG emotion recognition tasks. We propose an end-to-end neural network, i.e., E2ENNet.
Methods: Baseline removal and sliding window slice used for preprocessing of the raw EEG signal, convolution blocks extracted features, LSTM network obtained the correlations of features, and the softmax function classified emotions.
Results: Extensive experiments in subject-dependent experimental protocol are conducted to evaluate the performance of the proposed E2ENNet, achieves state-of-the-art accuracy on three public datasets, i.e., 96.28% of 2-category experiment on DEAP dataset, 98.1% of 2-category experiment on DREAMER dataset, and 41.73% of 7-category experiment on MPED dataset.
Conclusion: Experimental results show that E2ENNet can directly extract more discriminative features from raw EEG signals.
Significance: This study provides a methodology for implementing a plug-and-play emotional brain-computer interface system.
1. Introduction
Emotion is the basis of daily human life and plays an essential role in human cognitive functions, rational decisions, and interpersonal communications (Waldron, 1994; Picard et al., 2001; Martinovski and Mao, 2009). It is extremely important to identify emotions accurately especially in the field of brain-computer interaction (Cowie et al., 2002; Jin et al., 2020, 2021). Automatic emotion recognition technology is introduced to human-computer interaction, which can remarkably improve the quality of user experience and enhance the interactions between computer and humanity (Stamos and Naeem, 2017).
There are two reflections of emotion including external and internal reactions: external reactions include human facial expressions, gestures, or speeches; internal reactions include skin electrical responses, heart rate, blood pressure, respiratory rate, electroencephalogram (EEG), electroencephalography (EOG) (Yu et al., 2019), magnetoencephalogram (MEG) (Christian et al., 2014). From the perspective of neuroscience (Lotfi and Akbarzadeh-T., 2014), the main areas of the cerebral cortex are closely related to human emotions (Britton et al., 2006; Etkin et al., 2011; Lindquist and Barrett, 2012), which inspires us to record the neural activities of the brains by putting EEG electrodes on the scalp to collect EEG signals to recognize human emotions.
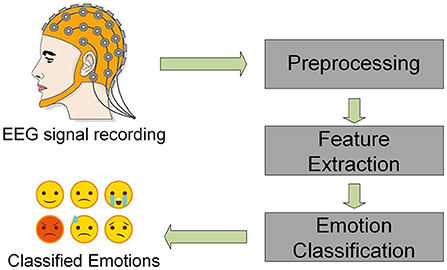
EEG signal contains emotional information, which has been widely used in the field of emotion recognition in recent years (Soroush et al., 2017; Sulthan et al., 2018; Alarcao and Fonseca, 2019). In traditional EEG emotion recogniton process, feature extraction is a vital procedure. As shown in Figure 1, after preprocessing the EEG signals, usually it is necessary to extract features from raw EEG signals, then input them into the network for classification and recognition (Duan et al., 2013; Chen et al., 2021; Ma et al., 2021). Duan et al. (2013) proposed the differential entropy (DE) feature of five frequency bands and obtained satisfactory classification results using DE features. Li et al. (2019) used short-time Fourier transform to extract time-frequency features, calculated the power spectral density (PSD) features in theta, alpha, beta, and gamma bands, and used LSTM to discriminate emotions, which achieved significant classification results. Ma et al. (2021) proposed a Beetle Antenna Search (BAS) algorithm that extracted three different features in three different bands and six channels and an SVM classifier was applied for classification. Compared with traditional SVM methods, the classification accuracy of the BAS-SVM method has gained a 12.89% enhancement. In recent years, deep learning methods are widely used in emotion recogniton (Jia et al., 2020a; Li et al., 2020; Zhou et al., 2021). Song et al. (2018) designed DE features based on electrode positions and used graph convolutional neural network (GCNN) as a classifier. Zhang et al. (2019) innovatively combined DE features extracted from the EEG dataset with the features extracted from the facial expression dataset and constructed a spatial-temporal recurrent neural network (STRNN) for emotion recognition. Li et al. (2018) proposed a bi-hemisphere domain adversarial neural network (BiDANN), which used DE as the input feature and conducted both subject-dependent and subject-independent experiments on the SEED dataset, achieving relatively state-of-the-art performance. Hao et al. (2021) proposed a lightweight convolutional neural network that extracts PSD features as input and conducted experiments on the DEAP dataset, which attained 82.33 and 75.46% for Valance and Arousal, respectively. Chen et al. (2021) proposed an integrated capsule convolution neural network (CapsNet), which used Wavelet packet transform (WPT) for feature extraction. The average accuracy of the two-category and four-category experiments on DEAP has reached 95.11 and 92.43%, respectively.
On the other hand, many deep learning methods need not to extract features manually while run end-to-end. Alhagry et al. (2017) proposed an end-to-end deep learning neural network to identify emotions from original EEG signals. This network used LSTM-RNN to learn features from EEG signals and a softmax classifier used for emotion recognition. However, they ignored the vital factor of the spatial relationship between electrodes. Yang et al. (2018) proposed a parallel convolution recurrent neural network to extract spatial features of EEG signals, which achieved acceptable results in emotion recognition tasks but ignored the point of temporal correlations. During the procedure, it may also lose some features that contain fruitful emotional information. It is still a worthy topic that how to design a practical deep learning framework to recognize and classify emotions from the original EEG signals directly. EEGNet (Lawhern et al., 2016) is a compact convolutional neural network suitable for EEG signals. Our study introduced extracting EEG features and classifying emotions by using depthwise separable convolution. Due to the solid internal relationship between different channels of EEG signal and the time correlations. Inspired by Lawhern et al. (2016), we proposed an end-to-end neural network (E2ENNet) for EEG emotion, which concatenates EEGNet and LSTM (Long-Short Term Memory). We use depthwise separable convolution to extract features from multi-channel original EEG signals, LSTM for searching the correlations between those features. Finally, a softmax classifier is applied to output the classification results.
We evaluated the proposed model on three public datasets, i.e., DEAP (Koelstra, 2012), DREAMER (Stamos and Naeem, 2017), and MPED (Song et al., 2019), achieveing state-of-the-art accuracy among existing methods. The main contributions of this paper are as follows:
• We proposed E2ENNet for EEG emotion recognition. This network combined EEGNet and LSTM, which simultaneously considerd the spatial information and the time correlations in EEG signals. At the same time, it avoided the complicated manual feature extraction and made full use of all information in raw EEG signals, which realized end-to-end EEG emotion recognition.
• We conducted extensive subject-dependent experiments on three public datasets: DEAP, DREAMER, MPED. The average accuracy of two-category classification is 96.25% (Valance) and 96.16% (Arousal) on the DEAP dataset; the average accuracy of two-category classification is 97.84% (Valance), 98.31% (Arousal), and 98.64% (Dominance) on the DREAMER dataset; it also achieved an average accuracy of 41.73% for the seven-category on the MPED dataset. Experimental results demonstrate that the proposed method has achived state-of-the-art performance on emotion recognition among other deep learning methods.
The remainder of this paper is organized as follows. Section 2 presents the proposed method, E2ENNet. Section 3 discusses extensive experiments on three different public datasets. Finally, a conclusion is given in Section 4.
2. Proposed method
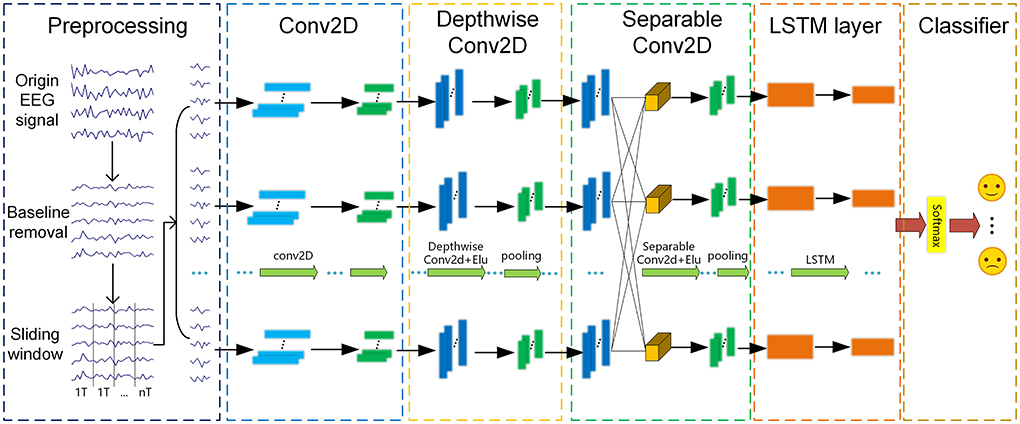
This section mainly introduces our proposed end-to-end method, i.e., E2ENNet, including preprocessing, Conv2D, DepthwiseConv2D, Separable Conv2D (Howard et al., 2017), LSTM layer and classifier as shown in Figure 2. Spatial and temporal pieces of information are extracted as emotion features for EEG emotion recognition. Firstly, we removed the baseline and used a sliding window to divide the signal into segments with a duration of 1s. Then, these segments are sequentially fed to Conv2D, DepthwiseConv2D, SeparableConv2D, LSTM layer in order to extract spatial and temporal features. Finally, a softmax function is used to classify the extracted features. The ultimate result of the experiment has a remarkable increase due to the end-to-end neural network.
2.1. Preprocessing
There are two parts of preprocessing, i.e., baseline removal and sliding window slicing. Generally, EEG signals obtained by video evoked material stimulation include baseline signals and test signals (Koelstra, 2012; Stamos and Naeem, 2017). Yang et al. (2018) mentioned that baseline removal can improve the recognition accuracy of EEG signals on the DEAP dataset.
For every single trial, let represents the collected EEG signal with sampling frequency of H Hz and duration of T1 s. M is the number of EEG electrodes, N is the collected sample points. Let represents the baseline signals with duration of T2 s and L sample points. ci(i = 1, 2, …, T2) represents the baseline signal in the i-th second. Therefore, the average value of baseline signal per second can be expressed as:
where represents the average value of the baseline signal per second.
Let represents the test signal, duration is T3 s, J represents the number of sample points. For removing the baseline in the test signal, divide it into several non overlapping slices cj(j = 1, 2, …, T3) with a 1-s time window. Therefore, the baseline removed signal per second can be expressed as:
Finally, put these baseline removed slice signals into a new matrix .
Furthermore, in order to increase the number of samples of EEG experiment data. An EEG test signal is usually transmitted by sliding window technology into several non overlapping samples s = s1, s2, …, sn. Where si(i = 1, 2, …, n) represents the i-th sample, T represents the sample point of each sliding window. In this paper we use 1-s time window to silice the EEG signals, i.e., T = H.
2.2. The framework of E2ENNet
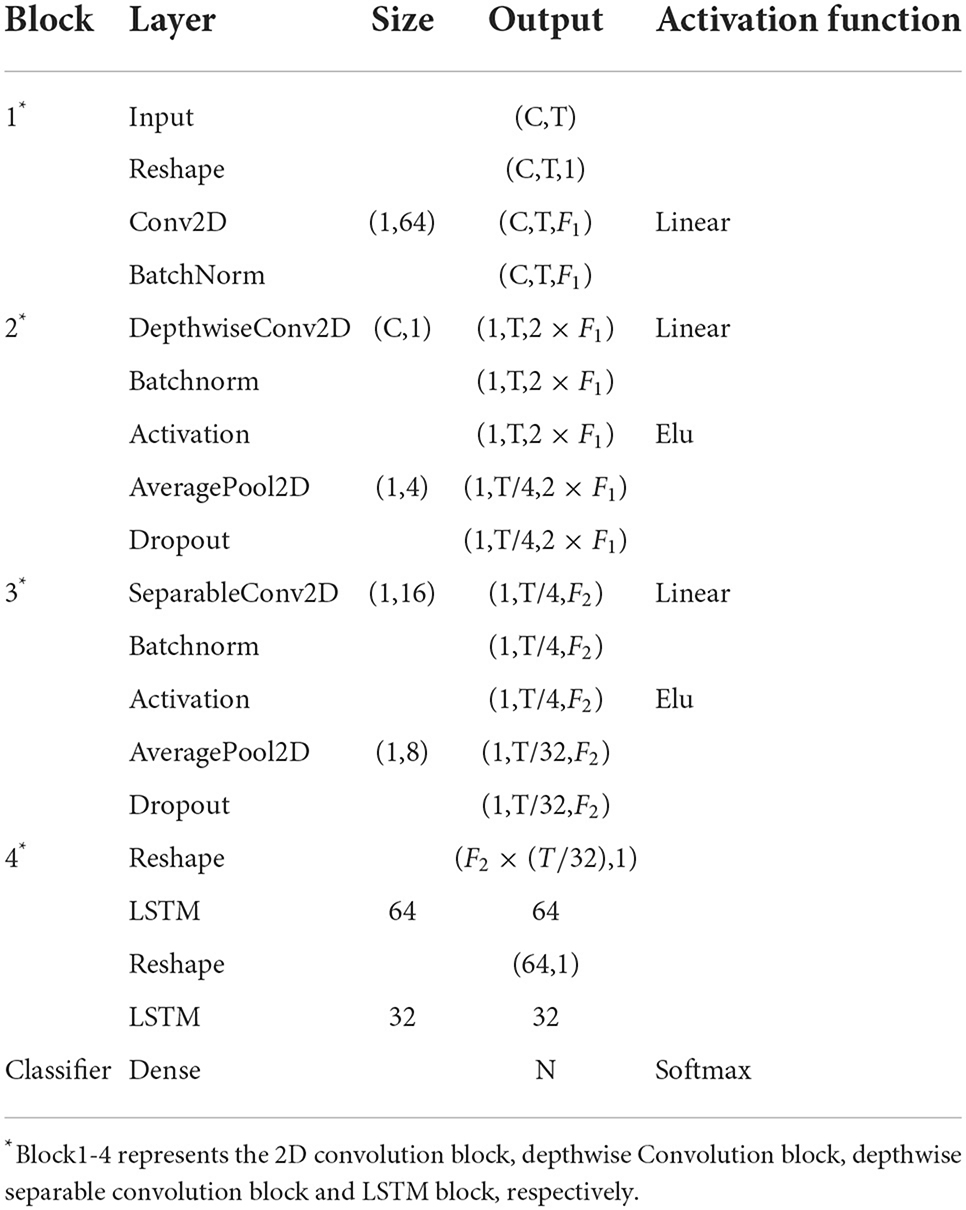
In this paper, the preprocessed EEG signals do not need to extract features manually and can directly become the input of the E2ENNet model for emotion recognition. E2ENNet is formated by four blocks, i.e., a 2D convolution block, a depthwise convolution block, a depthwise separable convolution block and a LSTM block. EEG features can be extracted effectively from the original EEG signals through the convolution blocks. The E2ENNet we proposed adds an LSTM module behind the convolution blocks, composed of two Reshape layers and two LSTM layers. It can make up for the lack of exploring the channel-wise correlations of EEG signals. Finally, a fully connected layer is applied to combine those features and input them into a softmax classifier for emotion classification. Table 1 shows the detailed parameters of the E2ENNet module, where C represents the channels of EEG, T is the number of the sample point, F1 is the number of depthwise convolution kernels, F2 is the number of pointwise convolution kernels, N is the number of categories of classification.
E2ENNet is a lightweight convolution neural network. The core idea is to use depthwise separable convolution to extract EEG features and LSTM to search for the relationship between those features. Depthwise separable convolution divides a standard convolution operation into two steps: depthwise convolution and pointwise convolution. For depthwise convolution, the number of convolution kernels is the same as the number of input feature maps. Each kernel is convoluted separately corresponding to a channel, that is, the same number of feature maps as the input feature maps are generated. However, this operation completes after each channel of the input layer is convolved independently, but the information of different feature maps in the same space can not be made full use of. Therefore, the pointwise convolution is introduced, which combines these different feature maps to generate a new feature map. The pointwise convolution operation is very similar to the conventional convolution. Except that the size of the convolution kernel is 1 × 1 × M, M is the number of feature maps of the previous layer. It combines the results of depthwise convolution to generate a brand new feature map. The number of convolution kernels is equal to the number of feature maps. Depthwise separable convolution greatly reduces the amount of calculation and model depth of the neural network. However, its classification accuracy is not lower than the traditional CNN model (Tan and Le, 2019).
In the standard convolution layer, it is assumed that for feature map F, the format of input EEG signal is Sf × Sf × M, the standard convolution of the convolution kernel K is Sk × Sk × M × N. The format of output feature map G is Sg × Sg × N. The operation of standard convolution is shown as Equation (3):
Assuming that the number of input channels is M and the number of output channels is N, the calculation amount of standard convolution is: Sk × Sk × M × N × Sf × Sf. A standard covolution Sk × Sk × M × N can be decomposed into two steps: depthwise convolution and pointwise convolution. These two steps add up to form a full depthwise separable convolution. The function of depthwise convolution is filtering, in which the format is Sk × Sk × 1 × M, and the output format is Sg × Sg × M. The function of pointwise convolution is channel combination, the format is 1 × 1 × M × N, and the output format is Sg × Sg × N. A complete depthwise separable convolution is expressed as Equation (4):
Where is the kernel of depthwise convolution, the size is Sk × Sk × M. Apply the m-th kernel of to the m-th channel of F. We can get the m-th channel of filtered feature map . The number of input channels is M, the amount of calculation of depthwise convolution is Sk × Sk × M × Sf × Sf. The amount of calculation of a complete depthwise separable convolution is Sk × Sk × M × Sf × Sf + M × N × Sf × Sf. It is as the calculation of standard convolution.
In E2ENNet, as the network deepens, the amount of parameters also grows exponentially. The sensitivity of divergent information to the non-normalized network decreases. Therefore, we use batch normalization (Liu et al., 2018) to normalize the output. The normalization function is defined as follows:
Where E(Xi) is the average value of neuron Xi in each batch of training data, and the denominator is the standard deviation of neuron Xi' activation in each batch of training data. The features are reconstructed to avoid affecting the feature distribution learned by this layer of the network:
In E2ENNet, the batch normalization technique is used to normalize the features learned in the convolution blocks to get a (0,1) normal distribution.
To further figure out the relationship between multi-channels of time-series, LSTM network (Hochreiter and Schmidhuber, 1997) is introduced in this paper. LSTM plays a critical role in processing time-series signals to selectively learn information about them. It is also widely used in the field of EEG emotion recognition (Alhagry et al., 2017; Zhang et al., 2019). In the traditional neural network methods, the inputs are independent, so they ignore sequence information. RNN (Jain et al., 2016) is very effective for data with sequence characteristics, it can mine time series information in the data (Wang et al., 2016). Long short-term memory is a special kind of RNN that can solve the problem of vanishing gradients and easily learn long-term dependent information. Therefore, we use the normalized features fBN = BN(Xi) as the input of LSTM. Let it, gt, ct, ot be the input gate, forget gate, cell activation, and output gate of LSTM, respectively. The calculation process is expressed as the following equation:
Where σ represents the sigmoid function, ht represents the hidden vector of LSTM cell unit, Wxi, Whi, Wci, Wxg, Whg, Wcg, Wxc, Whc, Wxo, Who and Wco are parameters of the model. Finally, as the last part of E2ENNet, the softmax layer is used as the classifier. Use the output H = [h1, h2, …, hn] of LSTM as the input of softmax to recognize emotions, as following equation:
Where P = P1, P2, …, Pn,Pi(i = 1, 2, …, n) represents the prediction probability of the i-th EEG sample. ω and b are the wight term and offset term. Finally, calculate the cross-entropy error of all data that has already been labeled.
Where is the label of the i-th EEG sample. When the cross-entropy loss decreases, the accuracy of emotion recognition increases.
3. Experiments and results
3.1. Introduction of datasets
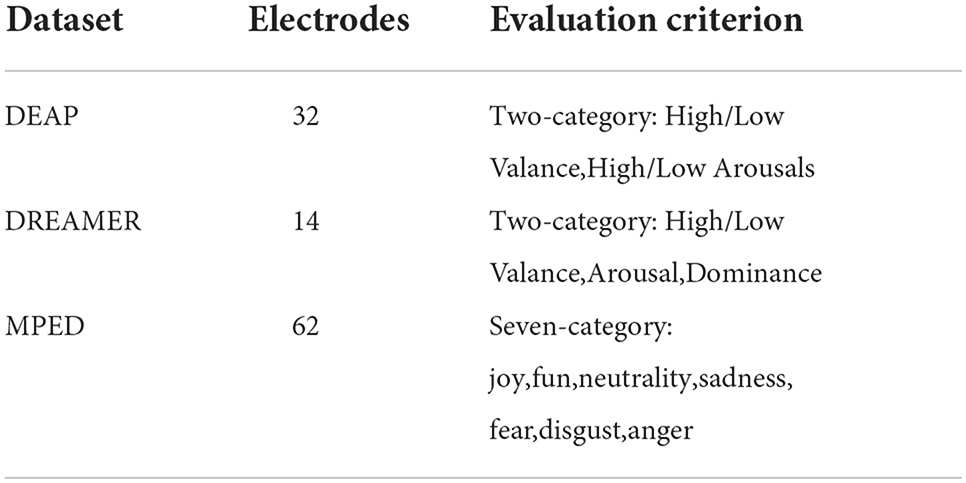
The E2ENNet model we proposed has been tested on three public datasets: DEAP, DREAMER, and MPED. As shown in Table 2. Here are details of three datasets below:
• DEAP: DEAP dataset is a multimodal emotion dataset containing a variety of physiological signals, which was proposed by the research team of Queen Mary University in London. The dataset contains 40 music videos watched by 32 subjects. EEG and other physiological signals were recorded. In this experiment, the sampling frequency of EEG signals is reduced to 128 Hz, and the EOG artifact is removed by blind source separation technology. After pretreatment of each experiment, the EEG data includes 60 s of test data and 3 s of baseline data. Subjects were asked to record and evaluate each video with a value of 1–9 in Valance, Arousal, Dominance, and liking. We selected Valance and Arousal in the two-category experiment as the evaluation criteria. The threshold was set to 5, which was divided into High/Low Valance and High/Low Arousal.
• DREAMER: DREAMER dataset is a multimodal dataset collected by the research team of the University of Western Scotland, including EEG and ECG signals. Twenty-three subjects watched 18 videos and were asked to record the Valance, Arousal, and Dominance after each stimulus. EEG signals were recorded using Emotiv EPOC equipment with a sampling frequency of 128 Hz. The length of the video is 65–393 s. All EEG data were edited to 61 s in this experiment, including 60 s of test data and 1 s baseline data. Besides, most artifacts (eye electricity, eye movement, heartbeat interference, etc.) have been removed by the FIRS filter. We selected Valance, Arousal, and Dominance as the evaluation criteria. The label range is 1–5, and 3 was chosen as the threshold, which is divided into High/Low Valance, Arousal, and Dominance.
• MPED: MPED dataset is a large open-source emotional dataset collected by the Wenming Zheng team of Southeast University, China, which contains four physical signals: EEG, skin electricity, respiratory, and ECG data. The dataset contains 28 Chinese videos watched by 23 subjects. The video includes joy, fun, neutrality, sadness, fear, disgust, and anger. There are seven types of emotions, each type of emotion has four video clips. The acquisition equipment is an ESI Neuroscan with 62 electrodes and a sampling frequency of 1,000 Hz. The data we use in this experiment has already removed noise interference, downsampled to 128 Hz, and only contains the data of EEG signal. The EEG data is clipped to 120 s and does not contain a baseline signal.
3.2. Experiment environment and settings
E2ENNet model and preprocessing are implemented based on Python3.8 under the Keras framework. The experimental environment is Inter(R)Core(TM)i5-10400CPU@2.90Hz, 16GB memory, NVIDIA Geforce GTX1060 6G graphics, 64 bit Windows 10 system. All experiments on the database are subject-dependent experiments, i.e., the train set an test set come from one subject. The number of EEG channels C is set to 32, 14, and 62 for DEAP, DREAMER, and MPED datasets, respectively. For the number of samples, points T are all set to 128 according to the sampling frequency. F1 and F2 are set to 8 and 16, respectively. For the number of categories N, DEAP and DREAMER two-category experiments are set to 2, and MPED seven-category experiments are set to 7. Adam optimizer is used to optimize the training process. The learning rate is 0.005, the batch size is 16, and the number of iterations is 200.
3.3. Experiments on three public datasets
3.3.1. Experiments on DEAP dataset
The format of original data is 40 × 32 × 8064, 40 represents 40 trials, 32 represents 32 electrodes used in EEG, duration of each video T1 = 63s, sampling frequency is 128Hz, baseline signal T2 = 3s. Set the average value of baseline signal for the first 3 s as . Then subtract the average value of baseline signal per second from the test signal for the last 60 s T3. The baseline removed slice signal is obtained as experimental data. Moreover, use 1 s non overlapping window to slice the experimental data. Sixty segments were obtained in each trail. We do all experiments under the subject-dependent experimental protocol. Each subject gets 60 × 40 = 2,400 samples, the format of each sample is 32 × 128. We divide the data of 40 trials into the training set and testing set according to the ratio of 4:1, i.e., 32 trials are used as the training set, and 8 trials are used as the testing set. 8 trials of the training set are randomly selected as the validation set. The segmentation is performed five times until every single trial has been trained and tested.A 5-fold cross-validation dataset is constructed, take the average accuracy of five experiments as the final experimental result.
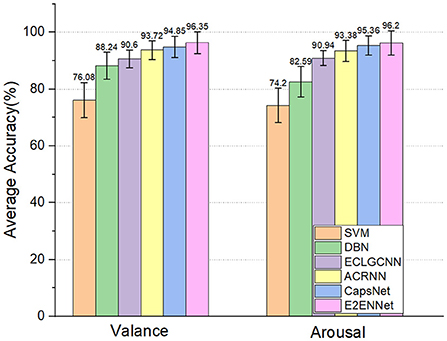
We construct two traditional classification algorithms, SVM and DBN, based on differential entropy (DE) features to verify the model's effectiveness. Both methods go through the same preprocessing steps as the E2ENNet model, namely baseline removal and sliding window slice. According to the method of Duan et al. (2013). DE features on five frequency bands: Delta (1–3 Hz), Theta (4–7 Hz), Alpha (8–13 Hz), Beta (13–30 Hz), and Gamma (30–45 Hz) are extracted as the input of SVM and DBN algorithms. And three other state-of-the-art classification methods are compared:
• ECLGCNN (Yin et al., 2021): extract DE features from preprocessed EEG signals to build cubes, and classify them by fusion model of graph convolution neural network and LSTM.
• ACRNN (Tao et al., 2020): a convolution recurrent neural network based on an attention mechanism is proposed, which fully considers the weights of different EEG channels and the spatial information in EEG signals.
• CapsNet (Chen et al., 2021): wavelet packet transform (WPT) is used to extract features, and an integrated capsule network is used as the classifier for EEG emotion classification.
As shown in Figure 3, we can see that the deep learning method performs better than the two machine learning methods. This shows that deep learning methods can better capture the features in EEG signals for emotion recognition. Compared with other deep learning methods, the E2ENNet model has achieved an average classification accuracy of 96.35% and 96.2% in the dimension of Valance and Arousal, respectively, in the emotion classification experiment on the DEAP dataset, which is higher than the traditional machine learning methods and the above classification methods.
3.3.2. Experiments on DREAMER dataset
The format of original data is 18 × 14 × 7,808, 18 represents 18 trials, 14 represents 14 electrodes used in EEG, duration of each video T1 = 61s, sampling frequency is 128 Hz, baseline signal T2 = 1s. The baseline signal of the first second is , then subtract the value of baseline signal from the test signal for the last 60 s T3. The baseline removed slice signal is obtained as experimental data. Furthermore, use 1 s non overlapping window to slice the experimental data. Sixty segments were obtained in each trial. We do all experiments under the subject-dependent experimental protocol. Each subject gets 60 × 18 = 1,080 samples, the format of each sample is 14 × 128. We divide the data of 18 trials into the training set and testing set according to the ratio of 5:1, i.e., 15 trials are used as the training set, and 3 trials are used as the testing set. 3 trials of the training set are randomly selected as the validation set. The segmentation is performed six times until every single trial has been trained and tested. A 6-fold cross-validation dataset is constructed, take the average accuracy of six experiments as the final experimental result.
To verify the effectiveness of the E2ENNet model, consistent with Section 3.3.1. We compare the experimental results with SVM and other deep learning methods:
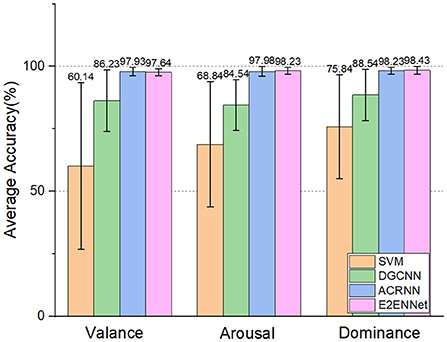
• DGCNN (Song et al., 2018): A graph representation method for multi-channel EEG data. Constructs the connection relationship between each vertex node of the graph by learning the adjacency matrix, use DE and other features to classify emotions.
And ACRNN (Tao et al., 2020) on three emotional dimensions (Valance, Arousal, and Dominance). As shown in Figure 4, we can see:
1. E2ENNet model achieved 97.64, 98.23, and 98.42% accuracy in Valance, Arousal, and Dominance dimensions, respectively. Among them, the accuracy of Arousal and Dominance is the highest among the four methods.
2. The accuracy of the Valance dimension is a little lower than that of the ACRNN model, probably because its classification accuracy has reached the bottleneck.
3.3.3. Experiments on MPED dataset
The format of original data is 28 × 62 × 1,5360, 28 represents 28 trials, 62 represents 62 electrodes used in EEG, duration of each video T1 = 120s, sampling frequency is downsampled to 128Hz. Thus the EEG data used in this article has already been removed baseline. There is no need to remove the baseline again, and the data can be directly obtained as experimental data. Furthermore, use 1 s no overlapping window to slice the experimental data. One hundred and twenty segments were obtained in each trial. Then each subject gets 120 × 28 = 3,360 samples, the format of each sample is 62 × 128. According to the experimental protocol three of Song et al. (2019)'s. The data of 21 trails are selected as the training set, and 7 trials are selected as the testing set to ensure the samples of 7 emotions in the training set and testing set are balanced. i.e., the sample ratio of the training set and testing set is 3:1, and 7 trials of the training set are randomly selected as the validation set. The segmentation is performed four times until every single trial has been trained and tested. Take the average accuracy of four experiments as the final experimental result.
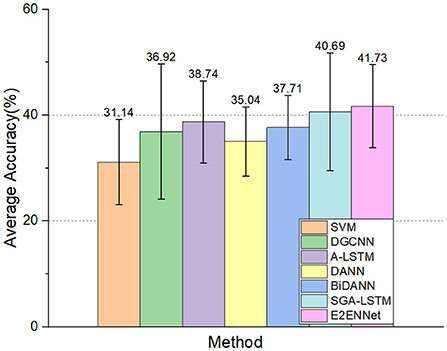
In order to verify the performance of the model under multi-classes classification tasks. We compare the experimental results with SVM (Song et al., 2019), and other state-of-the-art deep learning methods in subject-dependent experimental protocol:
• A-LSTM (Song et al., 2019): adding attention mechanism to the LSTM network, extracting discriminative features by focusing on the temporal information of time series to classify emotions.
• DANN (Ganin et al., 2016): drawing on the idea of adversarial learning, classify target domain data with source domain data.
• BiDANN (Li et al., 2021): this method takes into account the distribution difference between training and testing data and the asymmetry of the left and right hemispheres of the brain, using DE features to classify emotions.
• SGA-LSTM (Liu et al., 2019): using attention mechanism and combining GCNN with LSTM to focus on specific EEG channels for emotion recognition.
The experimental results can be seen in Figure 5. The accuracy of the E2ENNet model is still improved compared with other methods. It shows that the E2ENNet model can still maintain a considerable classification effect for more detailed emotion classify circumstances, which fully verifies the good robustness of the E2ENNet model.
3.4. Model validation experiments
3.4.1. Influence of different input features
Here, we discuss the influence of different input features for the E2ENNet model. We extract DE and PSD features that refers to Jia et al. (2020b)'s method. The two manually extracted features, the original EEG features (Raw data), and the combination of the three are used as the input data of E2ENNet. We conducted experiments on all three datasets.
The experimental results are shown in Table 3, where ACC represents the recognition accuracy of the model and STD represents the standard deviation. When inputting the manually extracted DE and PSD features, the recognition accuracy of the E2ENNet model is 18.61, 15.95, 9.3, 1.33, 3.89, and 1.23% lower than that of inputting original EEG signals on DEAP, DREAMER and MPED dataset, respectively. The standard deviation is also higher by 1.87, 1.68, 7.75, 0.75, 0.06, and 0.04%, respectively. It shows that some valuable information for emotion classification in original EEG signals may be lost when manually extracting features from EEG signals. At the same time, it also reduces some trainable samples, which also explains the importance of end-to-end emotion recognition. When putting PSD, DE and raw data together. The experimental results show that the results of the three combinations are not as good as the results of using the original signal. The possible reasons is that our network model is to first perform a convolution operation on the original signal, which is equivalent to filtering, and the PSD and DE features are features that have been filtered and then transformed. Therefore, the combined features of the three are not suitable for our network and may lead to redundancy of features, which reduces the effect.
3.4.2. Ablation study
To further verify the necessity of each model module, ablation experiments on E2ENNet were carried out on DEAP, DREAMER, and MPED datasets. It mainly includes the following experiments: (1) Removing EEGNet module in E2ENNet, retain LSTM module only, experiment on original EEG signals; (2) Removing LSTM module in E2ENNet, only retain EEGNet module, experiment on original EEG signals; (3) Experiment on the final E2ENNet model.
The results can be seen in Table 4, where ACC represents the recognition accuracy of the model and STD represents the standard deviation. And the number of layers of LSTM may influence the classification accuracy, too. We conduct experiments based on one LSTM layer to three LSTM layers. To further verify the effect of different LSTM layers. The results can be seen in Figure 6. We can see that:
• Compared with the E2ENNet model, the recognition accuracy of the LSTM model on DEAP, DREAMER, and MPED dataset is relatively low. This shows that the convolution network EEGNet in E2ENNet, especially the depthwise separable convolution, can extract useful features in original EEG signals and play an important role in emotion recognition.
• After adding the LSTM module to the EEGNet module, the classification accuracy of the E2ENNet model is improved by 1.32, 0.76, and 1.70%, respectively, indicating that LSTM is very sensitive to time-series and can explore helpful pieces of information between features to improve the classification performance of a convolution network.
• Different LSTM layers can influence the effect of E2ENNet. After adding one layer of LSTM to the EEGNet, the effect is improved. After adding two layers, the effect is more obvious. After adding three layers, the effect gradually decreases. Therefore, adding two layers of LSTM makes the emotion recognition model optimal. The reason for the gradual decline after the three-layer LSTM network may be that the EEG emotion data set is a small data set, and too many network layers lead to over fitting.
From the above points, it can be concluded that each part of E2ENNet is effective and has significant contributions to the emotion classification task and the structure of E2ENNet is reasonable.
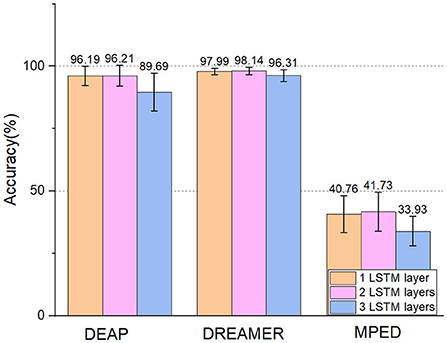
Figure 6. Experiments on DEAP, DREAMER, and MPED dataset based on different LSTM layers in E2ENNet model.
3.4.3. Comparison of time cost
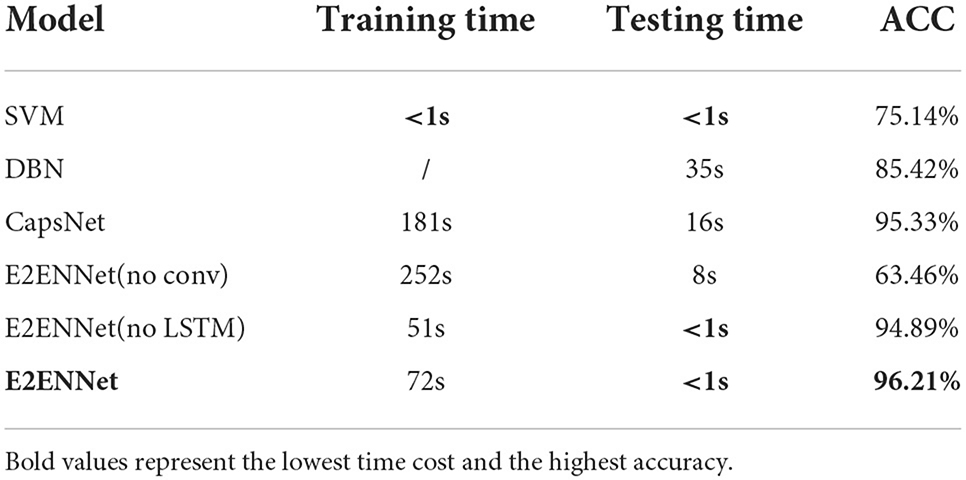
Except for accuracy, computational efficiency (time cost) is also a vital criterion for evaluating algorithms. Due to the effectiveness of depthwise separable convolution we used in E2ENNet, the amount of calculation can be reduced significantly. We run all the codes under the same experimental environment. As shown in Table 5, we compared the training time, testing time, and accuracy of SVM, DBN, CapsNet (Chen et al., 2021) and three ablation models mentioned in Section 3.4.2 on the DEAP dataset. We can see that SVM is the least time-consuming method but the accuracy is not very good, the testing time of DBN is too long. The CapsNet model has relatively high accuracy, but the time cost is very high, too. E2ENNet (no conv) has no advantage in both time cost and accuracy. For E2ENNet (no LSTM) and E2ENNet, the price of higher accuracy is a heavier computation burden during training. However, once the models are trained, we do not need to consider the training time anymore. Our E2ENNet model has achieved relatively the lowest testing cost and the highest accuracy, and run end-to-end, which is very suitable for instant EEG emotion recognition systems.
4. Conclusion
In this paper, we proposed an end-to-end emotion recognition model, E2ENNet, which can extract more discriminative features conductive to emotion recognition from the original EEG signals. Through extensive validation, E2ENNet has achieved state-of-the-art accuracy on three public datasets, i.e., DEAP, DREAMER, and MPED. It's an idea plug-and-pay model for instant emotional brain-computer interface system. At the same time, we noticed that some deeper networks lead to overfitting due to the small EEG samples. In the future, we will use the Generative Adversarial Network to generate EEG data and apply a deeper model to classify emotions.
Data availability statement
Publicly available datasets were analyzed in this study. This data can be found here: DEAP: http://www.eecs.qmul.ac.uk/mmv/datasets/deap/; MPED: https://github.com/Tengfei000/MPED/.
Ethics statement
Written informed consent was obtained from the individual(s) for the publication of any potentially identifiable images or data included in this article.
Author contributions
ZH and HC: conceptualization. HC: methodology. XZ: formal analysis, investigation, and funding acquisition. ZH: resources and data curation and writing—original draft preparation. HC, XZ, JW, LW, and YS: writing—review and editing. All authors have read and agreed to the published version of the manuscript.
Funding
This work was supported by National Natural Science Foundation of China under Grant 62076064.
Conflict of interest
The authors declare that the research was conducted in the absence of any commercial or financial relationships that could be construed as a potential conflict of interest.
Publisher's note
All claims expressed in this article are solely those of the authors and do not necessarily represent those of their affiliated organizations, or those of the publisher, the editors and the reviewers. Any product that may be evaluated in this article, or claim that may be made by its manufacturer, is not guaranteed or endorsed by the publisher.
References
Alarcao, S. M., and Fonseca, M. J. (2019). Emotions recognition using EEG signals: a survey. IEEE Trans. Affect. Comput. 10, 374–393. doi: 10.1109/TAFFC.2017.2714671
Alhagry, S., Aly, A., and Reda, A. (2017). Emotion recognition based on eeg using lstm recurrent neural network. Int. J. Adv. Comput. Sci. Appl. 8, 345–358. doi: 10.14569/IJACSA.2017.081046
Britton, J. C., Phan, K. L., Taylor, S. F., Welsh, R. C., Berridge, K. C., and Liberzon, I. (2006). Neural correlates of social and nonsocial emotions: an fmri study. Neuroimage 31, 397–409. doi: 10.1016/j.neuroimage.2005.11.027
Chen, Q., Chen, L., and Jiang, R. (2021). Emotion recognition of EEG based on ensemble capsnet. Comput. Eng. Appl. 58, 175–184. doi: 10.3778/j.issn.1002-8331.2010-0263
Christian, M., Brendan, A., Anton, N., and Guillaume, C. (2014). A survey of affective brain computer interfaces: principles, state-of-the-art, and challenges. Brain Comput. Interfaces 1, 66–84. doi: 10.1080/2326263X.2014.912881
Cowie, R., Douglas-Cowie, E., Tsapatsoulis, N., Votsis, G., Kollias, S., Fellenz, W., et al. (2002). Emotion recognition in human-computer interaction. IEEE Signal Process. Mag. 18, 32–80. doi: 10.1109/79.911197
Duan, R. N., Zhu, J. Y., and Lu, B. L. (2013). “Differential entropy feature for eeg-based emotion classification,” in 2013 6th International IEEE/EMBS Conference on Neural Engineering (NER) (San Diego, CA: IEEE), 81–84.
Etkin, A., Egner, T., and Kalisch, R. (2011). Emotional processing in anterior cingulate and medial prefrontal cortex. Trends Cognit. 15, 85–93. doi: 10.1016/j.tics.2010.11.004
Ganin, Y., Ustinova, E., Ajakan, H., Germain, P., Larochelle, H., Laviolette, F., et al. (2016). Domain-adversarial training of neural networks. J. Mach. Learn. Res. 17, 2096–2030. doi: 10.48550/arXiv.1505.07818
Hao, Y., Shi, H., and Huo, S. (2021). Emotion classification based on eeg deep learning. J. Appl. Sci. 39, 347–356. doi: 10.3969/j.issn.0255-8297.2021.03.001
Hochreiter, S., and Schmidhuber, J. (1997). Long short-term memory. Neural Comput. 9, 1735–1780. doi: 10.1162/neco.1997.9.8.1735
Howard, A. G., Zhu, M., Chen, B., Kalenichenko, D., Wang, W., Weyand, T., et al. (2017). Mobilenets: Efficient convolutional neural networks for mobile vision applications. arXiv [Preprint]. arXiv: 1704.04861. Available online at: https://arxiv.org/abs/1704.04861
Jain, A., Singh, A., Koppula, H. S., Soh, S., and Saxena, A. (2016). “Recurrent neural networks for driver activity anticipation via sensory-fusion architecture,” in 2016 IEEE International Conference on Robotics and Automation (ICRA) (Stockholm: IEEE), 532–541.
Jia, Z., Lin, Y., Cai, X., Chen, H., Gou, H., and Wang, J. (2020a). “Sst-emotionnet: spatial-spectral-temporal based attention 3d dense network for EEG emotion recognition,” in MM '20: The 28th ACM International Conference on Multimedia (Seattle, WA), 2909–2917.
Jia, Z., Lin, Y., Wang, J., Zhou, R., and Zhao, Y. (2020b). Graphsleepnet: “Adaptive spatial-temporal graph convolutional networks for sleep stage classification,” in Twenty-Ninth International Joint Conference on Artificial Intelligence and Seventeenth Pacific Rim International Conference on Artificial Intelligence IJCAI-PRICAI-20 (Yokohama), 1324-1330.
Jin, J., Li, S., Daly, I., Miao, Y., Liu, C., Wang, X., et al. (2020). The study of generic model set for reducing calibration time in p300-based brain-computer interface. IEEE Trans. Neural Syst. Rehabil. Eng. 28, 3–12. doi: 10.1109/TNSRE.2019.2956488
Jin, J., Wang, Z., Xu, R., Liu, C., Wang, X., and Cichochi, A. (2021). Robust similarity measurement based on a novel time filter for SSVEPs detection. IEEE Trans. Neural Netw. Learn. Syst. doi: 10.1109/TNNLS.2021.3118468. [Epub ahead of print].
Koelstra, S. (2012). Deap: a database for emotion analysis ;using physiological signals. IEEE Trans. Affect. Comput. 3, 18–31. doi: 10.1109/T-AFFC.2011.15
Lawhern, V. J., Solon, A. J., Waytowich, N. R., Gordon, S. M., Hung, C. P., and Lance, B. J. (2016). EEGNet: a compact convolutional network for eeg-based brain-computer interfaces. J. Neural Eng. 15, 056013.1-056013.17. doi: 10.1088/1741-2552/aace8c
Li, D. H., Wang, Z., Wang, C. H., Liu, S., and Song, Y. (2019). The fusion of electroencephalography and facial expression for continuous emotion recognition. IEEE Access 7, 155724–155736. doi: 10.1109/ACCESS.2019.2949707
Li, Y., Wang, L., Zheng, W., Zong, Y., and Song, T. (2020). A novel bi-hemispheric discrepancy model for eeg emotion recognition. IEEE Trans. Cogn. Dev. Syst. 13, 354–367. doi: 10.1109/TCDS.2020.2999337
Li, Y., Zheng, W., Cui, Z., Zhang, T., and Zong, Y. (2018). “A novel neural network model based on cerebral hemispheric asymmetry for EEG emotion recognition,” in Twenty-Seventh International Joint Conference on Artificial Intelligence IJCAI-18, 1561–1567.
Li, Y., Zheng, W., Zong, Y., Cui, Z., Zhang, T., and Zhou, X. (2021). A bi-hemisphere domain adversarial neural network model for eeg emotion recognition. IEEE Trans. Affect. Comput. 12, 494–504. doi: 10.1109/TAFFC.2018.2885474
Lindquist, K. A., and Barrett, L. F. (2012). A functional architecture of the human brain: emerging insights from the science of emotion. Trends Cogn. Sci. 16, 33–40. doi: 10.1016/j.tics.2012.09.005
Liu, S., Zheng, W., Song, T., and Zong, Y. (2019). “Sparse graphic attention LSTM for EEG emotion recognition,” in Neural Information Processing, Vol. 1142 (Cham: Springer). doi: 10.1007/978-3-030-36808-1_75
Liu, M., Wu, W., Gu, Z., Yu, Z., and Qi, F. (2018). Deep learning based on batch normalization for p300 signal detection. Neurocomputing 275, 288–297. doi: 10.1016/j.neucom.2017.08.039
Lotfi, E., and Akbarzadeh,-T., M. R. (2014). Practical emotional neural networks. Neural Netw. 59, 61–72. doi: 10.1016/j.neunet.2014.06.012
Ma, X., Liu, P., Wang, X., and Bai, X. (2021). Eeg emotion recognition based on optimal feature selection. J. Phys. 1966:012043. doi: 10.1088/1742-6596/1966/1/012043
Martinovski, B., and Mao, W. (2009). Emotion as an argumentation engine: modeling the role of emotion in negotiation. Group Decis. Negotiat. 18, 235–259. doi: 10.1007/s10726-008-9153-7
Picard, R., Rosalind, W., Vyzas, E., and Healey, J. (2001). Toward machine emotional intelligence: analysis of affective physiological state. IEEE Trans. Pattern Anal. Mach. Intell. 23, 1175–1191. doi: 10.1109/34.954607
Song, T., Zheng, W., Lu, C., Zong, Y., and Zhang, X. (2019). Mped: A multi-modal physiological emotion database for discrete emotion recognition. IEEE Access 7, 12177–12191. doi: 10.1109/ACCESS.2019.2891579
Song, T., Zheng, W., Song, P., and Cui, Z. (2018). Eeg emotion recognition using dynamical graph convolutional neural networks. IEEE Trans. Affect. Comput. 11, 532–541. doi: 10.1109/BIBM.2018.8621147
Soroush, M. Z., Maghooli, K., Setarehdan, S. K., and Nasrabadi, A. M. (2017). A review on eeg signals based emotion recognition. Int. Clin. Neurosci. J. 4, 118–129. doi: 10.15171/icnj.2017.01
Stamos, K., and Naeem, R. (2017). Dreamer: a database for emotion recognition through eeg and ecg signals from wireless low-cost off-the-shelf devices. IEEE J. Biomed. Health Inform.22, 98–107. doi: 10.1109/JBHI.2017.2688239
Sulthan, N., Mohan, N., Khan, K. A., Sofiya, S., and Muhammed, S. (2018). Emotion recognition using brain signals. Int. Conf. Intell. Circ. Syst. 16, 315–319. doi: 10.1109/ICICS.2018.00071
Tan, M., and Le, Q. V. (2019). Efficientnet: Rethinking model scaling for convolutional neural networks. arXiv [Preprint]. arXiv: 1905.11946. Available online at: https://arxiv.org/abs/1905.11946v1
Tao, W., Li, C., Song, R., Cheng, J., and Chen, X. (2020). Eeg-based emotion recognition via channel-wise attention and self attention. IEEE Trans. Affect. Comput. 99, 3025777. doi: 10.1109/TAFFC.2020.3025777
Waldron, V. R. (1994). Once more, with feeling: Reconsidering the role of emotion in work. Ann. Int. Commun. Assoc. 17, 236–247.
Wang, W., Cui, Z., Yan, Y., Feng, J., Yan, S., Shu, X., et al. (2016). “Recurrent face aging,” in CVPR 2016 IEEE Conference on Computer Vision and Pattern Recognition 2016 (Las Vegas, NV), 2378–2386.
Yang, Y., Wu, Q., Ming, Q., Wang, Y., and Chen, X. (2018). “Emotion recognition from multi-channel eeg through parallel convolutional recurrent neural network,” in 2018 International Joint Conference on Neural Networks (IJCNN) (Rio de Janeiro), 1–7.
Yin, Y. W.X. Z., Hu, B., Zhang, Y., and Cui, X. (2021). Eeg emotion recognition using fusion model of graph convolutional neural networks and lstm. Appl. Soft. Comput. 100, 106954. doi: 10.1016/j.asoc.2020.106954
Yu, Y., Liu, Y., Yin, E., Jiang, J., Zhou, Z., and Hu, D. (2019). An asynchronous hybrid spelling approach based on eeg-eog signals for chinese character input. IEEE Trans. Neural Syst. Rehabil. Eng. 27, 1292–1302. doi: 10.1109/TNSRE.2019.2914916
Zhang, T., Zheng, W., Cui, Z., Zong, Y., and Li, Y. (2019). Spatial-temporal recurrent neural network for emotion recognition. IEEE Trans. Cybern. 49, 839–847. doi: 10.1109/TCYB.2017.2788081
Zhou, Y., Li, F., Li, Y., Ji, Y., Shi, G., Zheng, W., et al. (2021). Progressive graph convolution network for EEG emotion recognition. arXiv [Preprint]. arXiv: 2112.09069. Available online at: https://arxiv.org/abs/2112.09069
Keywords: electroencephalogram (EEG), neurocognitive, emotional brain-computer interface, depthwise separable convolution, long short-term memory
Citation: Han Z, Chang H, Zhou X, Wang J, Wang L and Shao Y (2022) E2ENNet: An end-to-end neural network for emotional brain-computer interface. Front. Comput. Neurosci. 16:942979. doi: 10.3389/fncom.2022.942979
Received: 20 May 2022; Accepted: 22 July 2022;
Published: 12 August 2022.
Edited by:
Petia D. Koprinkova-Hristova, Institute of Information and Communication Technologies (BAS), BulgariaReviewed by:
Pallavi Pandey, KR Mangalam University, IndiaJing Jin, East China University of Science and Technology, China
Copyright © 2022 Han, Chang, Zhou, Wang, Wang and Shao. This is an open-access article distributed under the terms of the Creative Commons Attribution License (CC BY). The use, distribution or reproduction in other forums is permitted, provided the original author(s) and the copyright owner(s) are credited and that the original publication in this journal is cited, in accordance with accepted academic practice. No use, distribution or reproduction is permitted which does not comply with these terms.
*Correspondence: Xiaoyan Zhou, eGlhb3lhbl96aG91QG51aXN0LmVkdS5jbg==
†These authors have contributed equally to this work
 Zhichao Han
 Hongli Chang
 Xiaoyan Zhou1*
 Jihao Wang
 Yongbin Shao