 Andy Wai Kan Yeung1*
 Natalie Sui Miu Wong2
- 1Oral and Maxillofacial Radiology, Applied Oral Sciences, Faculty of Dentistry, The University of Hong Kong, Hong Kong, China
- 2Oral and Maxillofacial Surgery, Faculty of Dentistry, The University of Hong Kong, Hong Kong, China
Background: Many researchers have been using the visual analog scale (VAS) to acquire psychometric measurements from participants. Several recent studies have consistently pointed to Hayes and Patterson (1921) as the origin of the VAS method. The primary objectives of the current study were to identify the historical root of VAS by cited reference analysis and confirm if it was Hayes and Patterson (1921).
Methods: The Web of Science database was searched to identify psychology papers dealing with VAS. The full records and their cited references were extracted and imported into CRExplorer for further analysis. A “reference publication year spectroscopy” (RPYS) was plotted to identify the seminal references.
Results: We analyzed 32,569 references cited by 958 articles. There were 21 RPYS peaks ranging from year 1921 to 2007. We were able to identify (Hayes and Patterson, 1921) from the first peak. Furthermore, we were able to identify a total of seven seminal references that are directly relevant to VAS. Two of them were related to “graphic rating method,” three were VAS-validation studies, one was a review on the usage of VAS, and one compared reported results using VAS and Likert scale.
Conclusions: Cited reference analysis with a RPYS plot succeeded in identifying and confirming (Hayes and Patterson, 1921) as the origin of VAS. This method has overcome the limitations of conventional citation analysis, namely the issues of being not indexed, not identified by pre-defined search keywords, and not being all-time most cited.
Introduction
In many experiments and surveys, researchers have to gauge participants' psychometric responses. One of the simplest and commonly used tools for this purpose is the visual analogscale (VAS). Basically, the VAS consists of a continuous horizontal line, usually of 10 cm in printed length, and two descriptive phrases at the two extremities. The scale is commonly ranged from 0 (left, least extreme) to 10 (right, most extreme). Recent studies from various fields, such as cognitive psychology (Kuhlmann et al., 2017), integrative psychology (Sarafian et al., 2018), medicine (Klimek et al., 2017), and public health (Krabbe et al., 2017), have all pointed to the work by Hayes and Patterson in 1921, which introduced the “graphic rating method” (Hayes and Patterson, 1921), as the first scientific description of VAS. The research question here is: is there a systematic method to identify and confirm that (Hayes and Patterson, 1921) is the recognized, first scientific description of the VAS psychometric tool?
The most intuitive method must be to conduct a citation analysis. It can be simply achieved by typing the keywords (i.e., VAS or “visual analog* scale*”) into the renowned bibliometric databases such as Web of Science or Scopus, and sorting the search results by citation number. However, we have found that (Hayes and Patterson, 1921) is not indexed in both databases at the time of writing this manuscript. Moreover, they referred the method as graphic rating scale but not VAS. As Web of Science enables users to conduct a cited reference search, we searched and succeeded in finding this publication via this second method. It has been cited in three variants with a total of 144 citations, which was relatively mediocre compared to highly cited VAS publications, such as the one reporting a validation of VAS for pain assessment (Price et al., 1983) with over 1,800 citations.
Therefore, we have performed a cited reference analysis using the CRExplorer software (Thor et al., 2016). It can plot a “reference publication year spectroscopy” (RPYS), which shows a waveform along the timeline, and the waveform illustrates in which years the more cited references (compared to preceding and succeeding years) were published (Marx and Bornmann, 2014; Marx et al., 2014; Wray and Bornmann, 2015; Yeung, 2017; Yeung et al., 2019). The primary aims of the current study were to identify the historical root of VAS by RPYS and confirm if it was Hayes and Patterson (1921). The secondary aim was to identify the representative publications at the subsequent RPYS peaks.
Materials and Methods
The Web of Science Core Collection online database was accessed on 18 October 2018. A search was performed using the following strategy: TOPIC = (visual analog* scale*). The topic search did not include the abbreviation VAS because this abbreviation has multiple meanings such as vibroacoustic stimulation and value-added service. The search was restricted to publications in journals classified by Web of Science as in any fields of psychology, namely “Psychology,” “Psychology, Applied,” “Psychology, Biological,” “Psychology, Clinical,” “Psychology, Developmental,” “Psychology, Educational,” “Psychology, Experimental,” “Psychology, Mathematical,” “Psychology, Multidisciplinary,” “Psychology, Psychoanalysis,” or “Psychology, Social.” No additional restriction was placed, such as on the publication year, or language. The search yielded 958 articles, which collectively had 32,569 cited references.
The full record and cited references of these 958 articles were imported into the CRExplorer software. It was developed to identify publications, within a pre-defined body of literature, that have been most frequently referenced (Marx et al., 2014; Wray and Bornmann, 2015). The RPYS plot has two components: a bar chart that illustrates the raw frequency of cited references published in each year, and a spectrogram that shows positive and negative peaks that indicate years when the citation count has deviated from its 5 years median. For example, references published in 2002–2006 were cited 1,328, 1,364, 1,413, 1,249, and 1,268 times, respectively. The 5 years median citation count was 1,328. Therefore, references published in 2004, being cited 1,413 times, were cited 85 times more than its 5 years median and produced a positive peak with a magnitude of 85. Positive peaks indicated higher-than-average citation count received by references published in those years. We only considered positive peaks with a magnitude of at least 5. For the positive peaks with a magnitude < 50, we evaluated the references with >10% contributions to the peak. For the peaks with a magnitude >50, we also evaluated the references with >10% contributions to the peak, or the top two contributing references if none of them had >10% contribution. These thresholds were set to focus on more important cited references, similar to a previous study that excluded references with <10% contributions to a peak (Bornmann et al., 2018). To provide additional insight, the N_TOP10 indicator was checked for the seminal references identified. This indicator identifies in how many years a reference was a top 10% cited reference, within the dataset. The dataset (VAS.cre) is supplied as a zipped Supplementary Data Sheet that can be unzipped and imported into CRExplorer.
Results
Distribution of the Positive Peaks
There were 21 peaks ranging from year 1921 to 2007 (Figure 1). The largest peaks were in the 1980s−2010s. The seminal references that fulfilled our defined criteria were listed in Table 1. They were among the top 10% cited references for 2–20 years. By this method, we were able to identify (Hayes and Patterson, 1921) from the first peak. Furthermore, we were able to identify a total of seven seminal references that are directly relevant to VAS. Two of them were related to “graphic rating method,” three were VAS-validation studies, one was a review on the usage of VAS, and one compared reported results using VAS and Likert scale. The other seminal references not directly relevant to VAS were mostly studies reporting results with ordinal scales, such as Likert scale.
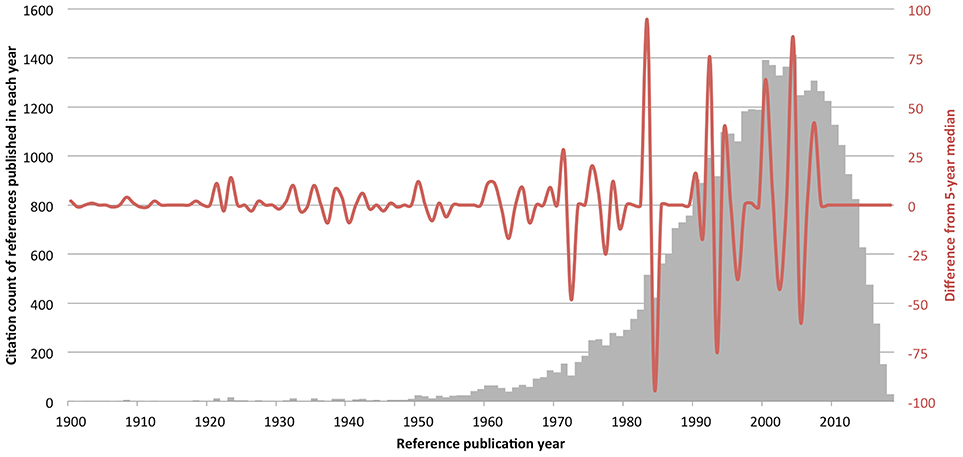
Figure 1. Results from reference publication year spectroscopy (RPYS). The reference lists of the 958 psychology publications concerning visual analog scale were analyzed by CRExplorer. References were sorted by publication year (x-axis), and the citation counts received by each reference published in the same year were summated (gray, left y-axis). The spectrogram has plotted the difference in annual citation count from its 5 years median (red, right y-axis).
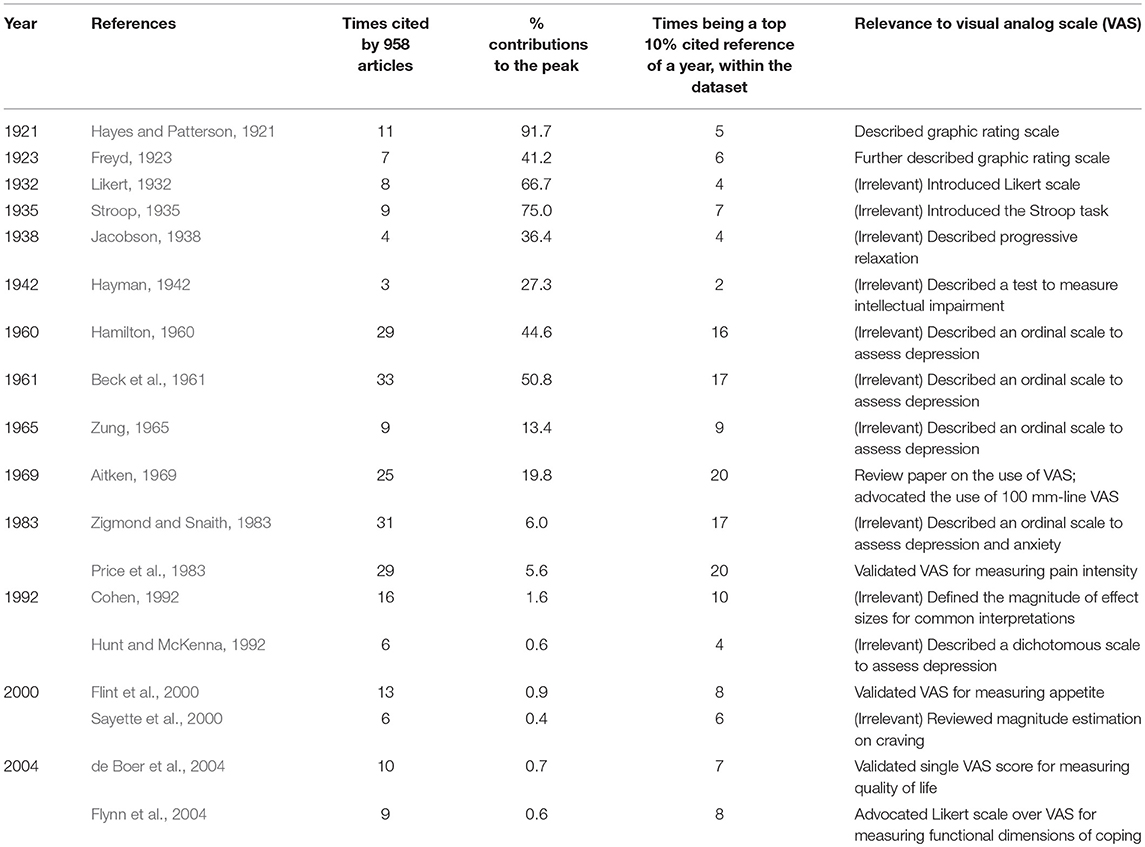
Table 1. Seminal references identified by reference publication year spectroscopy (RPYS).
Discussion
Traditional bibliometric analyses have focused on the publication and citation counts of a body of literature identified by a refined search strategy (Yeung et al., 2017). By doing so, it would be impossible for us to identify (Hayes and Patterson, 1921) due to its relatively small number of citations received and its referral to the method as graphic rating scale instead of VAS. It is understandable, since the use of VAS scale has become a routine practice that researchers may not necessarily cite the original paper to substantiate their use of the method. However, bibliometricians and librarian scientists have recently attempted to examine the cited references of selected publications in order to analyse the data from another angle (Marx et al., 2014; Comins and Leydesdorff, 2016). Marx and Bornmann have pointed out that the most crucial edge of this approach over the conventional citation analysis is its ability to identify the historical roots of a pre-defined body of literature, which can be conceptually heterogeneous and thus not found by the search keywords, or may be highly cited compared to other references published during those years but not all-time highly cited (Marx and Bornmann, 2016). In our case, we succeeded in identifying the not-so-highly-cited (Hayes and Patterson, 1921) as the first key reference and scientific description of the graphic rating method, which can be considered as the origin of VAS. According to Web of Science, it was cited by 144 publications only. From our cited reference analysis, it was cited by 11 of the 958 publications analyzed (1.1%). These figures were not outstanding. However, the 958 publications have only cited a total of 12 times to all references published in 1921, and that (Hayes and Patterson, 1921) was accountable for 11 (91.7%) of them. Moreover, the RPYS has shown that references published in 1920 and 1922 have collectively received one and zero citation, respectively. These findings have highlighted the relative importance of Hayes and Patterson (1921).
The current analysis has certain limitations. One limitation could be the missing abbreviation of VAS in the search query. Another limitation might be the coverage of the employed database, which did not allow the analysis of publications not indexed.
Conclusions
The validity of VAS has been continuously assessed by researchers in different fields, such as for the evaluation of pain, mood, and craving [c.f. Wewers and Lowe (1990)]. Surely, no psychometric scale would fit all research purposes, but it is expected that VAS will continue to flourish due to its simplicity in administration. The seminal works by Hayes, Patterson and Freyd may not be well cited by the scientific literature, but the results from the current study have appreciated and reaffirmed their contributions to this very important aspect of psychology. The authors would encourage colleagues to use similar methodology to probe into the origin of a particular method or technique of interest, whenever they are in doubt.
Data Availability
All datasets generated for this study are included in the manuscript and/or the supplementary files.
Author Contributions
All authors listed have made a substantial, direct and intellectual contribution to the work, and approved it for publication.
Conflict of Interest Statement
The authors declare that the research was conducted in the absence of any commercial or financial relationships that could be construed as a potential conflict of interest.
Supplementary Material
The Supplementary Material for this article can be found online at: https://www.frontiersin.org/articles/10.3389/fnhum.2019.00086/full#supplementary-material
References
Aitken, R. C. (1969). Measurement of feelings using visual analogue scales. Proc. R. Soc. Med. 62, 989–993.
Beck, A. T., Ward, C. H., Mendelson, M., Mock, J., and Erbaugh, J. (1961). An inventory for measuring depression. Arch. Gen. Psychiatry 4, 561–571. doi: 10.1001/archpsyc.1961.01710120031004
Bornmann, L., Haunschild, R., and Leydesdorff, L. (2018). Reference publication year spectroscopy (RPYS) of Eugene Garfield's publications. Scientometrics 114, 439–448. doi: 10.1007/s11192-017-2608-3
Comins, J. A., and Leydesdorff, L. (2016). RPYS i/o: software demonstration of a web-based tool for the historiography and visualization of citation classics, sleeping beauties and research fronts. Scientometrics 107, 1509–1517. doi: 10.1007/s11192-016-1928-z
de Boer, A. G., van Lanschot, J. J., Stalmeier, P. F., van Sandick, J. W., Hulscher, J. B., de Haes, J. C., et al. (2004). Is a single-item visual analogue scale as valid, reliable and responsive as multi-item scales in measuring quality of life? Qual. Life Res. 13, 311–320. doi: 10.1023/B:QURE.0000018499.64574.1f
Flint, A., Raben, A., Blundell, J., and Astrup, A. (2000). Reproducibility, power and validity of visual analogue scales in assessment of appetite sensations in single test meal studies. Int. J. Obes. 24, 38–48. doi: 10.1038/sj.ijo.0801083
Flynn, D., Van Schaik, P., and Van Wersch, A. (2004). A comparison of multi-item likert and visual analogue scales for the assessment of transactionally defined coping function1. Eur. J. Psychol. Assess. 20, 49–58. doi: 10.1027/1015-5759.20.1.49
Hamilton, M. (1960). A rating scale for depression. J. Neurol. Neurosurg. Psychiatry 23, 56–62. doi: 10.1136/jnnp.23.1.56
Hayes, M. H. S., and Patterson, D. G. (1921). Experimental development of the graphic rating method. Psychol. Bull. 18, 98–99.
Hayman, M. (1942). Two minute clinical test for measurement of intellectual impairment in psychiatric disorders. Arch. Neurol. Psychiatry 47, 454–464. doi: 10.1001/archneurpsyc.1942.02290030112010
Hunt, S. M., and McKenna, S. P. (1992). The QLDS: a scale for the measurement of quality of life in depression. Health Policy 22, 307–319. doi: 10.1016/0168-8510(92)90004-U
Jacobson, E. (1938). Progressive Relaxation: A Physiological and Clinical Investigation of Muscular States and Their Significance in Psychology and Medical Practice. Chicago, IL: University of Chicago Press.
Klimek, L., Bergmann, K. C., Biedermann, T., Bousquet, J., Hellings, P., Jung, K., et al. (2017). Visual analogue scales (VAS): measuring instruments for the documentation of symptoms and therapy monitoring in cases of allergic rhinitis in everyday health care. Allergo J. Int. 26, 16–24. doi: 10.1007/s40629-016-0006-7
Krabbe, P. F. M., Stolk, E. A., Devlin, N. J., Xie, F., Quik, E. H., and Pickard, A. S. (2017). Head-to-head comparison of health-state values derived by a probabilistic choice model and scores on a visual analogue scale. Eur. J. Health Econ. 18, 967–977. doi: 10.1007/s10198-016-0841-y
Kuhlmann, T., Dantlgraber, M., and Reips, U.-D. (2017). Investigating measurement equivalence of visual analogue scales and Likert-type scales in Internet-based personality questionnaires. Behav. Res. Methods 49, 2173–2181. doi: 10.3758/s13428-016-0850-x
Marx, W., and Bornmann, L. (2014). Tracing the origin of a scientific legend by reference publication year spectroscopy (RPYS): the legend of the Darwin finches. Scientometrics 99, 839–844. doi: 10.1007/s11192-013-1200-8
Marx, W., and Bornmann, L. (2016). Change of perspective: bibliometrics from the point of view of cited references—a literature overview on approaches to the evaluation of cited references in bibliometrics. Scientometrics 109, 1397–1415. doi: 10.1007/s11192-016-2111-2
Marx, W., Bornmann, L., Barth, A., and Leydesdorff, L. (2014). Detecting the historical roots of research fields by reference publication year spectroscopy (RPYS). J. Assoc. Inf. Sci. Technol. 65, 751–764. doi: 10.1002/asi.23089
Price, D. D., McGrath, P. A., Rafii, A., and Buckingham, B. (1983). The validation of visual analogue scales as ratio scale measures for chronic and experimental pain. Pain 17, 45–56. doi: 10.1016/0304-3959(83)90126-4
Sarafian, D., Maufrais, C., and Montani, J. P. (2018). Early and late cardiovascular and metabolic responses to mixed wine: effect of drink temperature. Front. Physiol. 9:1334. doi: 10.3389/fphys.2018.01334
Sayette, M. A., Shiffman, S., Tiffany, S. T., Niaura, R. S., Martin, C. S., and Schadel, W. G. (2000). The measurement of drug craving. Addiction 95, 189–210. doi: 10.1046/j.1360-0443.95.8s2.8.x
Stroop, J. R. (1935). Studies of interference in serial verbal reactions. J. Exp. Psychol. 18, 643–662. doi: 10.1037/h0054651
Thor, A., Marx, W., Leydesdorff, L., and Bornmann, L. (2016). Introducing CitedReferencesExplorer (CRExplorer): a program for referencepublication year spectroscopy with cited references standardization. J. Informetr. 10, 503–515. doi: 10.1016/j.joi.2016.02.005
Wewers, M. E., and Lowe, N. K. (1990). A critical review of visual analogue scales in the measurement of clinical phenomena. Res. Nurs. Health 13, 227–236. doi: 10.1002/nur.4770130405
Wray, K. B., and Bornmann, L. (2015). Philosophy of science viewed through the lense of “Referenced Publication Years Spectroscopy”(RPYS). Scientometrics 102, 1987–1996. doi: 10.1007/s11192-014-1465-6
Yeung, A. W. K. (2017). Identification of seminal works that built the foundation for functional magnetic resonance imaging studies of taste and food. Curr. Sci. 113, 1225–1227.
Yeung, A. W. K., Goto, T. K., and Leung, W. K. (2017). The changing landscape of neuroscience research, 2006–2015: a bibliometric study. Front. Neurosci. 11:120. doi: 10.3389/fnins.2017.00120
Yeung, A. W. K., Wong, N. S. M., and Leung, Y. Y. (2019). Are coronectomy studies being cited? A bibliometric study. J. Investig. Clin. Dent. 10:e12366. doi: 10.1111/jicd.12366
Zigmond, A. S., and Snaith, R. P. (1983). The hospital anxiety and depression scale. Acta Psychiatr. Scand. 67, 361–370. doi: 10.1111/j.1600-0447.1983.tb09716.x
Keywords: citation analysis, psychophysics, psychometric, psychosocial, reference publication year spectroscopy, VAS, visual analog scale
Citation: Yeung AWK and Wong NSM (2019) The Historical Roots of Visual Analog Scale in Psychology as Revealed by Reference Publication Year Spectroscopy. Front. Hum. Neurosci. 13:86. doi: 10.3389/fnhum.2019.00086
Received: 23 November 2018; Accepted: 19 February 2019;
Published: 12 March 2019.
Edited by:
Mikhail Lebedev, Duke University, United StatesReviewed by:
Nejc Sarabon, University of Primorska, SloveniaRobin Haunschild, Max-Planck-Institut für Festkörperforschung, Germany
Lutz Bornmann, Max-Planck-Gesellschaft (MPG), Germany
Copyright © 2019 Yeung and Wong. This is an open-access article distributed under the terms of the Creative Commons Attribution License (CC BY). The use, distribution or reproduction in other forums is permitted, provided the original author(s) and the copyright owner(s) are credited and that the original publication in this journal is cited, in accordance with accepted academic practice. No use, distribution or reproduction is permitted which does not comply with these terms.
*Correspondence: Andy Wai Kan Yeung, bmR5ZXVuZ0Boa3UuaGs=