 Dongdong Li
 Kohei Kaminishi
 Ryosuke Chiba
 Kaoru Takakusaki
 Masahiko Mukaino
 Jun Ota
- 1Department of Precision Engineering, School of Engineering, The University of Tokyo, Tokyo, Japan
- 2Research Into Artifacts, Center for Engineering (RACE), School of Engineering, The University of Tokyo, Tokyo, Japan
- 3Division of Neuroscience, Department of Physiology, Asahikawa Medical University, Asahikawa, Japan
- 4Department of Rehabilitation Medicine I, School of Medicine, Fujita Health University, Toyoake, Japan
Post-stroke complications are the second most frequent cause of death and the third leading cause of disability worldwide. The motor function of post-stroke patients is often assessed by measuring the postural sway in the patients during quiet standing, based on sway measures, such as sway area and velocity, which are obtained from temporal variations of the center of pressure. However, such approaches to establish a relationship between the sway measures and patients' demographic factors have hardly been successful (e.g., days after onset). This study instead evaluates the postural sway features of post-stroke patients using the clustering method of machine learning. First, we collected the stroke patients' multi-variable motion-capture standing-posture data and processed them into t s long data slots. Then, we clustered the t-s data slots into K cluster groups using the dynamic-time-warping partition-around-medoid (DTW-PAM) method. The DTW measures the similarity between two temporal sequences that may vary in speed, whereas PAM identifies the centroids for the DTW clustering method. Finally, we used a post-hoc test and found that the sway amplitudes of markers in the shoulder, hip, knee, and center-of-mass are more important than their sway frequencies. We separately plotted the marker amplitudes and frequencies in the medial-lateral direction during a 5-s data slot and found that the post-stroke patients' postural sway frequency lay within the bandwidth of 0.5–1.5 Hz. Additionally, with an increase in the onset days, the cluster index of cerebral hemorrhage patients gradually transits in a four-cluster solution. However, the cerebral infarction patients did not exhibit such pronounced transitions over time. Moreover, we found that the postural-sway amplitude increased in clusters 1, 3, and 4. However, the amplitude of cluster 2 did not follow this pattern, owing to age effects related to the postural sway changes with age. A rehabilitation doctor can utilize these findings as guidelines to direct the post-stroke patient training.
1. Introduction
A stroke is mainly caused by a lack of oxygen when the brain's blood flow is interrupted by a blockage (i.e., cerebral infarction, CI) or an artery rupture (i.e., cerebral hemorrhage, CH). Stroke patients tend to inherit an irregular postural sway during quiet standing (Chern et al., 2010), which increases the risk of falling. In this regard, evaluation of their quiet standing postural sway is essential.
Researchers have evaluated the quiet standing postural sway of post-stroke patients for many years. However, the postural sway features (e.g., sway amplitude) of the patients can be different because of different patient demographic factors (e.g., days after onset, age, and the influence of the level of damage in lesion regions) (Bansil et al., 2012; Cho et al., 2014; Halmi et al., 2020). Unfortunately, the relationship between postural sway features and patient demographic factors has not been well-studied. Some researchers focused only on sway amplitude. For example, Mizrahi et al. (1989) measured and analyzed the bilateral forces of the supporting limbs of stroke patients and found that they had significantly higher sway activity compared with normal controls. In the anterior-posterior and medial-lateral (ML) directions, (Wang et al., 2017) found that stroke patients had a more pronounced center-of-pressure (COP) sway than healthy people. Paillex and So (2005) demonstrated that temporal patterns of the difference between the COP and center-of-gravity could be characterized differently for healthy subjects and patients. Some researchers revealed greater sway activity in hemiplegic subjects compared with normal controls (Mizrahi et al., 1989).
Furthermore, machine-learning methods (e.g., multivariate time-series clustering) can find postural sway features using complete time-series data. For Parkinson's disease, Das et al. (2011) explored the motor symptoms of patients using a motion-capture system and a support vector machine. However, only a few studies have thus far analyzed the differences in post-stroke patients' quiet standing postural sway. Furthermore, there is no consensus with regards to the best method or feature set for analyzing motion-capture data to understand and assess post-stroke postural sway.
Hence, this study evaluates postural-sway features of post-stroke patients using a motion-capture system with a multivariate time-series machine-learning clustering technique.
The remainder of this paper is organized as follows. Section 2 reports the method of clustering and parameter distribution calculation. Section 3 presents the results. Section 4 discusses the implications of the results. Finally, we present the conclusions in section 5.
2. Methods
In this section, we describe our research method (Figure 1). First, the kinematic posture data of patients are measured, as detailed in section 2.1. Then, we extract features, as presented in section 2.2. Next, the clustering method is described in section 2.3. Finally, we calculate the parameter distribution, as detailed in section 2.4.
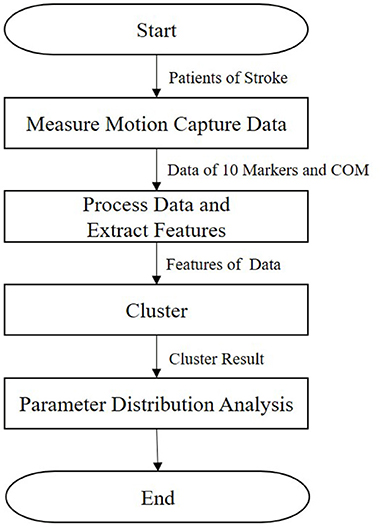
Figure 1. Workflow of the methods used in this study.
2.1. Motion-Capture Measurement
2.1.1. Study Population
Fujita Health University recruited the study subjects for our research. According to the agreement approved by the University Ethics Committee, all subjects provided informed written consent (HM18-467). We hired 10 male subjects. Five were CH, and five were CI; their statistical information is shown in Table 1. We added new data to previous research results (Li et al., 2021), including ages, days after onset, and hemiplegia. In our previous work (Li et al., 2021), we assumed that CH and CI presented differences in standing posture and leveraged a support vector machine for classification. However, in this paper, we evaluate the postural sway of post-stroke patients in a quiet standing position via clustering.
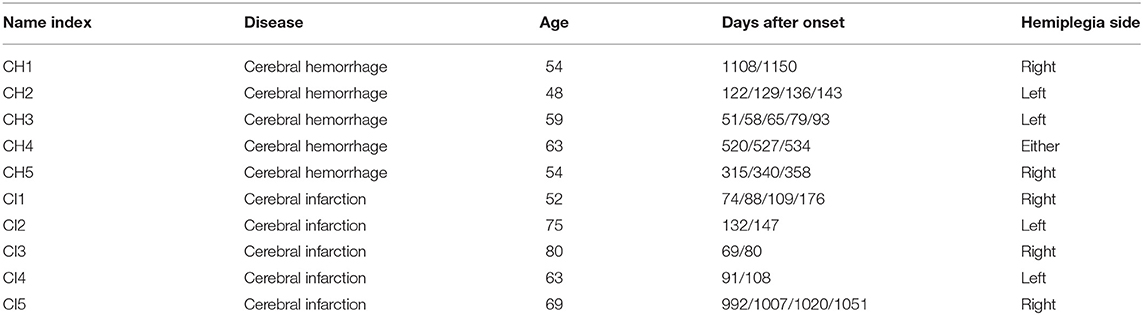
Table 1. Subject information.
2.1.2. Patient Data Collection
A 3-dimensional (3D) motion analysis system, KinemaTracer© (KISSEI COMTEC, Matsumoto, Japan), was used to precisely measure the quiet standing posture of post-stroke patients. The system hardware leveraged one recording/analyzing laptop and four charge-coupled-device cameras arranged around a standing platform on a level floor without a handrail. As shown in Figure 2, we attached the markers (30-mm diameter) to the acromion on both sides of the subject: the hip joint (positioned on the line connecting the superior anterior iliac spine and greater trochanter at 1/3 of the distance from greater trochanter), the knee joint (the AP midpoint of the lateral epicondyle of the femur), the ankle joint (exterior), and the toes (fifth metatarsal head). The measurement sampling frequency was 60 Hz for 30 s. A more detailed description of our methodology and mathematical formulas for data collection can be found in Matsuda et al. (2016) and Li et al. (2021).
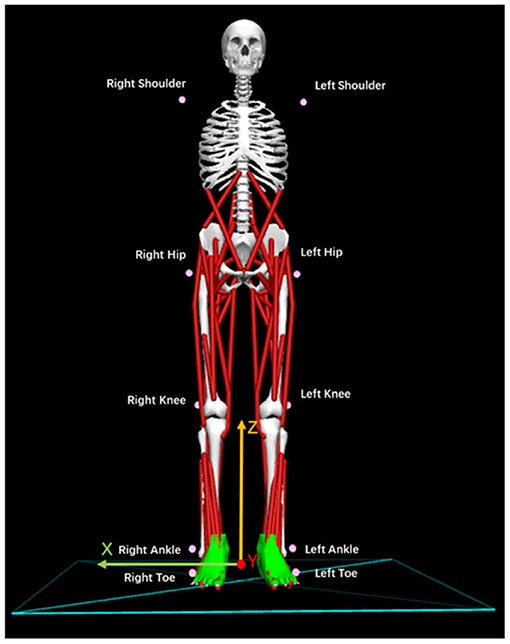
Figure 2. Location and names of markers attached to the patients. Ten pink markers were attached to the body symmetrically.
2.2. Data Processing and Feature Extraction
2.2.1. Kinematic Collected Variables
In this study, we utilized 33 kinematic variables extracted from the 3D motion analysis system for post-stroke patients' postural-sway evaluation. The kinematic variables contain 3D displacements (X-axis, Y-axis, Z-axis) of the center of mass (COM) and 3D displacements of 10 markers during the 30-s period. Hence, we collected 33 kinematic variables.
2.2.2. Feature Extraction
We extracted features for use when clustering post-stroke patient data with high performance. The methodology of this process is described in Figure 3.
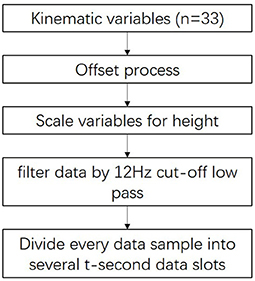
Figure 3. Methodology framework of the feature extraction described in section 2.2.
First, the variables were offset by setting the location of the ankle markers as midpoints as the patient stands on the front part of the level floor.
Next, we eliminated the anthropometric differences between subjects using the distance between shoulder and ankle markers using Equation (1):
where pi is the i-th X/Y/Z-axis position of the kinematic variable; is the i-th X/Y/Z scaled marker position; l1 is the average distance between the shoulder and hip markers; l2 is the average distance between the hip and knee markers; and l3 is the average distance between the knee and ankle markers. n is the number of kinematic variables, and the value of n was set to 33.
Next, we used a double-pass, second-order Butter-worth low-pass filter with a cutoff frequency of 12 Hz to filter the p′ data. Thus, the noise arising from changes in the orientation of the subject's body and other factors during measurement (Abdulhay et al., 2018) were removed.
Finally, to increase the data set size for each cluster, we divided every 30-s data sample into several data slots t seconds in length. For example, the division of a 30-s data sample into six 5-s data slots is shown in Figure 4. To determine the best value of t, we tested a range (t = 3, 5, 6, and 10) by evaluating the clustering results.
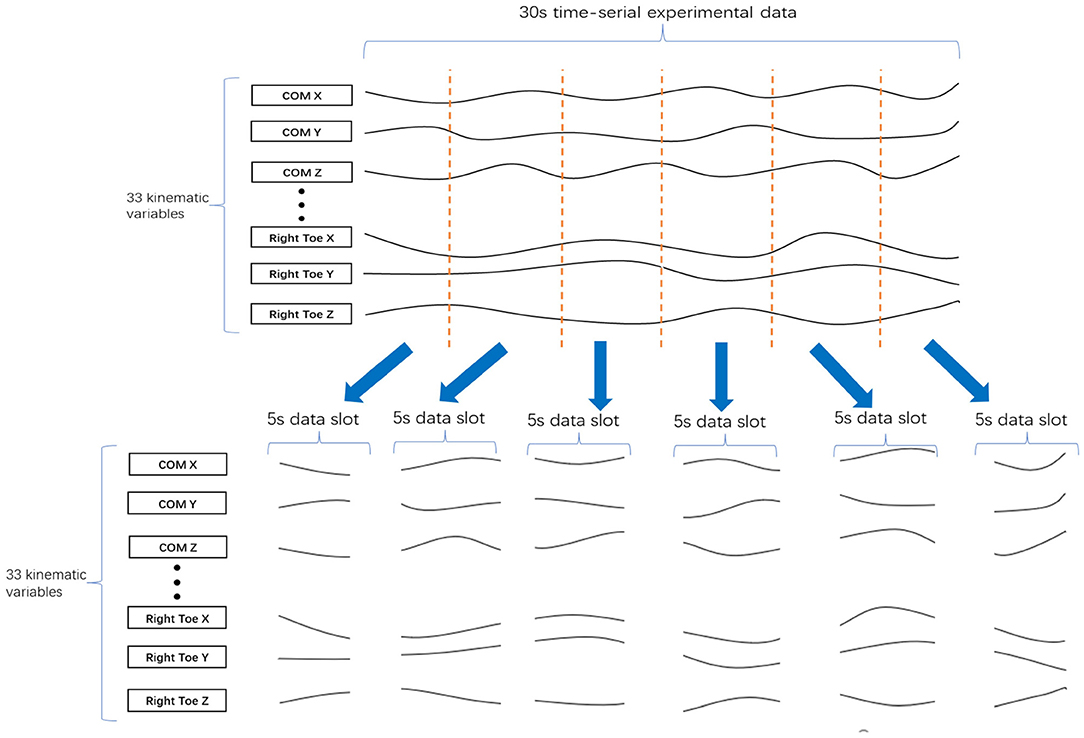
Figure 4. Division of 30 s of data into six 5-s data slots. A 30 s set of experimental data with 33 kinematic variables was divided into six of 5-s data slots, where each data slot has 33 kinematic variables.
2.3. Clustering
To find the postural-sway patterns of the post-stroke patients and to identify the relationships between the patient body displacement and their different characteristics (e.g., age, days after onset, and hemiplegia side), we used the multivariate time-series (MTS) clustering method. In a related field, numerous MTS methods have been explored (Montero and Vilar, 2014; Brandmaier, 2015; Genolini et al., 2015; Sardá-Espinosa, 2019).
As one method of MTS clustering, partitioning clustering with dynamic time warping (DTW) clustering is used to evaluate the similarity of different data slots (Malik and Lai, 2017; Rybarczyk et al., 2018). In Figure 5, the DTW compares the similarity between two temporal sequences (Data A and B), which may vary in speed. The DTW is used for temporal sequences, such as video, audio, and graphics data. Moreover, compared with other MTS clustering methods (e.g., a permutation distribution cluster), DTW provides faster calculations (Montero and Vilar, 2014; Sardá-Espinosa, 2019). Therefore, we used the DTW method to evaluate the similarity of data slots from different patients. To illustrate the similarity exhibited by data slots of 5 s in length in the case of postural sway, we present Figures 5B–D which show the similarity in 5-s slot data taken from individuals as well as from different patients. Moreover, we can evaluate the sway amplitude and frequency measured from the data slot as its similarity feature via DTW. Furthermore, this method calculates the distance between all points in the data; hence, the smaller the gap, the closer the match. The DTW could work well on the 33 kinematic variables because the postural sway of human is periodic (Giveans et al., 2011). All periods of sway data are similar. Thus, we assumed they can be detected by DTW. Moreover, to avoid the cut off of such periods, based on the period, we divide the 30 s of data into t-s data slots. Another researcher also used DTW to detect hip sway (Cuntoor et al., 2003).
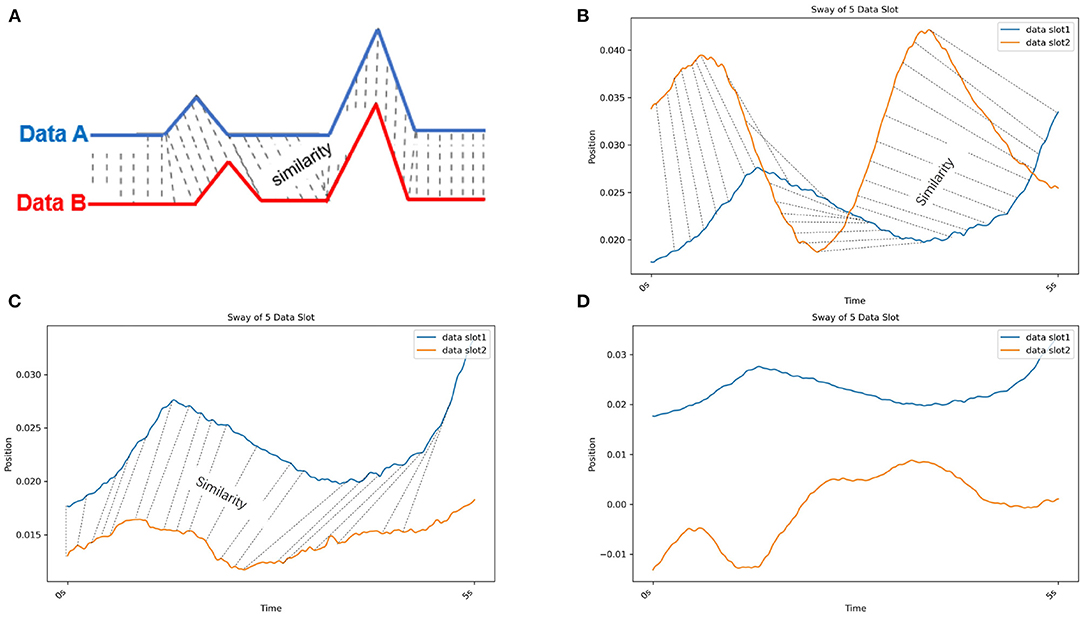
Figure 5. (A) Dynamic time warping (DTW). DTW compares the similarity between two temporal sequences (Data A in blue and B in red) that can vary in speed. (B) Dynamic time warping (DTW) with real postural sway data from the same individual. The blue and orange lines are the COM X data of different data slots from CH2. (C) Dynamic time warping (DTW) with real postural sway data from different patients in the same cluster. The blue line is the COM X data of a data slot from CH2. Orange line is the COM X data of a data slot from CH3. (D) Dynamic time warping (DTW) with real postural sway data from different patients in different clusters. The blue line is the COM X data of a data slot from CH2. The orange line is the COM X data of a data slot from CH5. Because the similarity of these two data slots is low, no similarity lines could be drawn.
After assessing the similarity between different slots, DTW clustering divides data slots into K clusters, and each cluster has a centroid. Here, the cluster implies a group wherein the data slots are more similar than those in other groups. Moreover, the centroid is the cluster center. We attempted two different centroid calculation methods. One is the partition-around-medoid (PAM) method, and another is DTW barycenter averaging (DBA) (Sardá-Espinosa, 2019).
The PAM is a method to find K-medoids point of clustering (Mannor et al., 2011). First, PAM selects K representative medoids (the most central clusters) to construct an initial cluster. Then, it continuously changes the medoids to find a better cluster representative with more significant reductions in distortion function. In each iteration, the set of best medoids for each cluster forms a new respective medoid. As shown in a 2-dimensional example of Figure 6, the medoid center in the red dot in the right figure is the most central object in the clusters with the smallest sum of distances from other data, which differs from the mean center in the red dot in the left figure.
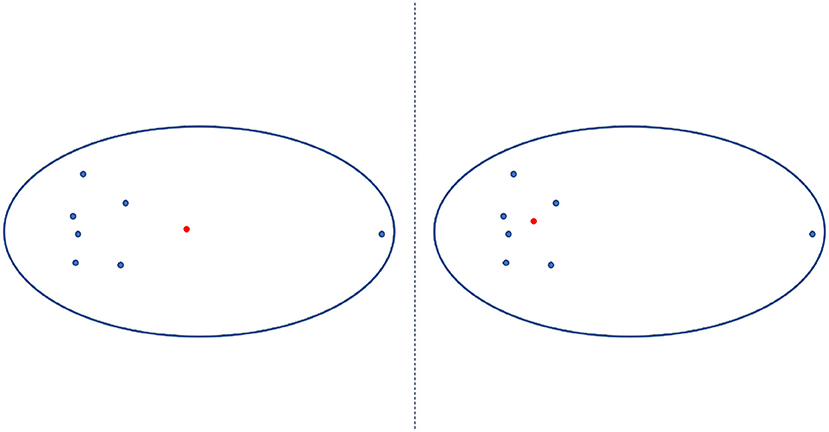
Figure 6. Mean center vs. medoid center. The mean center is indicated by the red dot in the left panel and differs the medoid center (indicated by the red dot in the right panel), which is the most central object in the clusters with the smallest sum of distances from other data.
The DBA refines another method of finding the K-medoids method. Here, medoids were defined as an average sequence of sets of sequences. The cluster was divided based on the distance between the average sequence and sets of sequences (Petitjean et al., 2011). Real postural sway (marker) data is used to further illustrate this process in Figure 7.
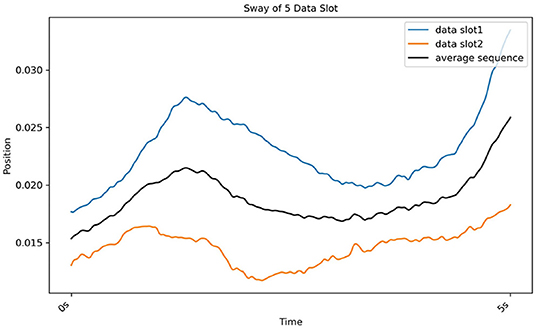
Figure 7. Results of DBA, which gradually determines the average sequence (black line) of two sequences (red line from CH2 and blue line from CH3).
We present the set of 5-s data slots as an example. The input data consisted of 186 sets of 33 × 300-dimensional vector data representing the standardized X/Y/Z-axis positions of 10 markers and a COM from 31 sets of 30 s of experimental data. We had 31 of 30 s experimental data. Every 30 s of data was divided into six slots of 5-s data. Hence, we had a total of 31 × 6 (186) sets of (33 × 300)-dimensional vector data. Because the measurement sampling frequency was 60 Hz for 30 s, for 5 s data, the number of columns is 60 Hz × 5 s (300). The DTW clustering compared each vector of one data slot and its corresponding vector of another. We randomly initialized the centroid of the cluster, and to avoid the effect of random errors in a centroid and to choose the best clustering solution, we repeated the process 10 times for the data set.
Afterwards, the method of determination of the best K clusters was introduced. First, to avoid the effect of random centroid behaviors and to choose the best clustering solution, we repeated the process 10 times for each data slot. Next, we evaluated the cluster solution using three cluster indices, including the Davies-Bouldin (DB) index (Davies and Bouldin, 1979), the Calinski-Harabasz (C-H) index (Caliñski and Harabasz, 1974), and the Dunn (D) index (Dunn, 1974), separately. These three indices evaluated the minimum value of the product of mean and the SD of the intra-cluster gap.
The DB is shown in Equation (2), where K is the number of clusters. In cluster i, δi is the mean gap between data units to their cluster centers, ci. In cluster j, δj is the mean gap between all data units to their cluster centers, cj. d(ci, cj) is the gap of cluster centers, ci and cj. The best cluster solution has the minimum DB value.
The C-H index is defined Equation (3), where K is the number of clusters and N is the volume of the data set. The BGSS indicates the sum of squares of the partition between clusters, and WGSS represents the sum of squares of the partition within a cluster. The best cluster result has the biggest indicator value.
In the cluster, the D index is defined as value calculated by dividing the smallest distance (dmin) within the cluster to the biggest distance (dmax), as shown in 4:
2.4. Parameter Distribution Calculation
After obtaining clustering solutions of the ts data slot and the K cluster, we analyzed the sway features of each kinematic variable of t-s data slots between clusters by applying a post-hoc test.
Here, based on previous research (Petri, 2002; Paillex and So, 2005; Abdulhay et al., 2018), we calculated three kinds of sway feature parameters for each kinematic variable of t-s data slots: amplitude, standard deviation (SD), and sway frequency. Amplitude is defined as the gap between maximum and minimum values of one kinematic variable in one t-s data slot. The SD is defined as the standard deviation of one kinematic variable in one t-s data slot. Sway frequency is defined as the frequency value corresponding to the first most prominent peak in frequency domain map by the fast Fourier transform.
Before implementing the post-hoc test, we first determined the post-hoc test method by observing distribution and the homogeneity level of parameters using Shapiro-Wilk (Mohd Razali and Bee Wah, 2011) and Bartlett's tests (Tobias and Carlson, 1969). If the parameter data follow a normal distribution and display homogeneity of variance, we can use Turkey-Kramer post-hoc method. Otherwise, we use a pairwise Wilcoxon test (Pohlert, 2014) with a Benjamini-Hochberg p-value adjustment method. Therefore, we performed a post-hoc test to find which cluster pairs were significant to each parameter.
We consider the case of the left shoulder marker when the data slot is 5 s and K = 4 as an example. First, based on the clustering result, we grouped the 186 data slots into four groups. Then for each group, we extracted the 5-s left-shoulder markers' x, y, and z values from each slot. Then, we calculated amplitude, SD, and sway frequency for each kinematic variable in each data slot. Finally, we implemented the post-hoc to find the significant kinematic variables for discussion.
3. Results
3.1. General Cluster Performance
In this work, we used two models, DTW-PAM and DTW-DBA. Based on the cluster validity evaluation, we compared the cluster results in which the data-slot time, t, was in the range of 3, 5, 6, and 10 s; K was in the range of 3, 4, and 5; and the method was DTW-PAM or DTW-DBA, as shown in Tables 2, 3. Then, we found that the DTW-PAM model of the t = 5-s data slot with K = 4 was better than the other results. Hence, we inferred from the clustered index that there was a difference in the standing postures of post-stroke patients. Then, only the detailed solution of DTW-PAM was introduced.
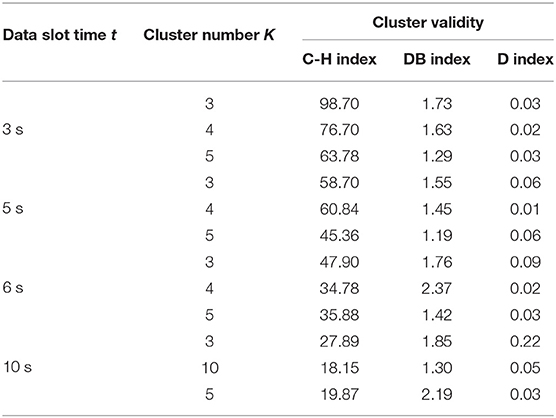
Table 2. DTW-PAM result.
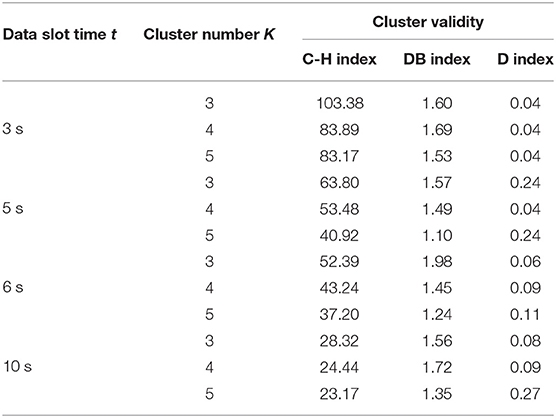
Table 3. DTW-DBA result.
Finally, based on the clustering result of the t = 5-s data slot with K = 4 on the DTW-PAM model, we observed and calculated the median value of days after onset, age, and disease-type percentage from the first to the fourth clusters, as shown in Table 4.
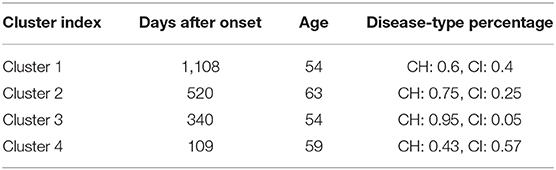
Table 4. Characteristics of cluster under data time slot = 5 s, K = 4.
3.2. Parameter Distribution Analysis
To analyze the sway features of each kinematic variable of t-s data slots between clusters, first, using the Shapiro-Wilk test, we found that the parameters did not follow a normal distribution and displayed homogeneity of variance. Therefore, we used the pairwise Wilcoxon test (Pohlert, 2014) to perform the post-hoc test to find clusters representing significant differences. In Table 5, the post-hoc test subjects and results are listed. For each axis of each body on the left or right side (indexed from 1 to 33), we performed a post-hoc test to determine which cluster pairs had significant differences. The result shows that the differences between clusters are mainly explained by amplitude and SD. In Table 5, the contribution of the shoulder, hip, knee, and COM variables that are particularly significant are colored blue. As a result, we present Figures 8, 9, whose x-axes represent the ML amplitude after normalization and postural-sway frequency, respectively. The kinematic variables of the three axes (x, y, z) are likely to be strongly correlated with each other in Table 5. Thus, only the values of the index in the X-axis (ML) are shown. The left and right sides are similar; only the left side is shown.
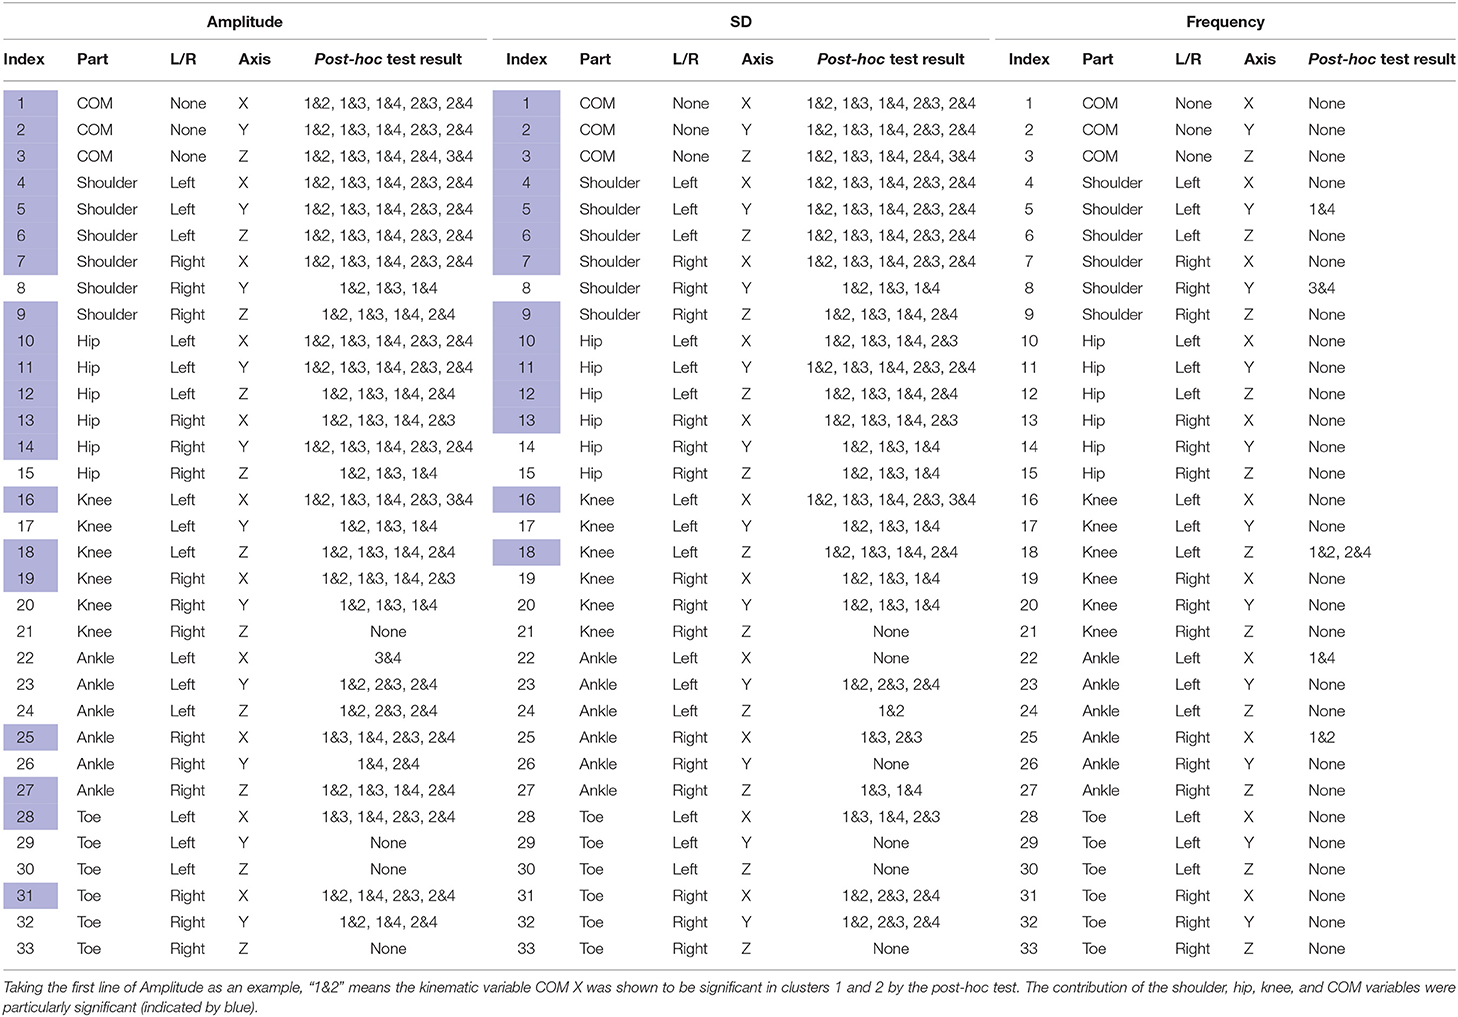
Table 5. Post-hoc test results for each axis of each body on the left or right side to determine significant kinematic variables.
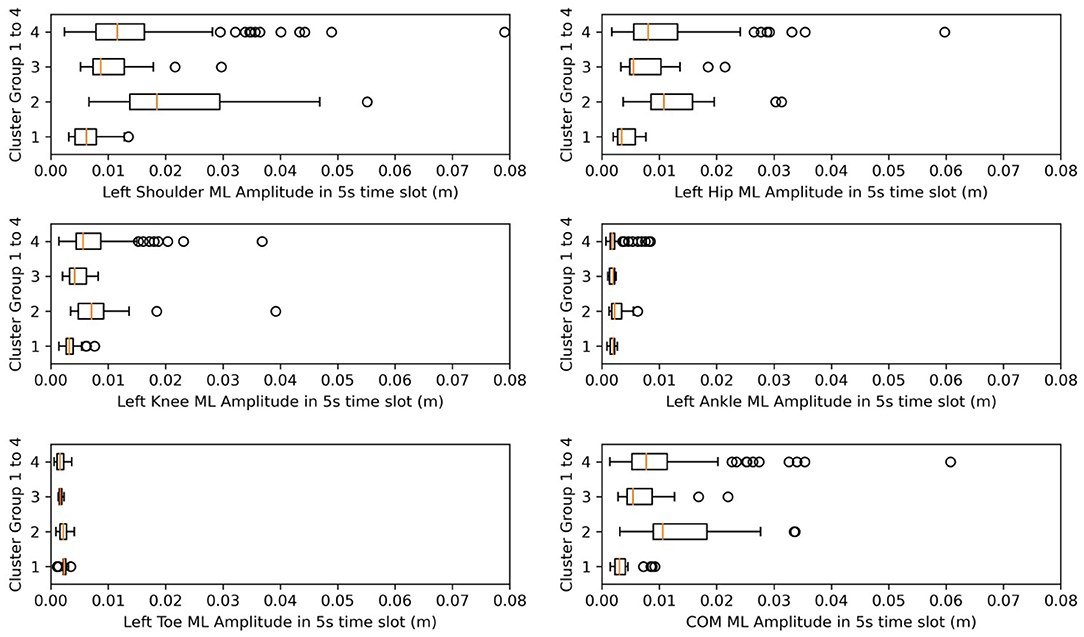
Figure 8. Box plots for amplitude in ML. X-axes represent the amplitude after normalization in the ML direction.
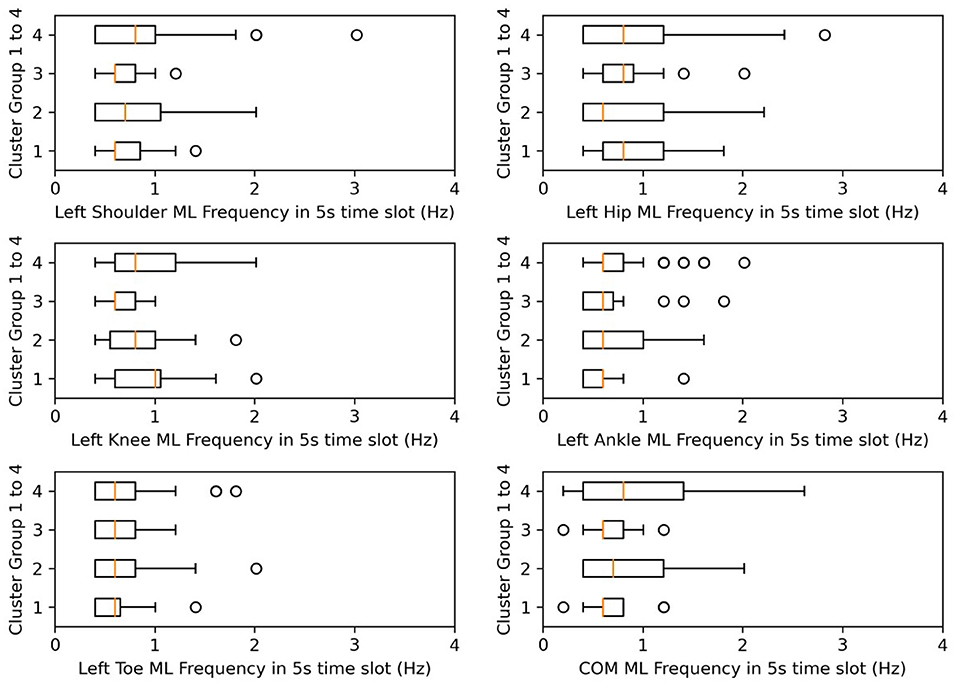
Figure 9. Box plots for frequency in ML. X-axes represent the postural-sway frequency in the ML direction.
Meanwhile, from Table 4, we find that from clusters 1 to 4, the days after onset value decreased. From Figure 8, we observed a pattern from clusters 1, 3, and 4 in which the amplitude increased, meaning that as days from post-stroke onset decreased, the postural-sway amplitude increased.
Then, we created the days-after-onset cluster table to explore the transition pattern of days after onset in CH and CI separately in Table 6, where we used numbers 1–4 and colors from blue to red to represent the clustered data from days after onset. The numbers from 0 to 1,000 indicate the days after onset for each cluster group. We can see that as the days after onset increased, CH patients transited from clusters 4 to 3, to 2, and to 1, in order, whereas for CI patients, they did not show a pronounced transition over time. Moreover, in Table 6, CH3, CI1, CI2, and CI4 was the cluster which was clustered into different clusters, because it is difficult to cluster them perfectly in machine learning. Clusters in which many data slots are clustered are considered to be the main clusters.
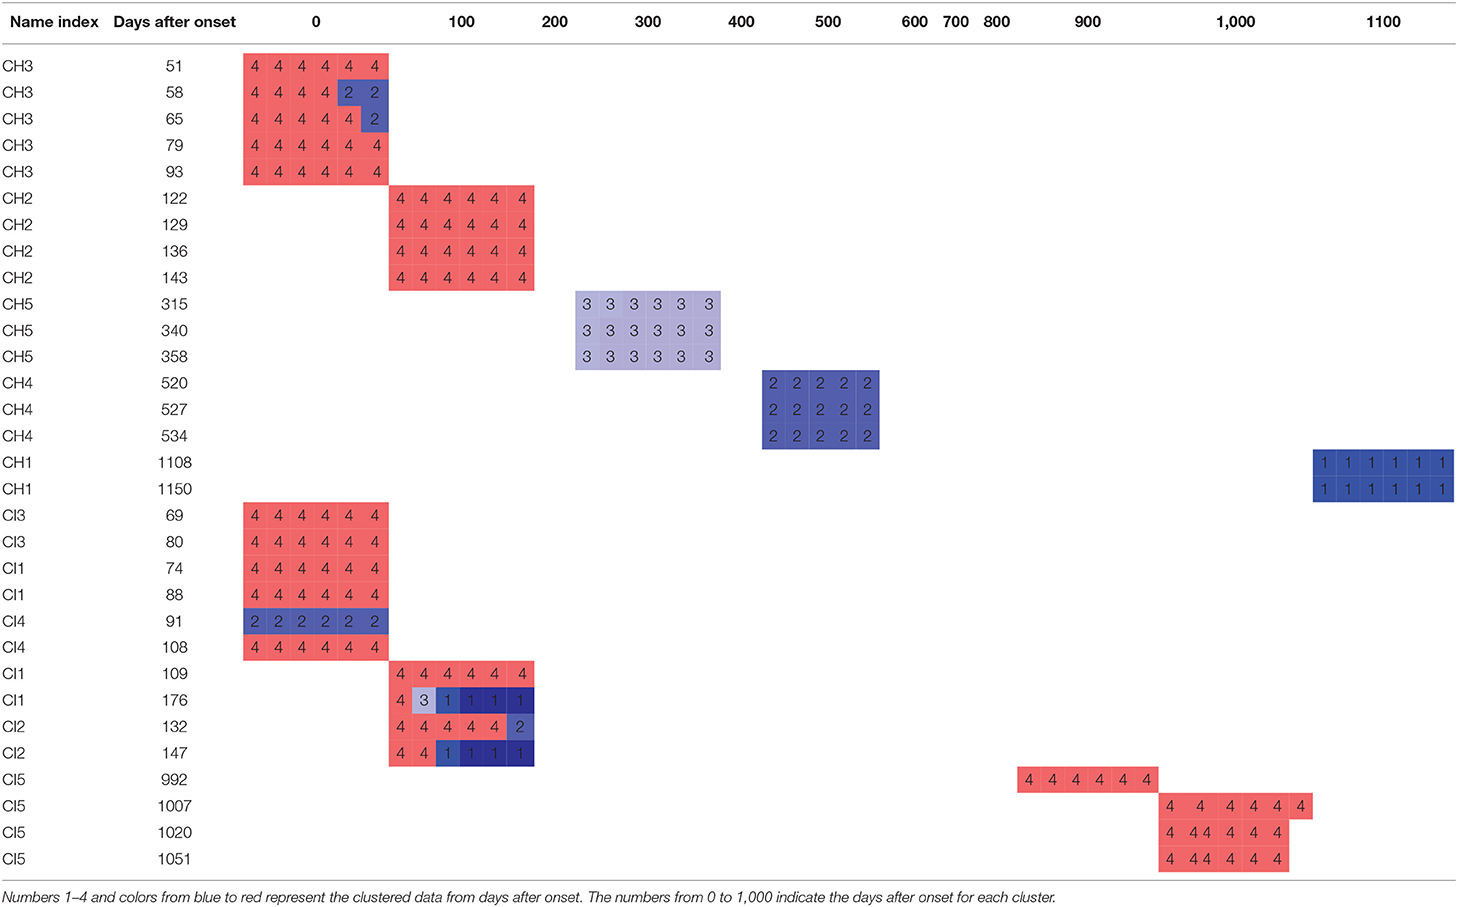
Table 6. Clustering by days after onset to explore the transition pattern of days after onset in CH and CI.
4. Discussion
This study aimed to determine and understand the postural-sway features of post-stroke patients in quiet standing postures. Using DTW-PAM, differences were observed between patient clusters. The markers' amplitude, SD, and frequency indicated that disease-days after onset and disease subtypes (CH or CI) contributed more to postural-sway features than did other features.
After analyzing Table 5, we determined that amplitude had a similar significance performance as the SD, and it had greater significance than did frequency in the clusters, meaning that amplitude and SD were more valuable than the frequency in the clusters. In particular, the differences were more pronounced in the shoulder, hip, and knee. This finding may provide a focus area for post-stroke patient therapy. From Figure 8, we found that the upper parts of limbs (e.g., shoulder, hip, and COM) had significantly larger amplitude values than did the lower parts of limbs (e.g., knee, ankle, and toes). This finding is similar to a previous study that showed that waist sway was more significant than leg sway (Dickstein and Abulaffio, 2000). From Table 4 and Figure 8, we found that as days from post-stroke onset decreased; the postural-sway amplitude increased in clusters 1, 3, and 4. However, the amplitude of cluster 2 did not follow this pattern, which may be due to age effects that there was a relationship between postural sway changing with age (Kim et al., 2010).
Frequency was not significantly different in the post-hoc test, but we found that the frequency of postural sway fell in 0.5–1.5 Hz for COM, and from cluster 3, CH subjects of lower age and lower days after onset kept their sway frequencies within 0.6–0.7 Hz. A previous researcher found that frequency of body sway fell in the range of 0.1–0.2 Hz (Koltermann et al., 2019), and because they also found that post-stroke increases sway frequency (Mizrahi et al., 1989), our finding was found to be reasonable.
Furthermore, in Table 6, we observed that CH-patient body postural sway gradually changed as days after onset increased (clusters 4 to 1). Meanwhile, CI-patient body postural sway did not show the same onset-days correlation. Another researcher found that CH patients made more significant recovery gains, although they had more excellent functional (motor) impairments (e.g., standing and walking) than CI patients. They also found that CH patients having the most severe disability improved more than those with CI of comparable severity (Kelly et al., 2003; Katrak et al., 2009). From this knowledge, we assumed that a CH onset-days correlation might emerge from their better recovery ability. This finding may give researchers and practitioners new ideas about sway-pattern changes during post-stroke patient rehabilitation. In addition, Table 6 shows that the group formed of CH3, CI1, CI2, and CI4 were clustered into different clusters. After observing their data plots and analyzing the patient demographic factors, we found they all had fewer days after onset (less than 180 days, subacute phases). During the subacute phases, the stroke patient recovers more noticably and is more unstable in muscle force than in the chronic phase (Kiran, 2012; Chow and Stokic, 2014). Hence, these patients exhibit different sway patterns, even over the same experiment duration, and data from the subacute phase patients is considered to be difficult to cluster. This hence might be reason why different slots for one person were clustered into different clusters.
This study has certain limitations. The first is that the number of subjects was only 10. With more subjects, more calculations and analyses could be performed. The second is that we only considered male patients. We plan to investigate more subjects, including female patients, and analyze their postural-sway characteristics in future research. The third is that we did not perform clustering for the healthy age-matched and young subjects. If we add such subjects, we could compared the postural sway among healthy human and stroke patients to determine which postural-sway characteristics are important, which will add meaning to the study.
5. Conclusion
This study evaluated the postural-sway features of post-stroke patients using a motion-capture system to collect standing posture data. After collecting stroke patients' multi-variable motion-capture standing posture data, we processed them into data slots of t seconds long. Subsequently, we determined the optimal length of the data slots and number of clusters, and clustered the t-s data slots into K cluster groups using the DTW-PAM method. Finally, to find the critical kinematic variables, we performed a post-hoc test. We found that the shoulder, hip, knee, and COM played essential roles in clustering, and the amplitude of the marker was more helpful than its frequency. Furthermore, we created a days-from-onset clustering table and a box plot of the shoulder, hip, knee, and COM variable amplitudes and frequency separately in ML direction using 5-s data slots. We found that as the days after onset increased, CH patients transited from cluster four to clusters 3, 2, and 1 of a four-cluster solution, whereas for CI patients, they did not show such pronounced transitions over time. The above finding would provide researchers new ideas about sway-pattern changes for post-stroke patient rehabilitation. In the following research, we plan to increase the number of subjects.
Data Availability Statement
The original contributions presented in the study are included in the article/Supplementary Material, further inquiries can be directed to the corresponding author/s.
Ethics Statement
The studies involving human participants were reviewed and approved by Fujita Health University, the University Ethics Committee. The patients/participants provided their written informed consent to participate in this study. Written informed consent was obtained from the individual(s) for the publication of any potentially identifiable images or data included in this article.
Author Contributions
DL conceived the ideas, designed the methodology, performed the programming, and wrote the paper. JO and KK supervised the paper and provided comments on the research directions. MM preformed the experiments and provided study materials. RC and KT reviewed and edited the paper. All authors have read and approve the final manuscript.
Funding
This work has been partially supported by JSPS KAKENHI 19H05730 and the Mohammed bin Salman Center for Future Science and Technology for Saudi–Japan Vision 2030 at The University of Tokyo (MbSC2030).
Conflict of Interest
The authors declare that the research was conducted in the absence of any commercial or financial relationships that could be construed as a potential conflict of interest.
Publisher's Note
All claims expressed in this article are solely those of the authors and do not necessarily represent those of their affiliated organizations, or those of the publisher, the editors and the reviewers. Any product that may be evaluated in this article, or claim that may be made by its manufacturer, is not guaranteed or endorsed by the publisher.
Supplementary Material
The Supplementary Material for this article can be found online at: https://www.frontiersin.org/articles/10.3389/fnhum.2021.731677/full#supplementary-material
References
Abdulhay, E., Arunkumar, N., Narasimhan, K., Vellaiappan, E., and Venkatraman, V. (2018). Gait and tremor investigation using machine learning techniques for the diagnosis of Parkinson disease. Future Gen. Comput. Syst. 83, 366–373. doi: 10.1016/j.future.2018.02.009
Bansil, S., Prakash, N., Kaye, J., Wrigley, S., Manata, C., Stevens-Haas, C., et al. (2012). Movement disorders after stroke in adults: a review. Tremor Other Hyperkinet. Movements 2:02. doi: 10.5334/tohm.110
Brandmaier, A. M. (2015). PDC: an R package for complexity-based clustering of time series. J. Stat. Softw. 67, 1–23. doi: 10.18637/jss.v067.i05
Caliñski, T., and Harabasz, J. (1974). “A dendrite method foe cluster analysis,” in Commun. Stat. 3, 1–27. doi: 10.1080/03610927408827101
Chern, J. S., Lo, C. Y., Wu, C. Y., Chen, C. L., Yang, S., and Tang, F. T. (2010). Dynamic postural control during trunk bending and reaching in healthy adults and stroke patients. Am. J. Phys. Med. Rehabil. 89, 186–197. doi: 10.1097/PHM.0b013e3181c56287
Cho, K., Lee, K., Lee, B., Lee, H., and Lee, W. (2014). Relationship between postural sway and dynamic balance in stroke patients. J. Phys. Therapy Sci. 26, 1989–1992. doi: 10.1589/jpts.26.1989
Chow, J. W., and Stokic, D. S. (2014). Variability, frequency composition, and complexity of submaximal isometric knee extension force from subacute to chronic stroke. Neuroscience 273, 189–198. doi: 10.1016/j.neuroscience.2014.05.018
Cuntoor, N., Kale, A., and Chellappa, R. (2003). “Combining multiple evidences for gait recognition,” in ICASSP, IEEE International Conference on Acoustics, Speech and Signal Processing - Proceedings (College Park, MD: IEEE), 33–36.
Das, S., Trutoiu, L., Murai, A., Alcindor, D., Oh, M., De La Torre, F., et al. (2011). “Quantitative measurement of motor symptoms in Parkinson's disease: a study with full-body motion capture data,” in Proceedings of the Annual International Conference of the IEEE Engineering in Medicine and Biology Society, EMBS (Pittsburgh, PA), 6789–6792. doi: 10.1109/IEMBS.2011.6091674
Davies, D. L., and Bouldin, D. W. (1979). A cluster separation measure. IEEE Trans. Pattern Anal. Mach. Intell. 1, 224–227. doi: 10.1109/TPAMI.1979.4766909
Dickstein, R., and Abulaffio, N. (2000). Postural sway of the affected and nonaffected pelvis and leg in stance of hemiparetic patients. Arch. Phys. Med. Rehabil. 81, 364–367. doi: 10.1016/S0003-9993(00)90085-6
Dunn, J. C. (1974). Well-separated clusters and optimal fuzzy partitions. J. Cybernet. 4, 95–104. doi: 10.1080/01969727408546059
Genolini, C., Alacoque, X., Sentenac, M., and Arnaud, C. (2015). Kml and kml3d: R packages to cluster longitudinal data. J. Stat. Softw. 65, 1–34. doi: 10.18637/jss.v065.i04
Giveans, M. R., Yoshida, K., Bardy, B., Riley, M., and Stoffregen, T. A. (2011). Postural sway and the amplitude of horizontal eye movements. Ecol. Psychol. 23, 247–266. doi: 10.1080/10407413.2011.617215
Halmi, Z., Stone, T. W., Dinya, E., and Málly, J. (2020). Postural instability years after stroke. J. Stroke Cerebrovasc. Dis. 29, 1–6. doi: 10.1016/j.jstrokecerebrovasdis.2020.105038
Katrak, P. H., Black, D., and Peeva, V. (2009). Do stroke patients with intracerebral hemorrhage have a better functional outcome than patients with cerebral infarction? PM R 1, 427–433. doi: 10.1016/j.pmrj.2009.03.002
Kelly, P. J., Furie, K. L., Shafqat, S., Rallis, N., Chang, Y., and Stein, J. (2003). Functional recovery following rehabilitation after hemorrhagic and ischemic stroke. Arch. Phys. Med. Rehabil. 84, 968–972. doi: 10.1016/S0003-9993(03)00040-6
Kim, J. W., Eom, G. M., Kim, C. S., Kim, D. H., Lee, J. H., Park, B. K., et al. (2010). Sex differences in the postural sway characteristics of young and elderly subjects during quiet natural standing. Geriatr. Gerontol. Int. 10, 191–198. doi: 10.1111/j.1447-0594.2009.00582.x
Kiran, S. (2012). What is the nature of poststroke language recovery and reorganization? ISRN Neurol. 2012, 1–13. doi: 10.5402/2012/786872
Koltermann, J. J., Gerber, M., Beck, H., and Beck, M. (2019). Validation of different filters for center of pressure measurements by a cross-section study. Technologies 7:68. doi: 10.3390/technologies7040068
Li, D., Kaminishi, K., Chiba, R., Takakusaki, K., Mukaino, M., and Ota, J. (2021). Evaluating quiet standing posture of post-stroke patients by classifying cerebral infarction and cerebral hemorrhage patients. Adv. Robot. 35, 878–888. doi: 10.1080/01691864.2021.1893218
Malik, O. A., and Lai, D. T. C. (2017). “Multivariate time series clustering analysis for human balance data,” in Lecture Notes in Computer Science, eds S. Phon-Amnuaisuk, S. P. Ang, and S. Y. Lee, (Seri Begawan: Springer), 112–125. doi: 10.1007/978-3-319-69456-6_10
Mannor, S., Jin, X., Han, J., Jin, X., Han, J., Jin, X., et al. (2011). “K-medoids clustering,” in Encyclopedia of Machine Learning, eds C. Sammut and G. I. Webb (Boston, MA: Springer US), 564–565. doi: 10.1007/978-0-387-30164-8_426
Matsuda, F., Mukaino, M., Ohtsuka, K., Tanikawa, H., Tsuchiyama, K., Teranishi, T., et al. (2016). Analysis of strategies used by hemiplegic stroke patients to achieve toe clearance. Jpn. J. Comp. Rehabil. Sci. 7, 111–118.
Mizrahi, J., Solzi, P., Ring, H., and Nisell, R. (1989). Postural stability in stroke patients: vectorial expression of asymmetry, sway activity and relative sequence of reactive forces. Med. Biol. Eng. Comput. 27, 181–190. doi: 10.1007/BF02446228
Mohd Razali, N., and Bee Wah, Y. (2011). Power comparisons of Shapiro-Wilk, Kolmogorov-Smirnov, Lilliefors and Anderson-Darling tests. J. Stat. Model. Anal. 2, 13–14.
Montero, P., and Vilar, J. A. (2014). TSclust: an R package for time series clustering. J. Stat. Softw. 62, 1–43. doi: 10.18637/jss.v062.i01
Paillex, R., and So, A. (2005). Changes in the standing posture of stroke patients during rehabilitation. Gait Post. 21, 403–409. doi: 10.1016/j.gaitpost.2004.04.011
Petitjean, F., Ketterlin, A., and Gançarski, P. (2011). A global averaging method for dynamic time warping, with applications to clustering. Pattern Recogn. 44, 678–693. doi: 10.1016/j.patcog.2010.09.013
Petri, D. (2002). Frequency-domain testing of waveform digitizers. IEEE Trans. Instrument. Measure. 51, 445–453. doi: 10.1109/TIM.2002.1017714
Pohlert, T. (2014). The pairwise multiple comparison of mean ranks package (PMCMR). R Package 27:27.
Rybarczyk, Y., Deters, J. K., Gonzalo, A. A., Esparza, D., Gonzalez, M., Villarreal, S., et al. (2018). Recognition of physiotherapeutic exercises through DTW and low-cost vision-based motion capture. Adv. Intell. Syst. Comput. 592, 348–360. doi: 10.1007/978-3-319-60366-7_33
Sardá-Espinosa, A. (2019). Time-series clustering in R Using the dtwclust package. R J. 11:41. doi: 10.32614/RJ-2019-023
Tobias, S., and Carlson, J. E. (1969). Brief report: Bartlett's test of sphericity and chance findings in factor analysis. Multivar. Behav. Res. 4, 375–377. doi: 10.1207/s15327906mbr0403_8
Wang, W., Li, K., Wei, N., Yin, C., and Yue, S. (2017). “Evaluation of postural instability in stroke patient during quiet standing,” in Proceedings of the Annual International Conference of the IEEE Engineering in Medicine and Biology Society, EMBS (Jinan), 2522–2525. doi: 10.1109/EMBC.2017.8037370
Keywords: clustering, dynamic time-warping, post-stroke, postural sway, standing posture
Citation: Li D, Kaminishi K, Chiba R, Takakusaki K, Mukaino M and Ota J (2021) Evaluation of Postural Sway in Post-stroke Patients by Dynamic Time Warping Clustering. Front. Hum. Neurosci. 15:731677. doi: 10.3389/fnhum.2021.731677
Received: 28 June 2021; Accepted: 09 November 2021;
Published: 03 December 2021.
Edited by:
Giovanni Di Pino, Campus Bio-Medico University, ItalyCopyright © 2021 Li, Kaminishi, Chiba, Takakusaki, Mukaino and Ota. This is an open-access article distributed under the terms of the Creative Commons Attribution License (CC BY). The use, distribution or reproduction in other forums is permitted, provided the original author(s) and the copyright owner(s) are credited and that the original publication in this journal is cited, in accordance with accepted academic practice. No use, distribution or reproduction is permitted which does not comply with these terms.
*Correspondence: Dongdong Li, bGlAcmFjZS50LnUtdG9reW8uYWMuanA=