 Jiayu Chen1*†
 Barnaly Rashid1,2†
 Qingbao Yu1
 Jingyu Liu1,3
 Dongdong Lin1
 Yuhui Du1,4
 Jing Sui1,5
 Vince D. Calhoun1,3,6
- 1Mind Research Network, Albuquerque, NM, United States
- 2Harvard Medical School, Harvard University, Boston, MA, United States
- 3Department of Electrical Engineering, University of New Mexico, Albuquerque, NM, United States
- 4School of Computer & Information Technology, Shanxi University, Taiyuan, China
- 5Brainnetome Center and National Laboratory of Pattern Recognition, Institute of Automation, Chinese Academy of Sciences, Beijing, China
- 6Departments of Neurosciences and Psychiatry, University of New Mexico School of Medicine, Albuquerque, NM, United States
Imaging genetics posits a valuable strategy for elucidating genetic influences on brain abnormalities in psychiatric disorders. However, association analysis between 2D genetic data (subject × genetic variable) and 3D first-level functional magnetic resonance imaging (fMRI) data (subject × voxel × time) has been challenging given the asymmetry in data dimension. A summary feature needs to be derived for the imaging modality to compute inter-modality association at subject level. In this work, we propose to use variability in resting state networks (RSNs) and functional network connectivity (FNC) as potential features for purpose of association analysis. We conducted a pilot study to investigate the proposed features in a dataset of 171 healthy controls and 134 patients with schizophrenia (SZ). We computed variability in RSN and FNC in a group independent component analysis framework and tested three types of variability metrics, namely Euclidean distance, Pearson correlation and Kullback-Leibler (KL) divergence. Euclidean distance and Pearson correlation metrics more effectively discriminated controls from patients than KL divergence. The group differences observed with variability in RSN and FNC were highly consistent, indicating patients presenting increased deviation from the cohort-common pattern of RSN and FNC than controls. The variability in RSN and FNC showed significant associations with network global efficiency, the more the deviation, the lower the efficiency. Furthermore, the RSN and FNC variability were found to associate with individual SZ risk SNPs as well as cumulative polygenic risk score for SZ. Collectively the current findings provide preliminary evidence for variability in RSN and FNC being promising imaging features that may find applications as biomarkers and in imaging genetic association analysis.
Introduction
Most psychiatric disorders have been characterized to present moderate to high heritability in family and twin studies (Kendler and Eaves, 2005). In the past decade, advancement in high-throughput genetic profiling techniques has enabled further characterization of the underlying genetic structure. Particularly for the five major psychiatric disorders, schizophrenia (SZ), bipolar disorder (BD), major depression, autism and attention deficit/hyper activity (ADHD), large genome wide association studies (GWAS) lend support for their polygenic nature, where single nucleotide polymorphisms (SNPs) were estimated to explain 17–29% of the variance in liability (Lee et al., 2013). Among the five disorders, the most well-characterized is schizophrenia, for which 108 genome-wide significant risk loci have been identified in a large GWAS of 36,989 cases and 113,075 controls (Ripke et al., 2014). Meanwhile, sample size is continuing to increase and has started to yield potential risk loci for other disorders (Sklar, 2012; Sullivan et al., 2013; Anney et al., 2017).
From the neurobiological perspective, patients with psychiatric disorders present brain structural and functional abnormalities, which may underlie the clinical manifestations. Characteristic abnormalities include extensive gray matter reductions compared with healthy controls and aberrant regional activations during various cognitive tasks (Manoach et al., 2000; Monks et al., 2004; Harris et al., 2006; Green et al., 2007; Ivleva et al., 2012). Meanwhile, there has been growing interest in resting state functional network analysis, where disrupted network coherence (He et al., 2007; Yu et al., 2013; Xu et al., 2015) and inter-network connectivity have been reported in several psychiatric disorders, including SZ (Calhoun et al., 2011; Bassett et al., 2012; Meda et al., 2012; Manoliu et al., 2013; Rashid et al., 2014) and BD (Calhoun et al., 2011; Yu et al., 2011; Meda et al., 2012; Rashid et al., 2014). Notably, resting state networks are suggested to be heritable (Glahn et al., 2010; Fu et al., 2015). Glahn et al. has reported a heritability of 0.42 for the default-mode network connectivity. In line with this, aberrant resting state functions have been noted in people at high risk of developing psychiatric disorders (Meda et al., 2016).
Thus there is a pressing need to characterize genetic underpinnings of brain abnormalities in psychiatric disorders which helps elucidate the biological mechanisms and inspire treatment therapies. A direct test on individual mutations' associations with individual brain phenotypes is straightforward, and has identified genetic loci related to reduced volumes in putamen and hippocampus (Hibar et al., 2015, 2017). However, this type of analysis in general suffers from insufficient power due to the moderate effect sizes of individual genetic variants. In contrast, multivariate multimodal techniques boost statistical power by mining genetic/imaging data to capture the interactive or integrated effect of multiple genetic variants/brain regions and assess the covariation or association of multiple data modalities, which is also considered as a type of fusion (Chen et al., 2013b; Liu and Calhoun, 2014; Vergara et al., 2014; Calhoun and Sui, 2016). Parallel independent component analysis (pICA) is a technique designed for this purpose, building upon ICA to conduct separate multivariate analysis in two data modalities and then optimizing the inter-modality association (Liu and Calhoun, 2014). It has found wide applications in integrating genetic and neuroimaging data including gray matter density, gray matter volume, and task-related activation (Meda et al., 2014; Pearlson et al., 2015).
While parallel ICA is designed for imaging genetic association analysis, its application is restricted to second-level functional magnetic resonance imaging (fMRI) data (i.e., either a time dimension or a spatial dimension, but not both; Liu et al., 2009; Meda et al., 2014). It would be desirable to extend the pICA approach to link genetics to first-level functional data for direct association optimization, which might better reveal genetic influence on coherent functional networks. To achieve data fusion between 2D genetic data (e.g., subject × SNP) and 3D neuroimaging data (e.g., subject × voxel × time), a summary feature needs to be derived for the imaging modality to associate with the genetic modality at subject level. Here we propose to utilize two features including variability in resting state network (RSN) and variability in functional network connectivity (FNC). Variability in RSN has been explored by Damoiseaux et al. (2006) in the context of cross-session reliability. Another study compared the overall inter-subject variability as measured with pairwise correlation in early-blinded subjects with that in sighted subjects to infer differences in cortical reorganization (Boldt et al., 2014). A more relevant work by Finn et al. has demonstrated that the functional connectivity profile of a specific subject obtained from one session is more similar to his/her own functional connectivity profile than others' obtained from a different session of the same condition, lending support for substantial and reproducible individual variability in connectivity (Finn et al., 2015). However, neither of these studies sought to quantify the individual variability at network or overall connectivity level, which may serve as potential neuroimaging biomarkers.
In the current work, we demonstrate a framework to estimate the variability in subject-specific RSN and FNC based on spatial group ICA. Theoretically, group-level components capture spatial coactivation patterns in brain shared across all the subjects, each component is an independent brain network. In this sense, a group-level component can be interpreted as a cohort-common pattern presenting a functional network template conserved in all the subjects. Consequently, it is worthwhile to investigate how much the RSN (i.e., component in resting state fMRI) and resulting FNC (i.e., cross correlation among components' time courses) deviate from the cohort-common pattern and whether this deviation may serve as a biomarker and be regulated by genetics. Our results suggest that variability in RSN and FNC consistently discriminate controls from patients with SZ and show preliminary SNP associations, lending support for it being a promising feature in imaging genetic association analysis.
Materials and Methods
Participants
We tested the proposed framework in a total of 305 subjects with good quality SNP and resting fMRI data aggregated from COBRE and FBIRN studies. Details regarding recruitment and data collection can be found in our previous publications (Damaraju et al., 2014; Yu et al., 2015; Aine et al., 2017; Chen et al., in press). The cohort consisted of 171 controls (123 males, 48 females; mean age 37.81) and 134 patients with SZ (115 males, 19 females; mean age 37.76). Informed consent was obtained from each participant prior to scanning in accordance with the Internal Review Boards of corresponding institutions. For the FBIRN study, 162 volumes, and for the COBRE study, 149 volumes of resting state scans were collected on 3-Tesla scanners with a TR of 2 s.
fMRI Data Preprocessing
Data processing was performed using a combination of toolboxes including AFNI (http://afni.nimh.nih.gov/afni), SPM (http://www.fil.ion.ucl.ac.uk/spm/software), GIFT (http://mialab.mrn.org/software/gift), and custom code written in Matlab. Imaging data were preprocessed using an automated SPM8-based preprocessing pipeline. Images were realigned using INRIalign (http://www-sop.inria.fr/epidaure/Collaborations/IRMf/INRIAlign.html) and slice-time correction was applied using the middle slice as the reference frame. Data were then spatially normalized to standard MNI space (http://www.mni.mcgill.ca/) and resampled to 3 × 3 × 3 mm voxels using the nonlinear registration implemented in the SPM toolbox. Finally, data were smoothed using 6 mm FWHM Gaussian kernel.
After initial standard preprocessing, the imaging data was decomposed into functionally homogeneous cortical and subcortical regions exhibiting temporally coherent activity using a high model order (75) group-level spatial ICA. Group ICA is an extension of ICA model that can be applied to group data for estimation of a set of common sources for all subjects (Calhoun et al., 2001; Calhoun and Adali, 2012).
SNP Data Preprocessing
The genotyping and genetic quality control procedures were same as described in our previous work (Chen et al., in press), which is briefly summarized here. DNA was extracted from blood or saliva samples. Illumina Human Omni1-Quad, Illumina Human Omni5, and Illumina Infinium MEGAEX + Psych were used for genotyping. No significant difference was noted in genotyping call rates between blood and saliva samples. A standard quality control (QC) (Chen et al., 2013b) was performed using PLINK (Purcell et al., 2007). Then imputation was conducted with SHAPEIT for pre-phasing (Delaneau et al., 2012), IMPUTE2 for imputation (Marchini and Howie, 2010), and the 1,000 Genomes data as the reference panel (Altshuler et al., 2012). Only markers with high imputation qualities (INFO score > 0.95) were retained. Finally linkage disequilibrium (LD) pruning (r2 > 0.9) was applied to yield 977,242 SNPs for which population structure was corrected using principal component analysis (Price et al., 2006).
Variability in RSN and FNC
For each spatial brain component and each subject, we computed the Euclidean distance, Pearson correlation and Kullback-Leibler (KL) divergence between the subject-level component and the group-level component to measure variability in RSN. Figure 1 presents a flowchart of the proposed framework for computing variability. The resting fMRI data is decomposed with spatial group ICA, before which a cohort-common group mask is first generated using the following method: (1) For each subject, we obtain the subject-level mask by locating the voxels that have activations greater than the mean activation across all the voxels; (2) We obtain the group mask as the intersection of all the subject-level masks. Only voxels in the group mask will be included in the subsequent group ICA analysis. The masked 2D subject-level data are concatenated along the time dimension for N subjects. Group-level components are estimated from the aggregated data, denoted as Sagg. Following the component estimation, subject-level components and time courses (Si and Ai for ith subject) are recovered from Sagg through back reconstruction. Then for each subject, variability metric is computed between Si and Sagg to quantify the variability of his/her function networks from the cohort-common pattern. The resulting variability matrix is denoted as P. For exploratory purpose, we tested three types of commonly used metric of difference, including Euclidean distance (ρED), Pearson correlation (ρPC), and KL divergence (ρKL), which enabled us to examine both linear and nonlinear relationships of similarity between the two patterns, as listed in Equations (1–3). The subscript i and j represent the subject and component index, respectively. K denotes the number of voxels and M denotes the number of bins for the histogram Q. Note that the subject-level variability in RSN is computed between subject-level component and group-level component that both span the whole group mask. This avoids underestimating the variability for someone who has an RSN pattern greatly different from the cohort-common pattern. In the current work, 75 components were extracted from group ICA following our previous work (Yu et al., 2011). For the computation of KL divergence, the number of bins was set to 100. The resulting variability features were evaluated for case vs. control differences while controlling for age, sex and dummy-coded site covariates, considering that various scanning protocols were used in data collection.
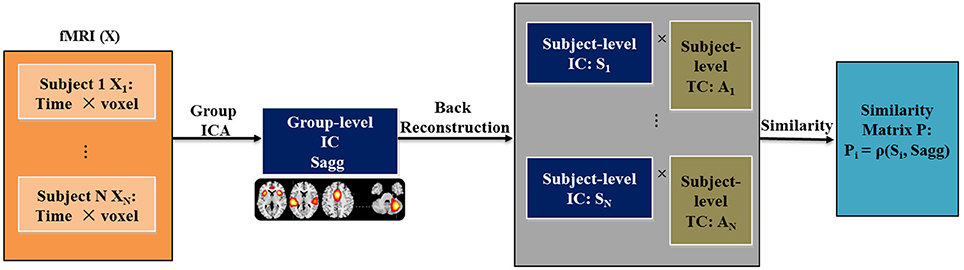
Figure 1. Graphic presentation of the proposed similarity matrix estimation.
We also evaluated the variability in FNC as a potential imaging feature. The connectivity matrix C was constructed as the cross-correlations among components' time courses, as shown in Equation (4) where i denotes subject index, j1 and j2 denote component indices. Then variability metric can be computed between the individual connectivity matrix Ci and the mean connectivity across all the subjects (). Equation (5) shows an example for the computation of Euclidean distance, where D stands for the number of connections. Specifically in the current work, 50 of 75 components were selected for FNC analysis following a common practice that (1) the components were characterized as not related to physiological signal, movement, or imaging artifacts; and (2) the components fell into the major cortical networks commonly used to construct FNC (Yu et al., 2011, 2015; Allen et al., 2014). The time courses of these 50 components were detrended, motion corrected, despiked and bandpass filtered at 0.01–0.08 Hz. An FNC matrix was constructed for each subject based on the correlations among time courses of these 50 components. Then the variability feature was computed based on normalized FNC (z-score) and evaluated for case vs. control difference while controlling for age, sex and dummy-coded site covariates. Considering that there were more controls than patients in this cohort, which might bias the results given that the mean FNC was employed as the reference pattern in this preliminary analysis, we repeated the above analysis using a balanced subcohort of 134 patients and 134 controls.
Variability vs. Global Efficiency
For a physiological interpretation, we assessed the relationship between proposed features of variability in RSN and FNC with FNC global efficiency. Global efficiency is known as measuring the overall efficiency of parallel information transfer in the network, which is defined as the inverse of the harmonic mean of the minimum path length between each pair of nodes (Latora and Marchiori, 2001). Specifically in this work, the global efficiency was computed using weighted and undirected connectivity matrix following (Rubinov and Sporns, 2010), where absolute values of time course correlations were used to capture the connection strength. Finally the average of the nodal level global efficiencies was computed to reflect the holistic network efficiency. This global efficiency measure was then evaluated for group difference as well as correlations with variability in RSN and FNC.
Genetic Association With Variability in RSN and FNC
The group-discriminating variability features were further investigated for potential genetic associations. Two sets of SNPs were selected for investigation, including: (a) a set of 5,907 SZ risk SNPs that showed a group discrimination p-value < 1 × 10⁻⁴ in the largest psychiatric genomic consortium (PGC) SZ GWAS, denoted as PGC set; and (b) a set of 418 SNPs residing in the BDNF and CREB family genes known to be involved in schizophrenia and neural development (Bramham and Messaoudi, 2005; Carlezon et al., 2005), denoted as CREB-BDNF set. For each SNP set, we first evaluated the associations between the identified group-discriminating RSN/FNC variability features and the individual SNPs using regression, where the variability in RSN/FNC was modeled as a function of a single SNP. Bonferroni correction was used to guard against false positives. In addition, we computed the polygenic risk score (PRS) for SZ of the whole set of SNPs, which was a linearly weighted sum of the genotype profiles with weights derived from the odds ratios of the PGC SZ GWAS (Purcell et al., 2009; Ripke et al., 2014). The group-discriminating variability features were then assessed for associations with PRS for SZ using regression where the variability feature was modeled as a function of PRS for SZ.
Data and Code Availability
Data analyzed in this study were aggregated from COBRE and FBIRN studies. The COBRE data have been deposited through COINS (https://coins.mrn.org). Availability of the FBIRN data is upon request from the principal investigator: Dr. Steven G. Potkin. We plan to release software implementing the approach within the Fusion ICA Toolbox (FIT: http://mialab.mrn.org/software/fit).
Results
Variability in RSN
The variability in RSN measured with Euclidean distance showed significant group differences (after Bonferroni correction) in 10 out of 75 components, majorly involved in visual and sensorimotor functions (IC12: inferior occipital gyrus; IC16: right fusiform gyrus; IC30: right middle temporal gyrus; IC35: left cuneus; IC39: right precentral gyrus; IC49: right cuneus; IC55: parahippocampal gyrus; IC58: postcentral gyrus; IC70: left thalamus and IC74: left lingual gyrus), as show in Figure 2. The directions of effects were consistent across these 10 components, with the patients presenting more deviation from the cohort-common networks compared with the controls. Variabilities in these 10 components all significantly and negatively correlated with global efficiency (mean correlation: −0.19, SD: 0.06). After controlling for diagnosis, 8 out of these 10 components still showed significant correlations with global efficiency. Meanwhile, patients presented significantly lower global efficiency (p = 9.89 × 10⁻⁶). For one of the group-discriminating components, IC55, a significant association (t = −4.99, p = 8.18 × 10⁻⁷, percentage of variance explained = 7.72%, passing Bonferroni correction) was observed between its variability measured with Euclidean distance and one SZ risk SNP, rs11926768 in TRANK1. Figure 3 shows the scatterplot of imaging genetic association between rs11926768 and IC55. No significant association was observed with CREB-BDNF SNPs or the PRS for SZ of either set.
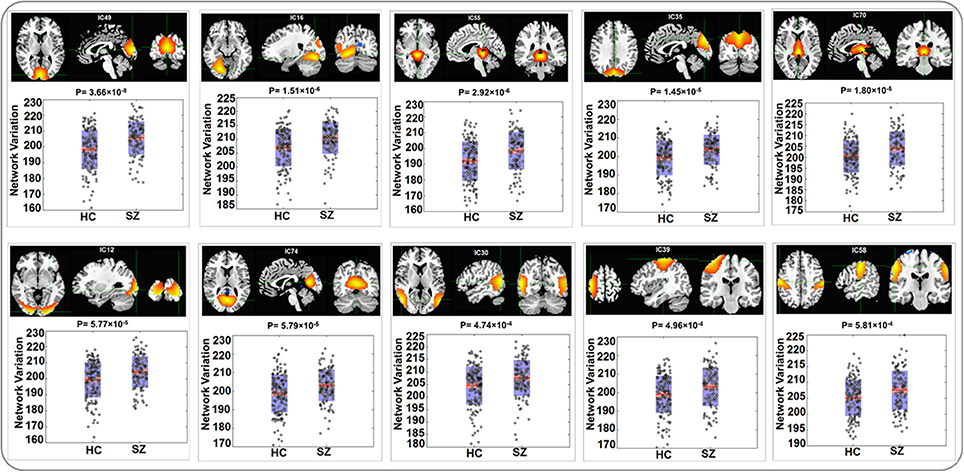
Figure 2. Spatial maps and boxplots of components showing significant group differences in RSN variability measured with Euclidean Distance.
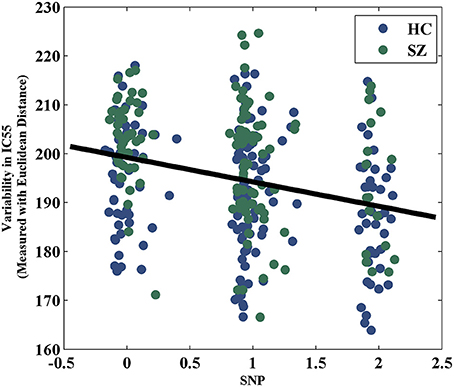
Figure 3. Scatterplot of rs11926768 and variability in IC55 measured with Euclidean distance.
When Pearson correlation was used to measure spatial variability, the same 10 components were noted to show significant group differences, which was not surprising given that features computed using Euclidean distance and Pearson correlation were highly negatively correlated (|r| > 0.99). The patient group presented lower correlations between the subject-level and group-level components, indicating more deviation from the cohort-common patterns. When measured with KL divergence (number of bins = 100), the variability in one of the cognitive control components (IC 26: Inferior Parietal Lobule) showed a significant group difference with patients showing higher divergence. For variability measured with either Pearson correlation or KL-divergence, no significant genetic association was noted.
Variability in FNC
For the visualization of FNC, The 50 selected RSNs were grouped into 6 functional domains, i.e., auditory (AUD), sensorimotor (SM), visual (VIS), cognitive control (CC), default-mode (DM) and cerebellum (CB), as show in Figure 4A. Figure 4B presents the mean FNC of the patient and control group, respectively. Significant group differences were noted when the variability in FNC was measured with Euclidean distance (p = 2.80 × 10⁻¹¹) or Pearson correlation (p = 1.96 × 10⁻¹¹). Given that these two features were again highly anti-correlated (r = −0.99), Figure 5 simply shows the boxplot of FNC variability measured with Euclidean distance for a demonstration. This group difference remained to be observed in the balanced subcohort of 134 patients and 134 controls, showing the same direction of change (p = 1.37 × 10⁻⁸ for Euclidean distance and p = 1.29 × 10⁻⁸ for Pearson correlation). The FNC variability significantly correlated with global efficiency: r = −0.28, p = 9.01 × 10⁻⁷ (Euclidean distance) and r = 0.28, p = 8.15 × 10⁻⁷ (Pearson Correlation), which remained to be significant after covarying out diagnosis (r = −0.21, p = 3.11 × 10⁻⁴ and r = 0.21, p = 2.97 × 10⁻⁴). Both FNC variabilities showed significant associations with PRS of the CREB-BDNF SNPs: t = 2.73, p = 6.64 × 10⁻³, percentage of variance explained = 2.41% (Euclidean distance) and t = −2.78, p = 5.83 × 10⁻³, percentage of variance explained = 2.48% (Pearson correlation). Figure 6 shows the scatterplot between PRS and variability in Euclidean distance for a demonstration. It can be seen that the higher the PRS for SZ, the larger the distance to the cohort-common pattern. Meanwhile, no significant association was noted with PRS of the PGC set or with individual candidate SNPs of either the PGC or the CREB-BDNF set.
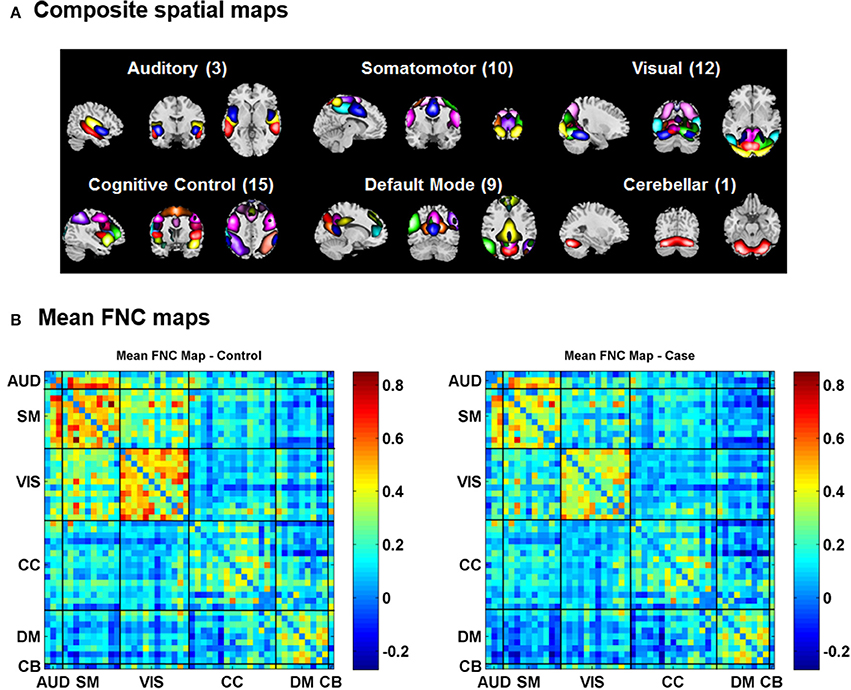
Figure 4. (A) Composite spatial maps of the resting-state networks. (B) Mean FNC maps of the control (left) and patient (right) groups.
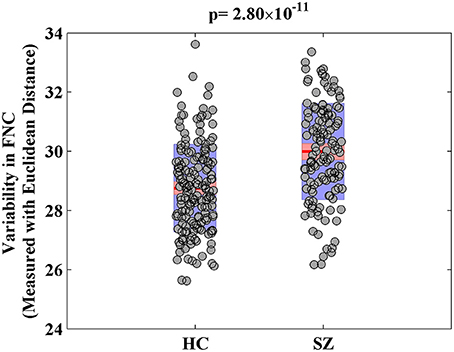
Figure 5. Boxplot of variability in FNC measured with Euclidean distance.
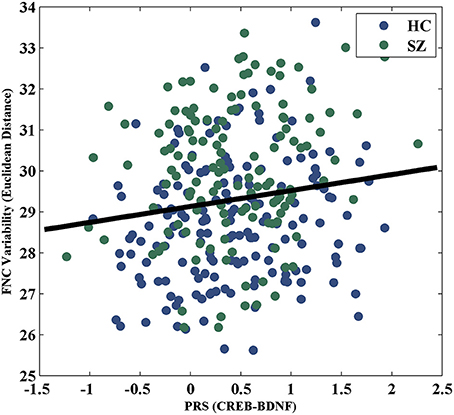
Figure 6. Scatterplot of PRS of CREB-BDNF SNPs and FNC variability measured with Euclidean distance.
Discussion
We demonstrate that variabilities in RSN and FNC may serve as meaningful brain-based phenotypes in imaging genetic association analysis. We proposed to compute subject-specific variabilities in a group ICA-based framework and tested three different variability metrics. The results indicate that Euclidean distance and Pearson correlation are apparently more sensitive than KL divergence in terms of detecting group difference related to SZ. The identified group differences consistently point to SZ patients presenting increased deviation from the cohort-common network and connectivity pattern. Furthermore, the RSN and FNC variability were found to associate with individual SZ risk SNPs as well as cumulative polygenic risk score for SZ, suggesting a genetic regulation.
The identified 10 RSNs where variability measured with Euclidean distance or Pearson correlation showed significant group differences are mostly involved in visual and sensorimotor functions. Previous studies reported impaired functional activities in both visual and sensorimotor regions in SZ (Schröder et al., 1995; Butler et al., 2001, 2005). For instance, IC49 that showed the most significant group difference (Euclidean distance: p-value = 3.66 × 10⁻⁸; Pearson correlation: p-value = 3.39 × 10⁻⁸) highlighted the right cuneus region. This visual component has been found to show hyperactivation in SZ patients while performing facial emotion discrimination tasks (Seiferth et al., 2009; Habel et al., 2010), suggesting it plays an important role in dysfunctional emotion recognition in SZ patients. IC55 is one significant component that did not fall into visual or sensorimotor domain, highlighting the parahippocampal gyrus and thalamus. These regions have also been documented to show functional anomalies in SZ patients. Specifically, abnormal activity in parahippocampal gyrus has shown association with auditory hallucination in SZ (Silbersweig et al., 1995; Diederen et al., 2010; Escartí et al., 2010).
We also tested how variability in FNC differed between patients with SZ and healthy controls. The results concurred with the observations for variability in RSN, suggesting patients' FNC patterns showing larger distance and lower correlation to the mean FNC across the cohort. In the current analysis, we simply used the mean FNC as the cohort-common template for assessing subject-level variability. The fact that this may not be the ideal template does not hinder it being revealed that patients presented FNC patterns more distant from the cohort-common pattern than controls. The additional analysis using the subcohort of balanced patients and controls alleviated the possibility that the findings being biased due to the controls contributing more to the mean FNC. There have been extensive studies on FNC in the context of SZ, which has been documented for dysconnectivity in distributed brain regions including default-mode (Whitfield-Gabrieli and Ford, 2012), frontotemporal (Lawrie et al., 2002), and frontoparietal (Deserno et al., 2012) networks. While both hyper- and hypo-connectivity have been noted for individual networks in SZ, they appear to contribute in the same direction to the holistic variability feature, resulting in higher variability. Collectively, the analysis of variabilities in RSN and FNC suggest that the brains of patients with SZ deviate from the cohort-common pattern in both spatial and temporal domain.
The physiological interpretation of the variability features remains to be elucidated. For the variability in FNC, it likely captures the holistic network deviation from a “normal construction” in the time domain. We speculate this might underlie functional integration. To test this hypothesis, we assessed the correlation between variability in FNC and global efficiency, the latter suggested as a superior measure of integration (Achard and Bullmore, 2007; Rubinov and Sporns, 2010). As expected, we observed a significant negative correlation between variability in FNC and global efficiency, which indicated that more deviation from the mean FNC associated with lower global efficiency. This observation not only provides a physiological interpretation of part of the variance captured by the variability in FNC, it also lends support for the mean FNC to some extent reflecting a “normal construction” which likely relates to optimal global efficiency. The variability in RSN depicts the deviation of network's spatial construction from the cohort-common pattern. This feature also correlated with global efficiency, though less significantly than variability in FNC, which is not surprising given that global efficiency is largely a measure of FNC. Considering that variability in RSN indicates shift of network centers, we speculate this feature may directly relate to wiring cost, i.e., the anatomical distance between functional nodes (Alexander-Bloch et al., 2013), which awaits further verification.
Some preliminary genetic associations have been noted with the proposed variability features. The variability in IC55 showed a significant correlation with rs11926768 residing in TRANK1. As shown in Figure 2, IC55 highlights the parahippocampal gyrus and thalamus. TRANK1 has been identified as one of the top risk genes for BD in a large GWAS (Chen et al., 2013a). Particularly, valproic acid, a treatment of mania, has been demonstrated to increase TRANK1 mRNA expression, suggesting a relevance of this gene to emotional instability (Chen et al., 2013a). Meanwhile, TRANK1 also confers SZ risk in PGC SZ GWAS (Ripke et al., 2014) and mood disturbances are common in SZ (Craddock et al., 2009). Together, these observations indicate a possibility of TRANK1 being a common risk gene for SZ and BD and these two disorders partially converging on mood dimension (Ruderfer et al., 2014), for which some preliminary evidence has been provided (Goes et al., 2012). Echoing the genetic interpretation, the brain regions highlighted by IC55, parahippocampal gyrus and thalamus, are well characterized for their role in mood and emotion (Dasari et al., 1999; Strakowski et al., 2005; Drevets et al., 2008), lending support for the imaging genetic association in the current work. Another imaging genetic association was observed between PRS for SZ of CREB-BDNF SNPs and the variability in FNC. BDNF, regulated by CREB (Lonze and Ginty, 2002; Carlezon et al., 2005), plays an important role in synaptic plasticity (Schinder and Poo, 2000; Bramham and Messaoudi, 2005) which relates to functional connectivity (Sporns et al., 2000, 2005; Bullmore and Sporns, 2009; Van Dijk et al., 2010). Thus the observed association indicates a portion of SZ risk may disrupt synaptic plasticity which further leads to FNC deficits in SZ. Both imaging genetic associations warrant independent replications.
In summary, we propose to investigate subject-level variability from a cohort-common pattern in RSN and FNC as potential features for fusion of genetic and first-level resting fMRI data. We demonstrate that the proposed features have clinical relevance, revealing that patients with SZ present larger deviations from the cohort-common pattern in both spatial (RSN) and temporal (FNC) domain, and these variabilities show relations to global efficiency of brain connectivity. We also provide some preliminary evidence for genetic associations with the proposed features, lending support for their potential application to imaging genetic association. While the current findings answer a few top questions about the proposed model, one limitation lies in that we simply used a cohort-common pattern as the reference to compute the subject-specific variability. Our future work involves a comprehensive investigation on other potential references. We also expect to characterize the heritability of the variability features as well as complete the physiological interpretation before implementing the feature into the current parallel ICA framework.
Ethics Statement
This study was carried out in accordance with the recommendations of the Internal Review Boards of the participating institutions with written informed consent from all subjects. All subjects gave written informed consent in accordance with the Declaration of Helsinki. The protocol was approved by the Internal Review Boards of the participating institutions.
Author Contributions
JC and VC designed research; JC conducted analyses; JC and BR wrote the paper. The remaining authors contributed to the recruitment, data collection or processing for the participating cohorts of the study. All authors critically reviewed content and approved final version for publication.
Conflict of Interest Statement
The authors declare that the research was conducted in the absence of any commercial or financial relationships that could be construed as a potential conflict of interest.
Acknowledgments
This project was funded by the National Institutes of Health (P20GM103472, 1R01EB006841, and R01MH106655); National Science Foundation (1539067); National Natural Science Foundation of China (61703253, 81471367, and 61773380); Natural Science Foundation of Shanxi (2016021077); and The Strategic Priority Research Program of the Chinese Academy of Sciences (XDB02060005).
References
Achard, S., and Bullmore, E. T. (2007). Efficiency and cost of economical brain functional networks. PLoS Comput. Biol. 3, 174–183. doi: 10.1371/journal.pcbi.0030017
Aine, C., Bockholt, H. J., Bustillo, J., Canive, J., Caprihan, A., Gasparovic, C., et al. (2017). Multimodal imaging in schizophrenia: description and dissemination. NeuroInformatics 15, 343–364. doi: 10.1007/s12021-017-9338-9
Alexander-Bloch, A. F., Vertes, P. E., Stidd, R., Lalonde, F., Clasen, L., Rapoport, J., et al. (2013). The anatomical distance of functional connections predicts brain network topology in health and schizophrenia. Cerebral Cortex 23, 127–138. doi: 10.1093/cercor/bhr388
Allen, E. A., Damaraju, E., Plis, S. M., Erhardt, E. B., Eichele, T., and Calhoun, V. D. (2014). Tracking whole-brain connectivity dynamics in the resting state. Cereb. Cortex 24, 663–676. doi: 10.1093/cercor/bhs352
Altshuler, D. M., Durbin, R. M., Abecasis, G. R., Bentley, D. R., Chakravarti, A., Clark, A. G., et al. (2012). An integrated map of genetic variation from 1,092 human genomes. Nature 491, 56–65. doi: 10.1038/nature11632
Anney, R. J. L., Ripke, S., Anttila, V., Grove, J., Holmans, P., Huang, H., et al. (2017). Meta-analysis of GWAS of over 16,000 individuals with autism spectrum disorder highlights a novel locus at 10q24.32 and a significant overlap with schizophrenia. Mol. Autism 8:21. doi: 10.1186/s13229-017-0137-9
Bassett, D. S., Nelson, B. G., Mueller, B. A., Camchong, J., and Lim, K. O. (2012). Altered resting state complexity in schizophrenia. Neuroimage 59, 2196–2207. doi: 10.1016/j.neuroimage.2011.10.002
Boldt, R., Seppa, M., Malinen, S., Tikka, P., Hari, R., and Carlson, S. (2014). Spatial variability of functional brain networks in early-blind and sighted subjects. Neuroimage 95, 208–216. doi: 10.1016/j.neuroimage.2014.03.058
Bramham, C. R., and Messaoudi, E. (2005). BDNF function in adult synaptic plasticity: the synaptic consolidation hypothesis. Prog. Neurobiol. 76, 99–125. doi: 10.1016/j.pneurobio.2005.06.003
Bullmore, E. T., and Sporns, O. (2009). Complex brain networks: graph theoretical analysis of structural and functional systems. Nat. Rev. Neurosci. 10, 186–198. doi: 10.1038/nrn2575
Butler, P. D., Schechter, I., Zemon, V., Schwartz, S. G., Greenstein, V. C., Gordon, J., et al. (2001). Dysfunction of early-stage visual processing in schizophrenia. Am. J. Psychiatry 158, 1126–1133. doi: 10.1176/appi.ajp.158.7.1126
Butler, P. D., Zemon, V., Schechter, I., Saperstein, A. M., Hoptman, M. J., Lim, K. O., et al. (2005). Early-stage visual processing and cortical amplification deficits in schizophrenia. Arch. Gen. Psychiatry 62, 495–504. doi: 10.1001/archpsyc.62.5.495
Calhoun, V. D., and Adali, T. (2012). Multisubject independent component analysis of fMRI: a decade of intrinsic networks, default mode, and neurodiagnostic discovery. IEEE Rev. Biomed. Eng. 5, 60–73. doi: 10.1109/RBME.2012.2211076
Calhoun, V. D., Adali, T., Pearlson, G. D., and Pekar, J. (2001). A method for making group inferences from functional MRI data using independent component analysis. Hum. Brain Mapp. 14, 140–151. doi: 10.1002/hbm.1048
Calhoun, V. D., and Sui, J. (2016). Multimodal fusion of brain imaging data: a key to finding the missing link (s) in complex mental illness. Biol. Psychiatry Cogn. Neurosci. Neuroimaging 1, 230–244. doi: 10.1016/j.bpsc.2015.12.005
Calhoun, V. D., Sui, J., Kiehl, K., Turner, J., Allen, E., and Pearlson, G. (2011). Exploring the psychosis functional connectome: aberrant intrinsic networks in schizophrenia and bipolar disorder. Front. psychiatry 2:75. doi: 10.3389/fpsyt.2011.00075
Carlezon, W. A., Duman, R. S., and Nestler, E. J. (2005). The many faces of CREB. Trends Neurosci. 28, 436–445. doi: 10.1016/j.tins.2005.06.005
Chen, D. T., Jiang, X., Akula, N., Shugart, Y. Y., Wendland, J. R., Steele, C. J. M., et al. (2013a). Genome-wide association study meta-analysis of European and Asian-ancestry samples identifies three novel loci associated with bipolar disorder. Mol. Psychiatry 18, 195–205. doi: 10.1038/mp.2011.157
Chen, J., Calhoun, V. D., Lin, D., Perrone-Bizzozero, N. I., Bustillo, J. R., Pearlson, G. D., et al. (in press). Shared genetic risk of schizophrenia gray matter reduction in 6p22.1. Schizophr. Bull.
Chen, J., Calhoun, V. D., Pearlson, G. D., Perrone-Bizzozero, N., Sui, J., Turner, J. A., et al. (2013b). Guided exploration of genomic risk for gray matter abnormalities in schizophrenia using parallel independent component analysis with reference. Neuroimage 83, 384–396. doi: 10.1016/j.neuroimage.2013.05.073
Craddock, N., O'donovan, M. C., and Owen, M. J. (2009). Psychosis Genetics: modeling the relationship between schizophrenia, bipolar disorder, and mixed (or “schizoaffective”) psychoses. Schizophr. Bull. 35, 482–490. doi: 10.1093/schbul/sbp020
Damaraju, E., Allen, E., Belger, A., Ford, J., Mcewen, S., Mathalon, D., et al. (2014). Dynamic functional connectivity analysis reveals transient states of dysconnectivity in schizophrenia. Neuroimage Clin. 5, 298–308. doi: 10.1016/j.nicl.2014.07.003
Damoiseaux, J. S., Rombouts, S. A. R. B., Barkhof, F., Scheltens, P., Stam, C. J., Beckmann, C. F., et al. (2006). Consistent resting-state networks across healthy subjects. Proc. Natl. Acad. Sci. U.S.A. 103, 13848–13853. doi: 10.1073/pnas.0601417103
Dasari, M., Friedman, L., Jesberger, J., Stuve, T. A., Findling, R. L., Swales, T. P., et al. (1999). A magnetic resonance imaging study of thalamic area in adolescent patients with either schizophrenia or bipolar disorder as compared to healthy controls. Psychiatry Res. 91, 155–162. doi: 10.1016/S0925-4927(99)00028-1
Delaneau, O., Marchini, J., and Zagury, J. F. (2012). A linear complexity phasing method for thousands of genomes. Nat. Methods 9, 179–181. doi: 10.1038/nmeth.1785
Deserno, L., Sterzer, P., Wustenberg, T., Heinz, A., and Schlagenhauf, F. (2012). Reduced prefrontal-parietal effective connectivity and working memory deficits in schizophrenia. J. Neurosci. 32, 12–20. doi: 10.1523/JNEUROSCI.3405-11.2012
Diederen, K. M., Neggers, S. F., Daalman, K., Blom, J. D., Goekoop, R., Kahn, R. S., et al. (2010). Deactivation of the parahippocampal gyrus preceding auditory hallucinations in schizophrenia. Am. J. Psychiatry 167, 427–435. doi: 10.1176/appi.ajp.2009.09040456
Drevets, W. C., Price, J. L., and Furey, M. L. (2008). Brain structural and functional abnormalities in mood disorders: implications for neurocircuitry models of depression. Brain Struct. Funct. 213, 93–118. doi: 10.1007/s00429-008-0189-x
Escartí, M. J., De La Iglesia-Vayá, M., Martí-Bonmatí, L., Robles, M., Carbonell, J., Lull, J. J., et al. (2010). Increased amygdala and parahippocampal gyrus activation in schizophrenic patients with auditory hallucinations: an fMRI study using independent component analysis. Schizophr. Res. 117, 31–41. doi: 10.1016/j.schres.2009.12.028
Finn, E. S., Shen, X. L., Scheinost, D., Rosenberg, M. D., Huang, J., Chun, M. M., et al. (2015). Functional connectome fingerprinting: identifying individuals using patterns of brain connectivity. Nat. Neurosci. 18, 1664–1671. doi: 10.1038/nn.4135
Fu, Y., Ma, Z., Hamilton, C., Liang, Z., Hou, X., Ma, X., et al. (2015). Genetic influences on resting-state functional networks: a twin study. Hum. Brain Mapp. 36, 3959–3972. doi: 10.1002/hbm.22890
Glahn, D. C., Winkler, A., Kochunov, P., Almasy, L., Duggirala, R., Carless, M., et al. (2010). Genetic control over the resting brain. Proc. Natl. Acad. Sci. U.S.A. 107, 1223–1228. doi: 10.1073/pnas.0909969107
Goes, F. S., Hamshere, M. L., Seifuddin, F., Pirooznia, M., Belmonte-Mahon, P., Breuer, R., et al. (2012). Genome-wide association of mood-incongruent psychotic bipolar disorder. Transl. Psychiatry 2:e180. doi: 10.1038/tp.2012.106
Green, M. J., Cahill, C. M., and Malhi, G. S. (2007). The cognitive and neurophysiological basis of emotion dysregulation in bipolar disorder. J. Affect. Disord. 103, 29–42. doi: 10.1016/j.jad.2007.01.024
Habel, U., Chechko, N., Pauly, K., Koch, K., Backes, V., Seiferth, N., et al. (2010). Neural correlates of emotion recognition in schizophrenia. Schizophr. Res. 122, 113–123. doi: 10.1016/j.schres.2010.06.009
Harris, G. J., Chabris, C. F., Clark, J., Urban, T., Aharon, I., Steele, S., et al. (2006). Brain activation during semantic processing in autism spectrum disorders via functional magnetic resonance imaging. Brain Cogn. 61, 54–68. doi: 10.1016/j.bandc.2005.12.015
He, Y., Wang, L., Zang, Y., Tian, L., Zhang, X., Li, K., et al. (2007). Regional coherence changes in the early stages of Alzheimer's disease: a combined structural and resting-state functional MRI study. Neuroimage 35, 488–500. doi: 10.1016/j.neuroimage.2006.11.042
Hibar, D. P., Adams, H. H. H., Jahanshad, N., Chauhan, G., Stein, J. L., Hofer, E., et al. (2015). Common genetic variants influence human subcortical brain structures. Nature 520, 224–229. doi: 10.1038/nature14101
Hibar, D. P., Adams, H. H., Jahanshad, N., Chauhan, G., Stein, J. L., Hofer, E., et al. (2017). Novel genetic loci associated with hippocampal volume. Nat. Commun. 18:13624. doi: 10.1038/ncomms13624
Ivleva, E. I., Bidesi, A. S., Thomas, B. P., Meda, S. A., Francis, A., Moates, A. F., et al. (2012). Brain gray matter phenotypes across the psychosis dimension. Psychiatry Res. Neuroimaging 204, 13–24. doi: 10.1016/j.pscychresns.2012.05.001
Kendler, K. S., and Eaves, L. J. (2005). Psychiatric Genetics (Review of Psychiatry). Arlington, VA: American Psychiatric Association.
Latora, V., and Marchiori, M. (2001). Efficient behavior of small-world networks. Phys. Rev. Lett. 87:198701. doi: 10.1103/PhysRevLett.87.198701
Lawrie, S. M., Buechel, C., Whalley, H. C., Frith, C. D., Friston, K. J., and Johnstone, E. C. (2002). Reduced frontotemporal functional connectivity in schizophrenia associated with auditory hallucinations. Biol. Psychiatry 51, 1008–1011. doi: 10.1016/S0006-3223(02)01316-1
Lee, S. H., Ripke, S., Neale, B. M., Faraone, S. V., Purcell, S. M., Perlis, R. H., et al. (2013). Genetic relationship between five psychiatric disorders estimated from genome-wide SNPs. Nature Genet. 45, 984–994. doi: 10.1038/ng.2711
Liu, J., Kiehl, K. A., Pearlson, G., Perrone-Bizzozero, N. I., Eichele, T., and Calhoun, V. D. (2009). Genetic determinants of target and novelty-related event-related potentials in the auditory oddball response. Neuroimage 46, 809–816. doi: 10.1016/j.neuroimage.2009.02.045
Liu, J., and Calhoun, V. D. (2014). A review of multivariate analyses in imaging genetics. Front. Neuroinform. 8:29. doi: 10.3389/fninf.2014.00029
Lonze, B. E., and Ginty, D. D. (2002). Function and regulation of CREB family transcription factors in the nervous system. Neuron 35, 605–623. doi: 10.1016/S0896-6273(02)00828-0
Manoach, D. S., Gollub, R. L., Benson, E. S., Searl, M. M., Goff, D. C., Halpern, E., et al. (2000). Schizophrenic subjects show aberrant fMRI activation of dorsolateral prefrontal cortex and basal ganglia during working memory performance. Biol. Psychiatry 48, 99–109. doi: 10.1016/S0006-3223(00)00227-4
Manoliu, A., Riedl, V., Doll, A., Bäuml, J. G., Mühlau, M., Schwerthöffer, D., et al. (2013). Insular dysfunction reflects altered between-network connectivity and severity of negative symptoms in schizophrenia during psychotic remission. Front. hum. neurosci. 7:216. doi: 10.3389/fnhum.2013.00216
Marchini, J., and Howie, B. (2010). Genotype imputation for genome-wide association studies. Nat. Rev. Genet. 11, 499–511. doi: 10.1038/nrg2796
Meda, S. A., Clementz, B. A., Sweeney, J. A., Keshavan, M. S., Tamminga, C. A., Ivleva, E. I., et al. (2016). Examining functional resting-state connectivity in psychosis and its subgroups in the bipolar-schizophrenia network on intermediate phenotypes cohort. Biol. Psychiatry Cogn. Neurosci. Neuroimaging 1, 488–497. doi: 10.1016/j.bpsc.2016.07.001
Meda, S. A., Gill, A., Stevens, M. C., Lorenzoni, R. P., Glahn, D. C., Calhoun, V. D., et al. (2012). Differences in resting-state functional magnetic resonance imaging functional network connectivity between schizophrenia and psychotic bipolar probands and their unaffected first-degree relatives. Biol. Psychiatry 71, 881–889. doi: 10.1016/j.biopsych.2012.01.025
Meda, S. A., Ruaño, G., Windemuth, A., O'neil, K., Berwise, C., Dunn, S. M., et al. (2014). Multivariate analysis reveals genetic associations of the resting default mode network in psychotic bipolar disorder and schizophrenia. Proc. Natl. Acad. Sci. U.S.A. 111, E2066–E2075. doi: 10.1073/pnas.131309311
Monks, P. J., Thompson, J. M., Bullmore, E. T., Suckling, J., Brammer, M. J., Williams, S. C., et al. (2004). A functional MRI study of working memory task in euthymic bipolar disorder: evidence for task-specific dysfunction. Bipolar Disord. 6, 550–564. doi: 10.1111/j.1399-5618.2004.00147.x
Pearlson, G. D., Calhoun, V. D., and Liu, J. (2015). An introductory review of parallel independent component analysis (p-ICA) and a guide to applying p-ICA to genetic data and imaging phenotypes to identify disease-associated biological pathways and systems in common complex disorders. Front. Genet. 6:276. doi: 10.3389/fgene.2015.00276
Price, A. L., Patterson, N. J., Plenge, R. M., Weinblatt, M. E., Shadick, N. A., and Reich, D. (2006). Principal components analysis corrects for stratification in genome-wide association studies. Nat. Genet. 38, 904–909. doi: 10.1038/ng1847
Purcell, S. M., Wray, N. R., Stone, J. L., Visscher, P. M., O'donovan, M. C., Sullivan, P. F., et al. (2009). Common polygenic variation contributes to risk of schizophrenia and bipolar disorder. Nature 460, 748–752. doi: 10.1038/nature08185
Purcell, S., Neale, B., Todd-Brown, K., Thomas, L., Ferreira, M. A., Bender, D., et al. (2007). PLINK: a tool set for whole-genome association and population-based linkage analyses. Am. J. Hum. Genet. 81, 559–575. doi: 10.1086/519795
Rashid, B., Damaraju, E., Pearlson, G. D., and Calhoun, V. D. (2014). Dynamic connectivity states estimated from resting fMRI Identify differences among schizophrenia, bipolar disorder, and healthy control subjects. Front. Hum. Neurosci. 8:897. doi: 10.3389/fnhum.2014.00897
Ripke, S., Neale, B. M., Corvin, A., Walters, J. T. R., Farh, K. H., Holmans, P. A., et al. (2014). Biological insights from 108 schizophrenia-associated genetic loci. Nature 511, 421–427. doi: 10.1038/nature13595
Rubinov, M., and Sporns, O. (2010). Complex network measures of brain connectivity: uses and interpretations. Neuroimage 52, 1059–1069. doi: 10.1016/j.neuroimage.2009.10.003
Ruderfer, D. M., Fanous, A. H., Ripke, S., McQuillin, A., Amdur, R. L., Gejman, P. V., et al. (2014). Polygenic dissection of diagnosis and clinical dimensions of bipolar disorder and schizophrenia. Mol. Psychiatry 19, 1017–1024. doi: 10.1038/mp.2013.138
Schinder, A. F., and Poo, M. M. (2000). The neurotrophin hypothesis for synaptic plasticity. Trends Neurosci. 23, 639–645. doi: 10.1016/S0166-2236(00)01672-6
Schröder, J., Wenz, F., Schad, L., Baudendistel, K., and Knopp, M. (1995). Sensorimotor cortex and supplementary motor area changes in schizophrenia. A study with functional magnetic resonance imaging. Br. J. Psychiatry 167, 197–201. doi: 10.1192/bjp.167.2.197
Seiferth, N. Y., Pauly, K., Kellermann, T., Shah, N. J., Ott, G., Herpertz-Dahlmann, B., et al. (2009). Neuronal correlates of facial emotion discrimination in early onset schizophrenia. Neuropsychopharmacology 34, 477–487. doi: 10.1038/npp.2008.93
Silbersweig, D. A., Stern, E., Frith, C., and Cahill, C. (1995). A functional neuroanatomy of hallucinations in schizophrenia. Nature 378, 176–179. doi: 10.1038/378176a0
Sklar, P. (2012). Large-scale genome-wide association analysis of bipolar disorder identifies a new susceptibility locus near ODZ4 (vol 43, pg 977, 2011). Nat. Genet. 44, 1072–1072. doi: 10.1038/ng0912-1072a
Sporns, O., Tononi, G., and Edelman, G. M. (2000). Theoretical neuroanatomy: relating anatomical and functional connectivity in graphs and cortical connection matrices. Cereb. Cortex 10, 127–141. doi: 10.1093/cercor/10.2.127
Sporns, O., Tononi, G., and Kotter, R. (2005). The human connectome: a structural description of the human brain. PLoS Comput. Biol. 1, 245–251. doi: 10.1371/journal.pcbi.0010042
Strakowski, S. M., Delbello, M. P., and Adler, C. M. (2005). The functional neuroanatomy of bipolar disorder: a review of neuroimaging findings. Mol. Psychiatry 10, 105–116. doi: 10.1038/sj.mp.4001585
Sullivan, P. F., Daly, M. J., Ripke, S., Lewis, C. M., Lin, D. Y., Wray, N. R., et al. (2013). A mega-analysis of genome-wide association studies for major depressive disorder. Mol. Psychiatry 18, 497–511. doi: 10.1038/mp.2012.21
Van Dijk, K. R. A., Hedden, T., Venkataraman, A., Evans, K. C., Lazar, S. W., and Buckner, R. L. (2010). Intrinsic functional connectivity as a tool for human connectomics: theory, properties, and optimization. J. Neurophysiol. 103, 297–321. doi: 10.1152/jn.00783.2009
Vergara, V. M., Ulloa, A., Calhoun, V. D., Boutte, D., Chen, J., and Liu, J. (2014). A three-way parallel ICA approach to analyze links among genetics, brain structure and brain function. Neuroimage 98, 386–394. doi: 10.1016/j.neuroimage.2014.04.060
Whitfield-Gabrieli, S., and Ford, J. M. (2012). Default mode network activity and connectivity in psychopathology. Annu. Rev. Clin. Psychol. 8, 49–76. doi: 10.1146/annurev-clinpsy-032511-143049
Xu, Y., Zhuo, C., Qin, W., Zhu, J., and Yu, C. (2015). Altered spontaneous brain activity in schizophrenia: a meta-analysis and a large-sample study. Biomed. Res. Int. 2015:204628. doi: 10.1155/2015/204628
Yu, Q., Erhardt, E. B., Sui, J., Du, Y., He, H., Hjelm, D., et al. (2015). Assessing dynamic brain graphs of time-varying connectivity in fMRI data: application to healthy controls and patients with schizophrenia. Neuroimage 107, 345–355. doi: 10.1016/j.neuroimage.2014.12.020
Yu, Q., Sui, J., Rachakonda, S., He, H., Gruner, W., Pearlson, G., et al. (2011). Altered topological properties of functional network connectivity in schizophrenia during resting state: a small-world brain network study. PLoS ONE 6:e25423. doi: 10.1371/journal.pone.0025423
Keywords: variability, resting state network, functional network connectivity, schizophrenia, PGC, parallel ICA
Citation: Chen J, Rashid B, Yu Q, Liu J, Lin D, Du Y, Sui J and Calhoun VD (2018) Variability in Resting State Network and Functional Network Connectivity Associated With Schizophrenia Genetic Risk: A Pilot Study. Front. Neurosci. 12:114. doi: 10.3389/fnins.2018.00114
Received: 24 August 2017; Accepted: 13 February 2018;
Published: 01 March 2018.
Edited by:
Russell A. Poldrack, Stanford University, United StatesReviewed by:
Kaiming Li, Sichuan University, ChinaGennady Knyazev, Institute of Physiology and Basic Medicine, Russia
Jean-Baptiste Poline, University of California, Berkeley, United States
Copyright © 2018 Chen, Rashid, Yu, Liu, Lin, Du, Sui and Calhoun. This is an open-access article distributed under the terms of the Creative Commons Attribution License (CC BY). The use, distribution or reproduction in other forums is permitted, provided the original author(s) and the copyright owner are credited and that the original publication in this journal is cited, in accordance with accepted academic practice. No use, distribution or reproduction is permitted which does not comply with these terms.
*Correspondence: Jiayu Chen, jchen@mrn.org
†These authors have contributed equally to this work.