 Guosheng Yi
 Yaqin Fan
 Jiang Wang
- School of Electrical and Information Engineering, Tianjin University, Tianjin, China
Pyramidal neurons consume most signaling-related energy to generate action potentials (APs) and perform synaptic integration. Dendritic Ca2+ spike is an important integration mechanism for coupling inputs from different cortical layers. Our objective was to quantify the metabolic energy associated with the generation of Ca2+ APs in the dendrites. We used morphology-based computational models to simulate the dendritic Ca2+ spikes in layer 5 pyramidal neurons. We calculated the energy cost by converting Ca2+ influx into the number of ATP required to restore and maintain the homeostasis of intracellular Ca2+ concentrations. We quantified the effects of synaptic inputs, dendritic voltage, back-propagating Na+ spikes, and Ca2+ inactivation on Ca2+ spike cost. We showed that much more ATP molecules were required for reversing Ca2+ influx in the dendrites than for Na+ ion pumping in the soma during a Ca2+ AP. Increasing synaptic input increased the rate of dendritic depolarization and underlying Ca2+ influx, resulting in higher ATP consumption. Depolarizing dendritic voltage resulted in the inactivation of Ca2+ channels and reduced the ATP cost, while dendritic hyperpolarization increased the spike cost by de-inactivating Ca2+ channels. A back-propagating Na+ AP initiated in the soma increased Ca2+ spike cost in the apical dendrite when it coincided with a synaptic input within a time window of several milliseconds. Increasing Ca2+ inactivation rate reduced Ca2+ spike cost, while slowing Ca2+ inactivation increased the spike cost. The results revealed that the energy demand of a Ca2+ AP was dynamically dependent on the state of dendritic activity. These findings were important for predicting the energy budget for signaling in pyramidal cells, interpreting functional imaging data, and designing energy-efficient neuromorphic devices.
Introduction
The brain has powerful capacity of information processing, which makes a substantial contribution to the body’s energy consumption. The limited availability of energetic resources constrains the processing power, size, and architecture of the brain (Attwell and Laughlin, 2001; Laughlin, 2001; Lennie, 2003; Attwell and Gibb, 2005), which determines both the evolution of brain circuitry and generation of functional imaging signals based on related metabolic mechanisms (Howarth et al., 2012). Most brain energy is used on electrical signaling, including action potential (AP) generation, maintaining resting potentials, dendritic integration, and synaptic transmission (Attwell and Laughlin, 2001; Harris et al., 2012; Howarth et al., 2012). The metabolic energy used for neural signaling constrains the flow of information within and between cells, which is dependent on neuron type (Sengupta et al., 2010), excitation/inhibition balance (Sengupta et al., 2013; Yu et al., 2018), coding strategy (Yang et al., 2017; Yu and Yu, 2017), and system size (Yu and Liu, 2014; Yu et al., 2016). Determining the signaling-related energy of different cell types has important implications for the brain’s evolution and function, which also offers considerable insights into the interpretation of functional imaging signals (Howarth et al., 2012; Magistretti and Allaman, 2015) and provides inspirations for engineers to mimic neural circuits to design neuromorphic devices (Cruz-Albrecht et al., 2012; Sengutpa and Stemmler, 2014).
Pyramidal neurons are the main integrators in the cortical column (Spruston, 2008). Their unique dendrites span all cortical layers (Binzegger et al., 2004), which have powerful ability to process excitatory and inhibitory signals (Magee, 2000; Spruston, 2008; Stuart and Spruston, 2015). The excitatory synaptic inputs produce local depolarization in their dendrites. Once the depolarization reaches the threshold for activation of voltage-dependent Ca2+ channels, a Ca2+ AP is generated in the apical dendrites (Magee, 2000; Stuart and Spruston, 2015). Such threshold-dependent, regenerative response provides a cellular mechanism in pyramidal cells for coupling inputs arriving at different cortical layers (Larkum et al., 1999; Larkum, 2013). Particularly, the Ca2+ AP produces long (up to 50 ms) plateau-type depolarization in the distal dendrites, which spreads to the soma/axon to activate voltage-dependent Na+ channels, resulting in high-frequency bursting of Na+ APs (Larkum, 2013). A back-propagating AP (bAP) initiated in the soma/axon can facilitate the initiation of Ca2+ APs if it coincides with synaptic inputs in a short time window, which is also referred to as a backpropagation activated Ca2+ (BAC) firing (Larkum et al., 1999; Larkum, 2013). As an active dendritic integration, the Ca2+ spike plays a crucial role in neural computation, network dynamics, and cortical processing (Magee, 2000; Spruston, 2008; Larkum, 2013; Stuart and Spruston, 2015).
The electrical signaling within neurons is sustained and propagated via ionic currents through their membranes. The different ion concentrations on the inside and the outside of a cell create electrochemical gradients. They are the major driving forces of neural activity, which store the potential energy and create a cellular battery for each ion (Izhikevich, 2007). The generation of an AP runs down these ion gradients. To maintain signaling, the intracellular ion concentrations need to be actively restored by relevant pumps against ion gradients at the end of each spike, which expend metabolic energy from ATP hydrolysis (Attwell and Laughlin, 2001; Howarth et al., 2012). By converting Na+ influx into ATP values, the AP energy cost in the soma/axon was determined in different cell types. It is shown that reversing the Na+ influx producing APs makes a significant contribution to the overall usage of signaling-related energy in the brain (Attwell and Laughlin, 2001; Harris et al., 2012; Howarth et al., 2012). The AP shape (Sengupta et al., 2010), Na+ channel activation and inactivation (Hasenstaub et al., 2010), membrane voltage (Hallermann et al., 2012), dendritic properties (Yi et al., 2017), body temperature (Yu et al., 2012), and stimulus intensity (Yi et al., 2015) all contributed to the energy cost of a Na+ spike. However, it is largely unknown how Ca2+ APs in the dendrites contribute to the metabolic demand of neural computation. We addressed this question through the simulation of morphology-based biophysical models of layer 5 (L5) pyramidal cells.
The objective of this study was to estimate the energy consumption associated with the dendritic Ca2+ APs. We used computational models of L5 pyramidal cells to simulate a Ca2+ spike initiated in the apical dendrites. Our results revealed that the ATP cost of a Ca2+ AP was dependent on the state of dendritic activity, which was determined by the synaptic inputs, membrane voltage, bAP, and Ca2+ inactivation. These results suggested that the pyramidal neurons dynamically adjust their energy demand according to dendritic responses.
Materials and Methods
Computational Model
The simulations were based on a biologically realistic model of a L5 pyramidal cell, which was available for public download at https://senselab.med.yale.edu/modeldb/ShowModel.cshtml?model=83344. As shown in Figure 1A, the model included a soma, a dendritic tree, and a myelinated axon. The three-dimensional morphology was reconstructed from a pyramidal cell in the somatosensory cortex of a Wistar rat. The passive parameters and active currents followed Schaefer et al. (2003), which were previously validated to reproduce the experimentally documented Ca2+ APs in the apical dendrites of neocortical pyramidal neurons. We implemented the computational model in NEURON simulation environment (Hines and Carnevale, 2001), which were solved with a time step of 0.025 ms.
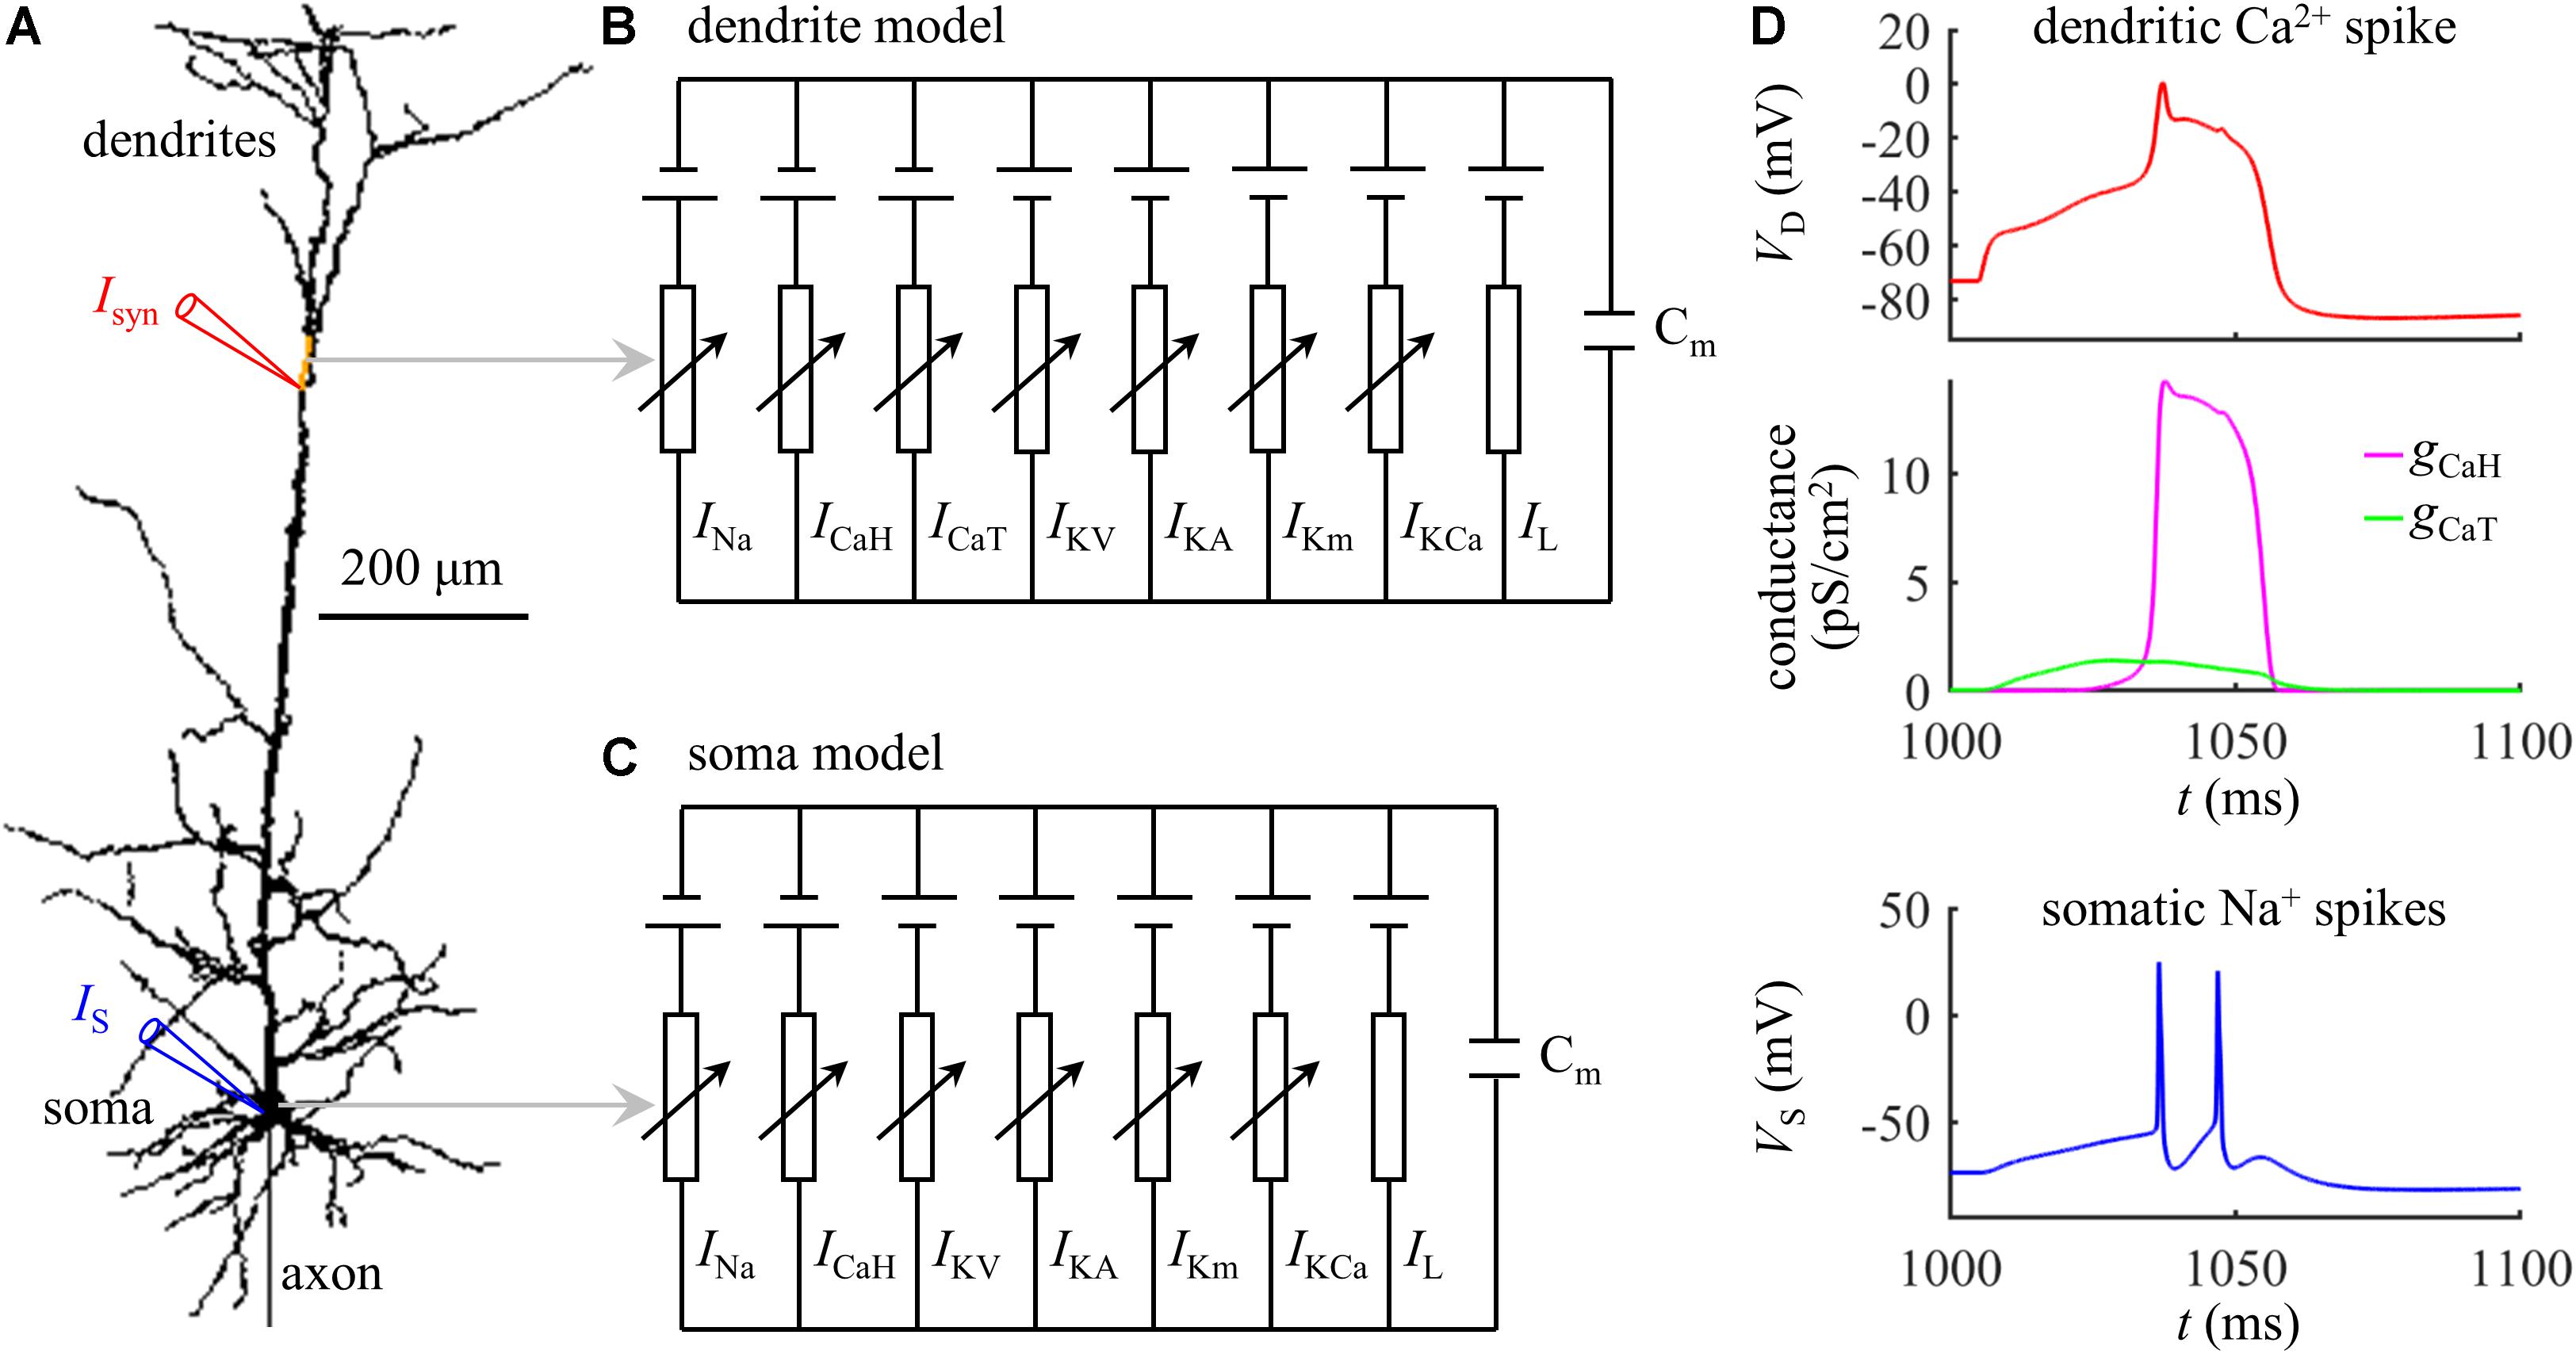
Figure 1. (A) Schematic of the computational model of a L5 pyramidal neuron, which included a soma, an axon, and a dendritic tree. The yellow dendrite indicated the active region with increased Ca2+ channel densities. (B) Dendrite model. (C) Soma model. (D) Time courses of a dendritic Ca2+ spike, Ca2+ conductances gCaH and gCaT, and somatic Na+ spikes (Isyn = 1.47 nA and IS = 0 nA). The site of distal recording/injection was indicated by a red triangle, and the site of somatic recording/injection was indicated by a blue triangle.
Experimental recording identified that the Ca2+ spikes were initiated at the main bifurcation of the apical dendrites (Larkum et al., 1999; Larkum, 2013). To account for BAC firing, Schaefer et al. (2003) introduced an active region with increased Ca2+ channel densities to the Ca2+ spike initiation zone, which was indicated by a yellow dendrite in Figure 1A. A schematic representation of the membrane model in the active dendrite was shown in Figure 1B, which included fast Na+ (INa), high-voltage activated Ca2+ (ICaH), low-threshold T-type Ca2+ (ICaT), fast K+ (IKV), A-type K+ (IKA), slow non-inactivating K+ (IKm), Ca2+-dependent K+ (IKCa), and passive leakage (IL) currents. The channel densities in the active dendrite were as follows (in pS/cm2): 27, 30, 300, 0.1, 3.25, 4.5, and 5. In non-active dendrites, only Ca2+ channel densities were different, which were 1.5 and 0. The soma included INa, ICaH, IKV, IKA, IKm, IKCa, and IL (Figure 1C). The channel densities in the soma were 54, 600, 600, 0.2, 6.5, and 3. The reverse potential for each channel was ENa = 60 mV, EK = −90 mV, ECa = 140 mV, and EL = −70 mV. Membrane capacitance Cm was 0.6 μF/cm2 in the soma and 1.2 μF/cm2 in the dendrites.
Synaptic Inputs
All the synaptic inputs were injected in the dendrites after an initial period of 1000 ms. Unless otherwise stated, the site of distal recording/injection was at the main bifurcation of the apical dendrites (Figure 1A, red triangle), where was 777.45963 μm from the soma. Following Schaefer et al. (2003), the synaptic input Isyn was modeled with a shape of double exponential, i.e., f(t) = e−t/τ1(1−e−t/τ2), which was a validated waveform commonly applied to activate Ca2+ APs in experiments (Larkum et al., 1999, 2001). The time constants were τ1 = 4 ms and τ2 = 0.8 ms (Schaefer et al., 2003), which were used to reproduce the compound excitatory postsynaptic potentials (EPSPs) evoked by layer 1 input. The function f(t) was adjusted so that the peak of Isyn corresponded to the value referred to as stimulus amplitude.
Calculation of Energy Cost
Applying an excitatory synaptic input Isyn to the apical dendrites depolarized local membrane voltage. Once dendritic depolarization reached the threshold for triggering voltage-gated Ca2+ channels to enter the “open state,” the Ca2+ conductances increased dramatically and vast Ca2+ ions passively flowed into the dendrites down their concentration gradients, resulting in a Ca2+ AP (Figure 1D). At the end of each Ca2+ spike, the Ca2+ gradient was partly run down. To restore and maintain the homeostasis of intracellular Ca2+ levels, the Ca2+ pumps, including Ca2+-ATPase and Na+-Ca2+ exchanger, extruded the Ca2+ influx against its gradient (Attwell and Laughlin, 2001; Howarth et al., 2012; Yi and Grill, 2019), which consumed ATP molecules.
In the apical dendrites, the low-threshold T-type Ca2+ current ICaT was calculated by:
where m was the activation gating variable, n was the inactivation gating variable, and VD was the dendritic voltage. The high-voltage activated Ca2+ current ICaH was calculated by:
Here h was the activation variable, and l was the inactivation gating variable. The time and voltage dependency of each gating variable (x) was computed by:
where αx was the forward rate and βx was the backward rate. The steady-state value was x∞ = αx/(αx + βx), and the time constant was τx = 1/(αx + βx). For current ICaT, they were:
For current ICaH, the rate functions were given by:
The distribution of two Ca2+ currents was not uniform within a dendrite during Ca2+ spikes. The NEURON divided each dendrite into several discrete segments with different membrane areas, and the membrane currents and potentials were distributed uniformly within each segment (Hines and Carnevale, 2001). We recorded Ca2+ currents ICaH and ICaT at the center of the segment, and determined the total Ca2+ current ICa by adding ICaH to ICaT. The energy cost in each segment was defined as the amount of ATP expended on Ca2+ extrusion during a Ca2+ spike (Yi and Grill, 2019). We calculated the Ca2+ influx per membrane area by integrating ICa during the 100 ms after the onset of Isyn, since the active ICaT and ICaH took place during this interval (Figure 1D, center). The measured Ca2+ influx was converted into ATP demand per area by using the fact that the Ca2+-ATPase or Na+-Ca2+ exchanger hydrolyzed one ATP for every Ca2+ extruded (Attwell and Laughlin, 2001; Howarth et al., 2012). We computed the surface area Sdseg of each segment in the NEURON, and the ATP cost in the segment was computed by
where NA was Avogadro’s constant and F was Faraday’s constant. The total ATP cost by a single dendrite was determined by summating of ATP consumption in all the segments. Note that one Ca2+ ion has two positive charges, we computed the Ca2+ entry by integrating Ca2+ currents, divided by 2.
The Ca2+ spike induced a prolonged depolarization in the apical dendrites, which propagated to the soma/axon to activate a burst of Na+ spikes (Figure 1D, bottom). To give a portion of energy budget in L5 pyramidal cells, we calculated the ATP cost on reversing somatic Na+ influx evoked by a Ca2+ spike. The fast Na+ current INa in the soma was defined as
Here w was the activation variable, q was the inactivation variable, and VS was the somatic voltage. The kinetics of gating variable w and q was governed by equation (3), and their rate functions were:
Note that the steady-state value for inactivation gating variable q was replaced by:
We recorded INa at the center of each somatic segment, and calculated the Na+ influx per membrane area by integrating the Na+ current curve during 100 ms after the onset of Isyn. This integral interval was identical to the calculation of Ca2+ influx. Since the Na+/K+-ATPase hydrolyzed one ATP for every three Na+ ions exported (Attwell and Laughlin, 2001; Howarth et al., 2012), we computed the ATP cost of a Na+ spike in a somatic segment by
where Ssseg was the surface area of the segment. The total ATP cost in the soma was the summation of ATP consumption in all the segments.
Results
Energy Cost of a Synaptically Evoked Ca2+ Spike
We first quantified the ATP cost of a synaptically evoked Ca2+ spike. We injected a synaptic input Isyn to the main bifurcation of the apical dendrites (Figure 1A, red triangle), and no current injection was applied to the soma. We calculated the smallest Isyn needed for activation of a Ca2+ AP (i.e., threshold), which was Ith = 1.47 nA. We increased Isyn from a subthreshold value (< Ith) to suprathreshold (> Ith), and recorded the evoked transmembrane voltage and transmembrane currents in the dendrites. We computed the ATP cost on Ca2+ ion pumping in the active dendrite at each Isyn, and the surface area of this single dendrite was 635.9640 μm2.
Extruding Ca2+ ions consumed much more ATP during a Ca2+ spike than that in the absence of Ca2+ spike (Figure 2A). With Isyn ≥ 1.47 nA, the suprathreshold input drove dendritic voltage VD to reach the threshold for activation of ICa (Figure 2B). This resulted in much larger ICa than that with Isyn < 1.47 nA, thus requiring more ATP for Ca2+ extrusion. Increasing suprathreshold Isyn altered the shape of a Ca2+ spike, which increased the rate of dendritic depolarization and reduced the amplitude of Ca2+ spike. The different spike shapes made the underlying Ca2+ currents exhibit different degrees of activation. Specifically, larger depolarization caused the activation gates of Ca2+ channels to open faster. Then, ICa reached a higher amplitude before the closing of Ca2+ inactivation gate, which resulted in larger Ca2+ influx and thus expended more ATP molecules. With Isyn < 1.47 nA, increasing Isyn caused a larger subthreshold depolarization in the dendrite and resulted in higher Ca2+ influx. Thus, the ATP cost on Ca2+ ion pumping increased with Isyn.
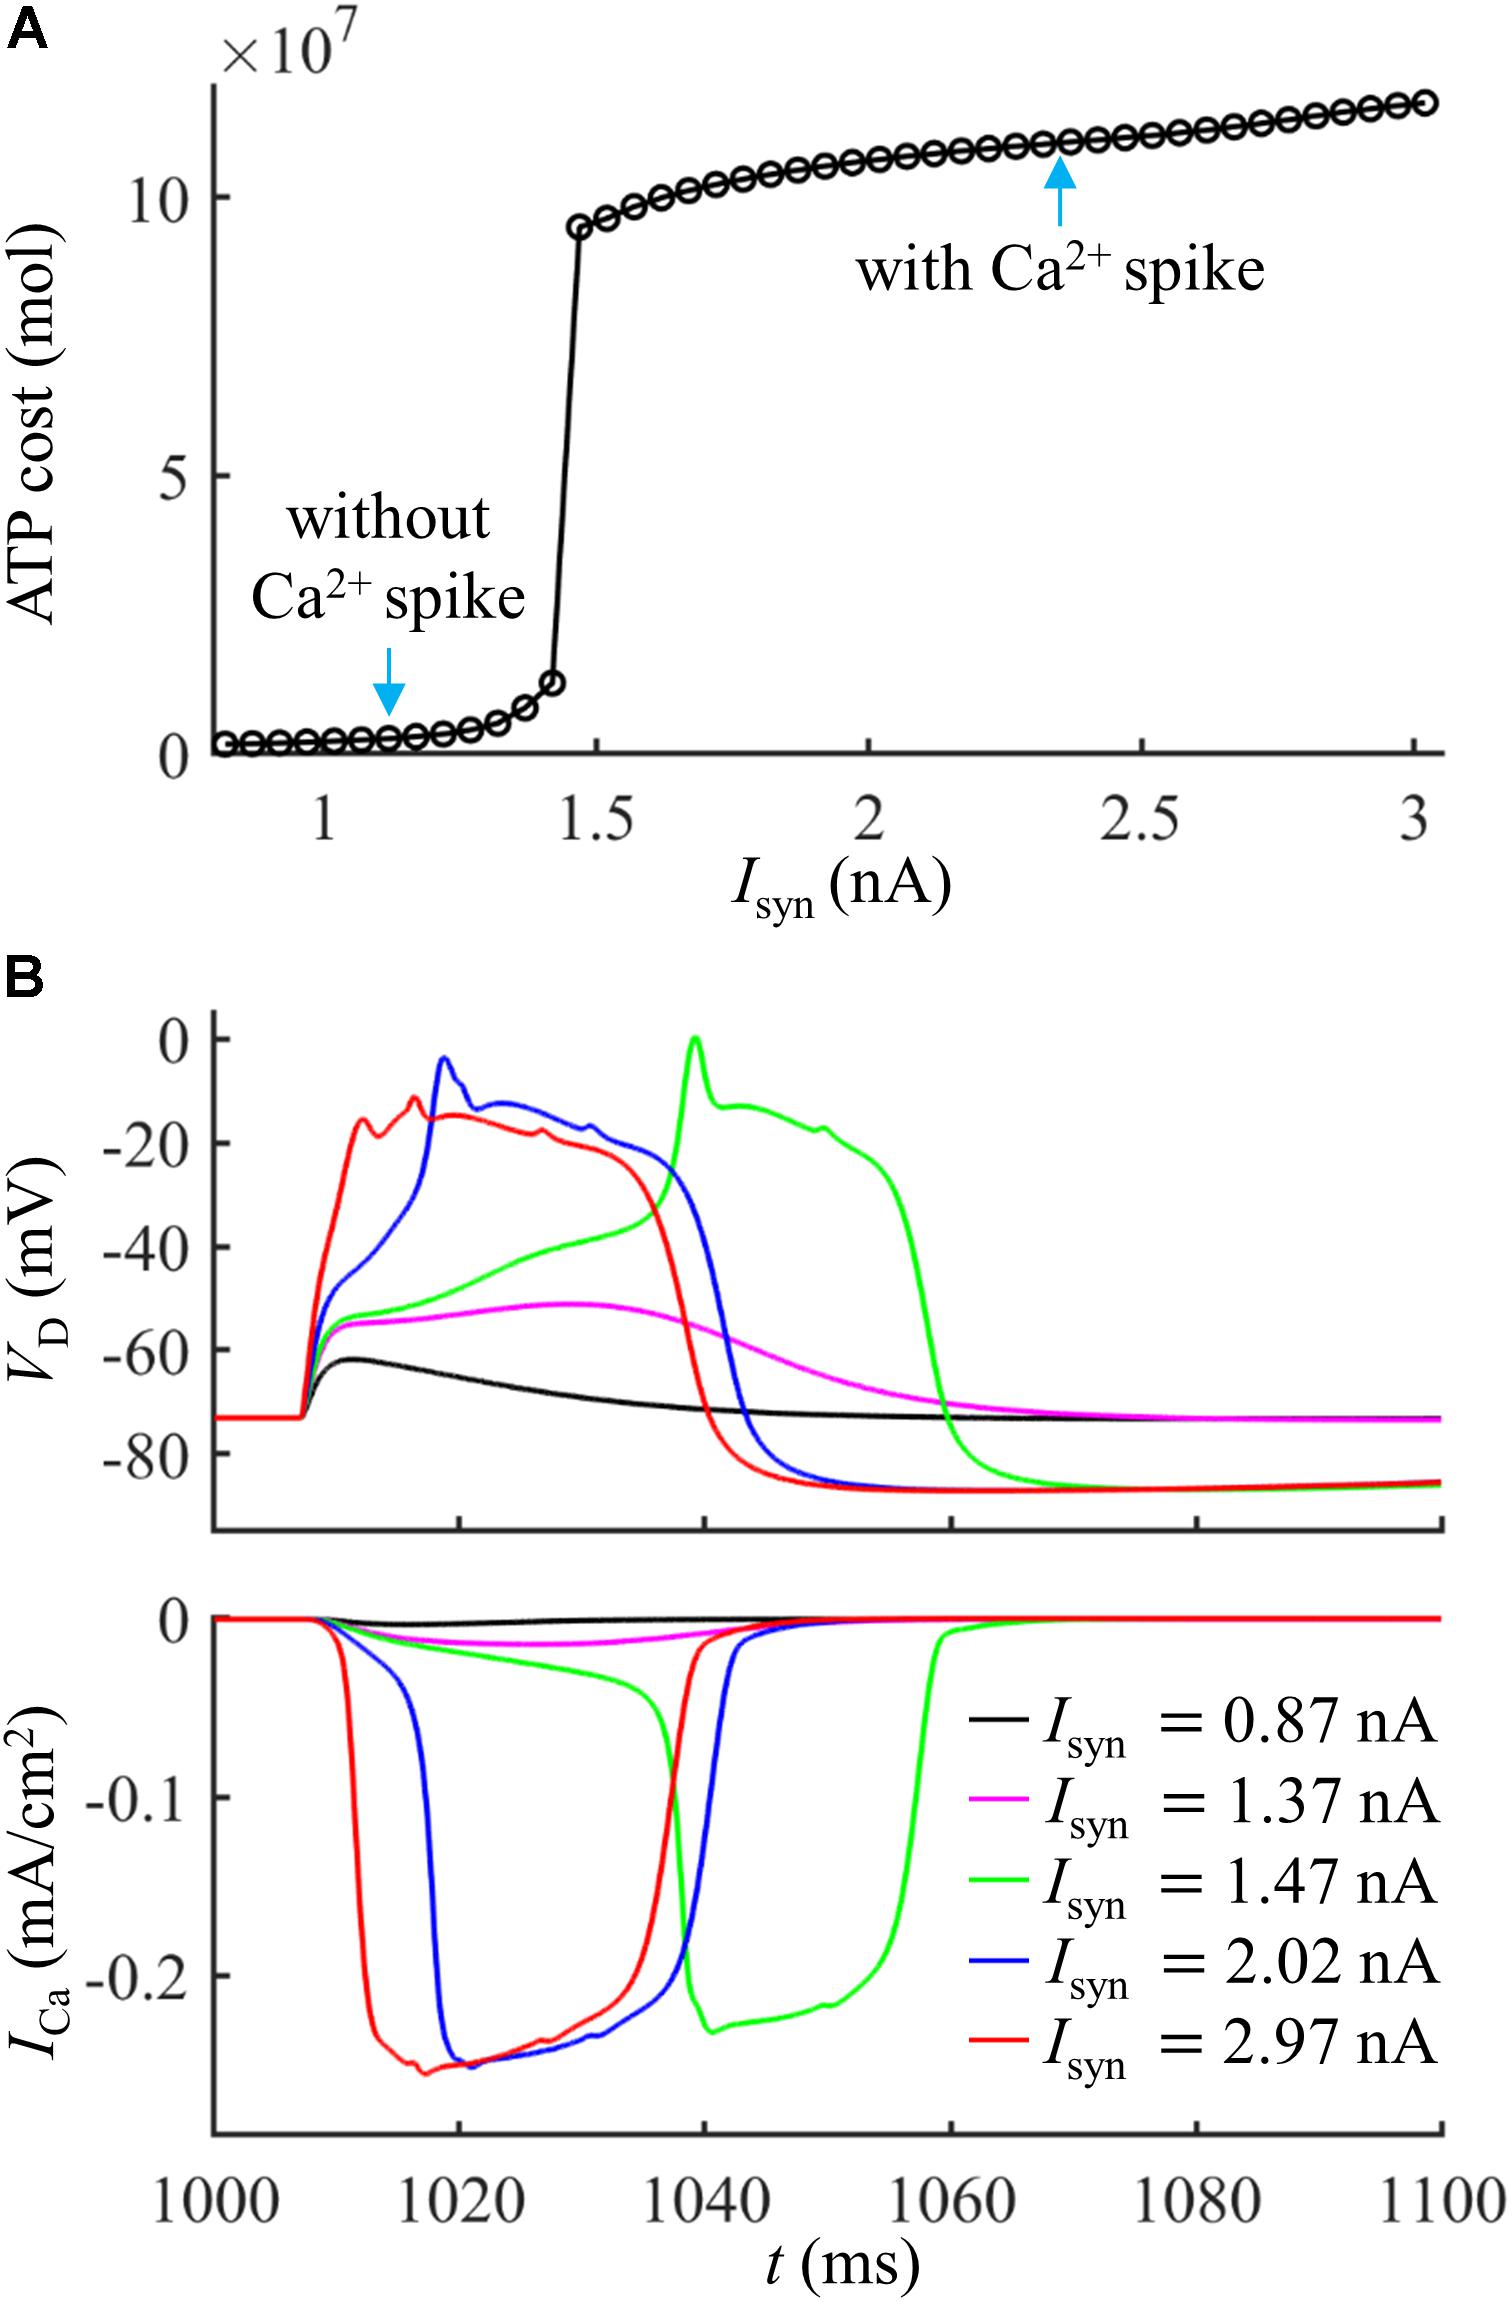
Figure 2. (A) ATP cost of a Ca2+ spike plotted as a function of Isyn. (B) Time courses of dendritic voltage VD and underlying ICa generated at different values of Isyn. Somatic injection was IS = 0 nA.
To give a portion of energy budget in the model neuron, we computed the ATP consumption on Ca2+ extrusion in the dendrites and the consumption on Na+ ion pumping in the soma. The ATP requirements per unit area in the active dendrite and whole dendrites were both higher as compared to the soma (Figure 3A), which slightly increased with Isyn. The surface area of the soma (2352.41291 μm2) was about fourfold larger than the active dendrite, but more ATP molecules were required for Ca2+ extrusion in this dendrite than for Na+ ion pumping in the soma (Figure 3B). To understand different ATP consumption in the dendrites and soma, we compared the Ca2+ and Na+ spike shapes and underlying currents (Figure 3C). The Ca2+ spike caused a prolonged depolarization in the active dendrite, which activated two Na+ APs in the soma. The INa underlying a Na+ spike was smaller and faster than ICa in the active dendrite. Further, the Na+/K+-ATPase consumed one ATP for every three Na+ ions extruded, while the Ca2+-ATPase or Na+-Ca2+ exchanger hydrolyzed one ATP for each Ca2+ ion extruded. These factors collectively resulted in a higher requirement of ATP molecules for Ca2+ ion pumping in the dendrites than for Na+ ion pumping in the soma. This indicated that the generation of Ca2+ APs made a significant contribution to the signaling-related energy in L5 pyramidal cells. Note that the Na+ influx occurred through fast Na+ channels in the dendrites during a Ca2+ spike, and pumping these Na+ ions out of the dendrites also consumed ATP. However, it contributed less to total ATP consumption as compared to Ca2+ extrusion. Similarly, a small number of Ca2+ ions entered the soma through ICaH during two Na+ APs, which consumed ATP to be extruded. Moreover, the Ca2+ channel densities were increased artificially in the active dendrite, which also affected the comparison of ATP consumption in the dendrites and soma.
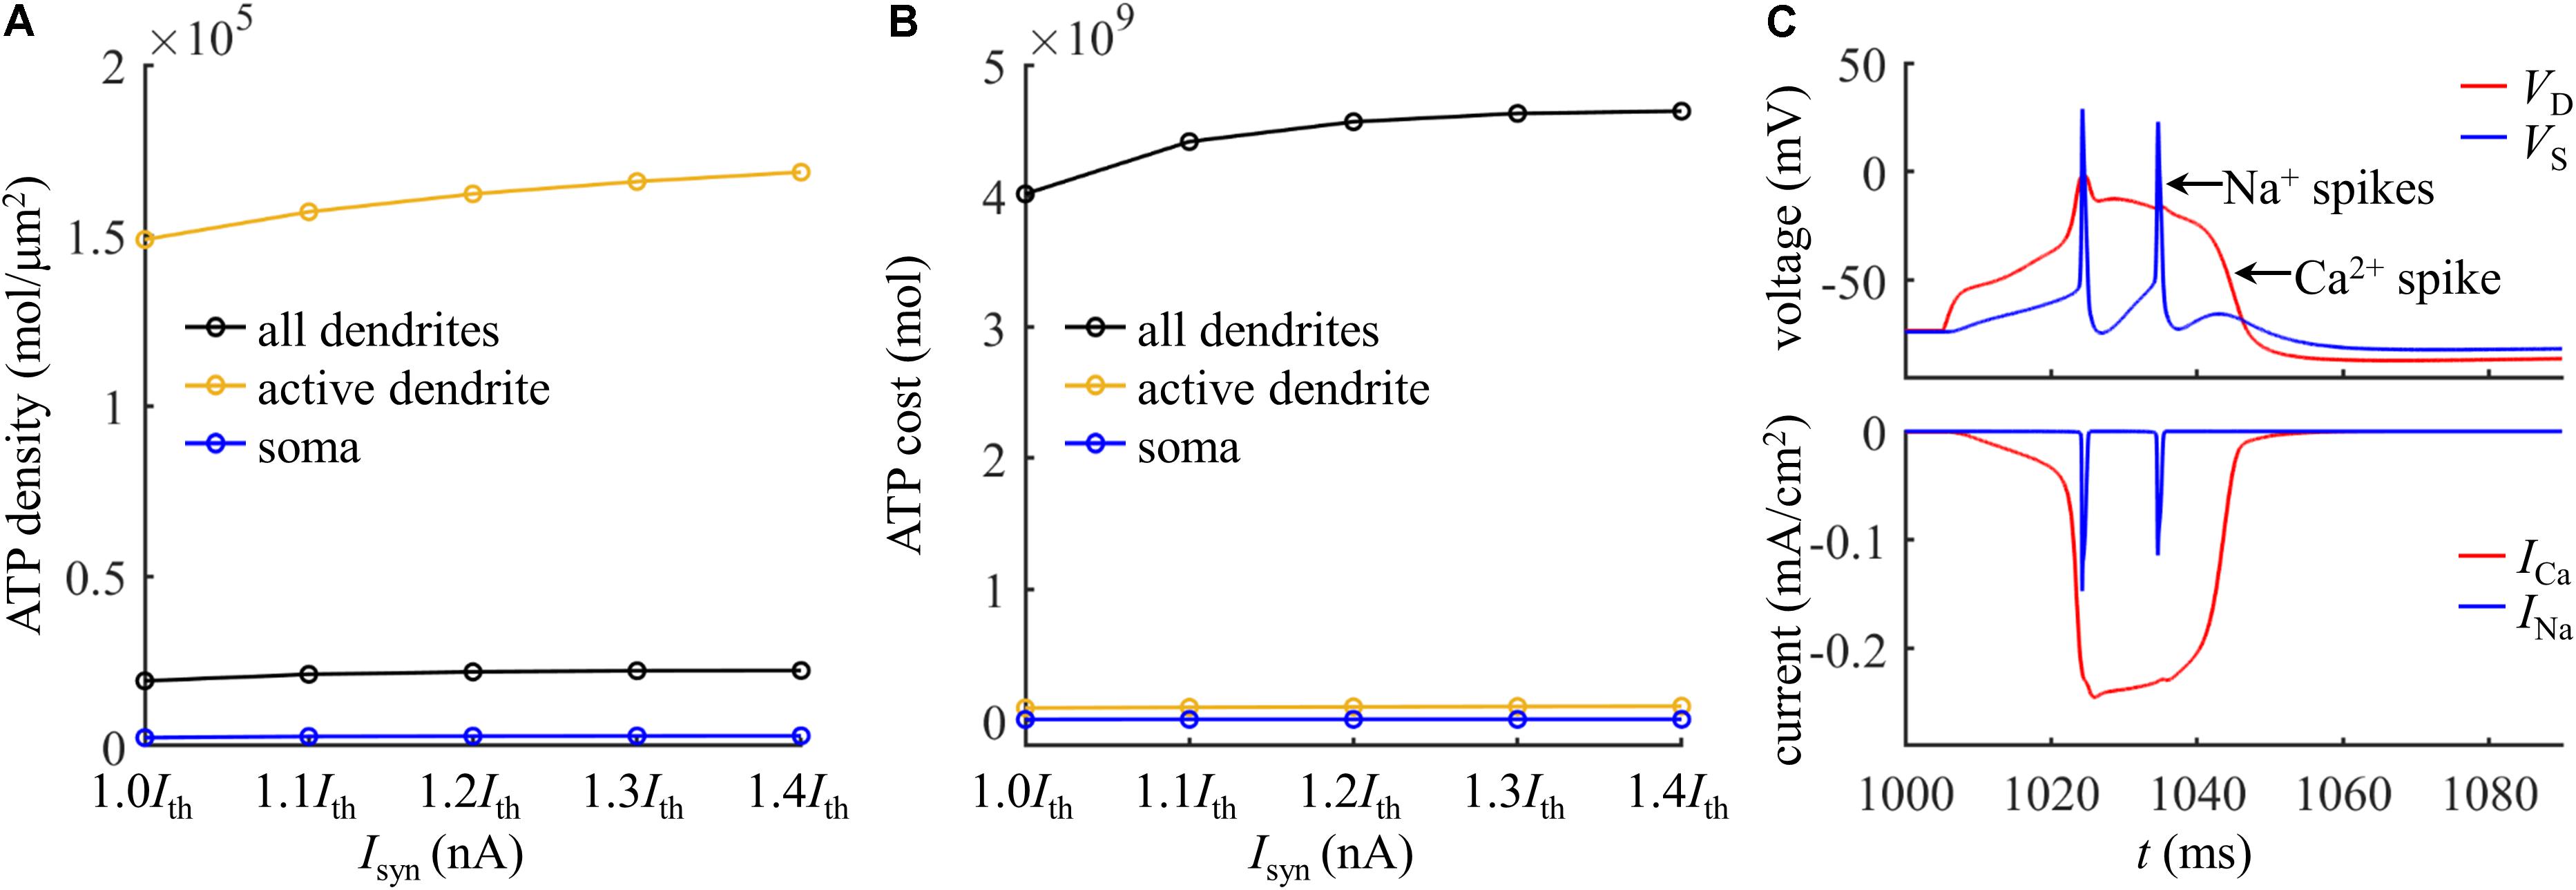
Figure 3. (A) ATP cost per unit membrane area during a Ca2+ spike. (B) Total ATP cost during a Ca2+ spike. The synaptic input was injected in the active dendrite, which was Isyn = 1.0Ith, 1.1Ith, 1.2Ith, 1.3Ith, and 1.4Ith. The ATP cost was, respectively, computed in the soma, active dendrite, and whole dendrites. (C) Top panel: time courses of somatic voltage VS and dendritic voltage VD. Bottom panel: time courses of underlying INa and ICa (Isyn = Ith and IS = 0 nA). VD and ICa were recorded in the active dendrite, and VS and INa were recorded in the soma.
Effects of Dendritic Membrane Voltage
The activation of Ca2+ currents is voltage dependent, and the membrane voltage influences the degree in Ca2+ channel availability. We examined the effects of dendritic voltage on the energy cost of a Ca2+ spike. We injected a constant current of different amplitudes in the main bifurcation of the apical dendrites to vary local voltage. The duration of constant stimulus was 1000 ms, which was sufficient for all the gating variables of each channel to reach steady states. At the end of 1000 ms constant injection, we applied a synaptic input Isyn to evoke a Ca2+ AP in the active dendrite. We used Vinit to indicate the value of dendritic voltage at which a Ca2+ spike was initiated. Since membrane depolarization reduced Ca2+ availability and increased the threshold current, the distal input Isyn was 2.3Ith. We quantified the ATP cost of a Ca2+ spike in the active dendrite at each Vinit.
As shown in Figures 4A,B, the ATP cost of a Ca2+ spike was reduced with Vinit. The resting potential in the active dendrite was −73 mV. Depolarizing dendritic voltage (i.e., Vinit > −73 mV) resulted in the inactivation of Ca2+ channels and reduced channel availability. Then, the ICa underlying each dendritic spike was reduced as Vinit increased (Figure 4C), which corresponded to lower Ca2+ influx and less ATP expenditure. Hyperpolarizing dendritic voltage (i.e., Vinit <−73 mV) de-inactivated Ca2+ channels and increased channel availability. This effectively increased the Ca2+ current underlying a Ca2+ spike and extended the interval of its plateau level (Figure 4D), resulting in more Ca2+ influx. Thus, the ATP expenditure on Ca2+ extrusion was increased with the hyperpolarization of dendritic voltage. These data suggested that the metabolic cost of a Ca2+ spike in the apical dendrite was dynamically dependent on the membrane voltage and Ca2+ channel availability.
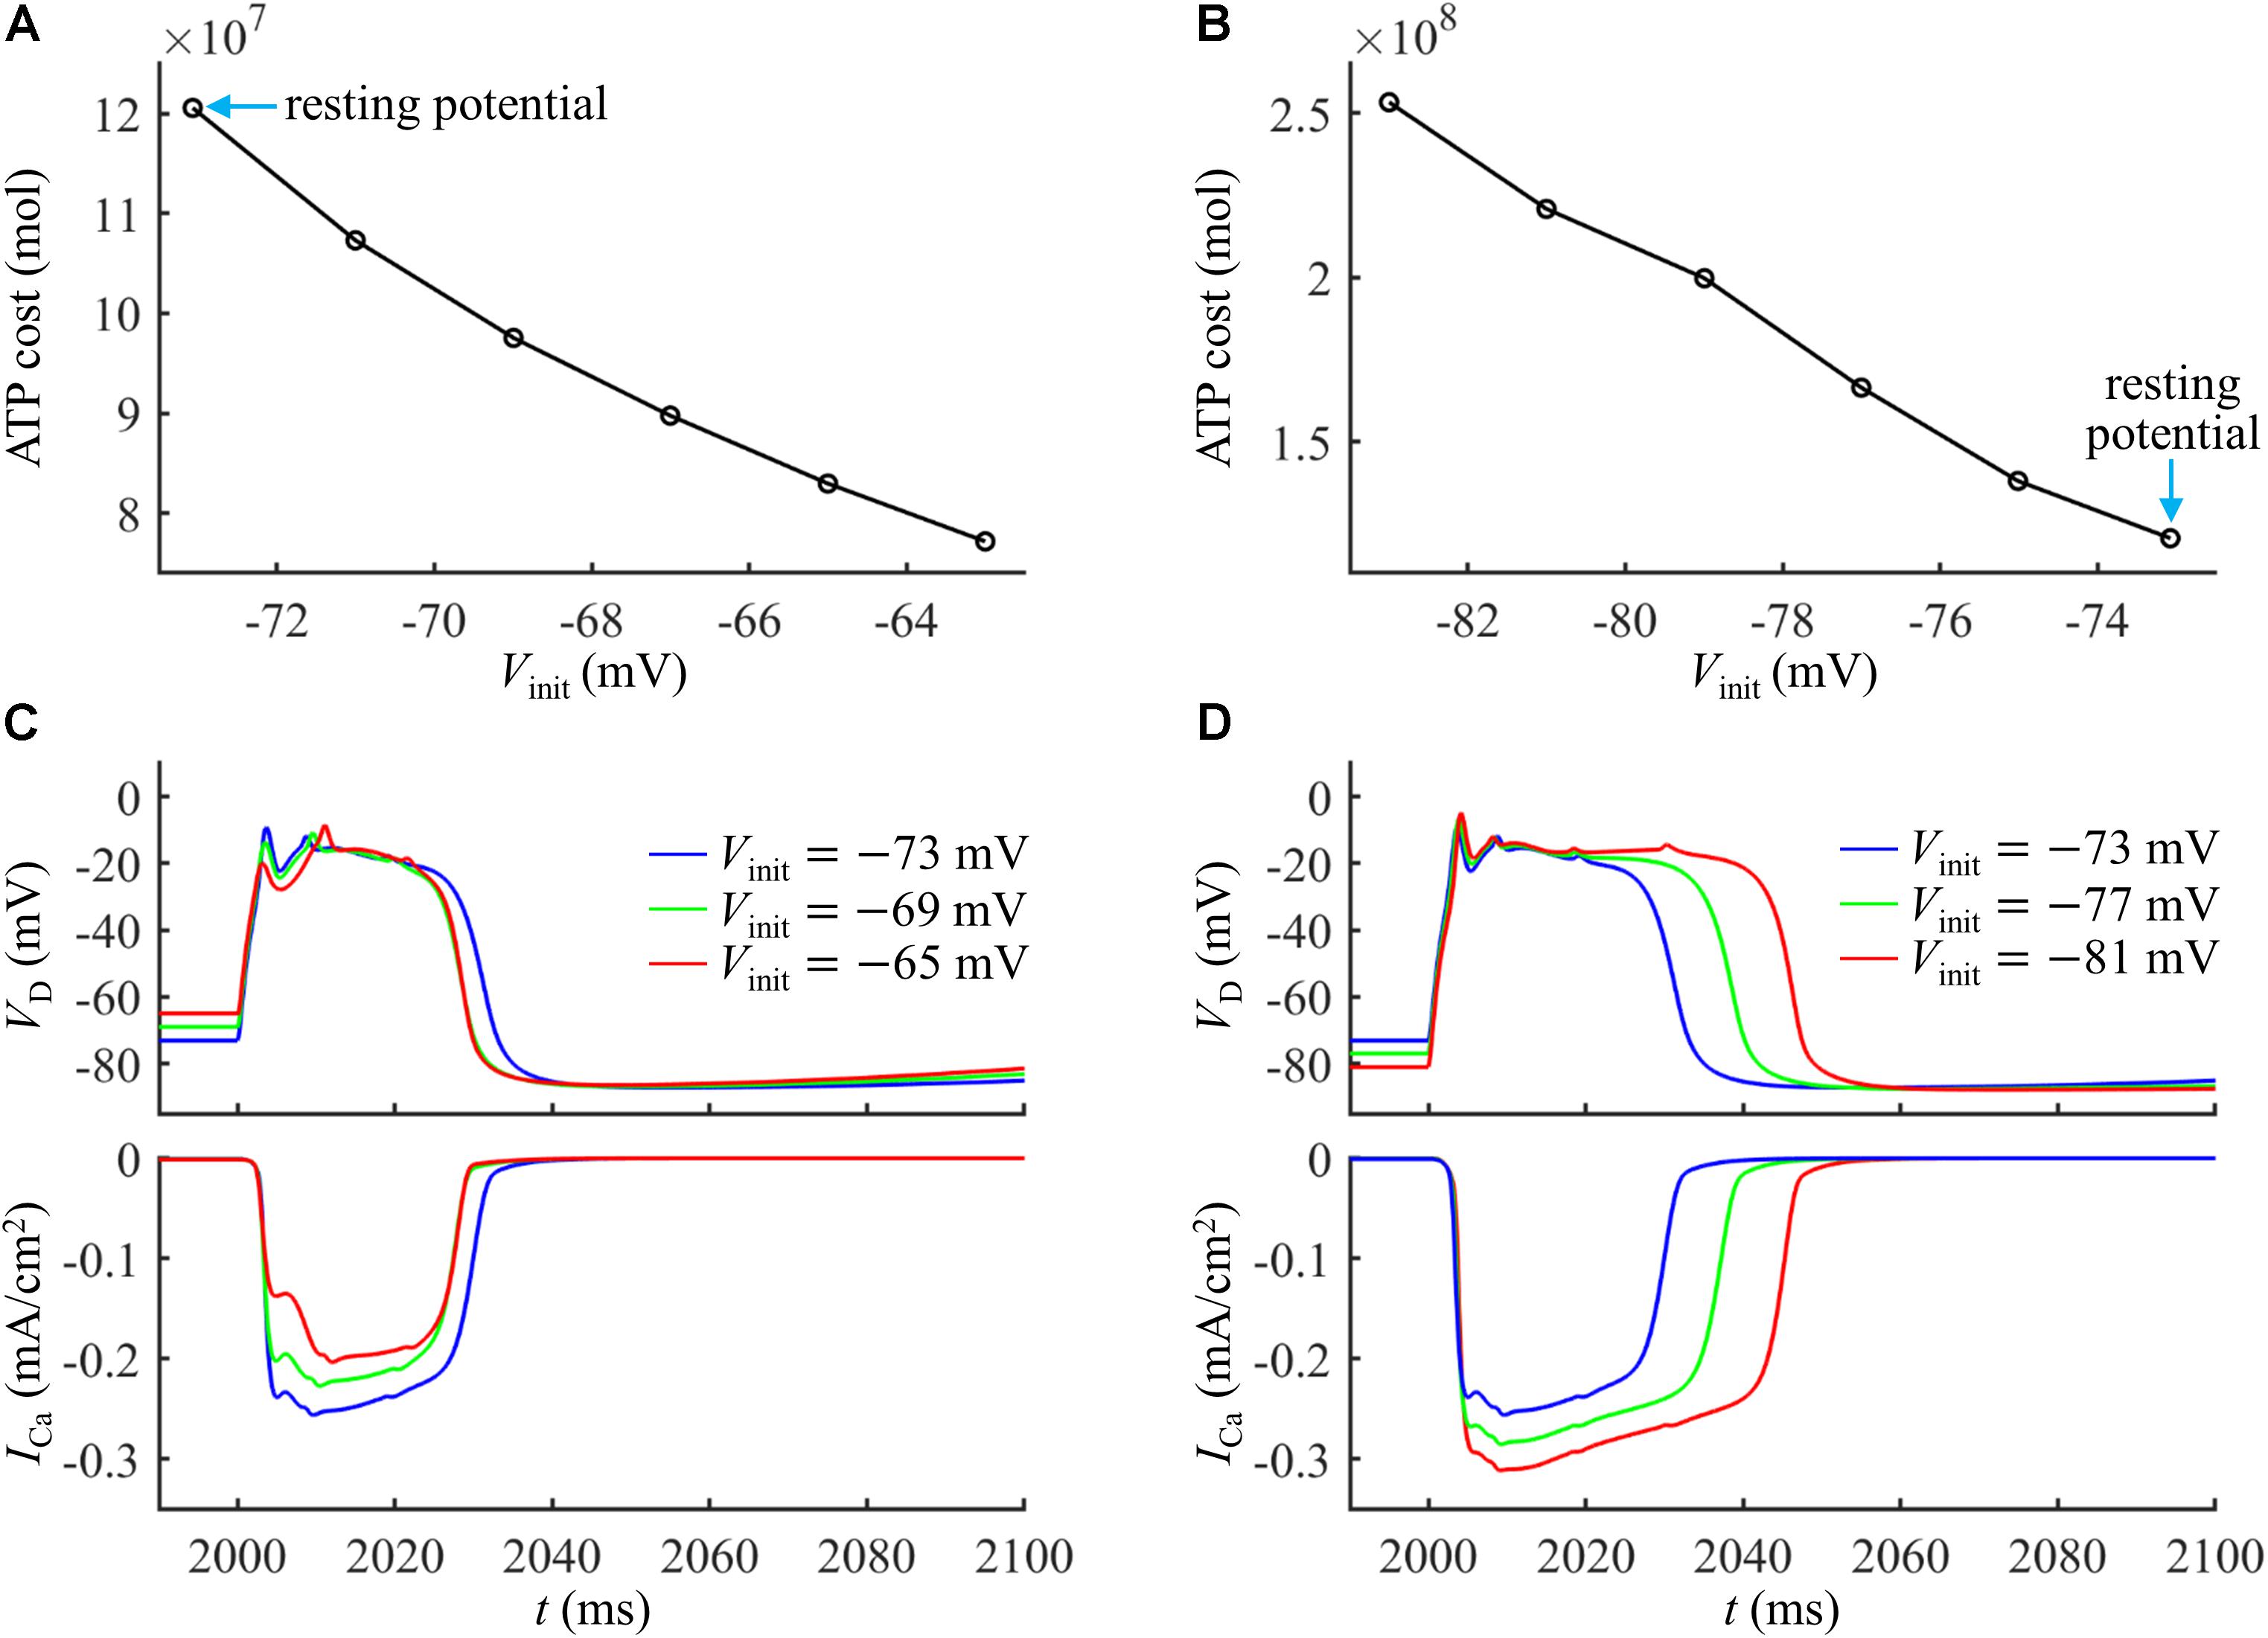
Figure 4. (A) Ca2+ spike cost in the active dendrite as a function of depolarizing Vinit. (B) Ca2+ spike cost in the active dendrite as a function of hyperpolarizing Vinit. (C) Time courses of VD and underlying ICa recorded at Vinit = –65, –69, and –73 mV. (D) Time courses of VD and underlying ICa recorded at Vinit = –81, –77, and –73 mV. A constant current of 1000 ms was injected to generate different values of Vinit in the active dendrite. At the end of constant stimulus, a synaptic current Isyn was injected to stimulate a Ca2+ spike. The injection site of constant and synaptic currents was indicated by a red triangle in Figure 1A. Isyn = 2.3Ith and IS = 0 nA.
Note that varying dendritic voltage also affected K+ efflux (Yi et al., 2019). The K+ currents flowed out of the cell, facilitating the hyperpolarization of dendritic voltage. In particular, the K+ efflux overlapped with Ca2+ currents at the subthreshold potentials, which made Ca2+ influx less efficient in generating dendritic depolarization, thus inflating metabolic energy. In our simulations, the Ca2+ inactivation dominated the energy cost of a dendritic spike as Vinit was varied, and we did not consider the effects of hyperpolarizing K+ currents.
Effects of Back-Propagating Action Potential
The bAP generated in the soma/axon facilitates the initiation of Ca2+ APs when it coincides with distal EPSPs within a time window of several milliseconds (Larkum et al., 1999; Larkum, 2013). We examined the effects of bAP on the metabolic cost of a Ca2+ spike.
We injected a current pulse IS of 5 ms to evoke a Na+ spike in the soma. The amplitude of IS was 1.9 nA, which was suprathreshold for activation of a Na+ AP. The resulting somatic spike backpropagated to the active dendrite, which caused a subthreshold depolarization in the absence of synaptic inputs (Figure 5A) and resulted in a small ICa (Figure 5B). After the onset of IS, we applied a synaptic input Isyn of 2 nA to evoke a Ca2+ spike in the active dendrite. As shown in Figure 5C, the threshold of Isyn for eliciting a Ca2+ spike reached a minimum when distal input was 2 ms after the onset of Na+ AP. The Ca2+ spike threshold became higher than that in the absence of a bAP when the time interval Δt was longer than 12 ms. This was consistent with previous experimental recording (Larkum et al., 1999).
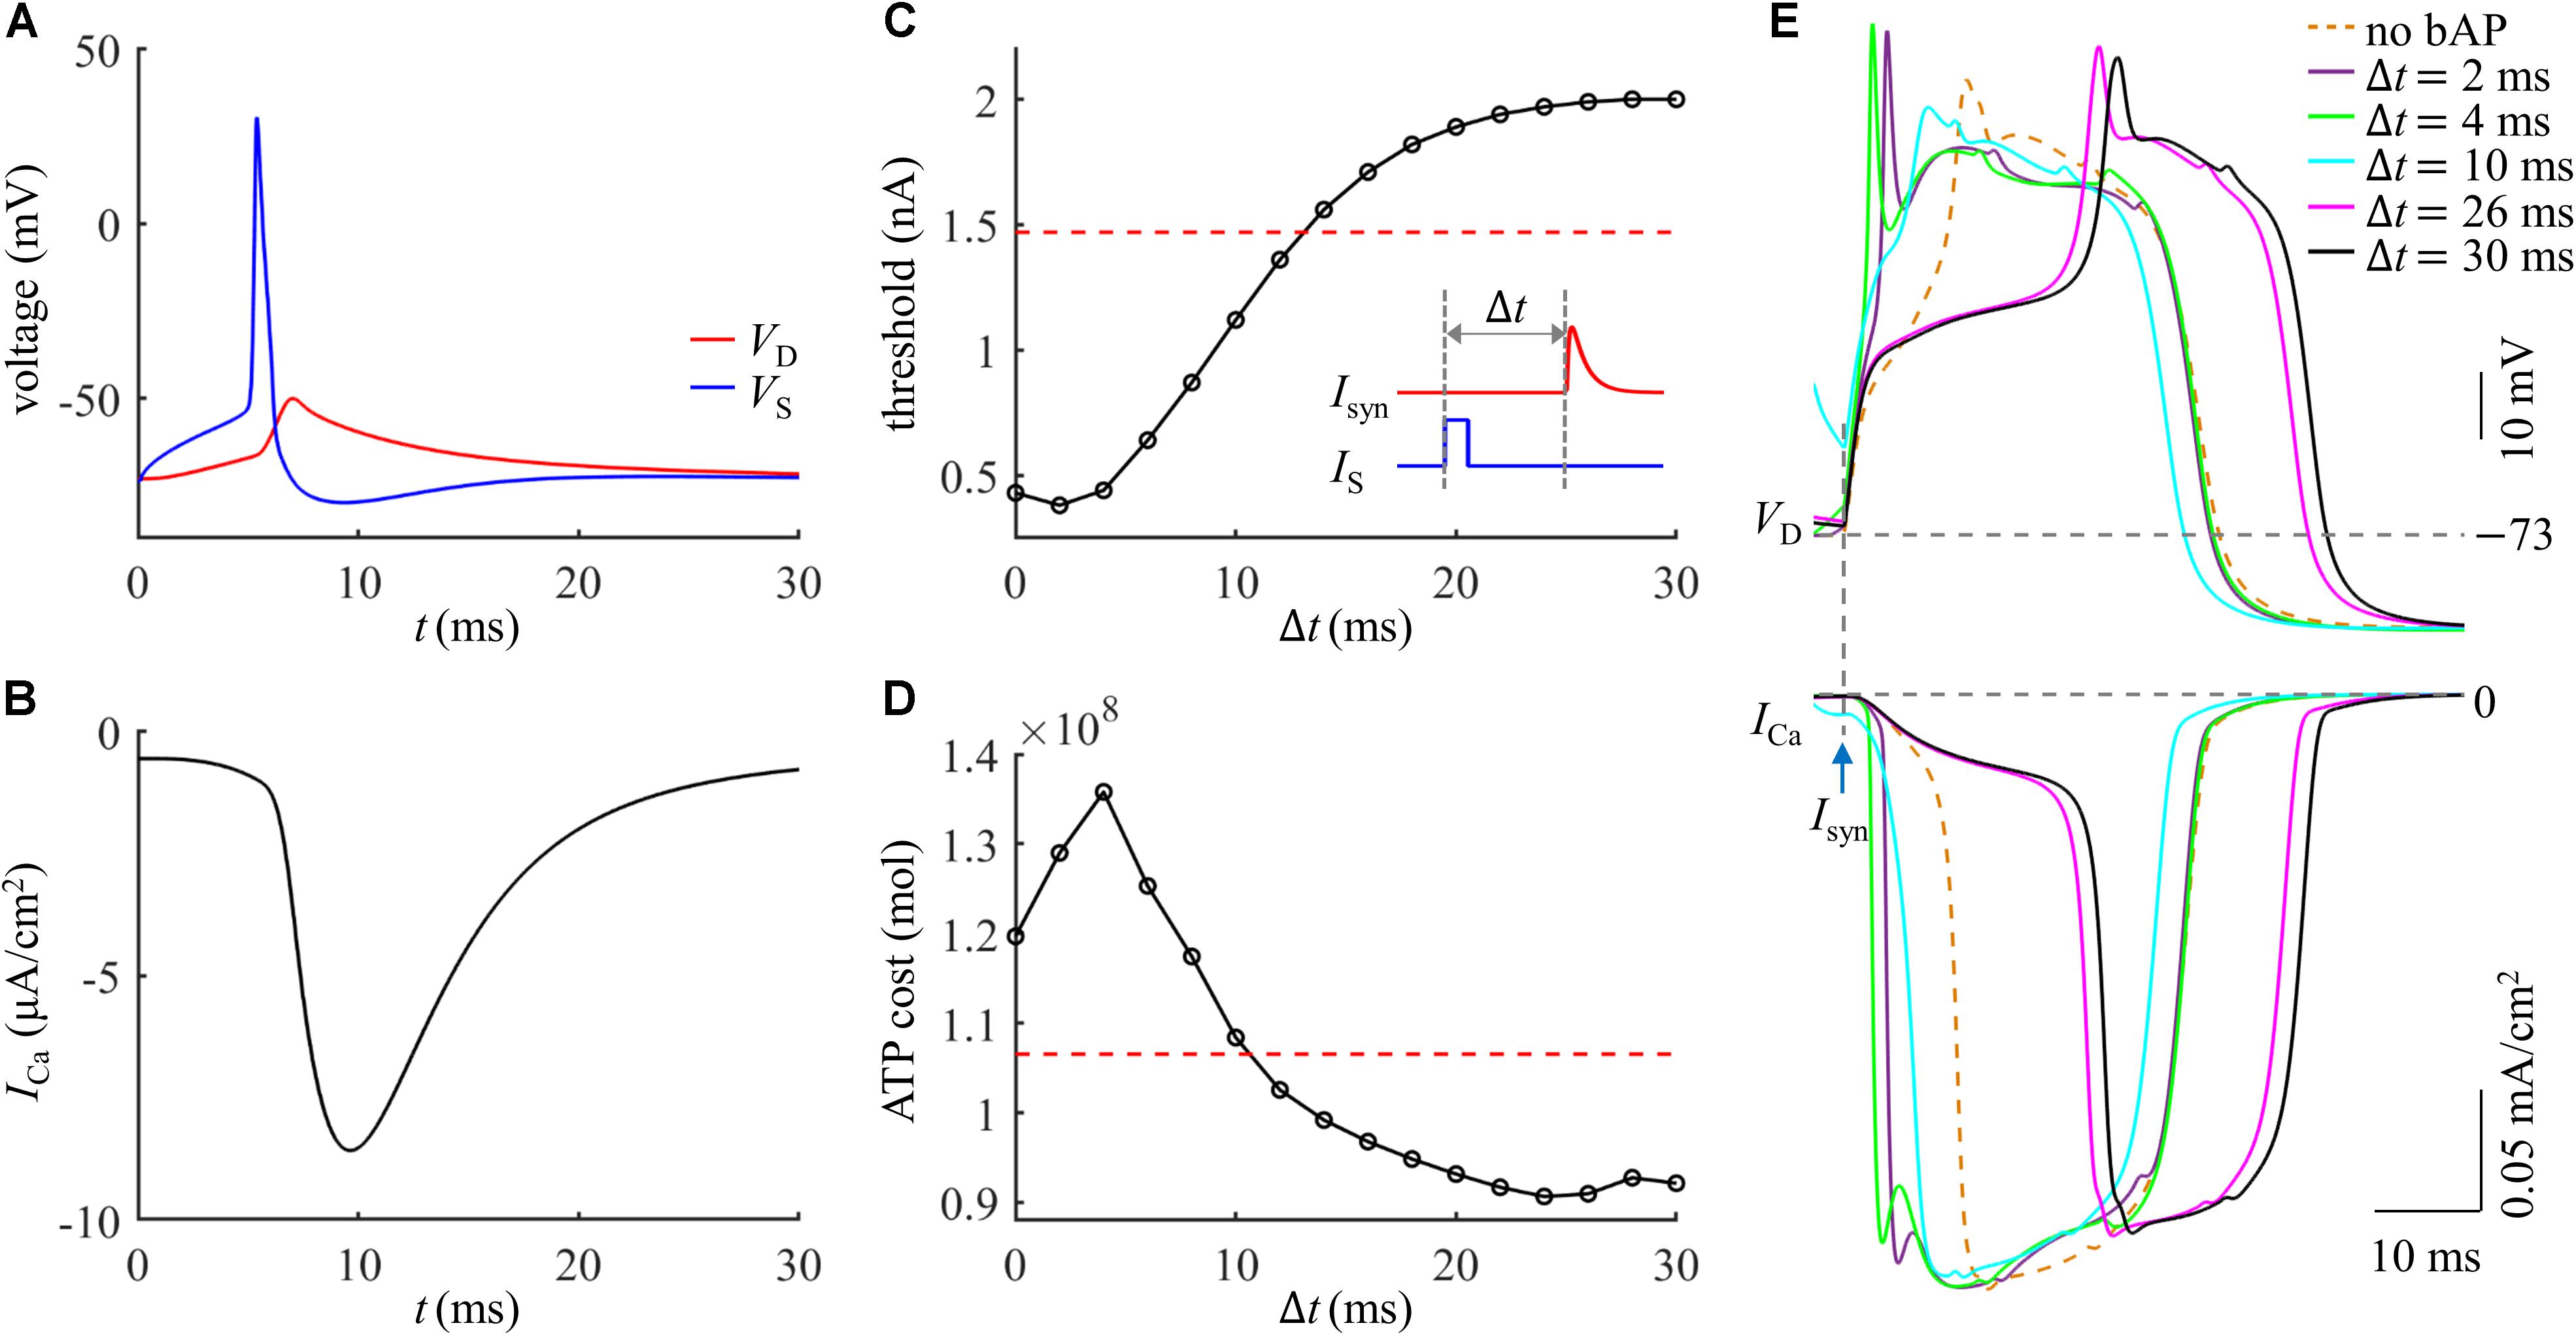
Figure 5. (A) Time courses of VS and VD in the case of a bAP. (B) Time course of Ca2+ current ICa during a bAP. (C) Threshold for activation of a Ca2+ spike in the active dendrite, which was plotted as a function of time interval Δt. Inset: Isyn was injected at Δt after the onset of IS. The red dotted line indicated the threshold without a bAP. (D) ATP cost of a Ca2+ spike as a function of Δt. The red dotted line indicated the spike cost without a bAP. (E) Top panel: superposition of Ca2+ spikes generated at different values of Δt. Bottom panel: Ca2+ current ICa underlying each dendritic spike. In (A,B), Isyn = 0 nA. In (D,E), Isyn = 2 nA. Somatic input was IS = 1.9 nA.
We calculated the ATP cost of a Ca2+ spike in the active dendrite as the interval Δt of Isyn and IS increased from 0 ms to 30 ms. Unlike Ca2+ spike threshold, the ATP cost of a Ca2+ AP reached a maximum when synaptic input Isyn was injected at Δt = 4 ms after the onset of a bAP (Figure 5D). With the delay Δt > 4 ms, the Ca2+ spike cost was reduced sharply, which became even lower than that in the absence of a bAP for the delays of over 10 ms. This showed that the energy cost of a Ca2+ AP was greatly increased if the dendritic EPSP and bAP were timed so that they coincided within a few milliseconds. But the Ca2+ spike cost was slightly reduced if the EPSP followed a bAP 12 ms later.
The inward ICa exhibited different degrees of activation dependent upon the time interval Δt of Isyn and bAP (Figure 5E). With 0 < Δt ≤ 4 ms, the delay was so short that the dendritic depolarization induced low degree of Ca2+ channel inactivation. In this case, increasing Δt increased the rate of dendritic depolarization and extended the width of a Ca2+ spike, which resulted in more Ca2+ influx, thus increasing ATP expenditure from Ca2+ channels. With 4 < Δt ≤ 24 ms, the sustained depolarization induced a high degree of Ca2+ inactivation, which reduced the availability of Ca2+ channels in the dendrite. At these delays, increasing Δt reduced both the rate of dendritic depolarization and the amplitude of inward ICa, resulting in less Ca2+ influx. Thus, the ATP cost from Ca2+ channels was decreased with increasing the delay Δt. With 24 < Δt ≤ 30 ms, the Ca2+ inactivation reached a steady state. Increasing Δt only resulted in a small delay of the ICa while produced little effect on the current amplitude, which slightly increased Ca2+ influx and corresponding ATP cost.
Effects of Ca2+ Inactivation
Based on above simulations, we inferred that the Ca2+ inactivation participated in the metabolic cost of a Ca2+ spike. To test this hypothesis, we systematically manipulated the inactivation kinetics of voltage-gated Ca2+ channels in the active dendrite. We multiplied Ca2+ inactivation rate by a scale factor ranging from 0.2 to 2 at a step of 0.2. We injected a synaptic input Isyn at the main bifurcation of the apical dendrites to evoke a Ca2+ spike, and the stimulus amplitude was 1.4Ith. We quantified the ATP cost of a Ca2+ AP in the active dendrite at each inactivation rate factor.
As shown in Figure 6A, the Ca2+ spike cost was reduced with the speed of Ca2+ inactivation. Slowing Ca2+ channel inactivation (i.e., factor < 1) increased the rate of dendritic depolarization and extended the width of a Ca2+ spike (Figure 6B). This resulted in a larger ICa and increased Ca2+ influx, thus more ATP molecules were expended on Ca2+ extrusion. On the contrary, increasing the speed of Ca2+ channel inactivation (i.e., factor > 1) reduced the rate of dendritic depolarization (Figure 6B), which resulted in a smaller ICa, thus decreasing ATP expenditure. These data suggested that the Ca2+ inactivation regulated the metabolic cost of a Ca2+ spike by altering the spike shape and Ca2+ availability.
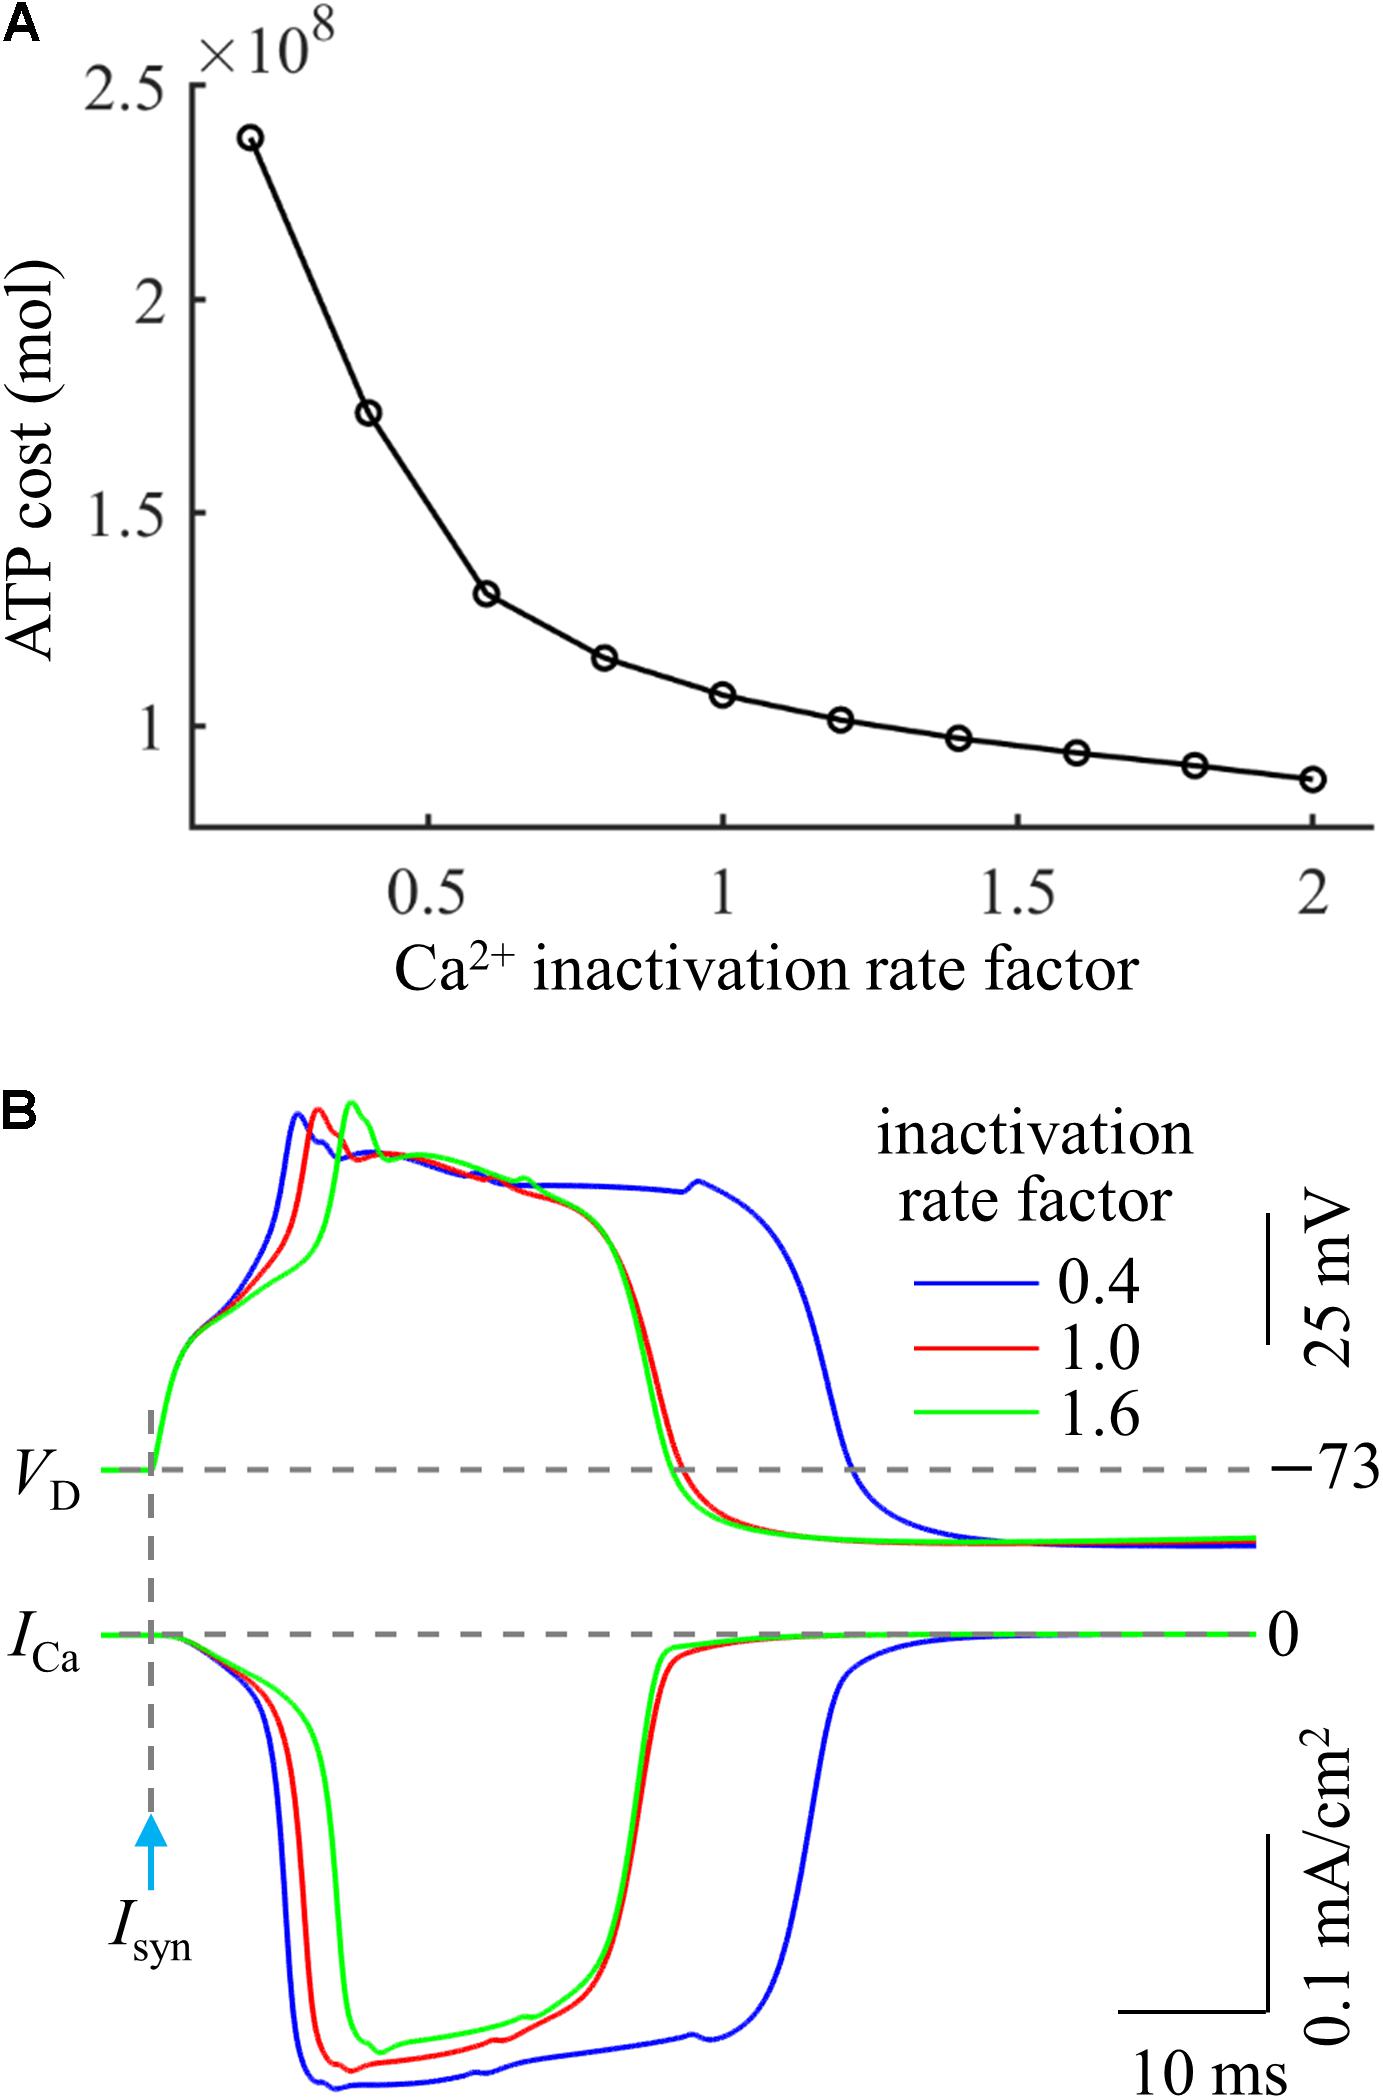
Figure 6. (A) ATP cost of a Ca2+ spike plotted as a function of Ca2+ inactivation rate factor. (B) Ca2+ spikes and underlying ICa recorded at three inactivation rate factors. Isyn = 1.4Ith and IS = 0 nA.
Ca2+ Spike Cost Evoked by in vivo Like Synaptic Inputs
Our above simulations were based on the examination of a single synaptic location. The conditions of synaptic inputs were simply set rather than in vivo like, i.e., thousands of synaptic inputs broadly received on the whole dendrites. To generalize our predictions in realistic cases, we examined the energy cost of a Ca2+ spike evoked by multiple synaptic inputs.
We started by applying 100 synaptic inputs to the dendrites. To quantify their distributions, we defined a distance dsyn = 250 μm. 90% of the synaptic inputs were randomly distributed at the distal sites, which were more than dsyn from the soma (Figure 7A). The remaining 10% of the inputs were randomly applied to the proximal sites less than dsyn from the soma. The threshold for activation of a Ca2+ spike in the active dendrite was Ith = 0.022 nA. The Ca2+ and Na+ spike shapes were both similar to those evoked by single synaptic input (Figure 7B). The results in Figures 7C–F showed that the effects of synaptic conductances, dendritic voltage, bAP, and Ca2+ inactivation on the ATP cost of a Ca2+ spike were all consistent with the simulations based on the examination of a single synaptic location. Under this realistic input condition, more ATP were required for Ca2+ ion pumping in the dendrites than for Na+ ion pumping in the soma (Figure 7G), which was also in accordance with above predictions.
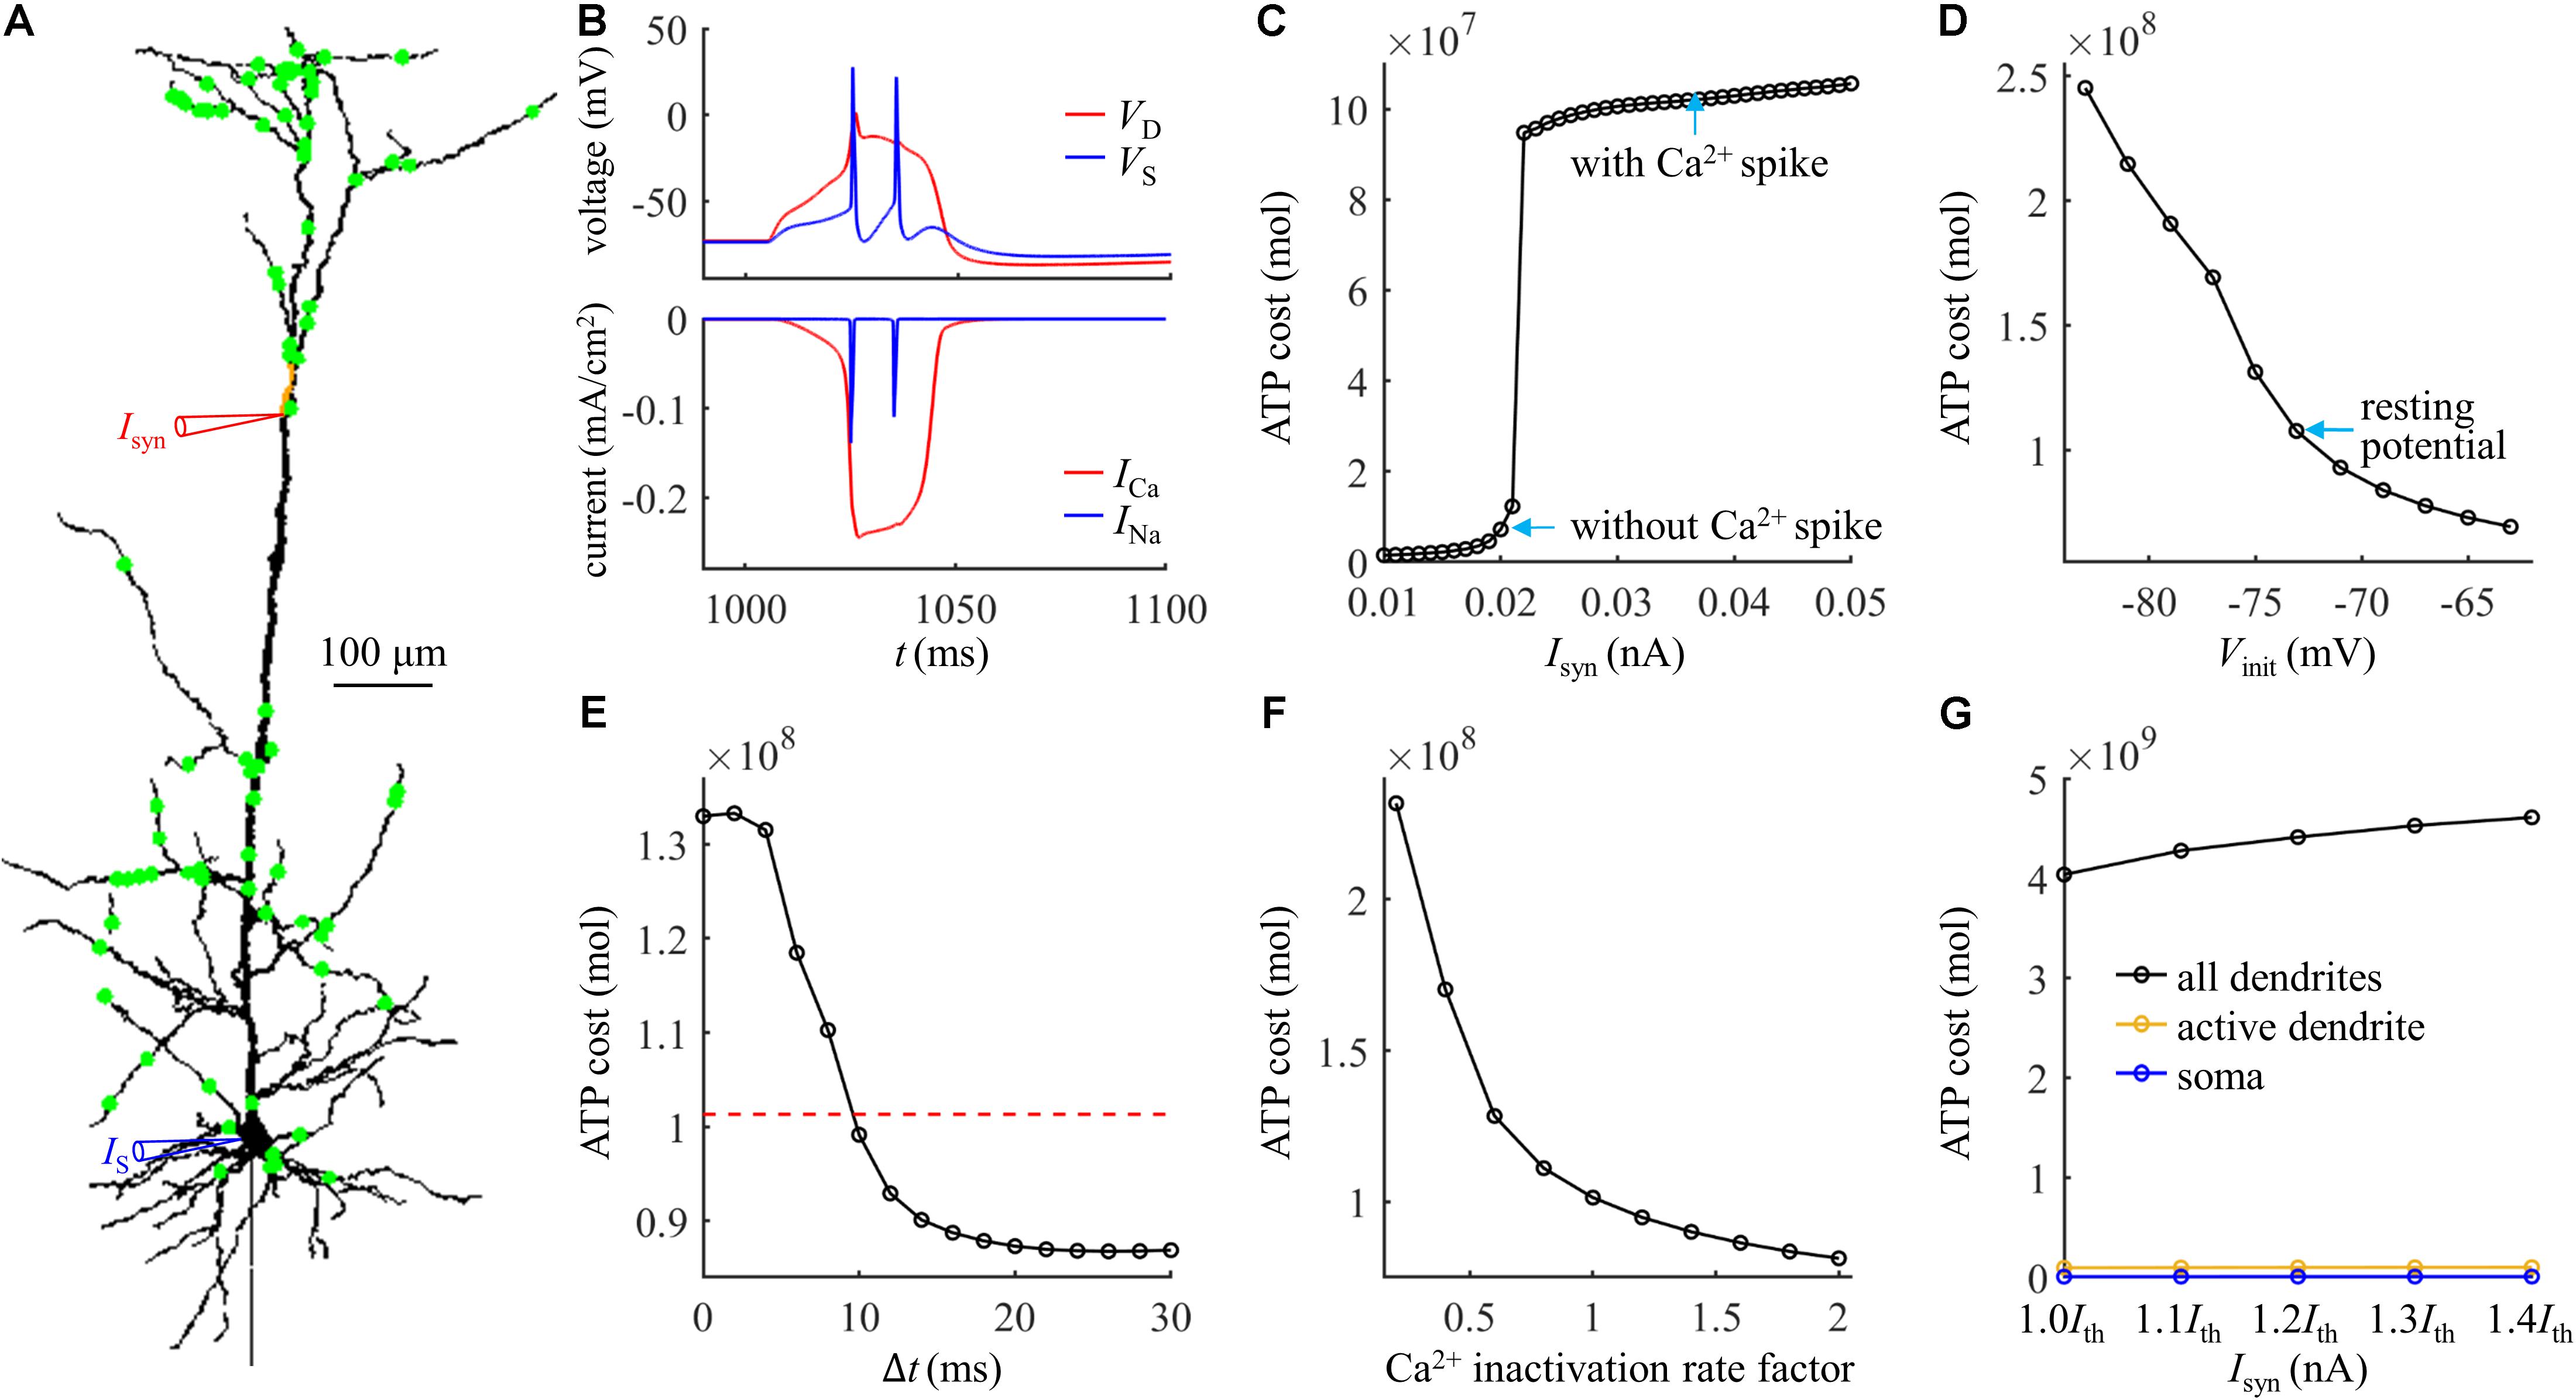
Figure 7. (A) Distribution of 100 excitatory inputs (green dots) over the dendrites. Each input Isyn was modeled with a double exponential function f(t) = e−t/τ1(1−e−t/τ2). Time constant was τ1 = 4 ms and τ2 = 0.8 ms. (B) Top panel: time courses of somatic voltage VS and dendritic voltage VD. Bottom panel: time courses of underlying INa and ICa (Isyn = Ith and IS = 0 nA). The threshold Ith for activation of a Ca2+ spike was 0.022 nA. VD and ICa were recorded in the active dendrite, which was indicated by a red triangle in (A). VS and INa were recorded in the soma, which was indicated by a blue triangle in (A). (C) ATP cost of a Ca2+ spike plotted as a function of Isyn (IS = 0 nA). (D) ATP cost of a Ca2+ spike plotted as a function of dendritic voltage. A constant current of 1000 ms was injected to the active dendrite. At the end of 1000 ms constant injection, 100 synaptic inputs were applied to evoke a Ca2+ AP. Vinit indicated the voltage at which a Ca2+ spike was initiated. Isyn = 2.3Ith and IS = 0 nA. (E) ATP cost of a Ca2+ spike plotted as a function of the Δt. Here Δt was defined as the interval between the onset of 100 inputs and somatic injection. The red dotted line indicated the ATP cost in the active dendrite without a bAP. Isyn = 1.5Ith and IS = 1.9 nA. (F) ATP cost of a Ca2+ spike plotted as a function of Ca2+ inactivation rate factor. Isyn = 1.5Ith and IS = 0 nA. (G) ATP cost in the dendrites and soma during a Ca2+ spike. Isyn = 1.0Ith, 1.1Ith, 1.2Ith, 1.3Ith, and 1.4Ith. In (C–F), the ATP cost on Ca2+ extrusion was computed in the active dendrite. In (G), the ATP consumption on Ca2+ extrusion was computed in the active dendrite and whole dendrites, and the consumption on Na+ extrusion was computed in the soma.
We subsequently examined the effects of the number of synaptic inputs on the ATP cost without changing their distributions over the dendrites. The threshold for activating a Ca2+ spike decreased with the number of inputs (Figure 8A). However, the ATP cost on dendritic Ca2+ extrusion and somatic Na+ ion pumping exhibited little changes as the synaptic number increased from 25 to 200. Particularly, increasing the number of inputs did not alter the comparison of ATP consumption on reversing ion influxes in the dendrites and soma. We also examined the effects of the distributions of 100 synaptic inputs on the ATP cost by altering the value of dsyn. As the distance dsyn increased, more synaptic inputs were randomly assigned to the distal dendrites, and lower synaptic conductances were required for activation of a Ca2+ spike in the active dendrite (Figure 8B). However, altering the synaptic distributions over the dendrites produced slight effects on the ATP cost in the dendrites and soma.
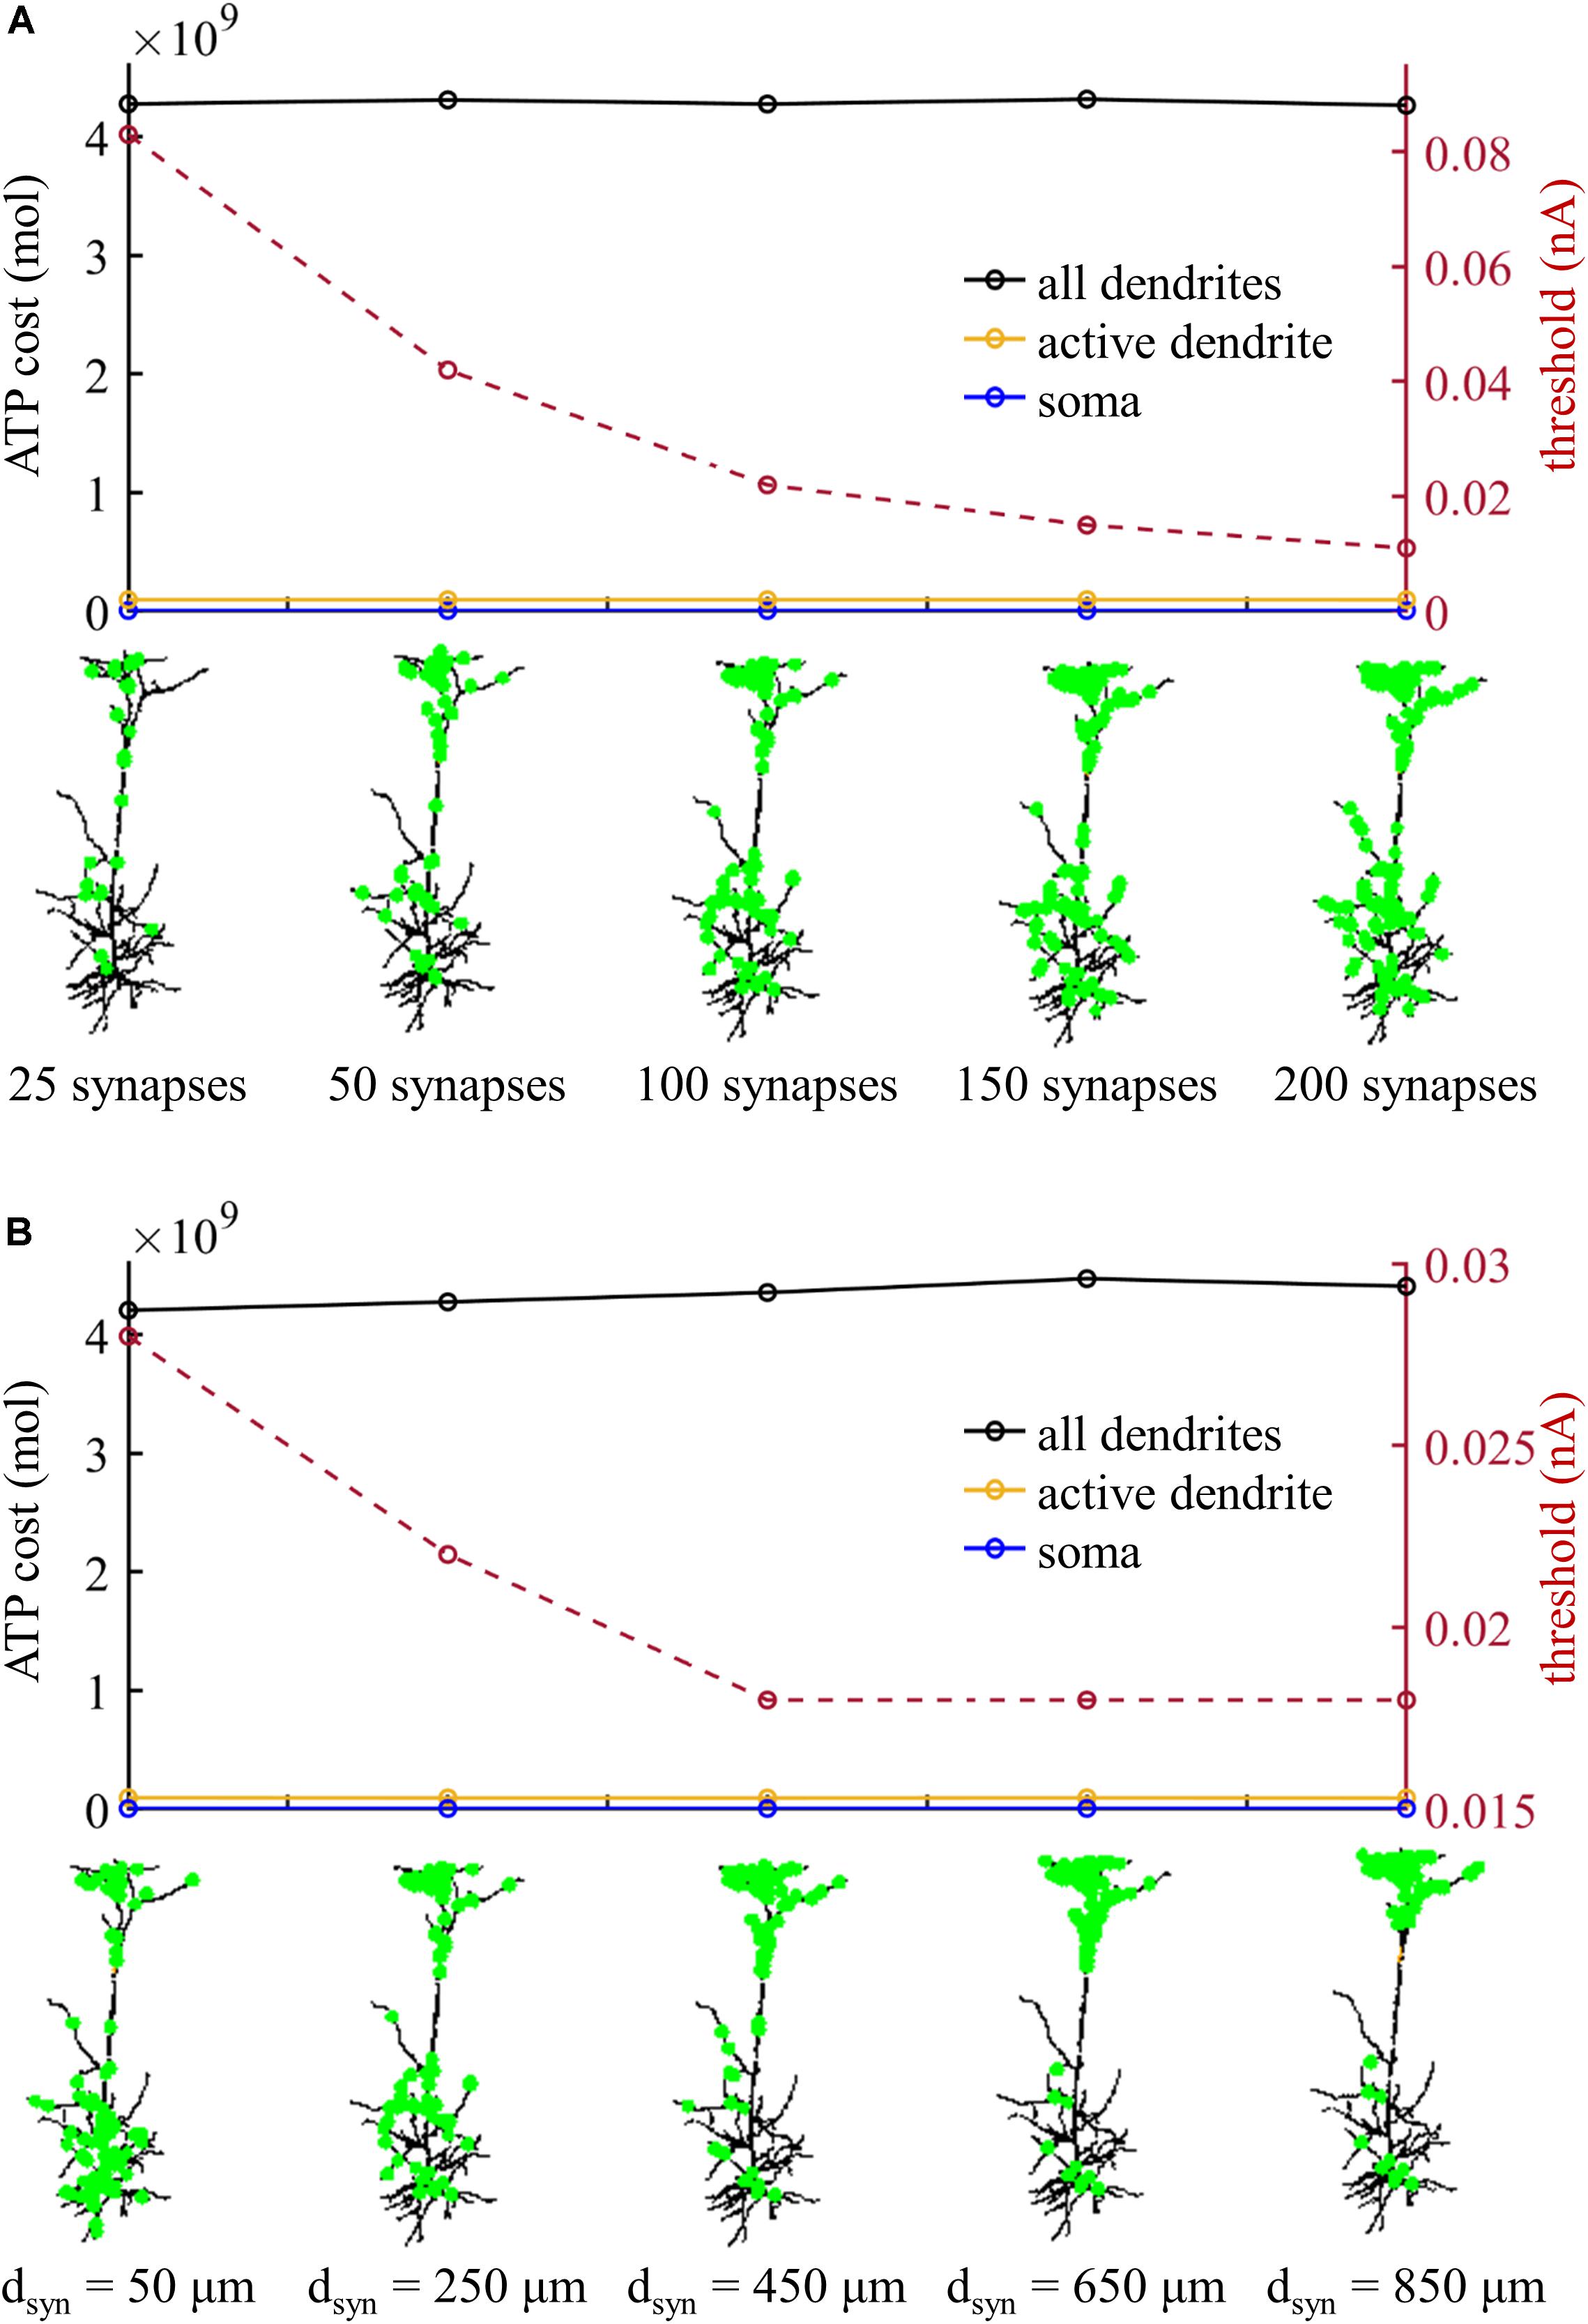
Figure 8. (A) ATP cost and Ca2+ spike threshold Ith as the number of synaptic inputs increased. 90% of the synaptic inputs were randomly distributed in the sites more than dsyn from the soma, and the distribution of the rest 10% was over the sites less than dsyn from the soma. Here the distance dsyn was 250 μm. (B) ATP cost and Ca2+ spike threshold Ith as the distance dsyn increased. Here the number of synaptic inputs was 100. When computing the ATP cost, the synaptic inputs were 1.1Ith. Somatic input was IS = 0 nA.
Model Predictions With Different Morphologies and Biophysics
The morphologies and biophysics are varied across L5 pyramidal cells. Here we examined our above predictions in a L5 pyramidal model neuron with different morphologies, channel kinetics, and conductances (Figure 9A). The details of the model followed Hay et al. (2011), which captured a wide range of dendritic and perisomatic active properties of L5 pyramidal cells. Especially, it was validated to faithfully replicate the dendritic Ca2+ spike and BAC firing recorded in vitro. This model did not include an active dendrite with increased Ca2+ channel densities.
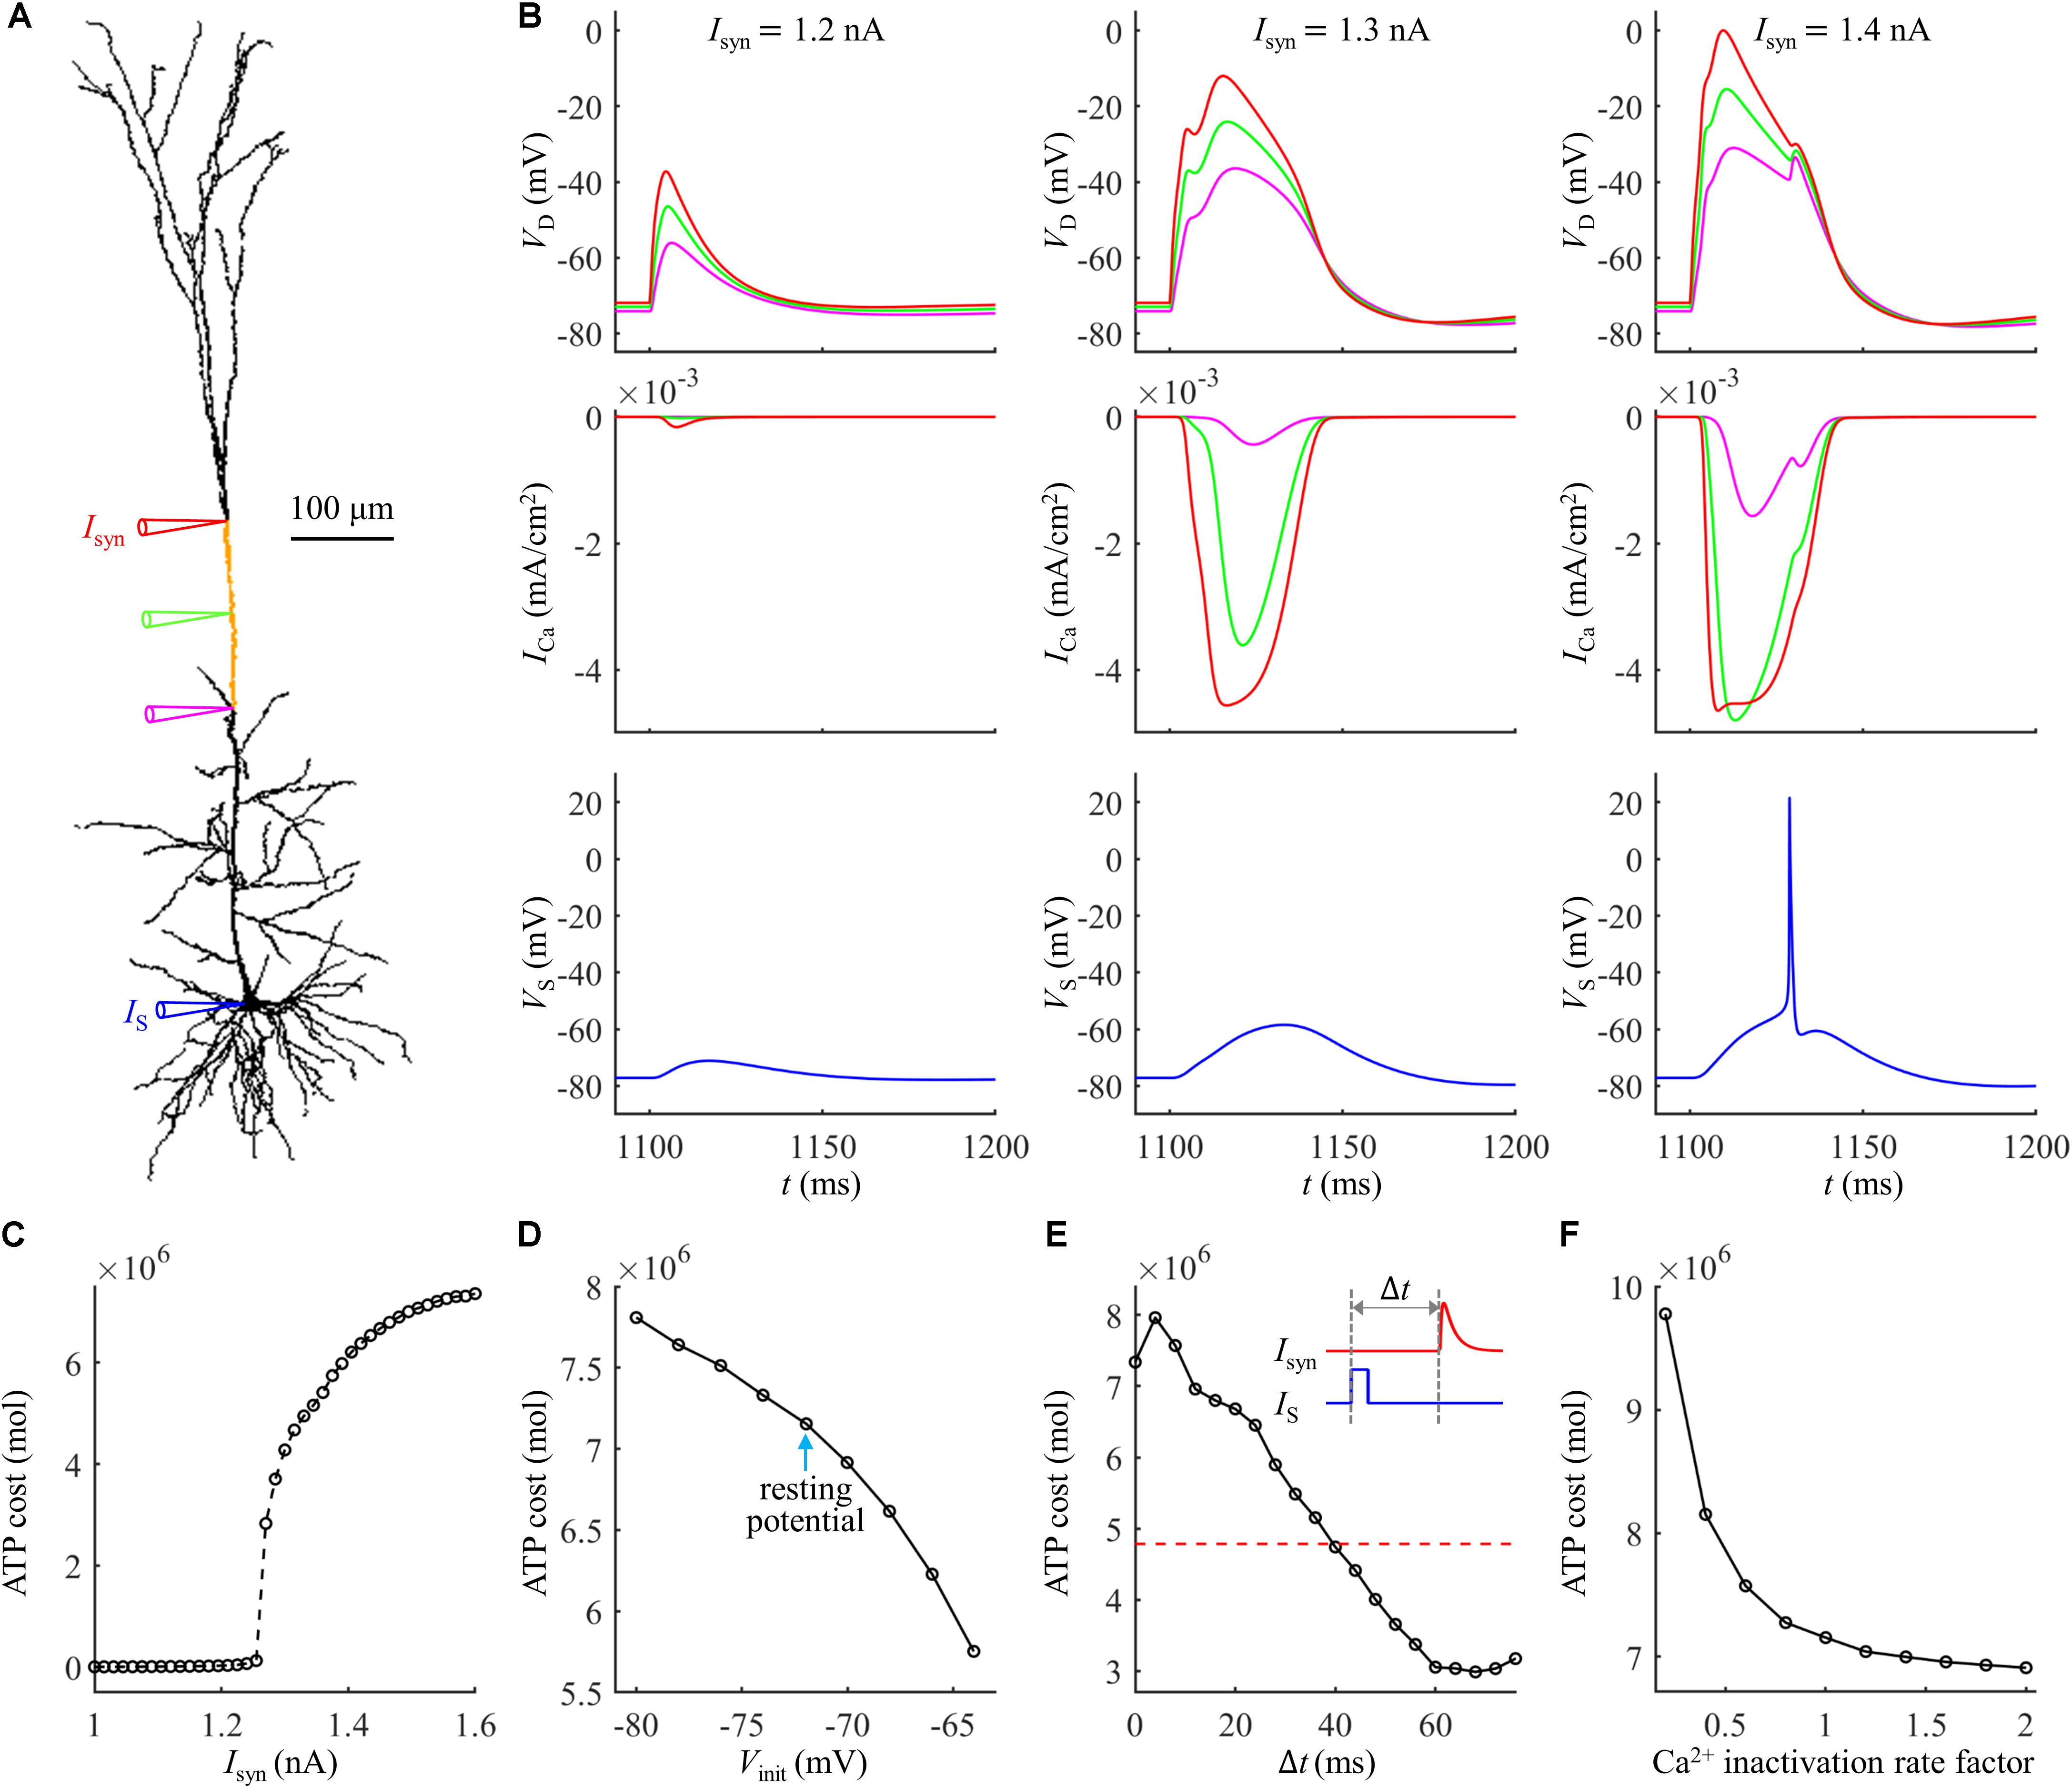
Figure 9. (A) Schematic of the computational model of Hay et al. (2011), which was available for public download at https://senselab.med.yale.edu/modeldb/ShowModel.cshtml?model=139653. The site of distal injection was indicated by a red triangle, and the site of somatic injection was indicated by a blue triangle. The ATP cost was computed in the yellow dendrite. The synaptic input Isyn was modeled with a shape of double exponential function. Following Hay et al. (2011), the rise time of Isyn was 0.5 ms and the decay time was 5 ms. (B) Time courses of dendritic voltage VD, underlying Ca2+ current ICa, and somatic voltage VS at Isyn = 1.2, 1.3, and 1.4 nA. The recording sites were indicated by the triangles of same color in (A). IS = 0 nA. (C) ATP cost of a Ca2+ spike plotted as a function of Isyn (IS = 0 nA). The threshold of synaptic input for activation of a Ca2+ spike was Ith = 1.27 nA. (D) Ca2+ spike cost plotted as a function of dendritic voltage. A constant current of 1000 ms was injected to the yellow dendrite. At the end of 1000 ms constant injection, a synaptic input Isyn was applied to evoke a Ca2+ AP. Vinit indicated the voltage at which a Ca2+ spike was initiated. Isyn = 1.2Ith and IS = 0 nA. (E) ATP cost of a Ca2+ spike plotted as a function of the interval Δt. Inset: Isyn was injected at Δt after the onset of somatic injection IS. The red dotted line indicated the spike cost without a bAP. IS was a 5 ms brief pulse of 1.4 nA. Isyn = 1.31 nA. (F) ATP cost of a Ca2+ spike plotted as a function of Ca2+ inactivation rate factor. Isyn = 1.2Ith and IS = 0 nA.
We injected a synaptic input Isyn at the main bifurcation of the apical dendrites (402.54041 μm from the soma), indicated by a red triangle in Figure 9A. The threshold of synaptic input for activating a Ca2+ spike was Ith = 1.27 nA. At Isyn < Ith, the dendrites generated passive responses and no Ca2+ spike was activated (Figure 9B, left). At Ith ≤ Isyn < 1.36 nA, the dendrites generated a Ca2+ spike in the apical dendrite. However, the resulting AP was significantly attenuated as it propagated to the soma/axon, which was unable to activate a Na+ spike in the cell body (Figure 9B, center). At Isyn ≥ 1.36 nA, the Ca2+ spike activated Na+ spikes in the soma (Figure 9B, right).
We repeated above simulations to examine the ATP cost of a Ca2+ spike, which was computed in the yellow dendrite shown in Figure 9A. The surface area of this dendrite was 2034.8 μm2. The results in Figures 9C–F showed that our above predictions were largely reproduced in this model with different morphologies and biophysics. Here the synaptic inputs, dendritic voltage, bAP, and Ca2+ inactivation produced very similar effects on the Ca2+ spike cost to those described above. Note that the Ca2+ influx underlying a Ca2+ spike was much smaller in the model of Hay et al. (2011) compared with the model of Schaefer et al. (2003), and thus the ATP cost on Ca2+ extrusion was much lower than that described above.
We also compared the ATP consumption on reversing Ca2+ influx in the dendrites with the consumption on Na+ ion pumping in the soma. The ATP requirements per unit area in the yellow dendrite and whole dendrites was both smaller as compared to the soma (Figure 10A). However, the total surface area of the whole dendrites was 21009.325065 μm2, which was much larger than somatic area (i.e., 1131.3891 μm2). Thus, more ATP molecules were required for reversing Ca2+ influx in the whole dendrites than for Na+ ion pumping in the soma (Figure 10B). At Isyn < 1.4Ith, the Ca2+ spike only activates one Na+ spike in the soma (Figure 10C). At Isyn ≥ 1.4Ith, two Na+ spikes were generated during a Ca2+ spike. Thus, the ATP cost in the soma at Isyn = 1.4Ith was about twofold more than that at Isyn = 1.3Ith. This indicated that the generation of a Ca2+ AP made a significant contribution to the signaling-related energy in the pyramidal models, which was consistent with above simulations.
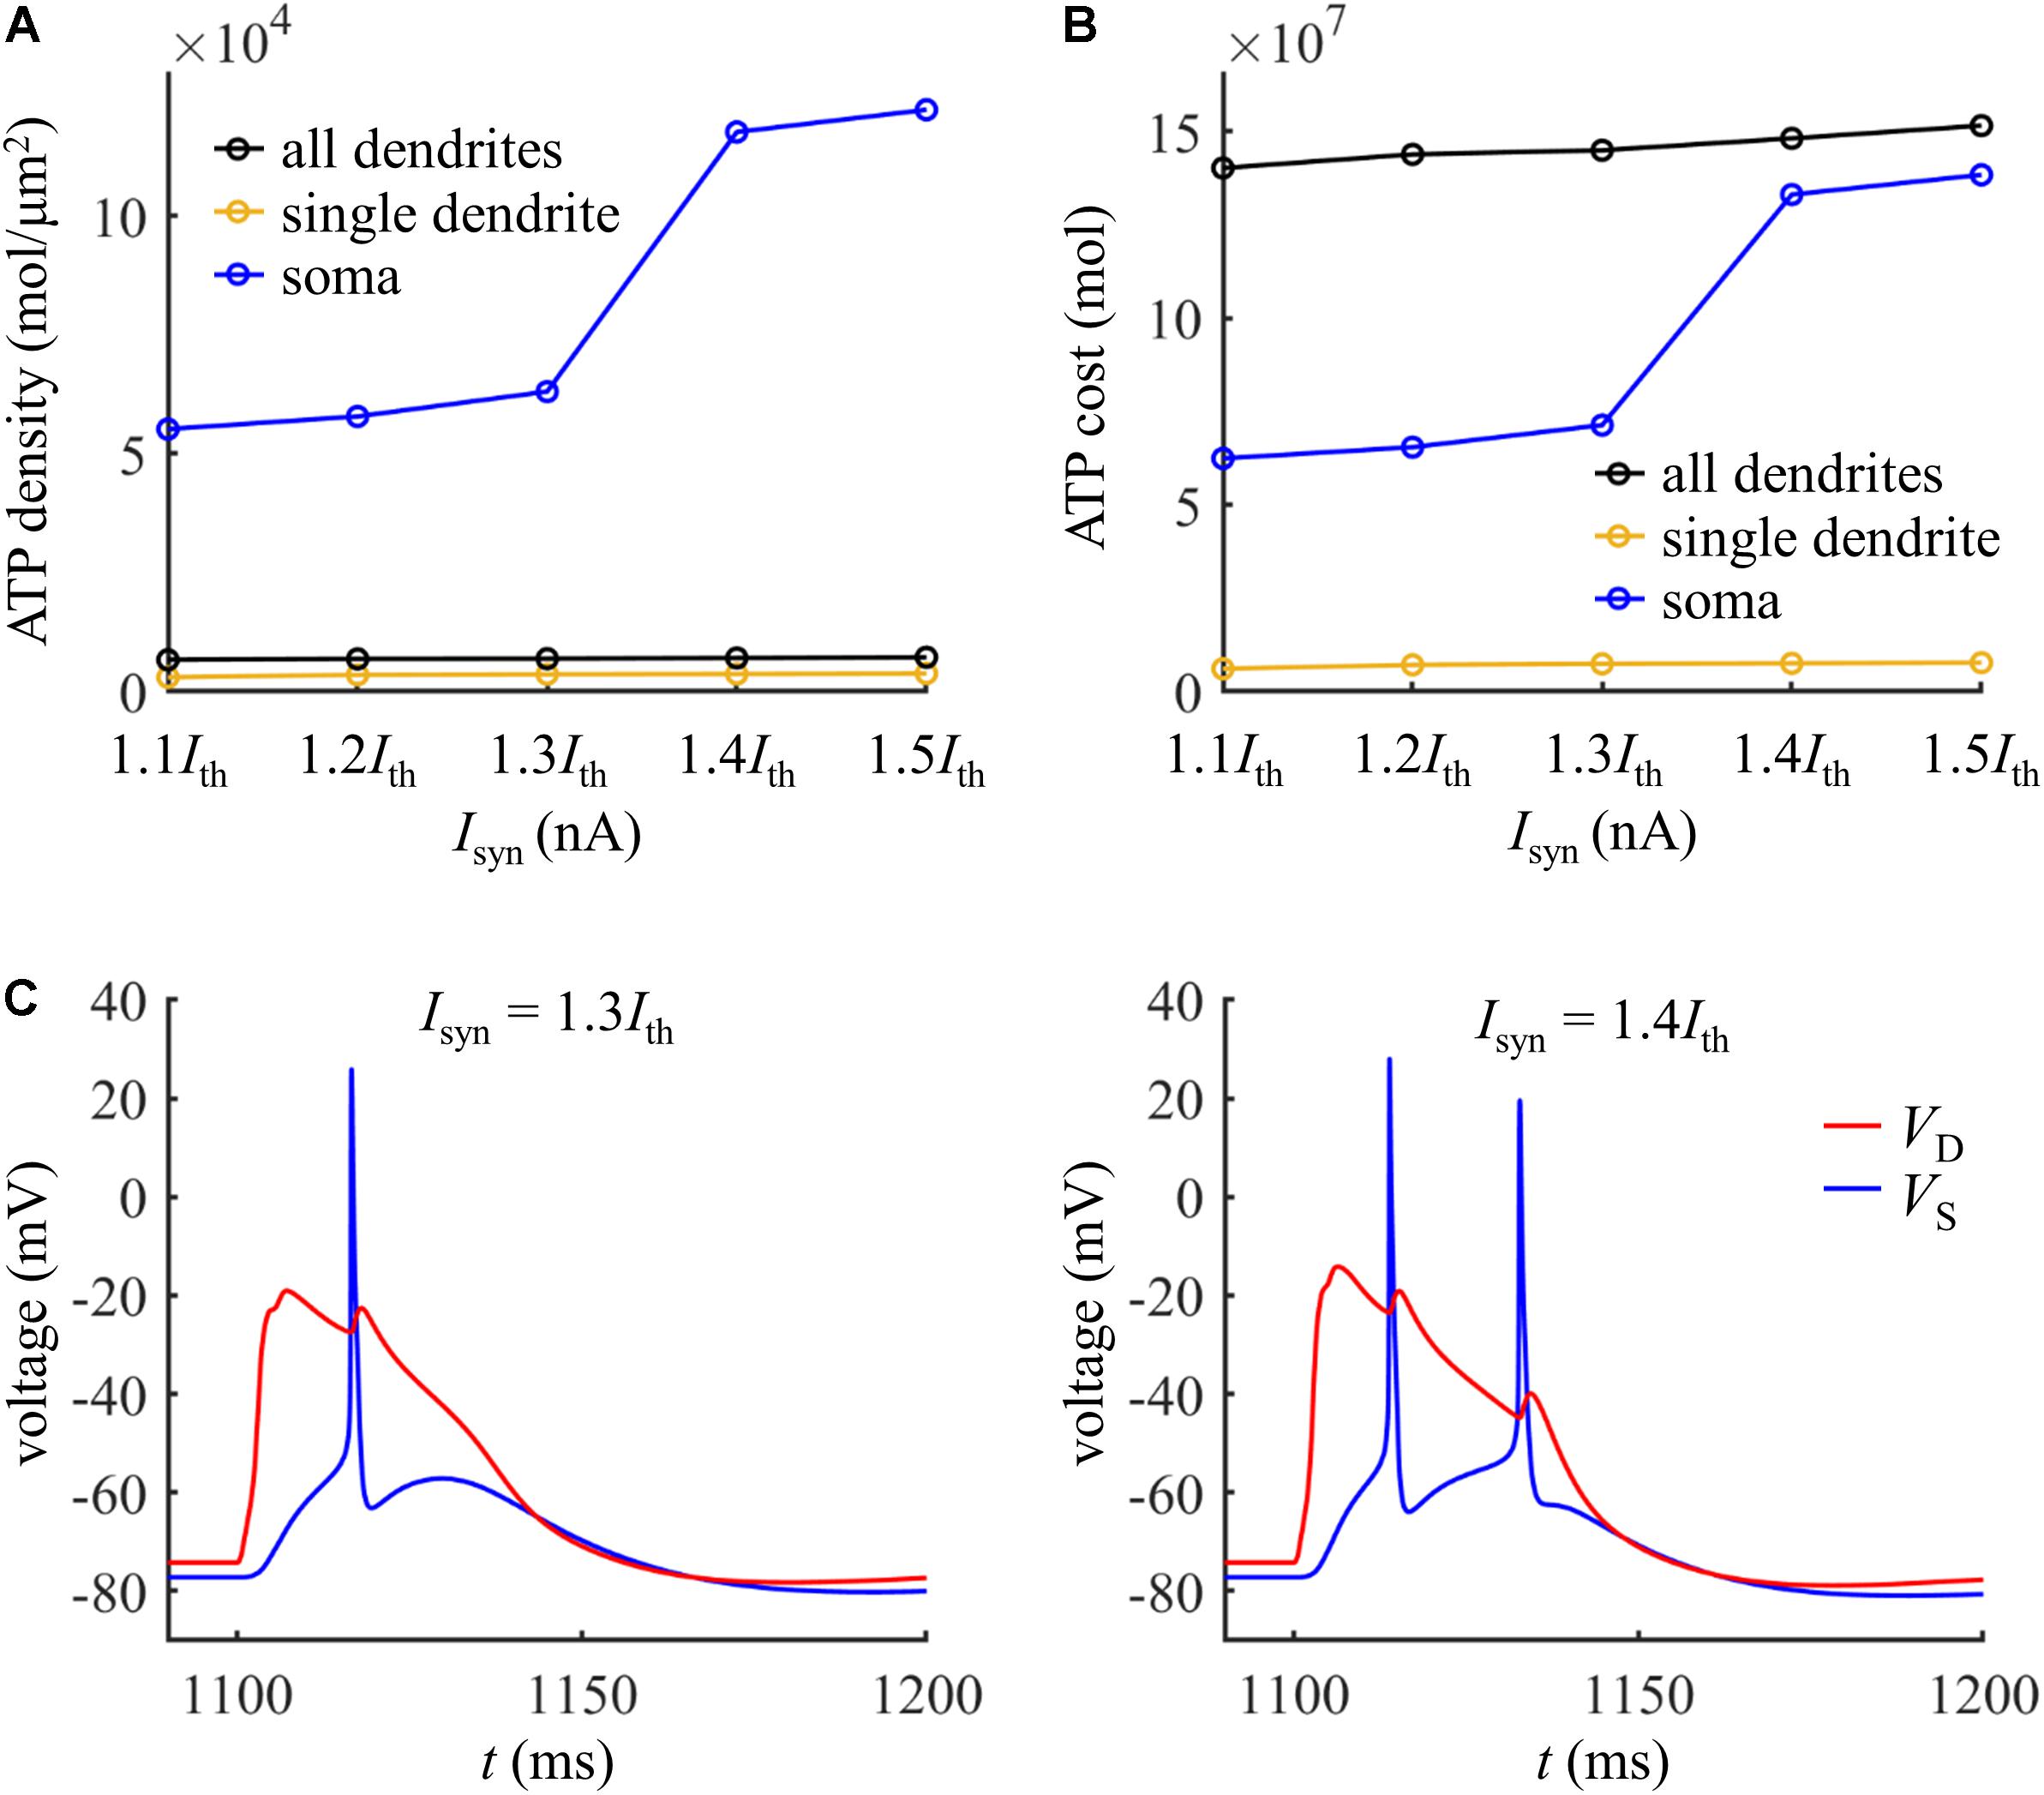
Figure 10. (A) ATP cost per unit membrane area during a Ca2+ spike. (B) Total ATP cost during a Ca2+ spike. The synaptic input was injected in the yellow dendrite, which was Isyn = 1.1Ith, 1.2Ith, 1.3Ith, 1.4Ith, and 1.5Ith. The ATP cost was, respectively, computed in the soma, yellow dendrite, and whole dendrites. (C) Left panel: time courses of somatic voltage VS and dendritic voltage VD at Isyn = 1.3Ith. Right panel: time courses of VS and VD at Isyn = 1.4Ith. The recording site of VS and VD were indicated by the triangles of same color in Figure 9A. IS = 0 nA.
Discussion
We used biologically realistic models of L5 pyramidal neurons to investigate the energy cost of a Ca2+ spike initiated in the apical dendrites. The energy cost was estimated with the following approaches. We integrated the inward Ca2+ currents to give the total Ca2+ influx, and then calculated the number of ATP molecules that were hydrolyzed to restore the homeostasis of intracellular Ca2+ concentrations, operating with a ratio of one Ca2+ ion per ATP. These calculations allowed us to develop a qualitative understanding of the effects of synaptic inputs, dendritic voltage, bAP, and Ca2+ inactivation on the energy consumption associated with a Ca2+ spike.
Energy budgets for neural computation indicated that the synaptic transmission mediated by pre- and postsynaptic mechanisms consumed about 55% of the total ATP used in neocortex cells (Attwell and Laughlin, 2001; Harris et al., 2012; Howarth et al., 2012). In particular, up to 50% signaling energy was expended on the actions of postsynaptic excitatory receptors in cortex neurons, such as, reversing ionic fluxes producing excitatory postsynaptic currents and dendritic APs. The Ca2+ spike is a typical suprathreshold response in the apical dendrites. Our simulations suggested that the Ca2+ spikes consumed substantial ATP molecules in the dendrites, which makes a significant contribution to the overall usage of signaling-related energy in pyramidal neurons. These data were consistent with earlier predictions of energy budgets in the cerebral cortex (Attwell and Laughlin, 2001; Howarth et al., 2012).
The single dendritic branch is a fundamental functional unit of signaling in the nervous system (Branco and Häusser, 2010). In L5 pyramidal cells, the dendrites receive a number of synaptic inputs from cortical layers and deliver them to the soma/axon. Each dendrite also acts as an independent processing and signaling unit, which performs supralinear and sublinear summations of the incoming signals as propagating them to the soma (Tran-Van-Minh et al., 2015). The dendritic integrations are crucial for the computational capability of a neuron. As a supralinear integration operated by the dendrites, the Ca2+ AP propagates distal signals to the soma/axon, which provides a cellular mechanism for coupling inputs arriving at different cortical layers (Larkum et al., 1999; Larkum, 2013). Our simulations indicated that the whole dendrites consumed substantial ATP on Ca2+ ion pumping during a Ca2+ spike. This high ATP demand may be related to the dendritic function of integrating signals.
Experimental recordings (Hallermann et al., 2012) made in the axon of pyramidal neurons reported that the metabolic cost and energy efficiency of a Na+ AP were dependent on the membrane potential. Our simulations showed that the dendritic voltage determined the inactivation and availability of voltage-gated Ca2+ channels. Thus, the ATP cost of a Ca2+ spike in L5 pyramidal model neurons also depended on dendritic voltage, which was consistent with the findings of Hallermann et al. (2012). The voltage dependence of Ca2+ spike cost in neocortical neurons makes it complicated to estimate the signaling-related energy with experimental approaches. In this sense, the computational modeling provides a powerful tool to understand the energy budget for signaling in a specific neuron.
Larkum et al. (1999) showed that the back-propagating Na+ spike in the soma/axon reduced the threshold of a Ca2+ spike and activated BAC firing in the apical dendrites when it coincided with synaptic inputs within a time window of several milliseconds (Schaefer et al., 2003; Larkum, 2013). We extended their results to show that the bAP regulated the ATP cost of a Ca2+ spike, which depended on the timing of synaptic inputs relative to the onset of bAP. Our results also indicated that the effects of a bAP on Ca2+ spike cost were due to its interactions with dendritic depolarization, which altered the availability of dendritic Ca2+ channels. Further, Larkum et al. (1999) also reported that the BAC firing was a cellular mechanism in pyramidal cells for coupling inputs arriving at different cortical layers. Based on our simulations, we inferred that the higher Ca2+ influx during a BAC firing may be for coupling cortical signals despite the additional metabolic cost.
Earlier studies predicted that Na+ inactivation governed the metabolic energy of a Na+ AP in the soma/axon (Hasenstaub et al., 2010; Hallermann et al., 2012). Fast Na+ inactivation increased Na+ entry efficiency and limited the ATP cost of Na+ spikes. On the contrary, slowing Na+ inactivation rate reduced the efficiency of Na+ influx, increasing spike cost. Our simulations were consistent with these previous studies, and we extended these prior observations to show that slowing Ca2+ inactivation increased the ATP cost of a dendritic Ca2+ spike, whereas accelerating Ca2+ inactivation reduced the Ca2+ spike cost. These data suggested that the inactivation kinetics of ion channels played considerable roles in the energy consumption of neuronal computation.
Conclusion
To the best of our knowledge, this computational study was the first investigation of the metabolic energy associated with dendritic Ca2+ APs in pyramidal cells. Our simulations predicted that the ATP cost of a Ca2+ spike depended on the state of dendritic activity. Synaptic inputs, membrane voltage, bAP, and Ca2+ inactivation all contributed to determining the energy consumption of a dendritic Ca2+ spike. The results suggested that the pyramidal neurons were able to dynamically adjust their energy demand based on dendritic responses, which should be considered when understanding the dendritic processing in the pyramidal cells, the energy budget for signaling in the cerebral cortex, as well as the metabolism-dependent functional brain imaging signals. Based on computational modeling, we provided a qualitative interpretation of how subcellular processes and membrane biophysics were organized effectively and efficiently to perform neural computation. The predictions were important for inspiring engineers to design energy-efficient neuromorphic devices.
Data Availability Statement
All datasets generated for this study are included in the article/supplementary material.
Author Contributions
GY and JW conceived and designed the work, and wrote the manuscript. GY and YF performed the simulations. GY, YF, and JW analyzed and interpreted the data.
Funding
This work was supported in part by the National Natural Science Foundation of China under Grant 61601320, the Tianjin Municipal Natural Science Foundation under Grant 19JCQNJC01200, and the Tianjin University PEIYANG Scholar – Reserved Academic Program under Project 2019XRG-0051.
Conflict of Interest
The authors declare that the research was conducted in the absence of any commercial or financial relationships that could be construed as a potential conflict of interest.
References
Attwell, D., and Gibb, A. (2005). Neuroenergetics and the kinetic design of excitatory synapses. Nat. Rev. Neurosci. 6, 841–849. doi: 10.1038/nrn1784
Attwell, D., and Laughlin, S. B. (2001). An energy budget for signaling in the grey matter of the brain. J. Cereb. Blood Flow Metab. 21, 1133–1145. doi: 10.1097/00004647-200110000-00001
Binzegger, T., Douglas, R. J., and Martin, K. A. (2004). A quantitative map of the circuit of cat primary visual cortex. J. Neurosci. 24, 8441–8453. doi: 10.1523/jneurosci.1400-04.2004
Branco, T., and Häusser, M. (2010). The single dendritic branch as a fundamental functional unit in the nervous system. Curr. Opin. Neurobiol. 20, 494–502. doi: 10.1016/j.conb.2010.07.009
Cruz-Albrecht, J. M., Yung, M. W., and Srinivasa, N. (2012). Energy-efficient neuron, synapse and STDP integrated circuits. IEEE Trans. Biomed. Circuits Syst. 6, 246–256. doi: 10.1109/TBCAS.2011.2174152
Hallermann, S., de Kock, C. P., Stuart, G. J., and Kole, M. H. (2012). State and location dependence of action potential metabolic cost in cortical pyramidal neurons. Nat. Neurosci. 15, 1007–1014. doi: 10.1038/nn.3132
Harris, J. J., Jolivet, R., and Attwell, D. (2012). Synaptic energy use and supply. Neuron 75, 762–777. doi: 10.1016/j.neuron.2012.08.019
Hasenstaub, A., Otte, S., Callaway, E., and Sejnowski, T. J. (2010). Metabolic cost as a unifying principle governing neuronal biophysics. Proc. Natl. Acad. Sci. U.S.A. 107, 12329–12334. doi: 10.1073/pnas.0914886107
Hay, E., Hill, S., Schurmann, F., Markram, H., and Segev, I. (2011). Models of neocortical layer 5b pyramidal cells capturing a wide range of dendritic and perisomatic active properties. PLoS Comput. Biol. 7:e1002107. doi: 10.1371/journal.pcbi.1002107
Hines, M. L., and Carnevale, N. T. (2001). Neuron: a tool for neuroscientists. Neuroscientist 7, 123–135. doi: 10.1177/107385840100700207
Howarth, C., Gleeson, P., and Attwell, D. (2012). Updated energy budgets for neural computation in the neocortex and cerebellum. J. Cereb. Blood Flow Metab. 32, 1222–1232. doi: 10.1038/jcbfm.2012.35
Izhikevich, E. M. (2007). Dynamical Systems in Neuroscience: The Geometry of Excitability and Bursting. Cambridge, MA: The MIT Press.
Larkum, M. E. (2013). A cellular mechanism for cortical associations: an organizing principle for the cerebral cortex. Trends Neurosci. 36, 141–151. doi: 10.1016/j.tins.2012.11.006
Larkum, M. E., Zhu, J. J., and Sakmann, B. (1999). A new cellular mechanism for coupling inputs arriving at different cortical layers. Nature 398, 338–341. doi: 10.1038/18686
Larkum, M. E., Zhu, J. J., and Sakmann, B. (2001). Dendritic mechanisms underlying the coupling of the dendritic with the axonal action potential initiation zone of adult rat layer 5 pyramidal neurons. J. Physiol. 533, 447–466. doi: 10.1111/j.1469-7793.2001.0447a.x
Laughlin, S. B. (2001). Energy as a constraint on the coding and processing of sensor information. Curr. Opin. Neurobiol. 11, 475–480. doi: 10.1016/s0959-4388(00)00237-3
Lennie, P. (2003). The cost of cortical computation. Curr. Biol. 13, 493–497. doi: 10.1016/s0960-9822(03)00135-0
Magee, J. C. (2000). Dendritic integration of excitatory synaptic input. Nat. Rev. Neurosci. 1, 181–190. doi: 10.1038/35044552
Magistretti, P. J., and Allaman, I. (2015). A cellular perspective on brain energy metabolism and functional imaging. Neuron 86, 883–901. doi: 10.1016/j.neuron.2015.03.035
Schaefer, A. T., Larkum, M. E., Sakmann, B., and Roth, A. (2003). Coincidence detection in pyramidal neurons is tuned by their dendritic branching pattern. J. Neurophysiol. 89, 3143–3154. doi: 10.1152/jn.00046.2003
Sengupta, B., Laughlin, S. B., and Niven, J. E. (2013). Balanced excitatory and inhibitory synaptic currents promote efficient coding and metabolic efficiency. PLoS Comput. Biol. 9:e1003263. doi: 10.1371/journal.pcbi.1003263
Sengupta, B., Stemmler, M. B., Laughlin, S. B., and Niven, J. E. (2010). Action potential energy efficiency varies among neuron types in vertebrates and invertebrates. PLoS. Comput. Biol. 6:e1000840. doi: 10.1371/journal.pcbi.1000840
Sengutpa, B., and Stemmler, M. B. (2014). Power consumption during neuronal computation. Proc. IEEE 102, 738–750. doi: 10.1109/jproc.2014.2307755
Spruston, N. (2008). Pyramidal neurons: dendritic structure and synaptic integration. Nat. Rev. Neurosci. 9, 206–221. doi: 10.1038/nrn2286
Stuart, G. J., and Spruston, N. (2015). Dendritic integration: 60 years of progress. Nat. Neurosci. 18, 1713–1721. doi: 10.1038/nn.4157
Tran-Van-Minh, A., Cazé, R. D., Abrahamsson, T., Cathala, L., Gutkin, B. S., and DiGregorio1, D. A. (2015). Contribution of sublinear and supralinear dendritic integration to neuronal computations. Front. Cell. Neurosci. 9:67. doi: 10.3389/fncel.2015.00067
Yang, D. P., Zhou, H. J., and Zhou, C. (2017). Co-emergence of multi-scale cortical activities of irregular firing, oscillations and avalanches achieves cost-efficient information capacity. PLoS Comput. Biol. 13:e1005384. doi: 10.1371/journal.pcbi.1005384
Yi, G. S., and Grill, W. M. (2019). Average firing rate rather than temporal pattern determines metabolic cost of activity in thalamocortical relay neurons. Sci. Rep. 9:6940. doi: 10.1038/s41598-019-43460-8
Yi, G. S., Wang, J., Tsang, K. M., Wei, X. L., and Deng, B. (2015). Input-output relation and energy efficiency in the neuron with different spike threshold dynamics. Front. Comput. Neurosci. 9:62. doi: 10.3389/fncom.2015.00062
Yi, G. S., Wang, J., Wei, X. L., and Deng, B. (2017). Dendritic properties control energy efficiency of action potentials in cortical pyramidal cells. Front. Cell. Neurosci. 11:265. doi: 10.3389/fncel.2017.00265
Yi, G. S., Wei, X. L., Wang, J., Deng, B., and Che, Y. Q. (2019). Modulations of dendritic Ca2+ spike with weak electric fields in layer 5 pyramidal cells. Neural Netw. 110, 8–18. doi: 10.1016/j.neunet.2018.10.013
Yu, L., and Liu, L. (2014). Optimal size of stochastic Hodgkin-Huxley neuronal systems for maximal energy efficiency in coding pulse signals. Phys. Rev. E Stat. Nonlin. Soft Matter Phys. 89:032725.
Yu, L., Shen, Z., Wang, C., and Yu, Y. (2018). Efficient coding and metabolic efficiency promoted by balanced excitatory and inhibitory synaptic connections in neuronal networks. Front. Cell. Neurosci. 12:123. doi: 10.3389/fncel.2018.00123
Yu, L., and Yu, Y. (2017). Energy-efficient neural information processing in individual neurons and neuronal networks. J. Neurosci. Res. 95, 2253–2266. doi: 10.1002/jnr.24131
Yu, L., Zhang, C., Liu, L., and Yu, Y. (2016). Energy-efficient population coding constrains network size of a neuronal array system. Sci. Rep. 6:19369. doi: 10.1038/srep19369
Keywords: Ca2+ action potential, energy cost, dendrites, computational model, pyramidal neuron
Citation: Yi G, Fan Y and Wang J (2019) Metabolic Cost of Dendritic Ca2+ Action Potentials in Layer 5 Pyramidal Neurons. Front. Neurosci. 13:1221. doi: 10.3389/fnins.2019.01221
Received: 03 July 2019; Accepted: 29 October 2019;
Published: 12 November 2019.
Edited by:
Yu-Guo Yu, Fudan University, ChinaReviewed by:
Lianchun Yu, Lanzhou University, ChinaSongting Li, Shanghai Jiao Tong University, China
Copyright © 2019 Yi, Fan and Wang. This is an open-access article distributed under the terms of the Creative Commons Attribution License (CC BY). The use, distribution or reproduction in other forums is permitted, provided the original author(s) and the copyright owner(s) are credited and that the original publication in this journal is cited, in accordance with accepted academic practice. No use, distribution or reproduction is permitted which does not comply with these terms.
*Correspondence: Jiang Wang, amlhbmd3YW5nQHRqdS5lZHUuY24=