 Haiyan Li1 Sarah M. Foss1,2 Yuriy L. Dobryy1† C. Kevin Park1
 Samuel Andrew Hires3,4†
 Nathan C. Shaner3,4† Roger Y. Tsien3,4
 Leslie C. Osborne5
 Susan M. Voglmaier1*
- 1 Department of Psychiatry, School of Medicine, University of California San Francisco, San Francisco, CA, USA
- 2 Graduate Program in Cell Biology, School of Medicine, University of California San Francisco, San Francisco, CA, USA
- 3 Department of Pharmacology, Howard Hughes Medical Institute, University of California San Diego, La Jolla, CA, USA
- 4 Department of Chemistry, and Biochemistry, Howard Hughes Medical Institute, University of California San Diego, La Jolla, CA, USA
- 5 Department of Neurobiology, University of Chicago, Chicago, IL, USA
Synaptic transmission involves the calcium dependent release of neurotransmitter from synaptic vesicles. Genetically encoded optical probes emitting different wavelengths of fluorescent light in response to neuronal activity offer a powerful approach to understand the spatial and temporal relationship of calcium dynamics to the release of neurotransmitter in defined neuronal populations. To simultaneously image synaptic vesicle recycling and changes in cytosolic calcium, we developed a red-shifted reporter of vesicle recycling based on a vesicular glutamate transporter, VGLUT1-mOrange2 (VGLUT1-mOr2), and a presynaptically localized green calcium indicator, synaptophysin-GCaMP3 (SyGCaMP3) with a large dynamic range. The fluorescence of VGLUT1-mOr2 is quenched by the low pH of synaptic vesicles. Exocytosis upon electrical stimulation exposes the luminal mOr2 to the neutral extracellular pH and relieves fluorescence quenching. Reacidification of the vesicle upon endocytosis again reduces fluorescence intensity. Changes in fluorescence intensity thus monitor synaptic vesicle exo- and endocytosis, as demonstrated previously for the green VGLUT1-pHluorin. To monitor changes in calcium, we fused the synaptic vesicle protein synaptophysin to the recently improved calcium indicator GCaMP3. SyGCaMP3 is targeted to presynaptic varicosities, and exhibits changes in fluorescence in response to electrical stimulation consistent with changes in calcium concentration. Using real time imaging of both reporters expressed in the same synapses, we determine the time course of changes in VGLUT1 recycling in relation to changes in presynaptic calcium concentration. Inhibition of P/Q- and N-type calcium channels reduces calcium levels, as well as the rate of synaptic vesicle exocytosis and the fraction of vesicles released.
Introduction
The coupling of calcium influx to the release of neurotransmitter by exocytosis from synaptic vesicles underlies quantal neurotransmission (Katz and Miledi, 1969). Although this process has been studied in detail in individual synapses electrophysiologically, optical reporters of Ca2+ flux and synaptic vesicle recycling offer the opportunity to simultaneously image activity across numerous synapses in neural circuits and networks (Takahashi and Momiyama, 1993; Wheeler et al., 1994; Von Gersdorff and Matthews, 1999; Schneggenburger and Neher, 2000; Zakharenko et al., 2001; Li et al., 2005b; Dreosti et al., 2009; Tian et al., 2009). Optical methods allow direct measurement of presynaptic phenomena, which most electrophysiological techniques assess either indirectly or in a subset of specialized synapses such as the Calyx of Held (Von Gersdorff and Matthews, 1999; Schneggenburger et al., 2002). For optical measurements of neural activity, both genetically encoded fluorescent indicators and small molecule-based reporters have emerged. Genetically encoded fluorescent proteins can be targeted to specific neuronal populations, offering an advantage over small molecule reporters such as Ca2+ sensitive dyes or the styryl amphipathic FM dyes that label recycling synaptic vesicles (Betz and Bewick, 1993; Dreosti and Lagnado, 2011). Further, fusions with proteins of interest provide a means to target fluorescent reporters to specific subcellular regions (Shaner et al., 2008). For example, fusion of the genetically encoded calcium indicator (GECI) GCaMP2 to synaptophysin localizes it to synaptic vesicles, providing a reliable sensor of calcium transients in the presynaptic terminal (Dreosti et al., 2009). An improved GECI, GCaMP3, offers an opportunity to develop a presynaptically localized calcium indicator with a higher signal to noise ratio and increased dynamic range (Tian et al., 2009).
Targeting the genetically encoded ecliptic pHluorins to the luminal domains of synaptic vesicle proteins has provided a powerful method to measure synaptic vesicle recycling. Ecliptic pHluorins are green fluorescent protein (GFP) derivatives that are shifted in their pH sensitivity such that their fluorescence is quenched at the low pH of synaptic vesicles. Exocytosis of synaptic vesicles relieves this quenching, and endocytosis and subsequent reacidification result in decreases in fluorescence. The rates of fluorescence change thus measure exo- and endocytosis (Miesenböck et al., 1998; Sankaranarayanan and Ryan, 2000; Voglmaier et al., 2006). We wanted to investigate the dependence of synaptic vesicle recycling on Ca2+ dynamics by coexpression of a reporter of synaptic vesicle recycling along with GCaMP3. However, since GCaMPs are also derived from GFP, signals from pHluorin and GCaMP fusions cannot easily be distinguished. The development of a photostable, pH-sensitive fluorescent protein emitting a different color of light, mOrange2 (mOr2), opens the possibility of imaging synaptic vesicle dynamics, and changes in presynaptic Ca2+ concentrations in the same synapses (Shaner et al., 2008). The red-shifted mOr2 protein was derived from DsRed from Discoma sp., but differs in its pKa. Like pHluorin, the fluorescence of mOr2 is quenched by the low pH of synaptic vesicles (pH 5.5), and quenching is relieved at neutral pH.
Fusions of super-ecliptic pHluorin with the synaptic vesicle proteins synaptobrevin, synaptophysin, synaptotagmin, SV2, and the vesicular glutamate transporter VGLUT1 have all been used to measure synaptic vesicle recycling (Miesenböck et al., 1998; Sankaranarayanan and Ryan, 2000; Granseth et al., 2006; Voglmaier et al., 2006; Kwon and Chapman, 2011). A fusion of VGLUT1 with super-ecliptic pHluorin (VGLUT1-pH) exhibits a high signal to noise ratio, likely because very little endogenous or tagged VGLUT1 is expressed on the plasma membrane or outside the presynaptic compartment (Voglmaier et al., 2006; Balaji and Ryan, 2007; Zhu et al., 2009). Therefore, we fused mOr2 to VGLUT1 to create an accurate reporter of synaptic vesicle recycling. Engineering two molecules of mOr2 in tandem in an intraluminal loop of VGLUT1 optimizes the signal to noise ratio. We also generated an improved presynaptic GECI by fusing GCaMP3 to synaptophysin to create SyGCaMP3. Both reporters are expressed in the presynaptic terminal in transfected neurons. Monitoring changes in green and red fluorescence in neurons coexpressing the two reporters provides an optical readout of the spatial and temporal properties of calcium triggered synaptic vesicle recycling.
Materials and Methods
Reagents
Bafilomycin, ω-conotoxin GVIA, and ionomycin were obtained from Calibochem (San Diego, CA, USA). CPP, CNQX, and ω-agatoxin TK were purchased from Tocris (Ellisville, MO, USA). FM4-64 was obtained from Biotium (Hayward, CA, USA). All other chemicals were from Sigma-Aldrich (St. Louis, MO, USA). All cell culture reagents were from Invitrogen (Carlsbad, CA, USA) unless otherwise noted. Conotoxin was resuspended in DMSO at 1 mM and ω-agatoxin TK was resuspended in the recording medium at 1.2 μM, before dilution to final concentrations.
Molecular Biology
VGLUT1-mOr2 fusions were constructed by inserting the mOr2 cDNA, flanked with linkers, between Val-103 and Val-104 of rat VGLUT1, the same site containing pHluorin in VGLUT1-pH. Overlap extension PCR mutagenesis was used to flank mOrange2 with a 5′ linker (SGSTSGGSGGTGG) and 3′ linker (SGGTGGSGGTGGSGGTG). For VGLUT1-2xmOr2, we inserted two copies of the mOr2 using PCR to insert a linker sequence (SGTSTGGSGGTGG) between the two mOr2 molecules. Overlap extension PCR was used to generate SyGCaMP3 by fusion of GCaMP3 (gift of Loren Looger, HHMI, Addgene plasmid 22692) to the C-terminus of rat synaptophysin, with short linker sequences (GGS or GGSGGT). Constructs with both linker sequences gave similar results; experiments presented here use the SyGCaMP3 fusion with the six amino acid linker. All cDNAs were subcloned into pCAGGS for expression under the control of a modified chicken actin promoter.
Primary Hippocampal Culture, Transfection, and Immunofluorescence
Hippocampi from embryonic day 19–20 rats were dissected and dissociated as previously described (Li et al., 2005a). Neurons were transfected using the Basic Neuron SCN Nucleofector kit, according to manufacturer’s instructions (Lonza, Walkersville, MD, USA). Neurons transfected by nucleofection express similar, moderate levels of protein (Li et al., 2005a). Cells were subsequently maintained in Neurobasal media supplemented with 1% heat inactivated fetal bovine serum (FBS), 10% NeuroMix growth supplement (PAA, Dartmouth, MA, USA), 2 mM GlutaMax, 15 mM NaCl, and 10 μg/ml primocin (Lonza) and imaged at 14–21 days in vitro (DIV). 5-fluoro-2′-deoxyuridine (10 μM final concentration) was added at DIV3–5 as a mitotic inhibitor to control glial growth. All work with animals was conducted under the supervision and guidance of the Institutional Care and Use Committee of the University of California, San Francisco.
For immunostaining, cells were fixed in 4% PFA for 5 min, then in cold methanol for 5 min at −20°C, permeabilized, and blocked in phosphate-buffered saline (PBS) containing 0.02% saponin/1% fish gelatin/5% BSA, and then stained with rabbit anti-VGLUT1 (gift of R. Edwards, University of California, San Francisco), rabbit anti-synaptophysin (Invitrogen, Carlsbad, CA, USA), or mouse anti-SV2 (gift of R. Kelly, University of California, San Francisco) followed by appropriate secondary antibodies conjugated to FITC, Cy3, or Cy5 (Jackson ImmunoResearch, West Grove, PA, USA). Cells were imaged using confocal laser microscopy (Zeiss LSM 510).
Live Cell Imaging
Coverslips with transfected hippocampal neurons were mounted in a rapid switching, laminar-flow perfusion, and stimulation chamber (Warner Instruments, Holliston, MA, USA) on an inverted epifluorescence microscope (Nikon, Melville, NY, USA) and imaged at room temperature using a 63× oil objective (NA = 1.4). Cells were imaged in modified Tyrode’s solution pH 7.4 (in mM: 119 NaCl, 10 HEPES-NaOH, 30 glucose, 2.5 KCl, 2 CaCl2, 2 MgCl2) containing 10 μM each of the glutamate receptor antagonists 6-cyano-7 nitroquinoxaline-2,3-dione (CNQX) and 3-(2-carboxypiperazin-4-yl)propyl-1-phosphonic acid (CPP). Electrical stimulation to elicit action potentials (Gandhi and Stevens, 2003; Zhao et al., 2011) was applied using an A310 Accupulser (WPI, Sarasota, FL, USA) at 10–80 Hz with 1 ms bipolar current pulses through platinum-iridium electrodes, to yield fields of 5–10 V/cm across the chamber (Voglmaier et al., 2006). Cells were illuminated using a Xenon lamp (Sutter Instruments, Novato, CA, USA) with either a 470/40-nm excitation and a 525/50-nm emission filter (for GFP), a 470/40-nm excitation and 630/75 nm emission filter (for FM4-64), or a 545/25-nm excitation and 605/70 nm emission filter (for mOr2; Chroma, Bellows Falls, VT, USA). Images were acquired on a QuantEM CCD camera (Photometrics, Tuscon, AZ, USA) exposing each fluorophore for 300 ms for images collected every 3 s. For images collected every 400 ms, exposure time was reduced to 50 ms with EM gain. To measure the integrated responses of SyGCaMP3 to a range of 1–160 stimuli, the shutter remained open for 2 s. Stimulation, filter wheels, shutter, and camera are controlled by Metamorph software (Universal Imaging, Sunnyvale, CA, USA).
Data Analysis
The fluorescence of manually designated regions of interest was quantified (Metamorph), baseline values from the first five frames (prior to stimulation) averaged, and the dynamics of fluorescence intensity expressed as fractional change (ΔF) over initial fluorescence (F0). The fluorescence of a 4 × 4 pixel box centered over the bouton (a VGLUT1-2XmOr2-positive punctum) was averaged, and the average fluorescence of three 4 × 4 pixel boxes without cellular elements was subtracted as background. For normalized measurements, the average pHluorin or mOr2 fluorescence over individual boutons was normalized to either the peak fluorescence in each trace or the total amount of fluorescence as determined by application of modified Tyrode’s solution substituting 50 mM NH4Cl for 50 mM NaCl to alkalinize all synaptic compartments. To test the pH dependence of VGLUT1-2XmOr2, we measured the fluorescence of the indicator in permeabilized cells in the presence of 50 mM NH4Cl, in modified Tyrode’s solution at pH 4.0–10.0. The rates of photobleaching of VGLUT1-2XmOr2 and VGLUT1-pH were determined over the 5-min recording period, collecting 300 ms exposures every 3 s in the absence of stimulation. Photobleaching of SyGCaMP3 was measured in fixed, permeabilized cells in modified Tyrode’s solution. Minimum synaptic fluorescence of SyGCaMP3 was determined by perfusion of modified Tyrode’s solution containing 5 μM ionomycin, 0 Ca2+, and 10 mM EGTA (Fmin). The maximum change in fluorescence was measured in the presence of 5 μM ionomycin and 2 mM CaCl2 in modified Tyrode’s solution (Fmax). Frest is defined as the baseline fluorescence of SyGCaMP3 measured in modified Tyrodes’s with 2 mM CaCl2 in the absence of ionomycin. To generate the concentration response curve, varying concentrations of CaCl2 were added to Tyrode’s solution containing 1 mM EGTA and ionomycin to achieve calculated free Ca2+ concentrations of 0.1–2 mM (Maxchelator, Stanford; Patton et al., 2004). To measure the fluorescence decay of SyGCaMP3 to a reduction in calcium in the absence of stimulation, PFA/methanol fixed neurons on coverslips were mounted in the recording chamber, and the solution was rapidly changed from modified Tyrode’s solution containing 2 mM CaCl2 to solution containing 0 mM CaCl2 adjusted with EGTA (Patton et al., 2004), while collecting images every 400 ms with 50 ms exposures.
To image exocytosis, cultures were incubated in modified Tyrode’s medium containing 0.5–1 μM bafilomycin A (Calbiochem) for 30 s before imaging in the same medium. To assess exocytosis with FM4-64, the cultures were incubated in modified Tyrode’s solution containing 15 μM FM4-64 and stimulated at 10 Hz for 60 s, followed by continued incubation in the same medium for an additional 60 s. After extensive washing for 10–15 min at a rate of 6 ml/min in modified Tyrode’s solution without FM4-64, the FM dye was unloaded by stimulation at 10 Hz for 90 s. Transfected boutons were identified by visualization of VGLUT1-2XmOr2 puncta in the presence of 50 mM NH4Cl, with washout prior to FM4-64 loading. To quench surface fluorescence, we imaged neurons in Tyrode’s solution at pH 5.5 with MES replacing HEPES. Transporter surface fraction was calculated by first subtracting the average of five frames with MES from the average of five frames in standard Tyrode’s solution (both measurements taken prior to stimulation) and then dividing the total number of transporters, as determined by fluorescence in the presence of 50 mM NH4Cl. Fluorescence measurements from twenty to eighty boutons per coverslip were averaged and the means from 7 to 16 coverslips from at least two independent cultures were averaged. Data are presented as means ± SEM. The initial rise of SyGCaMP3 fluorescence within the first 2.5 s of stimulation and the decrease after stimulation were fit with single exponentials (Matlab, The Mathworks, Natick, MA, USA or GraphPad Prism, La Jolla, CA, USA). The rate of exocytosis is estimated from an exponential fit to the increase in VGLUT1-2XmOr2 fluorescence during the initial 12 s of stimulation in the presence of bafilomycin. The increase in fluorescence produced by 40 Hz stimulation in the presence of bafilomycin is corrected for any increase in the rate of fluorescence produced by the drug in the absence of stimulation (Sankaranarayanan and Ryan, 2000; Voglmaier et al., 2006). For measurements of endocytosis after stimulation, the time course of fluorescence decay at each bouton after the initial 3 s (Balaji et al., 2008) was fit with a single exponential.
Results
Development of a Red-Shifted Reporter of Synaptic Vesicle Recycling
VGLUT1-pH has been used extensively to study synaptic vesicle recycling in real time (Voglmaier et al., 2006; Balaji and Ryan, 2007; Zhang et al., 2007; Fernandez-Alfonso and Ryan, 2008; Zhu et al., 2009; Nemani et al., 2010). To develop a reporter of synaptic vesicle recycling that can be distinguished from other green fluorescent indicators, we took advantage of the recent development of a photostable pH-sensitive protein emitting a different color of light, mOrange2 (mOr2; Shaner et al., 2008). Replacement of pHluorin in the first luminal/external loop of VGLUT1 with mOr2 results in a fusion that localizes to synaptic boutons and exhibits fluorescence changes in response to neural activity. However, the brightness of mOr2 is lower than pHluorin at pH 7.4, resulting in fluorescence changes of the VGLUT1-mOr2 fusion that were not as large as those of VGLUT1-pH (data not shown). Fusion of two or four copies of pHluorin with synaptophysin resulted in an improved signal to noise ratio, allowing reliable single vesicle imaging (Zhu et al., 2009). Taking a similar approach, we inserted two copies of mOr2, separated by a flexible linker sequence, into the same luminal loop as VGLUT1-pH to generate VGLUT1-2XmOr2 (Figure 1A).
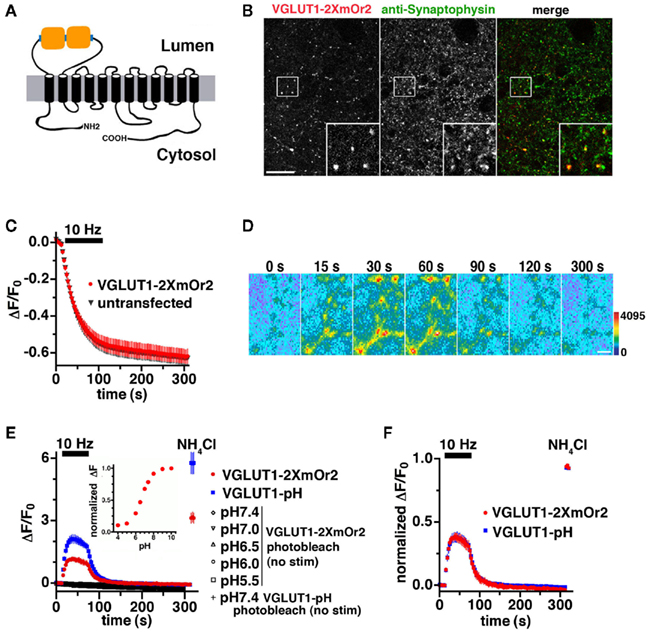
Figure 1. Development of an mOrange2-based reporter of VGLUT1 vesicle recycling. (A) Schematic of VGLUT1-2XmOr2 depicts two copies of mOr2 inserted into the first luminal loop of rat VGLUT1. (B) The fluorescence of VGLUT1-2XmOr2 colocalizes with synaptophysin staining at varicosities. Hippocampal neurons transfected with VGLUT1-2XmOr2 were stained with antibody to synaptophysin, followed by Cy5-conjugated secondary antibody. Inset shows a 4× magnification of the designated box. Size bar, 10 μm. (C) The rate of FM4-64 destaining at 10 Hz for 90 s is not significantly different between boutons from untransfected (black) and transfected (red) neurons. (D) Time-lapse images show the fluorescence change of VGLUT1-2XmOr2 in response to neural activity. Hippocampal neurons transfected with VGLUT1-2XmOr2 were stimulated at 10 Hz for 60 s. After onset of the stimulus, exocytosis of VGLUT1-2XmOr2 results in a rapid increase in fluorescence (15, 30, and 60 s), followed by a decay after the stimulus (90, 120, and 300 s) as the vesicle reacidifies. Color scale is shown to the right. Scale bar, 2 μm. (E) The change in fluorescence intensity over baseline (ΔF/F0) at boutons expressing VGLUT1-pH (blue) is approximately twice that of VGLUT1-2XmOr2 (red) during stimulation at 10 Hz for 60 s (bar). Photobleaching over the time course of the experiment was measured by imaging in the absence of stimulation at a range of pH values (black symbols). Photobleaching of VGLUT1-2XmOr2 (open diamonds) was similar to that of VGLUT1-pH (+ symbol) at pH 7.4. Inset: normalized fluorescence change of VGLUT1-2XmOr2 over the range of pH 4.0 to 10.0 in permeabilized cells indicates VGLUT1-2XmOr2 exhibits a pKa of 6.71. (F) Kinetics of fluorescence changes normalized to total fluorescence signal in the presence of NH4Cl are similar for VGLUT1-pH (blue) and VGLUT1-2XmOr2 (red). Data in (C, E, and F) are means ± SEM of the change in fluorescence (ΔF) normalized to initial fluorescence (average of the first five data points, F0) over at least 20 boutons per coverslip from 12 to 16 coverslips and at least three independent cultures.
Expressed in primary hippocampal neurons, VGLUT1-2XmOr2 colocalizes in varicosities with the endogenous synaptic vesicle proteins synaptophysin (Figure 1B) and SV2 (data not shown). Expression of VGLUT1-2XmOr2 does not perturb general features of SV recycling, as measured by depolarization-induced FM dye staining and destaining (Betz and Bewick, 1993; Fernandez-Alfonso and Ryan, 2004). We used the styryl dye FM4-64, exciting at wavelengths that do not excite mOr2. After loading FM4-64 into synaptic vesicles by stimulation at 10 Hz for 60 s, we examined the kinetics of destaining in response to 900 electrical stimuli to elicit action potentials (Gandhi and Stevens, 2003; Zhao et al., 2011). Like VGLUT1-pH (Voglmaier et al., 2006),there is no difference in the exocytosis rate between untransfected neurons and neurons expressing VGLUT1-2XmOr2, suggesting that expression of the red-shifted reporter does not impair synaptic vesicle recycling (Figure 1C). The fluorescence of VGLUT1-2XmOr2 changes in response to neural activity. Electrical stimulation at 10 Hz for 60 s produces a rapid increase in fluorescence, consistent with the relief of fluorescence quenching upon exposure of VGLUT1-2XmOr2 to the higher external pH at the time of synaptic vesicle exocytosis (Figure 1D, first three panels). After stimulation, the peak fluorescence of VGLUT1-2XmOr2 decays consistent with the reacidification of synaptic vesicles after endocytosis (Figure 1D, last three panels), as demonstrated previously for synaptopHluorin and VGLUT1-pH (Miesenbock et al., 1998; Sankaranarayanan and Ryan, 2000; Voglmaier et al., 2006). There is no fluorescence response to stimulation in the absence of calcium (data not shown). To test whether different fluorophores differentially affect VGLUT1 protein trafficking, we compared the time course of changes in fluorescence intensity that correspond to exocytosis and endocytosis of synaptic vesicles labeled with VGLUT1-pH and VGLUT1-2XmOr2 during and after stimulation at 10 Hz for 60 s (Figures 1E,F). The peak fluorescence change over baseline of VGLUT1-2XmOr2 (ΔF/F0 = 1.16 ± 0.10) is approximately half that of VGLUT1-pH (ΔF/F0 = 2.13 ± 0.20, Figure 1E). Normalized to the total fluorescence signal measured in the presence of 50 mM NH4Cl, the time course of average fluorescence changes is similar for VGLUT1-pH and VGLUT1-2XmOr2 (Figure 1F). There are no significant differences in the kinetics of fluorescence response between VGLUT1-pH and VGLUT1-2XmOr2 (Figure 1F). There is also no significant difference in cell surface expression of VGLUT1-pH or VGLUT1-2XmOr2, either before or after stimulation (data not shown). Photobleaching over the course of the experiment is minimal for both VGLUT1-2XmOr2 (5.40 × 10⁻⁴ ± 6.91 × 10⁻⁶ au/s illumination at pH 7.4) and VGLUT1-pH (4.51 × 10⁻⁴ ± 6.37 × 10⁻⁶ au/s at pH 7.4, Figure 1E). Photobleaching of VGLUT1-2XmOr2 was also minimal at all pH values tested (4.66 × 10⁻⁴ ± 1.10 × 10⁻⁵ au/s at pH 7.0; 5.25 × 10⁻⁴ ± 1.26 × 10⁻⁵ au/s at pH 6.5; 7.30 × 10⁻⁴ ± 1.84 × 10⁻⁵ au/s at pH 6.0; 7.09 × 10⁻⁴ ± 2.52 × 10⁻⁵ fau/s at pH 5.5, Figure 1E). The indicator exhibits pH dependence and a dynamic range of up to 3.5-fold over the physiological range of pH 5.5 to pH 7.4 (Figure 1E, inset). VGLUT1-2XmOr2 exhibits a pKa of 6.71, slightly higher than the value measured for mOr2 (Shaner et al., 2008). Together, these data suggest that VGLUT1-2XmOr2, like VGLUT1-pH (Voglmaier et al., 2006) is a reliable reporter of VGLUT1 trafficking.
Development of an Indicator of Presynaptic Calcium Dynamics during Repetitive Stimulation
A fusion of the GECI GCaMP2 at the cytoplasmic C-terminus of the synaptic vesicle protein synaptophysin provides a reporter of presynaptic Ca2+ transients during synaptic activity (Dreosti et al., 2009). An improved GECI, GCaMP3, exhibits an increased sensitivity and dynamic range (Tian et al., 2009), offering the possibility of imaging calcium dynamics during prolonged electrical stimulation. A stimulus of 900–1200 pulses is thought to release the entire recycling pool fraction of synaptic vesicles, a subset of the total pool in the terminal (Mozhayeva et al., 2002; Ariel and Ryan, 2010). To monitor changes in calcium during repetitive stimulation, we generated SyGCaMP3 by fusing the GECI with a short linker sequence to the C-terminus of synaptophysin. SyGCaMP3 fluorescence colocalizes with antibody to endogenous VGLUT1 (Figure 2A) and SV2 (data not shown) in primary hippocampal neurons. Depolarization-induced FM4-64 dye destaining is similar in untransfected and transfected neurons, indicating that expression of SyGCaMP3 does not affect SV recycling (Figure 2B; Betz and Bewick, 1993; Fernandez-Alfonso and Ryan, 2004). The fluorescence of SyGCaMP3 in individual boutons sharply increases in response to electrical stimulation at 40 Hz, and decays rapidly after the stimulus ends (Figures 2C,D). Quantification of the time course of fluorescence changes in response to 1200 stimuli at 40 Hz (30 s) shows an exponential increase in Ca2+ at the onset of stimulation (τ = 0.883 ± 0.0258 s), peaking at 2–3 s (80–120 stimuli) followed by a slow decrease in fluorescence during stimulation, and a rapid decrease after stimulation stops (Figure 2D). To determine the maximal SyGCaMP3 signal, we added the Ca2+ ionophore ionomycin (5 μM), which exposes the indicator to the Ca2+present in the recording solution (Dreosti et al., 2009; Tian et al., 2009). The dynamic range of SyGCaMP3 from 0 Ca2+ and 10 mM EGTA to 2 mM Ca2+in the absence of EGTA is approximately 6.5-fold (Figure 2E), consistent with the large dynamic range of GCaMP3 (Dreosti et al., 2009; Tian et al., 2009). No further increase in ΔF/F0 was detected at 4 mM CaCl2 (data not shown). The minimum fluorescence signal is −0.35 ± 0.03 fold relative to the rest condition, the baseline fluorescence of SyGCaMP3 measured in neurons in modified Tyrodes’s with 2 mM CaCl2 without ionomycin. The maximum fluorescence change in the presence of 2 mM CaCl2 and ionomycin represents a 6.15 ± 0.35 fold change relative to rest. The fluorescence of SyGCaMP3 rises as calcium concentrations increase (Figure 2F; Llinas et al., 1992). Like GCaMP3 (Tian et al., 2009), the fluorescence response of SyGCaMP3 is non-linearly related to Ca2+ concentration. The peak fluorescence during 40 Hz 30 s stimulation is approximately half maximal, within the dynamic range of the indicator (Figures 2D,E). No fluorescence response to electrical stimulation is observed in the absence of calcium (data not shown). To test whether SyGCaMP3 reflects the increased sensitivity of GCaMP3, we collected integrated fluorescence responses to trains of stimuli elicited at 80 Hz (Dreosti et al., 2009; Tian et al., 2009). After the initial five stimuli, the integrated SyGCaMP3 fluorescence signal scales linearly with the log of the number of stimuli up to at least 160 stimuli (Figure 2G). Thus, SyGCaMP3 is a robust reporter of calcium levels with a broad dynamic range.
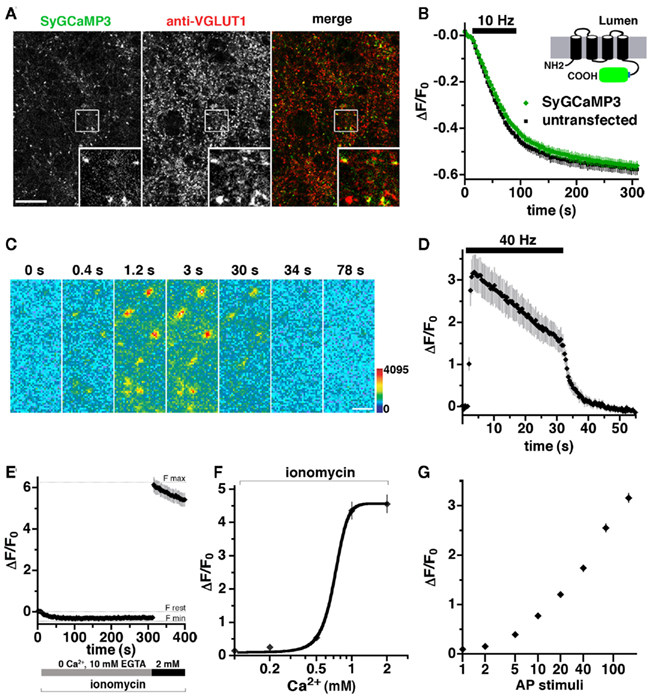
Figure 2. Development of a GCaMP3-based presynaptic calcium indicator. (A) Fluorescence of SyGCaMP3 colocalizes with antibody against endogenous VGLUT1 at synaptic varicosities. Inset shows a 4× magnification of the designated box. Size bar, 10 μm. (B) The rate of FM4-64 destaining is not significantly different between boutons from untransfected (black) and transfected (green) neurons. Inset: schematic of SyGCaMP3 showing fusion of the GECI to the cytosolic C-terminus of synaptophysin. (C) Time-lapse imaging of SyGCaMP3 fluorescence changes in response to stimulation at 40 Hz for 30 s. After onset of the stimulus, SyGCaMP3 in hippocampal neurons exhibits a rapid increase in fluorescence (0.4, 1.2, and 3 s), followed by a decay during (30 s), and after the stimulus (34 and 78 s). Color scale is shown to the right. Scale bar, 2 μm. (D) Time course of changes in average fluorescence intensity at boutons expressing SyGCaMP3 during and after stimulation at 40 Hz for 30 s. Images are collected every 400 ms. (E) The minimum synaptic fluorescence of SyGCaMP3 (Fmin) in transfected hippocampal neurons was determined by perfusion of modified Tyrode’s solution containing the calcium ionophore ionomycin (5 μm), 0 Ca2+, and 10 mM EGTA, resulting in a decrease of ΔF/F0 = −0.35 ± 0.03 relative to the resting condition (modified Tyrode’s containing 2 mM CaCl2 without ionomycin, Frest). The maximum fluorescence change (Fmax) in the presence of ionomycin and 2 mM CaCl2 is ΔF/F0 = 6.15 ± 0.35. (F) Semi-logarithmic plot of fluorescence responses to increasing CaCl2 concentration. (G) Semi-logarithmic plot of integrated fluorescence responses to trains of 1, 2, 5, 10, 20, 40, 80, and 160 action potential (AP) stimuli at 80 Hz. Data in (B, D, E, F, and G) are mean ΔF/F0 ± SEM from at least 30 boutons per coverslip from 7 to 12 coverslips and at least two independent cultures.
Monitoring Synaptic Vesicle Recycling and Calcium Dynamics in the Same Boutons
To assess presynaptic calcium transients and synaptic vesicle recycling in response to action potential stimulation in the same terminals, we co-transfected primary hippocampal neurons in culture with VGLUT1-2XmOr2 and SyGCaMP3. We collected sequential images using excitation/emission filter sets that pass and collect non-overlapping wavelengths, integrating the fluorescence signals over 300 ms. Although our imaging protocol measures the fluorescence of the two reporters in rapid succession, their fluorescence emission spectra are separable, so they could presumably be imaged simultaneously. Sustained stimulation results in both the delivery and retrieval of synaptic vesicle proteins at the cell surface, so changes in VGLUT1-2XmOr2 fluorescence during stimulation reflect both exocytic and endocytic processes. To isolate the component of fluorescence change due to exocytosis alone, we used alkaline trapping with the vacuolar H+-ATPase inhibitor bafilomycin. Bafilomycin blocks the reacidification of synaptic vesicles that have taken up the drug after exocytosis, eliminating fluorescence changes due to the endocytic component of synaptic vesicle recycling, to reveal only exocytosis (Sankaranarayanan and Ryan, 2000). In the initial 12–15 s of the stimulus, before appreciable endocytosis would be expected to occur (Balaji and Ryan, 2007), the fluorescence of VGLUT1-2XmOr2 reflects the rate of synaptic vesicle exocytosis (Figure 3B, red). The plateau in fluorescence represents the fraction of the total vesicle pool available for exocytosis at 40 Hz stimulation. To visualize the total amount of VGLUT1-2XmOr2, all vesicles are alkalinized at the end of the experiment by addition of 50 mM NH4Cl (Sankaranarayanan and Ryan, 2000). The average fluorescence of SyGCaMP3 peaks within the first 3 to 6 s of stimulation at 40 Hz, then slowly declines during stimulation (Figure 3A, green). Upon cessation of the stimulus, the average fluorescence of SyGCaMP3 rapidly returns to baseline τ = 7.66 ± 0.69 s. In permeabilized cells, the fluorescence of the SyGCaMP3 indicator itself to a change in CaCl2 from 2 to 0 mM drops to baseline within ∼800–1200 ms (data not shown). The fluorescence decay rate of cytosolic GCaMP3 following brief action potential trains is t1/2 ∼600 ms (Tian et al., 2009). Very little photobleaching of SyGCaMP3 is observed under these conditions (3.72 × 10⁻⁴ ± 6.19 × 10⁻⁶ au/s illumination at pH 7.4, data not shown).
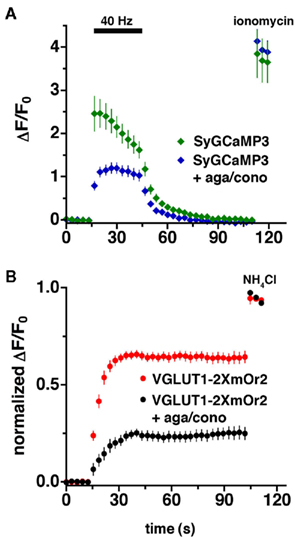
Figure 3. Imaging of VGLUT1-2xmOr2 and SyCaMP3 during exocytosis. The average time course of changes in fluorescence intensity at boutons expressing both (A) SyGCaMP3 and (B) VGLUT1-2XmOr2 in the absence (green, red) and presence (blue, black) of agatoxin and conotoxin during and after stimulation at 40 Hz for 30 s. The increase in fluorescence produced by 40 Hz stimulation in the presence of bafilomycin is shown here corrected for the rate of fluorescence increase produced by the drug in the absence of stimulation (Sankaranarayanan and Ryan, 2000; Voglmaier et al., 2006). In the presence of the P/Q- and N-type Ca2+ channel blockers, ω-agatoxin TK (300 nM), and ω-conotoxin GVIA (1 μM), the peak fluorescence of both VGLUT1-2XmOr2 (black) and SyGCaMP3 (blue) is decreased. Data are means ± SEM of the change in fluorescence (ΔF) normalized to initial fluorescence over at least 30 boutons per coverslip from 7 to 12 coverslips and at least three independent cultures.
The Fraction of Synaptic Vesicles Released Depends on P/Q- and N-type Calcium Channels
P/Q- and N-type channels mediate neurotransmitter release in hippocampal neurons (Takahashi and Momiyama, 1993; Wheeler et al., 1994). To assess the role of these channels in the exocytosis of VGLUT1-containing synaptic vesicles, we monitored the fluorescence of SyGCaMP3 while stimulating neurons in the presence of P/Q- and N-type Ca2+ channel blockers at concentrations previously demonstrated to maximally inhibit the channels (Mintz et al., 1992; Takahashi and Momiyama, 1993; Wheeler et al., 1994). The fluorescence response of SyGCaMP3 to 40 Hz 30 s stimulation is significantly reduced in the presence of both ω-agatoxin TK (300 nM) and ω-conotoxin GVIA (1 μM, Figure 3A). In addition, the dynamics of the calcium signal are different in the presence of the toxins. Under control conditions, the fluorescence of SyGCaMP3 peaks within the first 3 s of stimulation, whereas in the presence of the channel blockers, the average fluorescence peaks later, between 12 and 15 s (Figure 3A). However, in the presence of agatoxin and contotoxin the decay to baseline after stimulation ends (τ = 6.04 ± 0.68 s) is not significantly different from control.
In the presence of bafilomycin, the initial fluorescence increase of VGLUT1-2xmOr2 reflects the rate of exocytosis of synaptic vesicles, when corrected for the effect of bafilomycin independent of stimulation (Sankaranarayanan and Ryan, 2001). Inhibition of P/Q- and N-type calcium channels slows exocytosis by about twofold, from 7.47 ± 0.89 s under control conditions to 13.13 ± 1.72 s. Under both conditions, fluorescence of VGLUT1-2XmOr2 plateaus before the end of stimulation (Figure 3B). We average the peak of VGLUT1-2XmOr2 fluorescence over the three time points after stimulation ends (t = 45–51 s) to represent the total recycling pool of vesicles participating in exocytosis. Inhibition of P/Q- and N-type channels also dramatically reduces the number of synaptic vesicles released, assuming that the fluorescence change varies linearly with vesicle number. In the presence of the toxins, the fraction of vesicles released (0.238 ± 0.034) is only about one third of control levels (0.643 ± 0.021). Taken together, these data indicate that both the rate of release and the amount of vesicles that undergo exocytosis depend on Ca2+ entry through P/Q- and N-type channels, rather than a releasable pool of fixed size that would release more slowly in lower Ca2+. However other factors, such as neurotrophins, kinase activity, and ubiquitination, may also contribute to the size of the pool of vesicles released (Chi et al., 2003; Schweizer and Ryan, 2006; Renden and Von Gersdorff, 2007; Kim and Ryan, 2010).
No Effect of P/Q- and N-Type Calcium Channel Inhibition on Endocytic Rate
Calcium also plays a critical role in the endocytosis of synaptic vesicles (Sudhof, 2004; Kuromi and Kidokoro, 2005; Balaji et al., 2008; Yamashita et al., 2010). To measure Ca2+ levels and endocytosis of synaptic vesicles, we stimulated cells coexpressing SyGCaMP3 and VGLUT1-2XmOr2 in the absence of bafilomycin (Figures 4A,B). There is no difference in Ca2+ levels or kinetics with or without bafilomycin (Figures 3A and 4A). In the absence of bafilomycin, the decrease in fluorescence of VGLUT1-2XmOr2 after stimulation reflects the rate of synaptic vesicle endocytosis as vesicles are re-acidified after internalization (Miesenböck et al., 1998; Sankaranarayanan and Ryan, 2000). Upon cessation of the stimulus, the mean fluorescence of SyGCaMP3 quickly returns to baseline (τ = 6.41 ± 1.44 s), while the fluorescence of VGLUT1-2XmOr2 decays with a slower exponential time course (τ = 12.85 ± 1.7 s), consistent with the time course of endocytosis (Granseth et al., 2006; Balaji et al., 2008). In the presence of agatoxin and conotoxin, Ca2+ levels are decreased. However the decay of SyGCaMP3 fluorescence after stimulation, corresponding to the rate of Ca2+ clearance, is not changed (τ = 8.45 ± 2.6 s). The rate of VGLUT1-2XmOr2 endocytosis after stimulation is also unchanged in the presence of calcium channel inhibitors (τ = 13.43 ± 3.14 s). Inhibition of P/Q- and N-type channels thus does not slow the rate of endocytosis under these conditions.
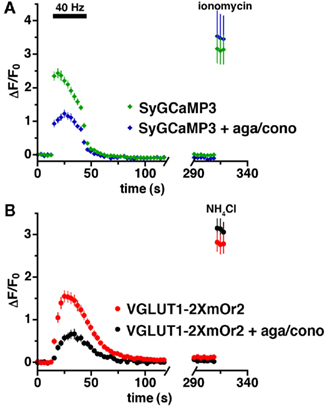
Figure 4. No effect of P/Q- and N-type calcium channel inhibition on endocytosis. (A) The time course of changes in average fluorescence intensity of boutons expressing both SyGCaMP3 in the absence (green) and presence (blue) of agatoxin and conotoxin during and after stimulation at 40 Hz for 30 s. Calcium channel blockers reduce calcium levels but do not affect the decay of SyGCaMP3 fluorescence. (B) Time course of fluorescence changes of VGLUT1-2XmOr2 in the absence (red) and presence (black) of the channel blockers. The rate of VGLUT1-2XmOr2 endocytosis is also not changed by addition of P/Q- and N-type calcium channel blockers. Data are means ± SEM of the change in fluorescence (ΔF) normalized to initial fluorescence over at least 30 boutons per coverslip from 7 to 12 coverslips and at least three independent cultures.
Discussion
Fusion of VGLUT1 with the pH-sensitive DsRed derivative, mOrange2, provides a red-shifted reporter of synaptic vesicle recycling. Like VGLUT1-pH, the genetically encoded VGLUT1-2XmOr2 localizes to presynaptic boutons and exhibits activity-dependent changes in fluorescence reflecting synaptic vesicle exocytosis and endocytosis. Although mOr2 fusions exhibit smaller fluorescence changes in response to neuronal stimulation, engineering two copies of the fluorescent protein into VGLUT1 increases the signal to noise ratio, while preserving precise targeting to presynaptic boutons. VGLUT1-2XmOr2 offers an opportunity to combine imaging of synaptic vesicle recycling with sensitive GFP-based indicators of other cellular processes. To examine the relationship between changes in VGLUT1-2XmOr2 exocytosis and endocytosis and Ca2+ levels, we developed a presynaptically targeted GECI, SyGCaMP3, using a similar strategy as for SyGCaMP2 (Dreosti et al., 2009). Using synaptophysin to target the GECI to synaptic vesicles provides a measure of calcium in the area immediately around vesicles. However, changes in fluorescence may also reflect a change in location of the vesicle. For example, a vesicle moving into the periphery of the bouton or the axon in response to stimulation may exhibit a change in fluorescence that is unrelated to Ca2+ entry at the active zone. The decay of SyGCaMP3 fluorescence during stimulation could represent properties of the GECI, such as the off-rate, in addition to calcium clearance. GCaMP fluorescence decays during sustained, high frequency stimulation may not reflect calcium (Hendel et al., 2008; Dreosti et al., 2009). This phenomenon should be less evident with lower frequency or duration of stimulation. Consistent with the improved properties of GCaMP3, SyGCaMP3 exhibits an increased dynamic range suited to assess the calcium response during high frequency stimulation (Tian et al., 2009). When co-transfected into primary neurons in culture, fluorescence signals from the two reporters can be readily distinguished. Although we collected fluorescence signals in separately acquired images, the two fluorophores can be imaged simultaneously using commercially available filtersets. The expression of SyGCaMP3 and VGLUT1-2XmOr2 in the same boutons allows real time comparisons between Ca2+ levels and synaptic vesicle trafficking.
We examined the relationship between presynaptic calcium levels and recycling of VGLUT1-2XmOr2 using a strong stimulus of 1200 action potential stimuli at 40 Hz to release the recycling pool of synaptic vesicles. Inhibition of P/Q- and N-type Ca2+ channels decreases and delays the peak in Ca2+ level. The fraction of vesicles that undergo exocytosis is also significantly smaller, and the rate of exocytosis is slower. Residual exocytosis observed here may be due to incomplete block of the Ca2+ current, or it may be mediated by Ca2+ entry through other channels, such as R- and L-type channels (Sitges and Galindo, 2005; Perissinotti et al., 2008; Schnee et al., 2011; Subramanian and Morozov, 2011). Calcium entering through other channels may require more time for diffusion to the sites near P/Q- and N-type channels where vesicles are docked (Reid et al., 2003; Cao and Tsien, 2010). The decrease in exocytosis rate observed in the presence of channel blockers is consistent with the calcium dependence of the rate of exocytosis (Heidelberger et al., 1994). The decrease in the number of vesicles available for release is also consistent with the probabilistic nature of synaptic vesicle release above a threshold level of calcium. In addition, lower levels of Ca2+ in boutons may differentially mobilize pools with differing calcium sensitivity or probability of release (Thoreson et al., 2004; Moulder and Mennerick, 2005; Rizzoli and Betz, 2005).
Decreases in fluorescence of VGLUT1-2XmOr2 reflect the acidification of synaptic vesicles following endocytosis. Calcium can regulate synaptic vesicle endocytosis by triggering a faster mode of endocytosis in some synapses, or by increasing the number of sites available (Neves et al., 2001; Wu et al., 2005; Voglmaier and Edwards, 2007; Balaji et al., 2008; Sun et al., 2010). During stimulation, the rates of exocytosis and endocytosis may be dependent on each other. Synaptic vesicle endocytosis may be required, either directly or indirectly, for the availability of release sites (Neher, 2010; Haucke et al., 2011). However, with a 40 Hz 30 s stimulus, we detect no significant difference in the rate of endocytosis of VGLUT1-2XmOr2 in the presence or absence of the P/Q- and N-type Ca2+ channel blockers agatoxin and conotoxin. It may be that under these stimulation conditions, the endocytic machinery of the synaptic terminal is not saturated. Indeed, higher frequency stimulation is associated with higher endocytic capacity (Balaji et al., 2008).
The ability to simultaneously monitor synaptic vesicle recycling with GFP-based indicators in individual synapses can advance investigations of the modulation of neuronal connectivity in functional circuits. Imaging ensembles of neurons provides average measurements, but could also enable the analysis of variance in the properties of individual boutons. Individual boutons or cells may exhibit variation in probability of release, reliance on calcium channel subtypes, or modes of synaptic vesicle trafficking (Fisher and Bourque, 2001; Rizzoli and Betz, 2005; Armbruster and Ryan, 2011; Weston et al., 2011). Engineering both indicators onto the same protein could further refine the spatiotemporal resolution of these sensors of calcium dependent neurotransmitter release. Combining VGLUT1-2XmOr2 with GCaMPs expressed postsynaptically can provide a powerful method to determine the locus of changes in synaptic efficacy in specific circuits. Combining mOrange2 and pHluorin-based indicators provides an approach to study trafficking of individual proteins in parallel. The capacity for simultaneous imaging of neurotransmitter release and Ca2+ dynamics in real time from defined populations at synaptic resolution will be useful for addressing a broad spectrum of neuroscience questions.
Conflict of Interest Statement
The authors declare that the research was conducted in the absence of any commercial or financial relationships that could be construed as a potential conflict of interest. Nathan C. Shaner and Roger Y. Tsien are listed as inventors in a US patent assigned to the University of California, which includes as a claim mOrange2, used in this work.
Acknowledgments
This work was supported by grants from the International Mental Health Research Foundation (IMHRO), the Whitehall Foundation, the UCSF Office of the Dean and the Program for Breakthrough Biomedical Research (to Susan M. Voglmaier), and a predoctoral fellowship from the National Institute of Mental Health (to Sarah M. Foss). GCaMP3 was kindly provided by Loren Looger (HHMI). We thank Rebecca Seal and Magda Santos for helpful discussions, and Zachary Schwartz for data analysis.
References
Ariel, P., and Ryan, T. A. (2010). Optical mapping of release properties in synapses. Front. Neural Circuits 4:18. doi: 10.3389/fncir.2010.00018
Armbruster, M., and Ryan, T. A. (2011). Synaptic vesicle retrieval time is a cell-wide rather than individual-synapse property. Nat. Neurosci. 14, 824–826.
Balaji, J., Armbruster, M., and Ryan, T. A. (2008). Calcium control of endocytic capacity at a CNS synapse. J. Neurosci. 28, 6742–6749.
Balaji, J., and Ryan, T. A. (2007). Single-vesicle imaging reveals that synaptic vesicle exocytosis and endocytosis are coupled by a single stochastic mode. Proc. Natl. Acad. Sci. U.S.A. 104, 20576–20581.
Betz, W. J., and Bewick, G. S. (1993). Optical monitoring of transmitter release and synaptic vesicle recycling at the frog neuromuscular junction. J. Physiol. 460, 287–309.
Cao, Y. Q., and Tsien, R. W. (2010). Different relationship of N- and P/Q-type Ca2+ channels to channel-interacting slots in controlling neurotransmission at cultured hippocampal synapses. J. Neurosci. 30, 4536–4546.
Chi, P., Greengard, P., and Ryan, T. A. (2003). Synaptic vesicle mobilization is regulated by distinct synapsin I phosphorylation pathways at different frequencies. Neuron 38, 69–78.
Dreosti, E., and Lagnado, L. (2011). Optical reporters of synaptic activity in neural circuits. Exp. Physiol. 96, 4–12.
Dreosti, E., Odermatt, B., Dorostkar, M. M., and Lagnado, L. (2009). A genetically encoded reporter of synaptic activity in vivo. Nat. Methods 6, 883–889.
Fernandez-Alfonso, T., and Ryan, T. A. (2004). The kinetics of synaptic vesicle pool depletion at CNS synaptic terminals. Neuron 41, 943–953.
Fernandez-Alfonso, T., and Ryan, T. A. (2008). A heterogeneous “resting” pool of synaptic vesicles that is dynamically interchanged across boutons in mammalian CNS synapses. Brain Cell Biol. 36, 87–100.
Fisher, T. E., and Bourque, C. W. (2001). The function of Ca(2+) channel subtypes in exocytotic secretion: new perspectives from synaptic and non-synaptic release. Prog. Biophys. Mol. Biol. 77, 269–303.
Gandhi, S. P., and Stevens, C. F. (2003). Three modes of synaptic vesicular recycling revealed by single-vesicle imaging. Nature 423, 607–613.
Granseth, B., Odermatt, B., Royle, S. J., and Lagnado, L. (2006). Clathrin-mediated endocytosis is the dominant mechanism of vesicle retrieval at hippocampal synapses. Neuron 51, 773–786.
Haucke, V., Neher, E., and Sigrist, S. J. (2011). Protein scaffolds in the coupling of synaptic exocytosis and endocytosis. Nat. Rev. Neurosci. 12, 127–138.
Heidelberger, R., Heinemann, C., Neher, E., and Matthews, G. (1994). Calcium dependence of the rate of exocytosis in a synaptic terminal. Nature 371, 513–515.
Hendel, T., Mank, M., Schnell, B., Griesbeck, O., Borst, A., and Reiff, D. F. (2008). Fluorescence changes of genetic calcium indicators and OGB-1 correlated with neural activity and calcium in vivo and in vitro. J. Neurosci. 28, 7399–7411.
Katz, B., and Miledi, R. (1969). Spontaneous and evoked activity of motor nerve endings in calcium Ringer. J. Physiol. (Lond.) 203, 689–706.
Kim, S. H., and Ryan, T. A. (2010). CDK5 serves as a major control point in neurotransmitter release. Neuron 67, 797–809.
Kuromi, H., and Kidokoro, Y. (2005). Exocytosis and endocytosis of synaptic vesicles and functional roles of vesicle pools: lessons from the Drosophila neuromuscular junction. Neuroscientist 11, 138–147.
Kwon, S. E., and Chapman, E. R. (2011). Synaptophysin regulates the kinetics of synaptic vesicle endocytosis in central neurons. Neuron 70, 847–854.
Li, H., Waites, C. L., Staal, R. G., Dobryy, Y., Park, J., Sulzer, D. L., and Edwards, R. H. (2005a). Sorting of vesicular monoamine transporter 2 to the regulated secretory pathway confers the somatodendritic exocytosis of monoamines. Neuron 48, 619–633.
Li, Z., Burrone, J., Tyler, W. J., Hartman, K. N., Albeanu, D. F., and Murthy, V. N. (2005b). Synaptic vesicle recycling studied in transgenic mice expressing synaptopHluorin. Proc. Natl. Acad. Sci. U.S.A. 102, 6131–6136.
Llinas, R., Sugimori, M., and Silver, R. B. (1992). Microdomains of high calcium concentration in a presynaptic terminal. Science 256, 677–679.
Miesenbock, G., De Angelis, D. A., and Rothman, J. E. (1998). Visualizing secretion and synaptic transmission with pH-sensitive green fluorescent proteins. Nature 394, 192–195.
Miesenböck, G., De Angelis, D. A., and Rothman, J. E. (1998). Visualizing secretion and synaptic transmission with pH-sensitive green fluorescent proteins. Nature 394, 192–195.
Mintz, I. M., Venema, V. J., Swiderek, K. M., Lee, T. D., Bean, B. P., and Adams, M. E. (1992). P-type calcium channels blocked by the spider toxin omega-Aga-IVA. Nature 355, 827–829.
Moulder, K. L., and Mennerick, S. (2005). Reluctant vesicles contribute to the total readily releasable pool in glutamatergic hippocampal neurons. J. Neurosci. 25, 3842–3850.
Mozhayeva, M. G., Sara, Y., Liu, X., and Kavalali, E. T. (2002). Development of vesicle pools during maturation of hippocampal synapses. J. Neurosci. 22, 654–665.
Neher, E. (2010). What is rate-limiting during sustained synaptic activity: vesicle supply or the availability of release sites. Front. Synaptic Neurosci. 2:144. doi: 10.3389/fnsyn.2010.00144
Nemani, V. M., Lu, W., Berge, V., Nakamura, K., Onoa, B., Lee, M. K., Chaudhry, F. A., Nicoll, R. A., and Edwards, R. H. (2010). Increased expression of alpha-synuclein reduces neurotransmitter release by inhibiting synaptic vesicle reclustering after endocytosis. Neuron 65, 66–79.
Neves, G., Gomis, A., and Lagnado, L. (2001). Calcium influx selects the fast mode of endocytosis in the synaptic terminal of retinal bipolar cells. Proc. Natl. Acad. Sci. U.S.A. 98, 15282–15287.
Patton, C., Thompson, S., and Epel, D. (2004). Some precautions in using chelators to buffer metals in biological solutions. Cell Calcium 35, 427–431.
Perissinotti, P. P., Giugovaz Tropper, B., and Uchitel, O. D. (2008). L-type calcium channels are involved in fast endocytosis at the mouse neuromuscular junction. Eur. J. Neurosci. 27, 1333–1344.
Reid, C. A., Bekkers, J. M., and Clements, J. D. (2003). Presynaptic Ca2+ channels: a functional patchwork. Trends Neurosci. 26, 683–687.
Renden, R., and Von Gersdorff, H. (2007). Synaptic vesicle endocytosis at a CNS nerve terminal: faster kinetics at physiological temperatures and increased endocytotic capacity during maturation. J. Neurophysiol. 98, 3349–3359.
Sankaranarayanan, S., and Ryan, T. A. (2000). Real-time measurements of vesicle-SNARE recycling in synapses of the central nervous system. Nat. Cell Biol. 2, 197–204.
Sankaranarayanan, S., and Ryan, T. A. (2001). Calcium accelerates endocytosis of vSNAREs at hippocampal synapses. Nat. Neurosci. 4, 129–136.
Schnee, M. E., Santos-Sacchi, J., Castellano-Munoz, M., Kong, J. H., and Ricci, A. J. (2011). Calcium-dependent synaptic vesicle trafficking underlies indefatigable release at the hair cell afferent fiber synapse. Neuron 70, 326–338.
Schneggenburger, R., and Neher, E. (2000). Intracellular calcium dependence of transmitter release rates at a fast central synapse. Nature 406, 889–893.
Schneggenburger, R., Sakaba, T., and Neher, E. (2002). Vesicle pools and short-term synaptic depression: lessons from a large synapse. Trends Neurosci. 25, 206–212.
Schweizer, F. E., and Ryan, T. A. (2006). The synaptic vesicle: cycle of exocytosis and endocytosis. Curr. Opin. Neurobiol. 16, 298–304.
Shaner, N. C., Lin, M. Z., Mckeown, M. R., Steinbach, P. A., Hazelwood, K. L., Davidson, M. W., and Tsien, R. Y. (2008). Improving the photostability of bright monomeric orange and red fluorescent proteins. Nat. Methods 5, 545–551.
Sitges, M., and Galindo, C. A. (2005). Omega-agatoxin-TK is a useful tool to study P-type Ca2+ channel-mediated changes in internal Ca2+ and glutamate release in depolarised brain nerve terminals. Neurochem. Int. 46, 53–60.
Subramanian, J., and Morozov, A. (2011). Erk1/2 inhibit synaptic vesicle exocytosis through L-type calcium channels. J. Neurosci. 31, 4755–4764.
Sun, T., Wu, X. S., Xu, J., Mcneil, B. D., Pang, Z. P., Yang, W., Bai, L., Qadri, S., Molkentin, J. D., Yue, D. T., and Wu, L. G. (2010). The role of calcium/calmodulin-activated calcineurin in rapid and slow endocytosis at central synapses. J. Neurosci. 30, 11838–11847.
Takahashi, T., and Momiyama, A. (1993). Different types of calcium channels mediate central synaptic transmission. Nature 366, 156–158.
Thoreson, W. B., Rabl, K., Townes-Anderson, E., and Heidelberger, R. (2004). A highly Ca2+-sensitive pool of vesicles contributes to linearity at the rod photoreceptor ribbon synapse. Neuron 42, 595–605.
Tian, L., Hires, S. A., Mao, T., Huber, D., Chiappe, M. E., Chalasani, S. H., Petreanu, L., Akerboom, J., Mckinney, S. A., Schreiter, E. R., Bargmann, C. I., Jayaraman, V., Svoboda, K., and Looger, L. L. (2009). Imaging neural activity in worms, flies and mice with improved GCaMP calcium indicators. Nat. Methods 6, 875–881.
Voglmaier, S. M., and Edwards, R. H. (2007). Do different endocytic pathways make different synaptic vesicles? Curr. Opin. Neurobiol. 17, 374–380.
Voglmaier, S. M., Kam, K., Yang, H., Fortin, D. L., Hua, Z., Nicoll, R. A., and Edwards, R. H. (2006). Distinct endocytic pathways control the rate and extent of synaptic vesicle protein recycling. Neuron 51, 71–84.
Von Gersdorff, H., and Matthews, G. (1999). Electrophysiology of synaptic vesicle cycling. Annu. Rev. Physiol. 61, 725–752.
Weston, M. C., Nehring, R. B., Wojcik, S. M., and Rosenmund, C. (2011). Interplay between VGLUT isoforms and endophilin A1 regulates neurotransmitter release and short-term plasticity. Neuron 69, 1147–1159.
Wheeler, D. B., Randall, A., and Tsien, R. W. (1994). Roles of N-type and Q-type Ca2+ channels in supporting hippocampal synaptic transmission. Science 264, 107–111.
Wu, W., Xu, J., Wu, X. S., and Wu, L. G. (2005). Activity-dependent acceleration of endocytosis at a central synapse. J. Neurosci. 25, 11676–11683.
Yamashita, T., Eguchi, K., Saitoh, N., Von Gersdorff, H., and Takahashi, T. (2010). Developmental shift to a mechanism of synaptic vesicle endocytosis requiring nanodomain Ca2+. Nat. Neurosci. 13, 838–844.
Zakharenko, S. S., Zablow, L., and Siegelbaum, S. A. (2001). Visualization of changes in presynaptic function during long-term synaptic plasticity. Nat. Neurosci. 4, 711–717.
Zhang, Q., Cao, Y. Q., and Tsien, R. W. (2007). Quantum dots provide an optical signal specific to full collapse fusion of synaptic vesicles. Proc. Natl. Acad. Sci. U.S.A. 104, 17843–17848.
Zhao, C., Dreosti, E., and Lagnado, L. (2011). Homeostatic synaptic plasticity through changes in presynaptic calcium influx. J. Neurosci. 31, 7492–7496.
Keywords: synapse, vesicle, exocytosis, endocytosis, recycling, calcium, imaging, glutamate
Citation: Li H, Foss SM, Dobryy YL, Park CK, Hires SA, Shaner NC, Tsien RY, Osborne LC and Voglmaier SM (2011) Concurrent imaging of synaptic vesicle recycling and calcium dynamics. Front. Mol. Neurosci. 4:34. doi: 10.3389/fnmol.2011.00034
Received: 09 July 2011; Paper pending published: 24 July 2011;
Accepted: 05 October 2011; Published online: 02 November 2011.
Edited by:
Alistair N. Garratt, Max Delbrück Center for Molecular Medicine, GermanyReviewed by:
Richard John Reimer, Stanford University, USAEdwin Levitan, University of Pittsburgh, USA
Copyright: © 2011 Li, Foss, Dobryy, Park, Hires, Shaner, Tsien, Osborne and Voglmaier. This is an open-access article subject to a non-exclusive license between the authors and Frontiers Media SA, which permits use, distribution and reproduction in other forums, provided the original authors and source are credited and other Frontiers conditions are complied with.
*Correspondence: Susan M. Voglmaier, Department of Psychiatry, University of California School of Medicine, 401 Parnassus Avenue, LPPI-A101, San Francisco, CA 94143-0984, USA. e-mail:c3VzYW4udm9nbG1haWVyQHVjc2YuZWR1
†Present address: Yuriy L. Dobryy, Department of Psychiatry, Mount Sinai School of Medicine, New York, NY, USA; Samuel Andrew Hires, Howard Hughes Medical Institute, Janelia Farm Research Campus, Ashburn, VA, USA; Nathan C. Shaner, Monterey Bay Aquarium Research Institute, Moss Landing, CA, USA.