 Sergio Espeso-Gil1,2,3*
 Aliaksei Z. Holik1
 Sarah Bonnin1Shalu Jhanwar1,2Sandhya Chandrasekaran4,5
 Roger Pique-Regi6Júlia Albaigès-Ràfols1,2Michael Maher1†$Jon Permanyer1
 Manuel Irimia1,2,7
 Marc R. Friedländer8
 Meritxell Pons-Espinal1,2†
 Schahram Akbarian5
 Mara Dierssen1,2
 Philipp G. Maass3,9‡Charlotte N. Hor1,2*†‡
 Stephan Ossowski1,2†‡
- 1Centre for Genomic Regulation (CRG), The Barcelona Institute of Science and Technology, Barcelona, Spain
- 2Universitat Pompeu Fabra (UPF), Barcelona, Spain
- 3Genetics and Genome Biology Program, SickKids Research Institute, Toronto, ON, Canada
- 4MD/PhD Program in the Graduate School of Biomedical Sciences, Icahn School of Medicine at Mount Sinai, New York, NY, United States
- 5Department of Psychiatry and Friedman Brain Institute, Icahn School of Medicine at Mount Sinai, New York, NY, United States
- 6Center for Molecular Medicine and Genetics, Wayne State University, Detroit, MI, United States
- 7ICREA, Pg. Lluis Companys 23, Barcelona, Spain
- 8Science for Life Laboratory, Department of Molecular Biosciences, The Wenner-Gren Institute, Stockholm University, Stockholm, Sweden
- 9Department of Molecular Genetics, University of Toronto, Toronto, ON, Canada
In early development, the environment triggers mnemonic epigenomic programs resulting in memory and learning experiences to confer cognitive phenotypes into adulthood. To uncover how environmental stimulation impacts the epigenome and genome organization, we used the paradigm of environmental enrichment (EE) in young mice constantly receiving novel stimulation. We profiled epigenome and chromatin architecture in whole cortex and sorted neurons by deep-sequencing techniques. Specifically, we studied chromatin accessibility, gene and protein regulation, and 3D genome conformation, combined with predicted enhancer and chromatin interactions. We identified increased chromatin accessibility, transcription factor binding including CTCF-mediated insulation, differential occupancy of H3K36me3 and H3K79me2, and changes in transcriptional programs required for neuronal development. EE stimuli led to local genome re-organization by inducing increased contacts between chromosomes 7 and 17 (inter-chromosomal). Our findings support the notion that EE-induced learning and memory processes are directly associated with the epigenome and genome organization.
Introduction
Exposure to environmental stimuli influences developmental programs of organisms by modulating gene regulatory networks. These programs direct early postnatal neuronal development, particularly during the “critical period” that is key to establish brain functions that are kept throughout the lifetime of an individual (Hübener and Bonhoeffer, 2014). Environmental enrichment (EE) is a commonly used paradigm to study the behavioral and electrophysiological mechanisms of neuronal development (van Praag et al., 2000). Widely considered positively influencing cognition, it is a potential treatment application for a wide source of human traits (McDonald et al., 2018; Ball et al., 2019; Kempermann, 2019). On the counterpart, other studies found multiple sources of variability, confounds or even deleterious effects of EE (Berardo et al., 2016; Sparling et al., 2020). Generally, EE represents external factors, such as sensory, physical, cognitive, and social stimulation to provide and to maintain constant novelty and complexity, thereby laying a key foundation for future learning processes (Rountree-Harrison et al., 2018).
The coalescing mechanisms of gene regulation, epigenetics, and genome organization leading to learning and memory formation still remain largely unknown. Thus far, studies on how EE affects gene regulatory elements are sparse, but some findings point toward the involvement of epigenetic mechanisms, both at the level of DNA methylation and histone modifications and chromatin modifiers (Irier et al., 2014; Morse et al., 2015). Recently, advances in brain research indicated that three-dimensional (3D) genome organization can be causally involved in gene-regulatory networks and chromatin conformation dynamics that impact brain function, learning, and memory formation (Fernandez-Albert et al., 2019; Rajarajan et al., 2019; Yamada et al., 2019; Beagan et al., 2020; Peter et al., 2020). These findings imply that a comprehensive molecular analysis of the processes happening during EE is needed to understand how neuronal circuits are refined by environmental cues. To accomplish this aim, we leveraged multiple genomic techniques to identify regulatory changes leading to learning and memory formation by EE during early postnatal neuronal development. We assessed chromatin accessibility, chromatin modifications, transcriptomic and proteomic changes, as well as 3D genome conformation. Our results reveal for the first time a comprehensive genome-wide perspective of global and neuronal-specific regulatory epigenetic modifications under EE in whole cerebral cortex, followed by neuron-specific and pyramidal-neuron-specific profiling. Our present study demonstrates that EE-induced early learning experience changes the neuronal epigenome and causes altered genomic conformations, especially between different chromosomes.
Results
Study Outline
EE significantly influences learning and memory and leads to cognitive improvement, as demonstrated by multiple studies (Ohline and Abraham, 2019). Our EE-protocol was successfully established and validated by behavioral testing (Morris water maze) in an earlier study (Pons-Espinal et al., 2013). Briefly it consisted in a constantly changing environmental stimulation (every 48 h) over the course of 1 week (postnatal day P28) or 1 month (P51), an important stage of the critical period (Sztainberg and Chen, 2010; Hübener and Bonhoeffer, 2014) (Method Details, Figure 1A). For detailed insights into cell heterogeneity in the context of EE and the cerebral cortex microenvironment, we used whole cerebral cortex, sorted neuronal, and non-neuronal cells and performed epigenomic, transcriptomic, and proteomic profiling, as well as capturing of genomic interactions to provide a communal resource (Figures 1B,C).
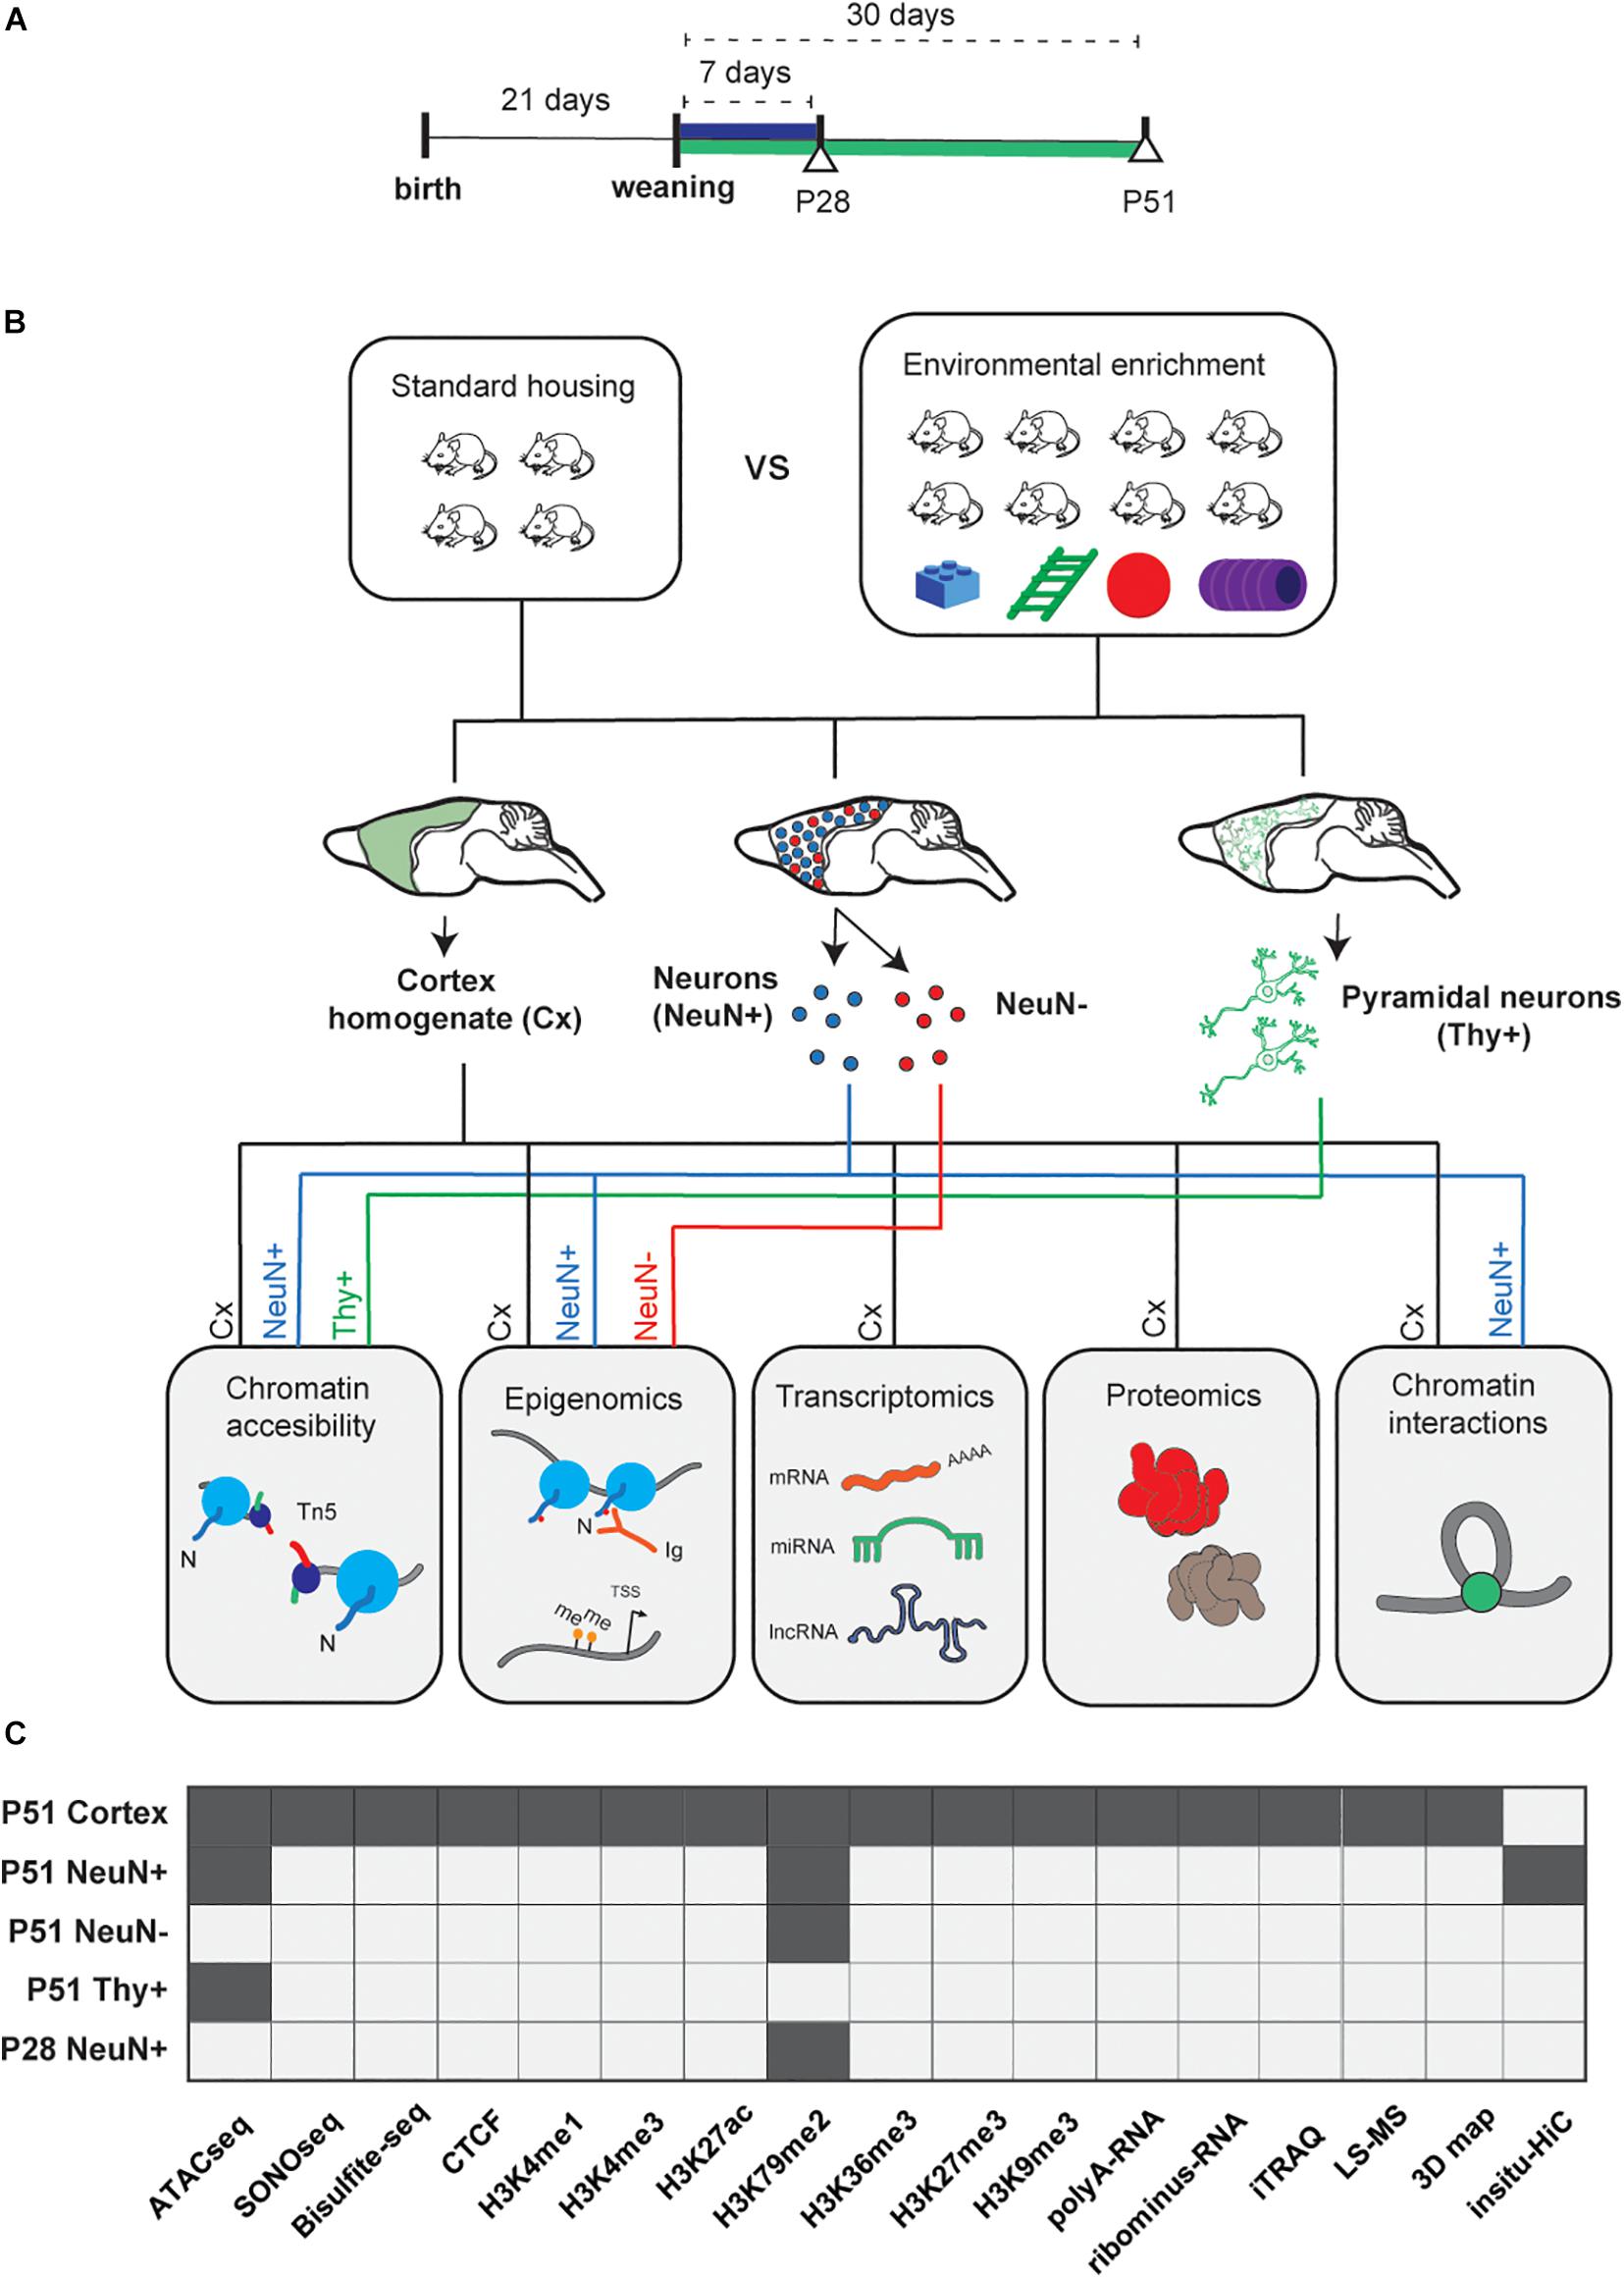
Figure 1. Experimental study design. (A) After weaning (P21), mice were exposed to environmental enrichment (EE) for 7 days (P28), and 30 days (P51, Methods). (B) Experimental workflow. Cortical tissue was homogenized from five different animals and split for the following protocols: ATACseq/SONOseq, ChIP-seq, RNAseq, label free and iTRAQ proteomics, and in situ Hi-C (2 biological replicates per condition, Nt = 20 animals in total). Neuronal and glial populations were sorted by the neuronal marker NeuN (Rbfox3) and pyramidal neurons by Thy+ (Tg[Thy1-YFP] mice). NeuN+ and NeuN– (3 biological replicates per condition, Nt = 30 of animals; for Thy+ 2 individual biological replicates per condition, Nt = 4 animals; see Methods. (C) Datasets available per technique and per different cell population (dark gray).
To analyze and intersect our multiple datasets, we devised a computational pipeline to determine activity and interplay of epigenomic marks in gene-regulatory regions, namely between enhancers predicted by the tool GEP (Jhanwar et al., 2018), and annotated promoters (Methods Details, Figure 2A and Supplementary Table 1).
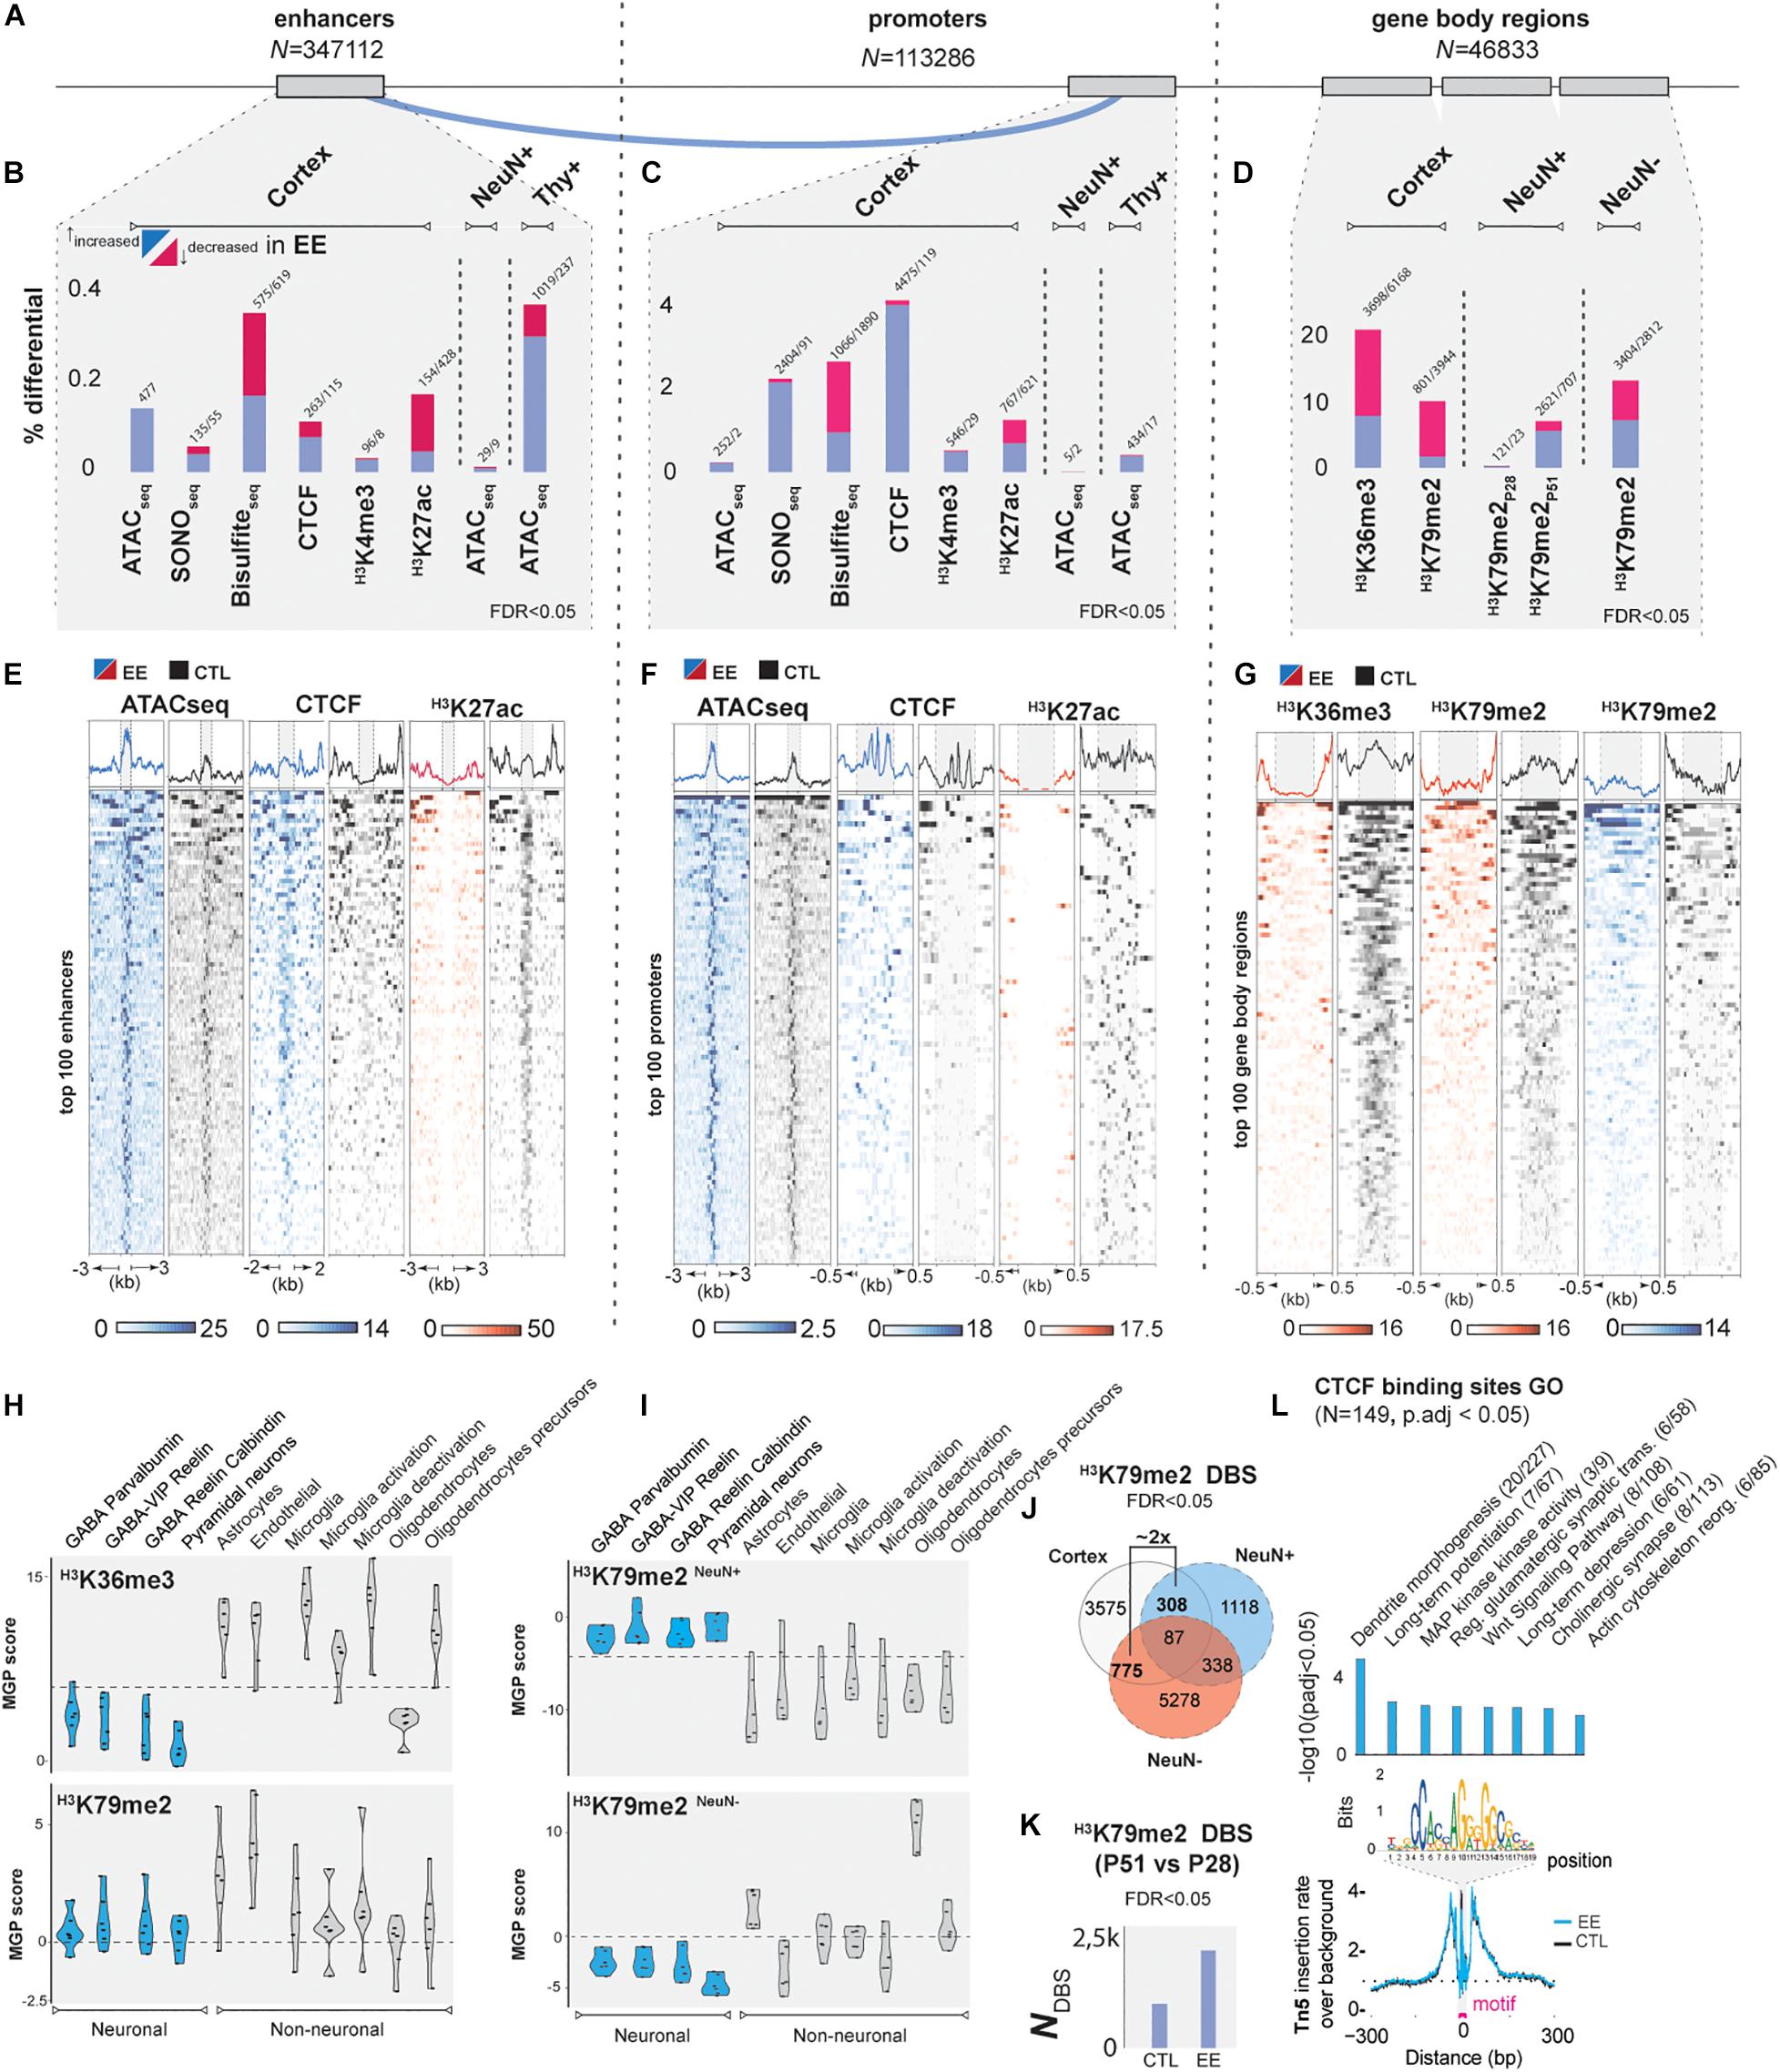
Figure 2. EE epigenetic changes during postnatal development. (A) Genomic features studied in the present study: left, enhancers predicted by GEP (Jhanwar et al., 2018) (Nt = 347112), middle: promoters 1,500 bp up- and 500 bp down-stream of TSS (Nt = 113,286); right: gene body regions (Nt = 46,833; see Methods). (B–D) Summary of differential changes (%) upon EE of chromatin accessibility and epigenetic marks over the total number of features in (B) enhancers, (C) promoters, (D) and gene-body regions (FDR < 0.05). (E) Top 100 enhancers, (F) promoters, and (G) Gene-body regions scaled in RPKM of the most important marks. Blue = increased; red = decreased signal upon EE, black = CTL samples. (H,I) Cell deconvolution of transcription-associated gene body marks: H3K36me3 and H3K79me2 in both whole cortex, neuronal, and non-neuronal datasets. Marker gene profile score (MPG) represents the first principal component regarding gene expression of cell-specific genes curated from single-cell studies involving GABAergic and pyramidal neurons, astrocytes, oligodendrocytes, microglia and endothelial cells (Mancarci et al., 2017) (Methods Details). (J) Overlap of differential H3K79me2 enrichment at P51 of whole cortex with NeuN+ and NeuN– (at FDR < 0.05). (K) Time-course plot showing the progressive increase of differential binding sites (DBS) of H3K79me2 (P51 vs. P28) in CTL and EE samples (FDR < 0.05). (L) NeuN+ CTCF footprint plot. Y-axis corresponds to the Tn5 insertion rate over the background, x-axis distance in bp from the motif center (upper plot: bins over nucleotide position). Blue line designates increased CTCF binding in EE samples. Right plot: GO analysis (p-adj < 0.05 with Benjamini-Holchberg correction, Supplementary Table 2).
EE Induces Increased Chromatin Accessibility and Insulation Targeting Synaptic-Associated Genes in Cortical Tissue
EE is non-invasive in comparison to invasive neuronal stimulation which leads to increased chromatin accessibility in gene-regulatory regions to induce gene transcription (Su et al., 2017; Koberstein et al., 2018; Fernandez-Albert et al., 2019). Therefore, we asked if non-invasive EE could lead to quantifiable effects on gene and genome function during cortical cell postnatal development.
First, we studied EE in whole cortical tissue (Pons-Espinal et al., 2013). In ATAC-seq experiments investigating chromatin accessibility (Buenrostro et al., 2013), we observed that distinct ATAC-seq peaks (macs2, fseq) were increased genome-wide in EE samples compared to controls (CTLs), suggesting a global increase in chromatin accessibility after EE (FCcortex1.17X, Supplementary Figure 1A). To validate these findings, a differential analysis of enhancers and promoters further confirmed increased chromatin accessibility in a very specific set of 0.13% of enhancers and 0.22% of the total promoters (FDR < 0.05, Figures 2B,C). To link intra-chromosomal interactions of enhancers to their corresponding promoters, we used a modified version of EpiTensor (Zhu et al., 2016; Supplementary Table 1, Method details). We found regulatory regions showing increased accessibility specific to genes that could be linked to neurogenesis and differentiation (Speisman et al., 2013; Clemenson et al., 2015), angiogenesis (Yu et al., 2014), synapse organization (Ohline and Abraham, 2019), and pathways associated to memory and learning such as Wnt (He et al., 2018), and Rho signaling (Martino et al., 2013; Supplementary Figures 1B,C and Supplementary Table 2). To further confirm previous ATAC-seq results, we used SONO-seq (Auerbach et al., 2009), a method based solely on sonicated and sequenced chromatin. We validated 76 genes showing consistent increased accessibility in their enhancers and promoters (p-adj < 0.01, Supplementary Figure 1E). Additionally, SONO-seq showed differential accessibility on pathways that are important in neuronal function such as MAPK and JNK (Coffey, 2014), neural maturation BMP (Bond et al., 2012), synaptic plasticity PI3K-Akt (Tan et al., 2017), cellular aging prevention and telomere protective role of oxytocin (Faraji et al., 2018; Stevenson et al., 2019), and neurotransmission function by GPCR (Betke et al., 2012; Supplementary Table 2).
Accessible regions of chromatin regions encompass characteristic posttranslational modifications in surrounding histones (Fu et al., 2018). Due to the relationship between these histone marks and the increased chromatin accessibility in enhancers and promoters upon EE, we hypothesized that EE could also modulate posttranslational histone modifications and CTCF binding in gene-regulatory regions. We investigated a variety of histone marks from active (H3K27ac, H3K4me3, H3K4me1) to repressed regions (H3K27me3, H3K9me3), in addition to CTCF and DNA methylation. Interestingly, we detected relevant changes in H3K4me3, H3K27ac, DNA methylation, and CTCF upon EE (Supplementary Table 3). The regions represented about 0.2–0.4% of enhancers and 2–5% of the promoters depending on the mark being analyzed (FDR < 0.05, Figures 2B,C,E,F and Supplementary Table 3). With the exception of hypermethylated sites and weak changes in H3K27me3, the majority of changes occurred in activity-associated marks. We did not find significant changes in the heterochromatic mark H3K9me3, indicating that EE impacts the modulation of active gene sets rather than repressed regions. To investigate this in detail, we profiled transcription-associated marks such as H3K36me3 and H3K79me2 as potential readouts of gene expression (Huff et al., 2010), and determined a ∼20 and 10% differential binding of gene body marks, respectively, confirming that EE impacts transcriptional programs (FDR < 0.05, Figures 2D,G and Supplementary Table 3). Remarkably, the modulation of transcription-associated marks post EE induction was also observed in ∼13 and 8% of distal enhancers bearing H3K36me3 and H3K79me2, respectively, suggesting that enhancer-derived RNA genes are also differentially expressed (Kim et al., 2010) (FDR < 0.05, Supplementary Figures 1F,G). Genes associated to EE-induced cortical epigenetic marks changes were linked to the extracellular matrix (ECM) important for shaping synapses during postnatal development (Bikbaev et al., 2015; Ferrer-Ferrer and Dityatev, 2018), to circadian clock genes known to be required for proper healthy adult behavior (Brooks and Canal, 2013), and glutamatergic receptor complexes key for neuronal plasticity (Lüscher and Malenka, 2012; Supplementary Figures 1H–N and Supplementary Table 3).
Having determined that EE induced differential chromatin accessibility and modulation of histone modifications in postnatal cortical tissue, we next addressed potential cross-talk mechanisms. We explored the overlap across all differential epigenetically modified and accessible chromatin regions identified previously (Supplementary Figure 1O). The strongest overlap corresponded to increased CTCF binding (18.7% of total sites) co-occurring with a decrease of the gene body activity marks H3K79me2 and H3K36me3 (at FDR < 0.1, Supplementary Figure 1P). A highly relevant example of this priming state is the early-life stress gene Met (Heun-Johnson and Levitt, 2018), and the memory regulating phosphodiesterase Pde8b (Tsai et al., 2012), both showing increased chromatin accessibility of interacting enhancers upon EE, as well as increased CTCF insulation in promoters, but decreased occupancy of H3K79me2 and H3K36me3 when compared to CTLs (Supplementary Figures 2A,B). This result could indicate a state where genes are poised to be transcribed, but are temporarily repressed by insulation, a specific state due to changes in chromatin architecture (Kim et al., 2015). But, it could also indicate mixed signals coming from the process of synaptic tuning, where some synapses gain strength meanwhile others are lost as consequence of the learning mechanism (Turrigiano, 2008).
Molecular Phenotypic Changes by EE Mainly Target the Glutamatergic Synapse and Extracellular Matrix Elements
Next, we determined how the previously described epigenetic changes alter transcriptional (coding and non-coding) and translational landscapes upon EE. Expression analysis revealed a total of 473 differentially expressed genes (FDR < 0.05, Supplementary Figure 2C and Supplementary Table 4). Additional biological replicates and gene ontology analysis recapitulated previously described pathways and terms, such as: BMP, JNK, MAPK, AMPAR signaling, and elements of the ECM (Supplementary Figures 2D–F). Moreover, to corroborate these results we performed a comparative analysis with previous published RNA-seq studies under the influence of EE (Zhang et al., 2016, 2018; Grégoire et al., 2018; Wassouf et al., 2018). We found 41 differential expressed genes in our data (∼10% of DEGs) that overlap with previous studies, showing consistent enrichment to ECM and elements from the postsynaptic density important for AMPA regulation such as Arc gene (Chowdhury et al., 2006; Shepherd et al., 2006; Supplementary Figure 3). By investigating the non-coding fraction of RNA, we identified 200 microRNAs and 52 long non-coding RNAs (lncRNAs) differentially expressed upon EE (Supplementary Figures 4A–F and Supplementary Table 5). Top microRNAs were validated in a new set of biological replicates (Supplementary Figure 4B). Using a multi-source microRNA target predictor (Friedman et al., 2010), we observed specificity for synaptic-associated mRNA targets in a gene ontology analysis (p-adj < 0.05, Supplementary Figures 4C,D and Supplementary Table 5). Of note, we found Meg3 and Rian (Meg8) as downregulated lncRNAs upon EE (p-adj < 0.05, Supplementary Figure 4E). Both are known for their ability to regulate glutamatergic neurotransmission, potentially in collaboration with microRNAs (Tan et al., 2017). We then explored the potential interactions between both non-coding elements (microRNAs and lnRNAs) with LncBase (Paraskevopoulou et al., 2016), and observed that 20 of our differentially expressed microRNAs could interact with Meg3 (Supplementary Figure 4F). Particularly interesting is the up-regulated miR125b-p5 reported to be involved in synaptic strength and Grin2a downregulation (Edbauer et al., 2010).
To recapitulate EE-induced changes by quantitative protein expression, we used iTRAQ and LCMS mass spectrometry, finding about 73 and 145 differential proteins, respectively (p < 0.05, Supplementary Table 6). Gene ontology analysis of intersected EE-induced transcriptomic and proteomic changes identified pathways highlighting the importance of the ECM and neurotransmission receptor complexes, particularly involving the glutamatergic synapse (Supplementary Figure 4G).
EE Stimulation in NeuN+ Sorted Neurons
To further understand the poised state of genes observed in cortical tissue and to avoid cell bias composition, we decided to investigate EE-induced influence in a cell-specific manner. We performed a cell deconvolution analysis to specify which cell types are primarily responding to EE stimulation (Mancarci et al., 2017). Remarkably, we observed that H3K36me3 and H3K79me2 were enriched in non-neuronal populations in whole cortex data (Figure 2H). However, to address the neuronal extent of EE-induced epigenetic changes observed in whole cortex, we performed FACSorting by nuclei immunostaining of the neuronal specific marker NeuN (Jiang et al., 2008) (Rbfox3, Supplementary Figure 5A). Another deconvolution of H3K79me2 in sorted populations demonstrated the neuronal-specific identification of EE-stimulatory effects (Figure 2I, Supplementary Figure 5B). We observed that differential analysis on H3K79me2 data between EE vs. CTLs showed two times more non-neuronal than neuronal H3K79me2 enrichment when compared to whole cortex, pointing the importance of non-neuronal for future studies (Figure 2J, FDR < 0.05). Neurons specifically, showed a total of 0.35% (P28) and 7.1% (P51) of genes with differential H3K79me2 gene-body occupation (FDR < 0.05, Figure 2D and Supplementary Table 3). Interestingly, we found that H3K79me2 occupancy changes from P28 to P51 in both CTL and EE samples (Figure 2K, FDR < 0.05, Supplementary Table 3). But the influence of EE amplifies this effect by affecting ∼2× more genes that significantly enrich for neurodevelopmental terms (Supplementary Figure 5C). Between these two time points of postnatal development, H3K79me2 changes in control samples are associated to axon sprouting, mitochondrial activity, complement cascade and cerebral cortical regionalization with associated genes such as Pcdh18, identified as a potential candidate for intellectual disability (Kasnauskiene et al., 2012; Supplementary Figure 5D). In other hand, EE samples significantly enrich for learning processes, including both glutamatergic and GABAergic genes such as Gabra2, key modulator in multiple brain traits (Mulligan et al., 2019; Supplementary Figure 5E).
We revisited our previous findings in sorted neurons by addressing chromatin accessibility and gene-body epigenetic profiling (Figures 2C,D). Similar to whole cortex, we observed increased chromatin accessibility sites in enhancers and promoters after EE in NeuN+ cells (FCneurons = 1.61X, Supplementary Figure 6A). But differential sites represented around 0.01 and 0.006%, respectively, a lower rate when compared to whole cortex (FDR < 0.05, Figures 2B,C and Supplementary Table 2). As NeuN+ marker is specific for a broad number of different neurons (Figure 2I), we extended our study to sorted pyramidal neurons overexpressing a yellow fluorescent protein (YFP) under the control of the Thy1 gene promoter (Method Details, Supplementary Figure 6B). We found strongly increased chromatin accessibility upon EE (0.36% of enhancers, 0.39% of promoters), similar to the proportions in whole cortex (at FDR < 0.05, Figures 2B,C, Supplementary Figures 6C,D, and Supplementary Table 3).
Our findings confirm that EE leads to increased chromatin accessibility in whole cortex, in NeuN+ neurons, and more specifically in pyramidal neurons. We further confirm that these differential accessible enhancers are active forebrain enhancers at P0 and active in pyramidal neurons both in mouse and human (Supplementary Figure 6E). Particular genes could be linked to human cognition in the context of schizophrenia and autism, such as Nrg3 and Ank2, respectively (Kao et al., 2010; Yang et al., 2019; Supplementary Figure 6F).
Because higher chromatin accessibility may allow increased TF binding, we ran a transcription factor binding site (TFBS) footprint analysis on whole cortex and NeuN+ populations using Centipede which screens for all putative TFBS (Pique-Regi et al., 2011). We confirmed that more TFs were significantly bound in EE compared to CTLs, such as Lhx3, AP1, Nr5a2, and Phox2B (Supplementary Figure 6G and Supplementary Table 2). Interestingly, we observed that CTCF displayed one of the strongest instances bound in EE-stimulated neurons, similar to CTCF ChIPseq results (p-adj < 0.05, Figure 2C). This finding supports the idea that EE leads to increased genomic insulation and plays a role in genome organization during postnatal development.
Overall, we found that EE in neurons recapitulates cortical results inducing increased chromatin accessibility and CTCF binding. However in neurons, H3K79me2 increased upon EE which was not observed in the poised state of whole cortex. Noteworthy, GO terms of neuronal EE-induced changes show again genes associated with learning and memory targeting glutamatergic transmission predominantly, but also GABAergic and cholinergic transmission (Figure 2L, Supplementary Figures 6I,J, and Supplementary Table 2).
EE Stimulation Prompts 3D Genome Changes
The described EE-related changes implicate that the epigenome plays an important role in 3D genome organization (Rao et al., 2014; Guo et al., 2015). The evidence of increased chromatin accessibility and CTCF binding may suggest that environmental stimuli impact higher-order genome organization. To further assess chromatin interactions in sorted neurons (NeuN+), we performed Hi-C experiments to explore the 3D genome organization upon EE. By comparing intra-chromosomal interactions at 100 kilobase (kb) resolution, we determined significant changes: 94 interactions increased and 544 decreased upon EE stimulation (FDR < 0.05, Figure 3A and Supplementary Table 7). A decrease of intra-chromosomal interactions was also observed when calculating the number of chromatin loops using HICCUPs between CTL and EE (FDR < 0.05, Figure 3B; Durand et al., 2016b). We found differential intra-chromosomal bins to be clustered in particular chromosomal regions, specially involving chromosomes 8 and 14 (Figure 3C). In these regions, we find genes such as the synaptic-linked gene Ngr1 linked to cognitive function improvement (Chen et al., 2008; Xu et al., 2016); and the synaptic vesicle exocytosis regulator Cadps (Sadakata et al., 2007).
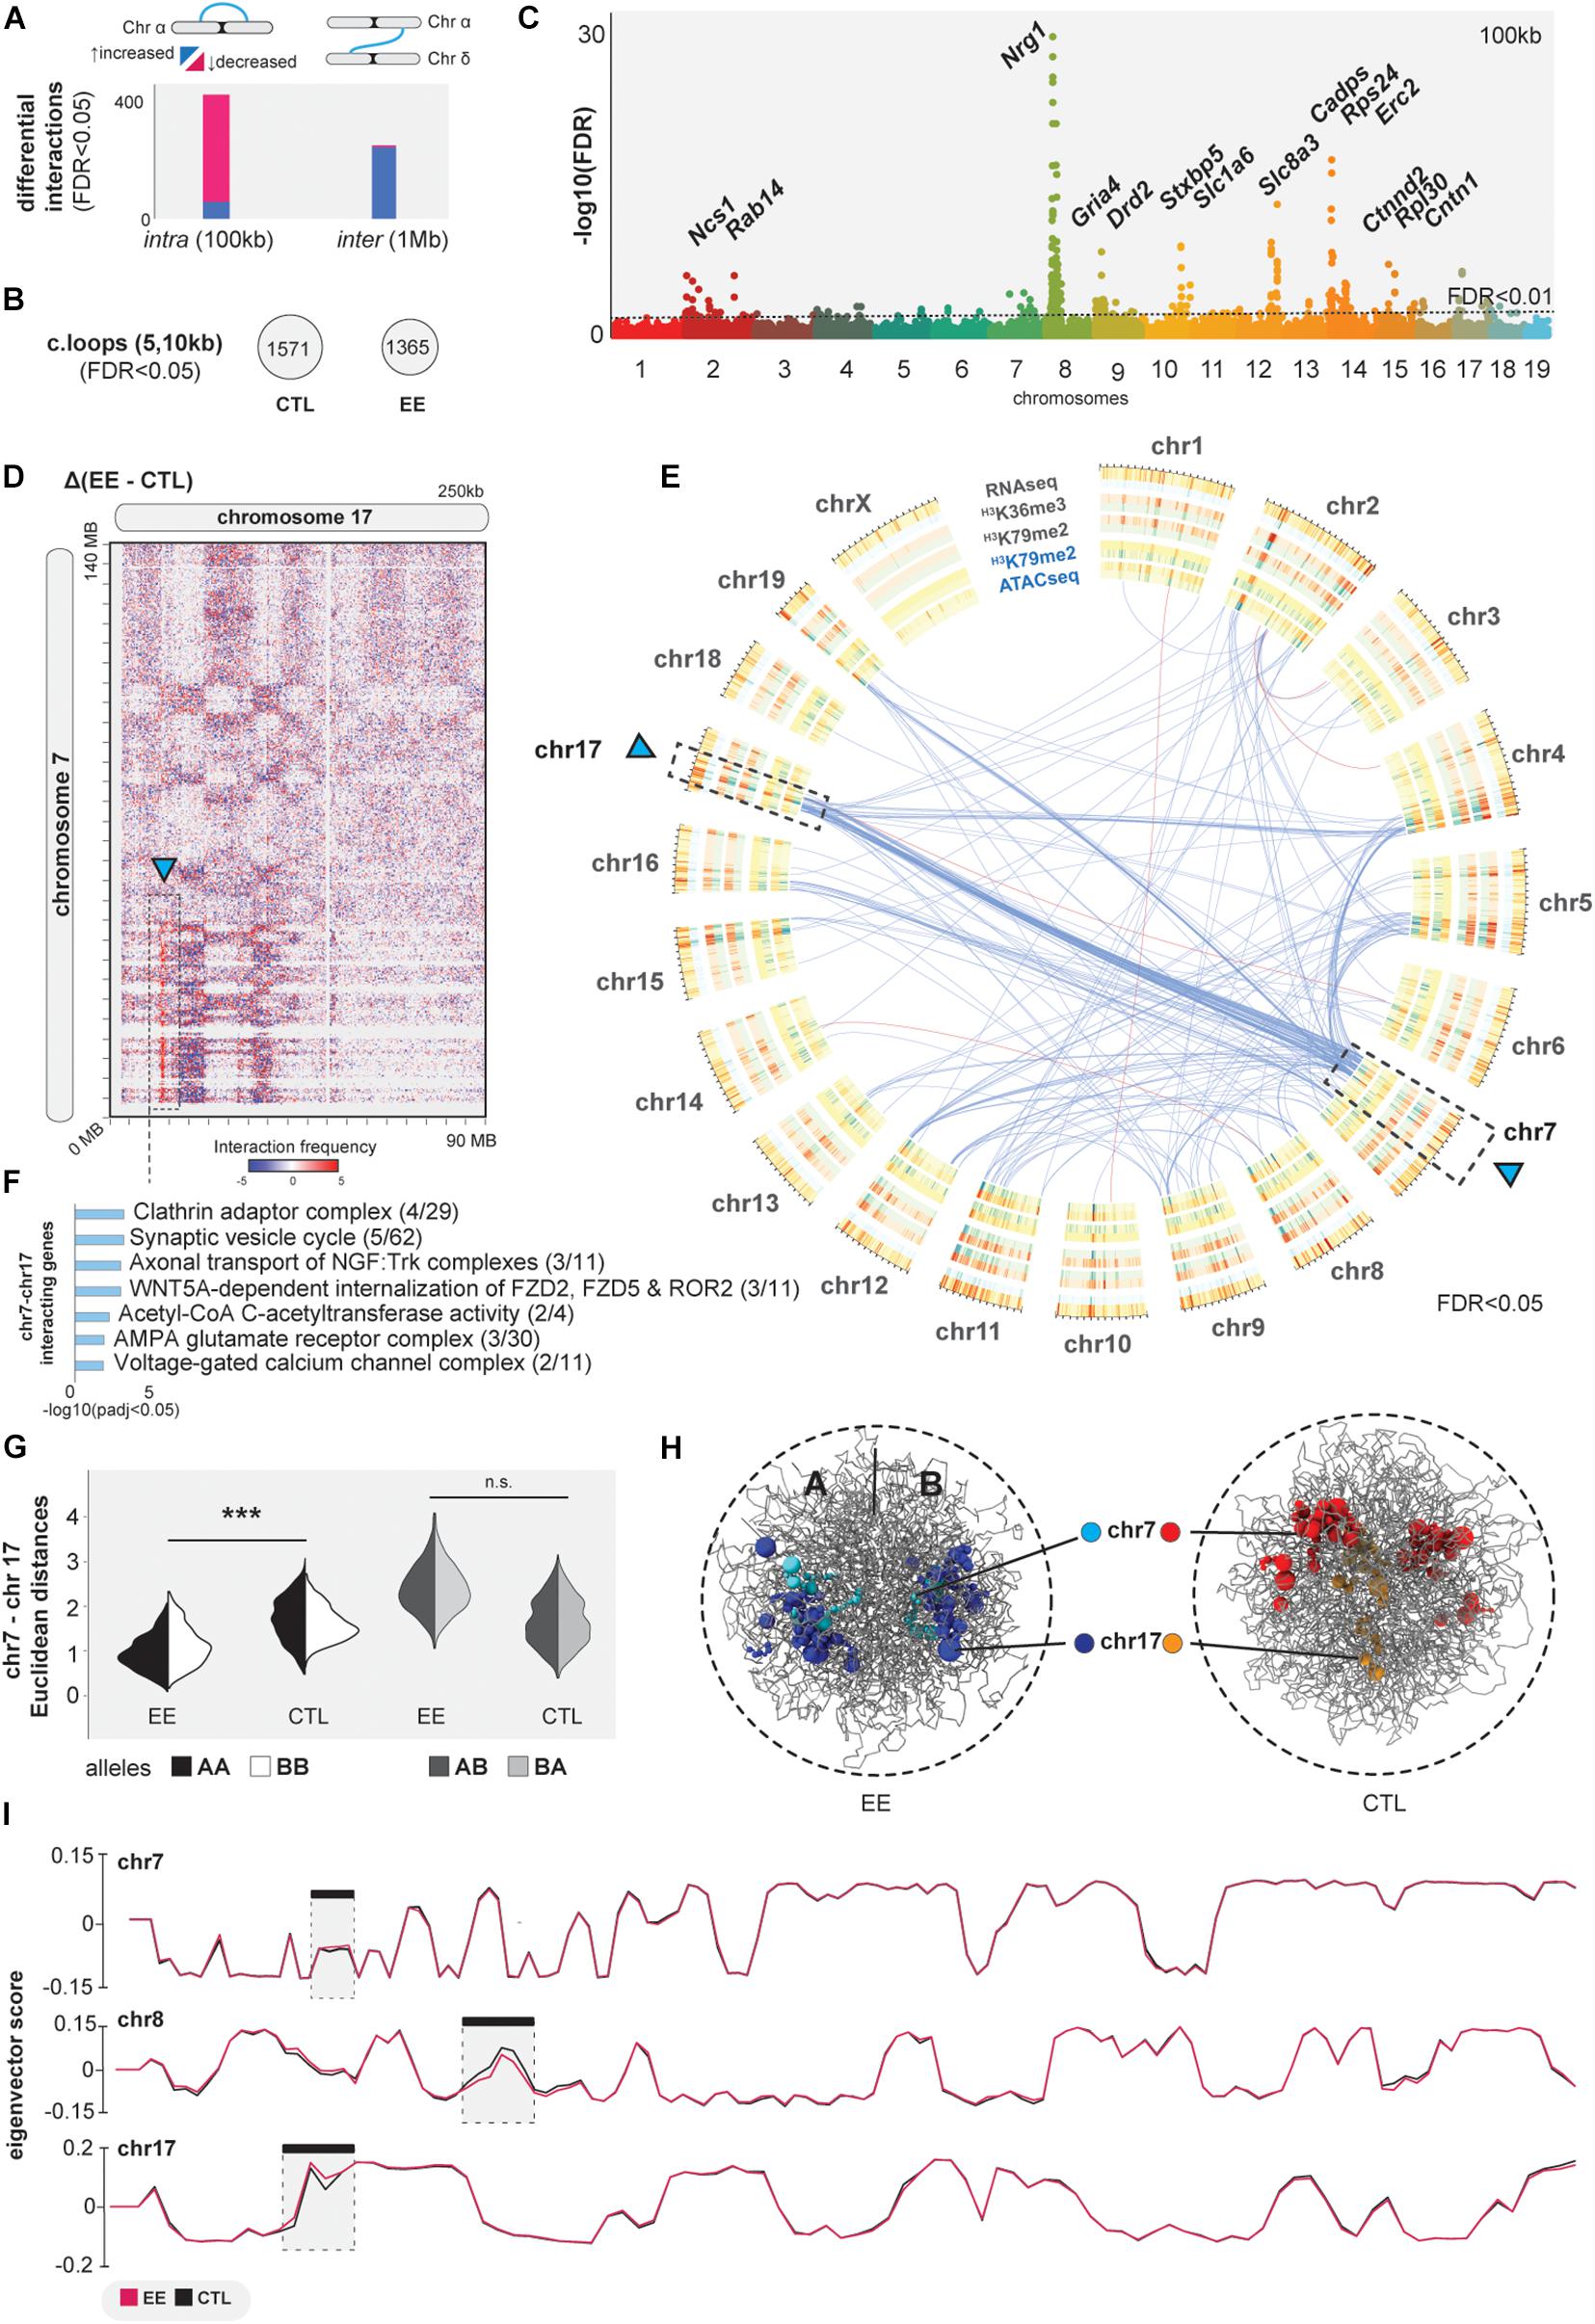
Figure 3. 3D genome interaction changes upon EE. (A) Differential analysis of intra and inter-chromosomal interactions at 100 kb and 1 Mb, respectively (FDR < 0.05). (B) Significant chromatin loops computed with HICCUPs at 5 and 10 kb resolution (FDR < 0.05). (C) Manhattan plot of differential intra-chromosomal interactions at 100 kb. (D) Juicebox heatmaps at 250 kb showing the extraction of EE vs. CTL of inter-chromosomal interactions. (E) Circos-plot of differential inter-chromosomal interactions (blue arcs-increased interactions, pink-decreased) together with concentric bedfiles representing the differential analysis of ATACseq, H3K79me2, H3K36me3 and RNAseq at 1 MB using Diffreps (increased regions upon EE = blue, decreased = red). (F) GO analysis of genes in the differential inter-chromosomal interactions at 1 MB upon EE stimulation (p-adj < 0.05 Bonferroni-step down). (G,H) In silico chrom3D models for EE and CTL samples showing significant increase of inter-chromosomal interactions. (I) A/B compartmentalization measured by eigenvector scores in chromosomes 7, 8, and 17. *** denotes p≤0.001.
While these intra-chromosomal contacts were in the focus of chromatin biology in recent years, contacts between different chromosomes (inter-chromosomal) also occur and are involved in important biological functions (Quinodoz et al., 2018; Maass et al., 2019; Monahan et al., 2019), but they remain less studied. Therefore, we asked if EE is associated with large scale changes in genome organization by tracing chimeric inter-chromosomal Hi-C reads. Indeed, we identified 241 increased and 40 decreased interactions at 1 megabase (Mb) resolution (FDR < 0.05, Figure 3A and Supplementary Table 7). We determined a significant accumulation of inter-chromosomal contacts between chromosome 7 and 17 in EE vs. CTL (Figures 3D–F, arrow). We observed that these differential interactions form a clear genome architectural stripe, also termed Greek islands (Monahan et al., 2019; Figure 3D). Among bins involving these two chromosomes, we found relevant genes associated with the synaptic vesicle cycle, such as Ap2a[1-2] being important for AMPAR endocytosis (DaSilva et al., 2016), Acat[2-3] acetyl-CoA C-acetyltransferase playing a key role in neuronal metabolism (Ronowska et al., 2018), and Cacng8 modulating AMPAR receptor complexes in the plasmatic membrane which are important for synaptic plasticity (Maher et al., 2016; Figure 3F and Supplementary Table 7). We validated our differential analysis by an independent method, called Chrom3D, and generated in silico models for pooled EE and CTL samples detecting significant proximity of chromosomes 7 and 17 (Paulsen et al., 2017; Figures 3G,H). We further corroborated the previous association of inter-chromosomal changes with gene-activity by studying chromatin compartmentalization (Lieberman-Aiden et al., 2009). As expected, A/B compartments do not change between CTL and EE, except for local changes in the strongest hubs of both intra- and inter-chromosomal contacts (chromosomes 7, 8, and 17), pointing to EE-related local chromatin changes in specific regions associated with active epigenetic modifications and gene expression changes (Figure 3I).
EE Causes Coordinated Regulatory Changes That Cluster in Inter-Chromosomal Interactions Implicated in Memory-Related Functions
The multiple “omics” datasets to study the molecular basis of EE allowed us to conduct an intersection of all EE-induced changes determined in this study (Figure 4A). Interestingly, GO analysis revealed synapse organization as the strongest ranked term (p-adj < 0.05, Supplementary Figure 7A). We decided to explore this finding further using SynGO synaptic gene curator tool to identify overrepresented genes (hits > 4 showing intersection in different sets, Figure 4B; Koopmans et al., 2019). We found a significant enrichment of postsynaptic and presynaptic genes, particularly targeting the glutamatergic synapse (Figures 4C,D).
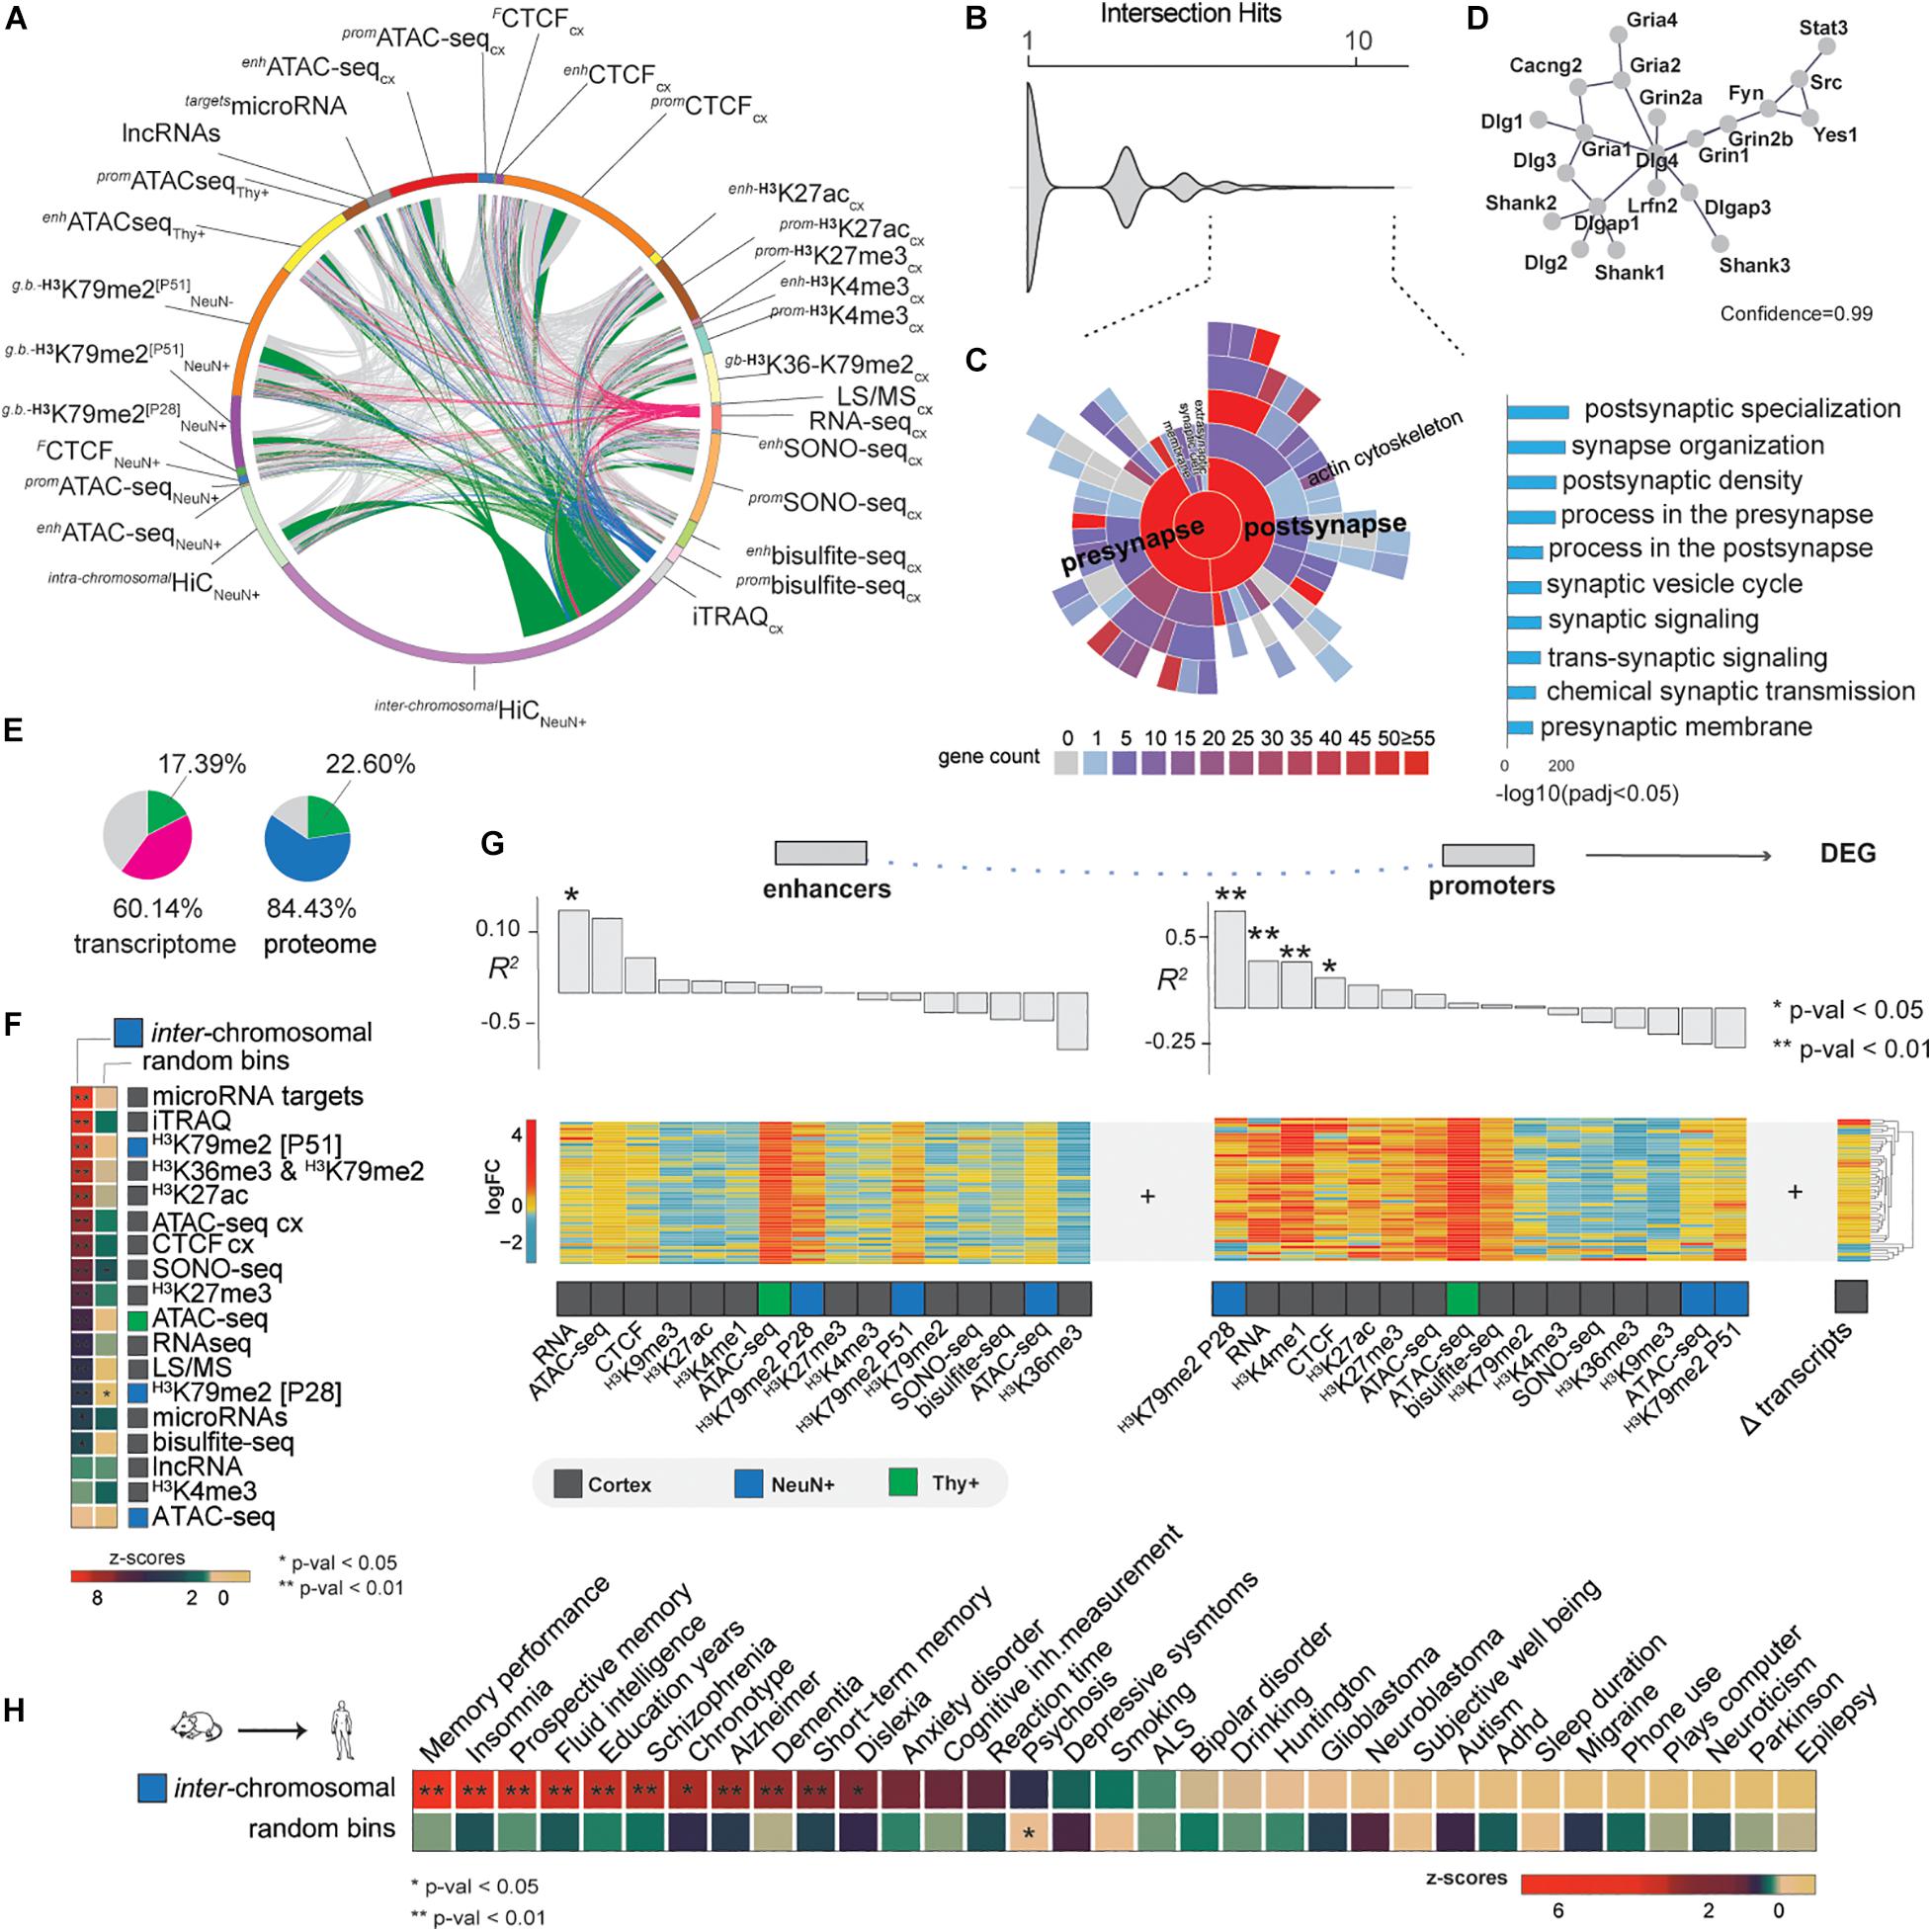
Figure 4. Data integration and EE implications in brain cognition. (A) Full intersection of differential changes induced by EE (FDR < 0.05). Pink arcs—differential expressed genes intersected with the rest of the data, blue proteomic, and green inter-chromosomal changes. (B) Intersection hits plot, representing the number of times each gene is represented in the current study. Dashed lines—genes > 4 times intersected. (C) SynGO analysis showing the enrichment of the most intersected genes which represent postsynaptic and presynaptic genes (right bar-plot, p-adj < 0.05). (D) String-db analysis interactome at 0.99 confidence of the most intersected genes. (E) Transcriptomic and proteomic changes represented in other differential sets at FDR < 0.05. “Pink + green” and “blue + green”—total percentages of transcriptomic and proteomic changes found in other differential datasets, where green specifically represents the portion of these changes found in inter-chromosomal changes. (F) Differential inter-chromosomal changes association with the rest of the marks (Npermutations = 100 k, **p < 0.01, *p < 0.05). (G) Pearson correlation of EE-induced epigenetic marks changes in enhancers and promoters with differentially expressed genes (DEG). (H) Differential inter-chromosomal changes association with human brain GWAS traits. Differential bins were lifted to the human genome for the permutation analysis (Npermutations = 100 k, **p < 0.01, *p < 0.05). To illustrate the likelihood of the results, an example of the random shuffling is provided bellow to show the strength of the analysis.
Further analysis of our merged data showed that about 60% of transcriptomic and 84% of proteomic changes are found in our other datasets, whilst 20% of changes were determined by EE-induced inter-chromosomal changes (Figure 4E). This enrichment together with the prior observation that differentially expressed genes tend to cluster in specific inter-chromosomal bins (Figure 3E), led us to the hypothesis that EE mainly induces changes locally in the genome, especially where active transcription occurs. To test this, we permuted the background genome at 1 Mb resolution 100 k times and calculated the likelihood of differential inter-chromosomal interactions to be associated with the differential epigenomic, transcriptomic, and proteomic changes found in the rest of the study. Strikingly, we observed that microRNA target genes, proteins (iTRAQ MS data), and gene-body associated histone marks were the strongest associated features within the specific inter-chromosomal hubs (Figure 4F). This finding confirms that EE orchestrates local changes of the nuclear architecture, especially inter-chromosomal communication.
Our intersection and permutation analysis indicated that chromatin conformation might connect the epigenome with the molecular phenotypes. We now asked how different marks influence others by estimating the linear dependency of EE-induced enhancers and promoters with transcriptomic and proteomic changes by Pearson and Spearman correlations (Figure 4G and Supplementary Figure 7B, Method details). We observed that enhancer RNA and promoter H3K79me2 activity drive transcriptomic and proteomic changes due EE. Particularly, we found H3K79me2 mark at P28 in promoters the most correlated modification indicating that transcripts and proteins observed at P51 are dependent on earlier stages of postnatal neuronal development, thereby underlining the temporal aspect of the critical period.
The cognitive and behavioral effects of EE could be a beneficial strategy for cognitive human disorders (Ball et al., 2019). Thus far, it is unclear if the molecular effects of EE that we found in mice can be retrieved in human. Therefore, we addressed the local changes in 3D genome organization in the human genome. Due our findings of clustered induced EE changes in differential inter-chromosomal bins, we performed a lift-over of these regions at 1 Mb from mouse to the human genome and ran a permutation analysis to test the association with 33 genome wide association studies (GWAS) relevant for human brain traits (Supplementary Table 8). We observed that the top associated traits were memory-related, such as memory performance (p < 0.01, Figure 4H). These findings not only validate our previous results, but point to conserved mechanisms between mouse and human that drive EE-related molecular effects by epigenomic, transcriptomic, and proteomic changes locally in specific regions of the genome that are important for both human and mouse cognition.
Discussion
We have characterized the regulatory response to EE by using omics both in whole cortex tissue and in two neuronal cell populations and provide a valuable resource for other scientists. We demonstrate that EE induces coordinated changes of gene-regulatory networks that involve epigenetics and genome organization to adapt to constant cognitive stimulation and social interaction. EE induced increased enhancer and promoter chromatin accessibility in neurons, corroborating previous studies showing increased open chromatin upon invasive neuronal stimulation (Su et al., 2017; Koberstein et al., 2018; Fernandez-Albert et al., 2019). These studies also highlighted the importance of CTCF shaping the 3D genome during postnatal development for memory formation (Sams et al., 2016; Kim et al., 2018). Here, we demonstrated that CTCF tends to bind preferentially to synaptic-associated genes upon EE, particularly glutamatergic associated pathways.
Our results also revealed, that gene body marks show differential activity in distal active enhancers upon EE, pointing to a potential role for these marks at transcriptionally active enhancers (Zentner et al., 2011). This is conform with the finding some DNA methyltransferases depend on H3K36me3 to exert their function at enhancers (Rinaldi et al., 2016). We also observed that active transcription in regulatory regions during early stages of postnatal neuronal development may influence local transcriptomic and proteomic changes at later stages. Furthermore, studying gene body marks in sorted neuronal populations allowed us to identify the molecular effects during the postnatal critical period, reflected by a constant increase in H3K79me2 occupation. We found it exacerbated in an experience-dependent manner, with a greater number of increased binding sites in EE compared to CTL samples across time.
Despite the caveat of cell heterogeneity potentially skewing observations in whole tissue-related experiments, particularly involving epigenetic gene body marks, it has been shown that these marks can be anticorrelated with expressed genes during aging (Pu et al., 2015). Another conflicting example that could be influenced by cell composition was the observed results involving increased chromatin accessibility and decreased H3K27ac in whole cortex enhancers. Both marks are highly related with gene transcription and could share some degree of linear dependency due the influence of EE (Karlić et al., 2010; Klemm et al., 2019). However, a recent study might indicate the contrary, as changes in H3K27ac coverage do not influence ATAC-seq levels in the same genomic regions (Zhang et al., 2020). Moreover, we didn’t observe overlap between the differential regions of both marks, supporting the hypothesis that changes due EE in both marks, could be totally independent. Even though, we cannot discard cell composition as a factor influencing those results. Future investigation using single cell/nuclei approaches is needed to better determine these epigenetic relationships due external factors such as EE. In fact, we have shown by cell-deconvolution the importance of other cell types which are often ignored in learning-memory studies. Additionally, EE-induced directional regulation particularly of epigenetic marks could reflect the discrepancy occurring upon cognitive stimulation, such as pruning and synaptic tuning, where both synaptic strength and loss are part of the learning process during postnatal development (Turrigiano, 2008; Stephan et al., 2012).
Furthermore, by applying Hi-C to neurons, we elucidated for the first time intra- and inter-chromosomal interactions sensitive to EE. Especially the mnemonic inter-chromosomal 3D conformation map with its major inter-chromosomal hub involving chromosomes 7 and 17 shows that the environmental stimulus EE affects local epigenomic regulation and chromatin interactions in a coordinated manner. EE-induced changes relate to both synapse strengthening and pruning genes, affecting cytoskeletal rearrangements and ECM associated genes (Wright and Harding, 2009; Smagin et al., 2018). These synaptic rearrangements need pathways, such as Rho, GPCR, and PKC/Akt signaling which we found enriched in our study, with special enrichment of Wnt signaling (Hu et al., 2013; Lichti et al., 2014; Tan et al., 2017).
Our results indicate that environmental cues in postnatal development, particularly stimulation provided by EE, modulates epigenomic and 3D genome landscapes in a coordinated manner relevant for cognition.
Materials and Methods
Experimental Procedures
Animals: Housing and Enrichment Conditions
All experimental procedures were approved by the local ethical committee (Procedure Code: ISA-11-1358). Wild type mice (C57BL/6J) and Tg(Thy1-YFP) [strain B6.Cg-Tg(Thy1-YFPH)2Jrs/J No. 003782; The Jackson Laboratories] were kept and bred according to local (Catalan law 5/1995 and Decrees 214/97, 32/2007) and European regulations (EU directives 86/609 and 2001-486).
After weaning (21 days of age), mice were randomly reared under either non-enriched (NE) or enriched (EE) conditions for 30 days. In NE conditions, animals were reared in conventional Plexiglas cages (20 × 12 × 12 cm height) in groups of two to three animals. The EE group was reared in spacious (55 × 80 × 50 cm height) Plexiglas cages with toys, small houses, tunnels, and platforms. The arrangement was changed every 3 days to maintain the novelty of the environment. To stimulate social interactions, six to eight mice were housed in each EE cage. All groups of animals were maintained under the same 12 h (8:00 to 20:00) light-dark cycle in controlled environmental conditions of humidity (60%) and temperature (22°C), with free access to food and water. The experiments were conducted using only females, since male mice showed hierarchical behavior similar to that observed previously that may affect the outcome of EE (Martínez-Cué et al., 2002). To stimulate social interactions, six to eight mice were housed in each EE cage. The use of female mice allowed to mix different mice in the same cage from different litters.
Cortical data analysis derived from the same samples and EE protocol that was used by Pons-Espinal et al. (2013) and PhD thesis “Role of DYRK1A in hippocampal neuroplasticity: Implications for Down syndrome1,” where behavioral studies (Morris water maze testing) showed successful EE treatment. At 5 (P28) or 8 weeks of age (P51), mice were euthanized by carbon dioxide, and the cerebral cortex was dissected within 1 min of death. The tissue was immediately flash frozen in liquid nitrogen. In the case of Tg(Thy1-YFP) animals, the tissue was immersed in Hank’s Balanced Salt Solution (HBSS 1X, Gibco 14065-049) before proceeding with the sample preparation for the FAC-sorting (see section below). For each condition and replicate, we pooled the cortices of five mice with some exceptions: mice for insitu-HiC where single replicas as well as Thy-YFP mice for ATACseq (Ncortex = 20 mice in 4 bioreplicates; Nsorted = 30 mice in 6 bioreplicates, NNeuN+_HiC = 4 mice in 4 bioreplicates, NThy+ = 4 mice in 4 bioreplicates). The frozen cortices for pooled animals were ground together in a frozen mortar containing liquid nitrogen, to obtain a fine powder of pooled cortex tissue. The powder was aliquoted and stored at −80°C.
Nucleic Acid Extraction
DNA was extracted using Phenol:chroloform:iso-amyl alcohol (25:24:1) according to manufacturer guidelines (Sigma 77617-500ml). RNA was extracted using Qiazol total RNA (Qiagen Cat No:79306) kit according to the manufacturer’s instructions. The RNA was quantified by Qubit® 2.0 Fluorometer (Life Technologies) and the quality was assessed using a Nanodrop 2000c (Thermo Fisher Scientific) and a 2100 Bioanalyzer (Agilent Technologies, CA, United States).
Nucleus Isolation
To obtain fresh nuclei, ground frozen tissue was resuspended in tissue lysis buffer (1x PBS containing 0.1% Triton X-100, 1x Complete Protease inhibitor cocktail tablette (cOMPLETE mini EDTA-free, Roche Cat No. 11836170001) and 1 mg/ml AEBSF (Pefabloc, Roche Cat No. 11585916001) and dissociated by 60–90 strokes in a glass douncer (7 ml tissue grinder Tenbroek, Wheaton Cat No. 357424). Nuclei were counted using a hemacytometer and constantly checked under a microscope (Leica DM-IL).
FAC-Sorting
Two different procedure were performed: (1) Sorting total neurons using NeuN (Rbfox3) marker and (2) Sorting pyramidal neurons in Tg(Thy1-YFP) mice. Briefly, after the nucleus preparation, nuclei were resuspended in 1 ml of PBS-PI 1X [1X-PBS, 1x Complete Protease inhibitor cocktail (cOMPLETE mini EDTA-free, Roche Cat No. 11836170001), 1 mg/ml AEBSF Pefabloc (Pefabloc, Roche Cat No. 11585916001) and 0.1 mg/ml of BSA (BSA, Molecular Biology Grade NEB, Cat No. B9000S)]. 1.5 μl of anti-NeuN, clone A60, Alexa Fluor® 555 Conjugate (Merk Millipore Cat No. MAB377A5) was added to the solution and incubated at 4°C for 1.5 h protected from light. The sample was centrifuged for 10 min, 500 g at 4°C and washed with 1 ml of PBS-PI 1X. Next, 1μl of 4′,6-Diamidine-2′-phenylindole dihydrochloride was added (DAPI, Roche Cat. No. 10236276001) and the sample was given immediately to the FACS-sorting Facility. Samples were sorted at 12PSI in cold condition in an INFLUX sorter (BD Biosciences INFLUXTM). The sorted samples were centrifuged for 40 min at 700 g at 4°C to collect the nuclei before proceeding with the desired technique. For sorting pyramidal neurons Tg(Thy1-YFP), animals were dissected and tissue was immediately submerged in Hank’s Balanced Salt Solution (HBSS 1X, Gibco 14065-049). Brain samples were dissociated using the Neural Dissociation Kit (P) (MACS Milteny Biotec Cat. No. 130-092-628; LS Columns Cat. No 130-042-401; Myelin removal beads Cat No. 130-096-731; MidiMACSTM separator Cat. No. 130-042-302), according to manufacturers’ instructions. Cells were sorted using an INFLUXTM sorter (BD Biosciences INFLUXTM). After sorting, samples were centrifuged for 40 min at 700 g at 4°C to collect the nuclei before proceeding with the desired technique.
Whole Genome Bisulfite-Sequencing
WGBS was performed by CNAG Genome Facility on two independent sets of biological replicates. Briefly, genomic DNA (1–2 μg) was spiked with unmethylated λ DNA (5 ng of λ DNA per microgram of genomic DNA; Promega). DNA was sheared by sonication to 50–500 bp in size using a Covaris E220 sonicator, and fragments of 150–300 bp were selected using AMPure XP beads (Agencourt Bioscience). Genomic DNA libraries were constructed using the Illumina TruSeq Sample Preparation kit following Illumina’s standard protocol. DNA was treated with sodium bisulfite after adaptor ligation, using the EpiTexy Bisulfite kit (Qiagen), following the manufacturer’s instructions for formalin-fixed, paraffin-embedded tissue samples. Two rounds of bisulfite conversion were performed to ensure a conversion rate of >99%. Enrichment for adaptor-ligated DNA was carried out through seven PCR cycles using PfuTurboCx Hot-Start DNA polymerase (Stratagene). Library quality was monitored using the Agilent 2100 Bioanalyzer, and the concentration was determined by quantitative PCR with the library quantification kit from Kapa Biosystems. Paired-end DNA sequencing (2 × 100 bp) was then performed using the Illumina HiSeq 2000 platform.
Chromatin Accessibility
Open chromatin studies were performed by ATAC-seq and SONO-seq procedures. Briefly, ATAC-seq was performed with minor modifications from Buenrostro et al. (2013). 100,000 nuclei were treated with 2.5 μl Tn5 at 37°C for 30 min, followed by cleanup on a Qiagen Minelute column. Fragments >1 kb in size were removed using AmpureXP beads (Agencourt AMPure XP, Beckman Coulter Cat. No. A63881). DNA fragments were amplified by 11 cycles of PCR with custom adapter primers from Buenrostro et al. (2013). PCR reactions were cleaned up with AmpureXP beads, quantified by Qubit and quality controlled by Bioanalyzer (Agilent Technologies). SONO-seq consists of isolating and fragmenting crosslinked chromatin, before reversing crosslinks, purifying the DNA and preparing it for sequencing (Auerbach et al., 2009). Chromatin was fragmented by sonication using the same COVARIS specifications as for ChIP-seq (see above) to obtain a median fragment size of 200 bp. Sequencing libraries were prepared using the NEBNext Ultra (New England Cat. No. E7370L) kit according to the manufacturer’s protocol. Both techniques were sequenced on a HiSeq2000 sequencer (Illumina).
Chromatin Immunoprecipitation: ChIP-Seq
Nuclei obtained in section “Nucleus Isolation” were cross- linked with 0.5% formaldehyde (Sigma F8775-25ml) for 5 min at room temperature (RT). Residual formaldehyde was quenched by addition of glycine (MAGnifyTM Glycine P/N 100006373) to a final concentration of 0.125 M and incubation for 5 min at RT. Nuclei were pelleted by centrifugation at 500 g during 10 min at 4°C and resuspended in 300 μl lysis buffer (MAGnifyTM Chromatin Immunoprecipitation System, Cat no. 49-2024). Chromatin was fragmented by sonication in a Covaris S2 [Duty Cycle: 20, Intensity: 8, Cycles per Burst:200, for 15 min (histone marks), for 25 min (FACS-sorted nuclei)] to a median size of 200 bp, aliquoted and stored at −80°C until further use. For non-histonic proteins such CTCF, no nuclei preparation was performed. Homogenized tissue was crosslinked with 0.5% formaldehyde for 10 min at RT, quenched and fragmented as above (Duty Cycle: 5, Intensity: 2, Cycles per Burst: 200, Time: 25 min). Chromatin immunoprecipitation was performed using antibodies against histone modifications (H3K27ac, H3K4me3, H3K4me1, H3K79me2, H3K36me3, H3K27me3, H3K9me2, and CTCF) with the MAGnifyTM Chromatin Immunoprecipitation System (Invitrogen Cat no. 49-2024), according to manufacturer’s instructions. For whole cortex and NeuN histonic ChIP-seq a total amount of 50 k nuclei was used per ChIP (∼330 ng), 700 k nuclei (∼4 μg) for non-histonic ChIP-seq. Recovered ChIP DNA was used to construct sequencing libraries, using the NEBNext Ultra (New England Cat. No. E7370L) kit according to the manufacturer’s protocol, and sequenced on a HiSeq2000 sequencer (Illumina). The quality of the ChIP-seq was determined by qPCR, using positive and negative primers to detect the regions where the histones should be placed in the genome (Supplementary Table 1). Primers were diluted to a final concentration of 300 ng in Power SYBR Green PCR MM (Applied Biosystems Cat. No 4367659). Samples were run in a Applied Biosystem qPCR system (7900 HT Fast Real-Time PCR System) as follows: 50°C/2 min, 95°C/10 min, 40 cycles of 95°C/15 s, 60°C/1 min, 95°C/15 s, 60°C-15 s, and 95–15 s.
Transcriptomics
Transcriptome study involved both poly-A RNA, directional RNA and small RNA libraries. Poly-A RNA sequencing libraries were prepared from total RNA using the TruSeqTM RNA sample preparation kit (Illumina Inc., Cat. No. RS-122-2001) according to the manufacturer’s protocol. Directional RNA libraries were prepared using the ScriptSeqTM Complete Gold Kit (Human/Mouse/Rat) (Epicentre Biotechnologies), according to the manufacturer’s protocol. Briefly, 3 μg of total RNA were depleted of both cytoplasmic and mitochondrial rRNAs using the Ribo-ZeroTM Gold rRNA Removal Reagents. The total rRNA depletion of the samples was confirmed on a 2100 Bioanalyzer RNA 6000 Pico Chip. For the library preparation we used 50 ng of Ribo-Zero-treated RNA as starting material for the ScriptSeqTM v2 RNA-Seq Library Preparation Kit, followed by amplification by 12 cycles of PCR, using the FailSafeTM PCR Enzyme Mix (Epicentre Biotechnologies) before purification with AMPure XP beads (Agencourt, Beckman Coulter Cat. No. A63881). Both the directional mRNA and the Poly-A RNA libraries were sequenced in paired end mode with read length 2 × 101 bp on a HiSeq2000 (Illumina, Inc.) following the manufacturer’s protocol. After computational analysis, we validated 21 differential expressed genes in a new batch of biological replicates following the method of Schmittgen and Livak 2008 (see Supplementary Table 4). To validate the data generated in the RNA-seq analysis, 1 μg of the sequenced RNAs were used to prepare cDNA with SuperScriptIII (Invitrogen) according to manufacturer’s instructions, cDNAs were normalized to 100 ng/μl. RT-PCRs for the alternative splicing events were performed using oligos annealing to the adjacent constitutive exons and performed under standard conditions; 2% agarose gels were used to resolve the different bands. Image J software was used for quantification of the observed bands and determination of the PSIs for each event. Small RNA libraries were generated using the TruSeq (Illumina, Cat. No. RS-122-2001) kit according to the manufacturer’s protocol. The resulting 22 bp insert libraries were sequenced on a HiSeq2000 sequencer (Illumina), yielding 15–20 million reads per sample. After the analysis, we validated 6 out of 10 miRNA in a second independent group of animals, following Chen et al. protocol with minor modifications: instead of using Taqman probes we designed our own RT-miRNA oligonucleotides and performed qPCRs with Power SYBR Green PCR MM (Applied Biosystems Cat. No. 4367659, see Supplementary Table 5; Chen et al., 2005).
Proteomics
Samples were minced with RIPA-M buffer (1% NP40, 1% Sodium deoxycholate, 0.15 M NaCl, 0.001 M EDTA, 0.05 TrisHCl pH = 7.5, 1X cOMPLETE Mini EDTA free, 0.01 M NaF, 0.01 M Sodium pyrophosphate, 0.005 M β-glycerolphophate), sonicated with a Diagenode Bioruptor (cycles of 0.5 min ON 0.5 min OFF, medium intensity during 5 min). Samples were centrifuged during 10 min 16,000 rpm at 4°C and precipitated with acetone at -20°C for 1 hour. Samples were pelleted by centrifugation during 10 min 16,000 rpm at 4°C, dried and resuspended in Urea/200 mM ABC, sonicated again during 10 min (cycles of 0.5 min ON 0.5 min OFF, medium intensity) and quantified prior to mass spectrophotometry injection following isobaric tags for relative and absolute quantitation (iTRAQ) or Liquid Chromatography/Mass-Spectophotometry (LC/MS).
In situ-HiC
Cerebral cortex samples from individual C57BL/6J mice (2 bio-replicates per EE and CTL conditions) were sorted using NeuN+ (Rbfox3+) as described above. After sorting, approximately 1 million of nuclei were used for in situ HiC following previous specifications (Rao et al., 2014). Libraries were sequenced on a HiSeq2000 (PE × 125 bp) yielding approximately 300 M of reads per sample.
Quantification and Statistical Analysis
In silico Identification of Active Enhancers
Active enhancers for EE and CTL cortex were predicted and annotated using a machine learning approach called Generalized Enhancer Predictor (GEP)2 (Jhanwar et al., 2018). The method performed classification of epigenetic patterns coming from cortical ATAC-seq, H3K4me1, H3K4me3, H3K27ac, H3K36me3, and H3K27me3 using Random Forest (RF) and Support Vector Machine (SVM) classifiers to build predictive models for identification of active enhancers. The total amount of enhancers used in the present study corresponded to the consensus of GEP prediction for EE, control and ENCODE data, resulting in 347112 enhancers (Supplementary Table 1).
In silico Prediction of Chromatin Interactions
Chromatin interactions were predicted from chromatin modifications using Epitensor with minor modifications to adapt the script to the mouse genome (Zhu et al., 2016). We used epigenetic data from following tissues from the mouse ENCODE project (forebrain, heart, hindbrain, kidney, liver, lung, midbrain, stomach) (Yue et al., 2014). As well as in-house generated data from cortex of animals with and without environmental enrichment. We used the following epigenetic marks: H3K9me3, H3K4me3, H3K4me1, H3K36me3, H3K27me3, H3K27ac, CTCF as well as RNA-seq coverage data. Chromatin accessibility was measured by DNase-seq for ENCODE tissues and ATAC-seq for in-house cortex samples. Promoter regions were defined using the TxDb.Mmusculus.UCSC.mm10.knownGene package in BioConductor as 1,500 up- and 500 down-stream of any possible TSS. Active enhancers in each of the input tissues were defined by training a machine learning classifier on a list of validated enhancers using core epigenetic mark intensities as features (DNase, H3K27ac, H3K27me3, H3K36me3, H4K4me1, H3K4me3 as well as intensity ratio between the last two marks). The trained classifier was then applied to the epigenetic data from ENCODE tissues and local cortex datasets. To limit computation load, possible interactions were limited to intra-TAD interactions, which were based on the set of mouse cortex TADs3 (Dixon et al., 2012). Differential activity in enhancers was annotated using annotate.enhancers.with.genes.sh utility4.
Whole Genome Bisulfite-Sequencing
Methylated CpGs were called from the raw reads using Bismark (Krueger and Andrews, 2011) following the user guide. Differential methylation analysis was carried out using bsseq (Hansen et al., 2012). Briefly, CpG methylation values were locally smoothed using the BSmooth function and CpGs that had a coverage of less than 5 reads in any of the samples were removed. We calculated the t statistic for the smoothed CpG values using the BSmooth.tstat function with paired design in local correction mode and the dmrFinder function was used to identify differentially methylated regions (DMRs) that contained multiple CpGs with a t statistic below -4.5 or above 4.5. DMRs located inside or within 5 kb of a gene or enhancer were annotated accordingly. Additionally, DMRs that overlapped enhancers, were annotated with the enhancer’s target gene according to the Epitensor predictions.
Chromatin Accessibility
ATAC-seq libraries were aligned to mm10 using bwa-mem with predefined parameters (Li and Durbin, 2010). Duplicate read pairs were marked using the MarkDuplicates command from the Picard software suite5. We used a peak-independent approach on the one hand using our predicted enhancers and promoters as defined above, and on the other hand a peak-dependent method using F-seq or MACS2 with default parameters with and without duplicates (Boyle et al., 2008; Zhang et al., 2008). We also used MACS2 with the shifted strategy with the following parameters: “–nomodel –shift -75 –extsize 150 –broad –keep-dup all.” Together with enhancer and promoter regions, each annotation was loaded into DiffBind (Ross-Innes et al., 2012) providing as background input SONO-seq chromatin (Ross-Innes et al., 2012). For SONO-seq libraries, the pipeline followed the same steps as the ChIP-seq (see below).
Footprinting analysis was done using the Centipede software using the core transcription factor binding motifs from the Jaspar database (version 2016-03-02) (Pique-Regi et al., 2011; Khan et al., 2018). Instances of each motif in the genome were kept if the PWM score was superior or equal to 13. We created and used a mm10 mappability file to filter out instances that are located in regions of the genome with low mappability (gem-mappability-retriever; Marco-Sola et al., 2012). A motif was considered bound if the P-value-Z-score-combined statistics was inferior to 0.05. A motif was considered differentially bound if the ANOVA p-value was inferior to 0.05. Individual instances of a motif were considered bound when their posterior probabilities were superior to 0.99.
Chromatin Immunoprecipitation: ChIP-Seq
Samples were mapped to mouse mm10 (peak-independent) using Bowtie (Langmead et al., 2009) with “–quiet –sam –best –strata -m 1” parameters. Sam files were converted to bam files allowing only reads with mapping quality greater than 30 (“-q 30”). Files were visualized using bamCoverage utility from deepTools (Ramírez et al., 2016). We initially used a peak-dependent strategy as a benchmarking method and also as a tool to define our peak-independent approach (data not shown). The quality of ChIP-seq was assessed by the irreproducible discovery rate (IDR) (Li et al., 2011). The peak-independent method used in the present study consisted in the calculation of the coverage at defined regions as follows. The broad marks H3K36me3 and H3K79me2 were measured along the full gene body, defined as the distance from the TSS to the TES. Enhancer regions were provided by the GEP enhancer predictor in combination with ENCODE enhancers (Jhanwar et al., 2018; Supplementary Table 1). Promoter regions were defined as the interval from 1,500 bp upstream to 500bp downstream of the TSS. Reads were quantified by featurecounts (Liao et al., 2014) with the following parameters: “–ignoreDup –minReadOverlap 25 -Q 1 –O.” Counts tables were supplied to the batch effect corrector RUVseq for further differential analysis using edgeR (Robinson et al., 2010; Risso et al., 2014). A binned approach was used to determine differential changes in 1Mb bins to be associated with inter-chromosomal interactions hubs. This differential analysis was performed with Diffreps (Shen et al., 2013). Using the following parameters: “-pval 0.001 -frag 150 -window 1000.” Batch effects are a major issue in sequencing studies. In this study, we acknowledge the lack of bio-replicates in the cortical tissue by having a wide set of different techniques as well as a pooling strategy of animals per bio-replicate (5 individuals per sample). To minimize batch effects, we randomized the samples, applied standardized procedures and parallelized the experiments as much as possible. However, FAC-sorting experiments could not always be parallelized for different reasons (i.e., availability of the sorter). To remove batch effects, we decided to use the strategy of Russo et al. that was also used in data different from RNAseq (Risso et al., 2014; Koberstein et al., 2018). A principal component analysis was the main criterion to evaluate each dataset and the requirement for batch correction. If a PCA on uncorrected data could clearly separate the conditions, we ruled that there was no need for batch correction. However, if required, we then selected the method(s) (among RUVg, RUVs, and/or RUVr) that were able to separate conditions and intersected the results with a FDR threshold of 0.1 to obtain a conservative final gene list of changes induced by EE. Coverage plots were produced using the function bamCoverage of deepTools to produce bigwig files (Ramírez et al., 2016) (v2.0 with Python 2.7.14). These files were supplied to the function computeMatrix using the “scale-regions” parameter that allows to plot the coverage profile using the plotProfile function along regions of interest. The cell-specificity of sorted populations was assessed by the tool MakerGeneProfile that estimates cell specificity using a curated single-cell mouse brain RNAseq database6. We transformed gene-body assigned reads of H3K79me2 NeuN+ and NeuN– into RPKM values and ran MakerGeneProfile to compare neuronal and non-neuronal enrichments to oligodendrocytes, astrocytes and pyramidal neurons specific markers. MGP states for MakerGeneProfile and it is described as a correlate value of cell type proportions. Specifically, MGP scores consist in the summarized expression profiles into the first principal component to estimate cell ratios (Mancarci et al., 2017). Gene ontology term enrichment analysis was performed using the Cytoscape tools clueGO and cluepedia, Metascape and SynGO (Bindea et al., 2009; Koopmans et al., 2019; Zhou et al., 2019). We performed the analysis individually for each histone mark or together, supplying upregulated and downregulated DBS separately. We used Bonferroni step down or Benjamini-Hochberg with p-value thresholds of 0.05 or 0.01 depending of the amount of data provided. In general, larger datasets needed more stringency in the statistical correction (Benjamini and Hochberg, 1995).
Transcriptomics
mRNA reads were aligned to mm10 using STAR with standard parameters (Dobin et al., 2013). Reads were counted using featureCounts by “gene_name” (Liao et al., 2014), batch corrected by RUV-seq before differential analysis in edgeR (Robinson et al., 2010; Risso et al., 2014). We also provide a splicing analysis results compiled in Supplementary Table 4. To identify and quantify alternative splicing, we used vast-tools v1.0.0 (Tapial et al., 2017). To increase effective read coverage at splice junctions, we pooled all replicates for polyA, respectively ribominus, samples using vast-tools merge. Differential splicing analysis was performed using vast-tools compare, comparing EE with Ctl samples in a paired manner, using the parameters –min_dPSI 10 –min_range 5 –p_IR –noVLOW. This resulted in, respectively, 40 and 53, cassette exons being up- or downregulated with EE (including 2 and 1 microexons; Irimia et al., 2014), 49 and 43 retained introns, 27 and 22 alternative 3’ss choices and 28 and 23 alternative 5’ss splice choices.
Regarding the lncRNA analysis, total RNA reads were aligned to mm10 using Subjunc splice-aware aligner with default settings (Liao et al., 2013), and reads overlapping exons were summarized at the gene-level to the corresponding genes using featureCounts (Liao et al., 2014). Read assignment to exons was carried out in a strand-aware manner, only fragments with both mates correctly aligned were considered and genomic regions with multiple overlapping exons on the same strand were disregarded. The count matrix was further filtered to retain only GENCODE long non-coding RNA (GRCm38.p5_M15). Reads with an average log2 CPM < 0.9 across all samples were filtered out yielding 4,472 genes. Normalization factors were calculated using the TMM method from edgeR package (Robinson et al., 2010). Observational-level weights were calculated using voom (Law et al., 2014) and used to fit gene-wise linear models (Smyth, 2004). Multiple testing p-value adjustment was performed using the Benjamini-Hochberg method (Benjamini and Hochberg, 1995).
Small RNA reads with homo-polymer and low PHRED scores were removed using FASTQ-Toolkit and a custom script. SeqBuster was used to remove adapters and align using miraligner.jar with mouse miRbase v18 annotation (Pantano et al., 2010). The small RNA dataset presented a strong batch effect which could not be corrected by RUVseq (Risso et al., 2014). We therefore devised an alternative strategy which consisted of filtering microRNAs for low read coverage (<50 counts), normalizing the libraries by read counts per million (rpm), before contrasting EE against CTL batch-wise and considering exclusively reproducible direction of change. Additionally, we calculated z-scores validating partially previous strategy (Supplementary Table 5).
Proteomics
The analysis of iTRAQ data consisted in sorting the discrepancy (δ = φ/β) between both biological contrasts (φ = EE1/CTL1 and β = EE2/CTL2), following the premise that consistent results will be indicated by:
Discrepant results then will be considered as values far from δ = 1. Based on this consideration we select all the proteins that follow the condition and we established a threshold of ±0.1. The protein expression values from the LC/MS were log2-transformed and loess normalized using the normalize.ExpressionSet.loess function from the BioConductor package AffyPML. Differential expression analysis was conducted with a standard limma (BioConductor) pipeline by calculating sample weights, fitting a linear model for each gene across all samples and calculating moderated F-statistics. Unadjusted p-values were used to rank the proteins (Smyth, 2004).
In situ Hi-C
For quality check, sequencing reads were mapped to the mouse reference genome assembly (mm10), artifacts were filtered, and library was ICED normalized using the Hi-C-Pro (Servant et al., 2015) (v2.9.0) (Supplementary Table 7). For visualization we used the hicpro2juicebox.sh utility to convert the previous into a ∗.hic format to visualize heatmap interaction matrices in Juicebox (Durand et al., 2016a). Juicer_tools were used to calculate A/B compartments using eigenvector utility (Durand et al., 2016b). We called chromatin loops with HICCUP at 5 and 10 kb of resolution (Durand et al., 2016a). For differential analysis, resulting interactions from Hi-C-Pro were splitted into intra and interchromsomal interactions, sex chromosomes and self-interacting bins were removed. Then piped into the edgeR wrapper RUVseq were RUVr for intra and RUVg for inter were used to normalized batch effects.
Required EE and CTL gtrack file to run chrom3D (Paulsen et al., 2017) was produced using the chrom3D wrapper automat_chrom3D utility7. Domains were called using Arrowhead (Juicer tools 1.7.6; Durand et al., 2016b). “–ignore_sparsity” parameter was used, and calls could be only produced at not lower than 10 kb. For the present study, we finally selected 5 M iterations including the parameter “–nucleus” to force the beads to remain confined inside the designed radius: “-r 3.0.” Domain coloring was produced by automat_color8 that allows to color any region of interest in the model. Both in silico models are available Supplementary Table 7.
Data Integration
We used Metascape to intersect the totality of the data. Some of the results were clumped as the maximum amount of sets allowed is 30 (Zhou et al., 2019). Transcriptomic and proteomic changes percentages explain by the rest of the data were calculated out of the evidences table reported as Metascape result (Supplementary Table 8).
Linear dependency test was performed by using Pearson and Spearman correlations to test how enhancer and promoter activity of different marks influence differential changes observed in the transcriptome and proteome. Briefly, normalized counts by RPKM mapping into enhancers and promoters were first averaged by target gene name they interact with using EpiTensor (Zhu et al., 2016). Then a fold change was calculated of EE vs. CTL samples. These values then are correlated with the corresponding fold changes found in differential RNA-seq and proteomic analysis. We used Spearman for proteomic changes as the scale of the fold changes were considerably different coming directly from iTRAQ data and the method is less sensitive for these outliers.
In order to test the association of differential regions induced by EE with inter-chromosomal interactions we run a permutation analysis using the package regioneR. Both permutations shown in the study were performed with a total number of 100,000 iterations. GWAS brain trait studies are collected in detail in Supplementary Table 8.
Data Availability Statement
Datasets are currently accessible in the SRA repository: https://www.ncbi.nlm.nih.gov/sra/SRP154319. Processed data and other resources can be found in the dedicated website: www.mousecortexregulome.org.
Ethics Statement
The animal study was reviewed and approved by Comité Ético de Experimentación Animal del PRBB (Procedure Code: ISA-11-1358).
Author Contributions
SE-G performed most of the experimental procedures (sorted ATAC-seq samples, all ChIP-seq, RNA-seq and miRNA validations, in situ HiC, and proteome preparation for LS/MS), carried out most of the analysis (ATAC-seq, ChIP-seq, RNA-seq, miRNA, proteome, and in situ HiC), and wrote the manuscript. CNH performed part of the experimental procedures (bisulfite-seq, cortex homogenate ATAC-seq, RNA-seq preparation, and proteome preparation for iTRAQ). AH performed the bisulfite-seq analysis, differential lncRNAs analysis, and run Epitensor. SB and RP-R performed the footprint analysis. SJ run the GEP enhancer predictor analysis. SC performed Diffreps and epigenetic relationship analysis with HiC datasets. JA-R and MP-E performed animal environmental enrichment procedures, breedings, and dissections. MM performed library preparations. MI carried out the splicing analysis. JP did the validation. MF effectuated the miRNA mapping. SA, MD, PM, CNH, and SO worked in the elaboration of the manuscript and funded the study. All authors contributed to the article and approved the submitted version.
Funding
We acknowledge support of the Spanish Ministry of Economy and Competitiveness (SAF2011-26216), “Centro de Excelencia Severo Ochoa 2017-2021,” SEV-2016-0571, the CERCA Programme/Generalitat de Catalunya and Jerome Lejeune Foundation, Swiss National Science Foundation Fellowship (PBLAP3_136878) and Co-funded by Marie Curie Actions to CNH. Resources for analyses conducted by SE-G were partially supported by the U.S. National Institutes of Mental Health Funds R01MH104341 and R01MH117790 and by the Social Sciences and Humanities Research Council of Canada (NFRFE-2018-01305). We acknowledge support of the Spanish Ministry of Science and Innovation to the EMBL partnership, Agencia Estatal de Investigaci n (PID2019-110755RB-I00/AEI / 10.13039/501100011033), the European Union’s Horizon 2020 Research and Innovation programme under grant agreement No 848077, Jerôme Lejeune Foundation, NIH (Grant Number: 1R01EB 028159-01), Marató TV3 (#2016/20-30). RP-R resources were supported by R01GM109215. We thank the support of the University of Tübingen for the Open Access Publication Funds contribution.
Conflict of Interest
The authors declare that the research was conducted in the absence of any commercial or financial relationships that could be construed as a potential conflict of interest.
Acknowledgments
Special thanks to the “Centre for Genomic Regulation Core Facilities”: Irene González Navarrete, María Angustias Aguilar Morón, Anna Menoyo Vilalta, Núria Andreu Somavilla, and Jochen Hecht from the Genomics Facility and Òscar Fornas, Eva Julià Arteaga, Erika Ramírez Bautista, and Alexandre Bote Tronchoni from the CRG FAC-sorting Unit. Also, we would like to thank to Domenica Marchese for helping with microRNA validation and Jekaterina Kokatjuhha and Mattia Bosio for their computational help support.
Supplementary Material
The Supplementary Material for this article can be found online at: https://www.frontiersin.org/articles/10.3389/fnmol.2021.664912/full#supplementary-material
Footnotes
- ^ www.tdx.cat/handle/10803/124485#page=1
- ^ https://github.com/ShaluJhanwar/GEP
- ^ http://chromosome.sdsc.edu/mouse/hi-c/download.html
- ^ https://github.com/ophiothrix/enhancer.annotator
- ^ http://broadinstitute.github.io/picard
- ^ https://github.com/PavlidisLab/markerGeneProfile
- ^ https://github.com/sespesogil/automat_chrom3D
- ^ https://github.com/sespesogil/automat_chrom3D_colors
References
Auerbach, R. K., Euskirchen, G., Rozowsky, J., Lamarre-Vincent, N., Moqtaderi, Z., Lefrançois, P., et al. (2009). Mapping accessible chromatin regions using Sono-Seq. Proc. Natl. Acad. Sci. U.S.A. 106, 14926–14931. doi: 10.1073/pnas.0905443106
Ball, N. J., Mercado, E., and Orduña, I. (2019). Enriched environments as a potential treatment for developmental disorders: a critical assessment. Front. Psychol. 10:466. doi: 10.3389/fpsyg.2019.00466
Beagan, J. A., Pastuzyn, E. D., Fernandez, L. R., Guo, M. H., Feng, K., Titus, K. R., et al. (2020). Three-dimensional genome restructuring across timescales of activity-induced neuronal gene expression. Nat. Neurosci. 23, 707–717. doi: 10.1038/s41593-020-0634-6
Benjamini, Y., and Hochberg, Y. (1995). Controlling the false discovery rate: a practical and powerful approach to multiple testing. J. R. Stat. Soc. Ser. B 57, 289–300. doi: 10.2307/2346101
Berardo, L. R., Fabio, M. C., and Pautassi, R. M. (2016). Post-weaning environmental enrichment, but not chronic maternal isolation, enhanced ethanol intake during periadolescence and early adulthood. Front. Behav. Neurosci. 10:195. doi: 10.3389/fnbeh.2016.00195
Betke, K. M., Wells, C. A., and Hamm, H. E. (2012). GPCR mediated regulation of synaptic transmission. Prog. Neurobiol. 96, 304–321. doi: 10.1016/j.pneurobio.2012.01.009
Bikbaev, A., Frischknecht, R., and Heine, M. (2015). Brain extracellular matrix retains connectivity in neuronal networks. Sci. Rep. 5:14527. doi: 10.1038/srep14527
Bindea, G., Mlecnik, B., Hackl, H., Charoentong, P., Tosolini, M., Kirilovsky, A., et al. (2009). ClueGO: a Cytoscape plug-in to decipher functionally grouped gene ontology and pathway annotation networks. Bioinformatics 25, 1091–1093. doi: 10.1093/bioinformatics/btp101
Bond, A. M., Bhalala, O. G., and Kessler, J. A. (2012). The dynamic role of bone morphogenetic proteins in neural stem cell fate and maturation. Dev. Neurobiol. 72, 1068–1084. doi: 10.1002/dneu.22022
Boyle, A. P., Guinney, J., Crawford, G. E., and Furey, T. S. (2008). F-Seq: a feature density estimator for high-throughput sequence tags. Bioinformatics 24, 2537–2538. doi: 10.1093/bioinformatics/btn480
Brooks, E., and Canal, M. M. (2013). Development of circadian rhythms: role of postnatal light environment. Neurosci. Biobehav. Rev. 37, 551–560. doi: 10.1016/j.neubiorev.2013.02.012
Buenrostro, J. D., Giresi, P. G., Zaba, L. C., Chang, H. Y., and Greenleaf, W. J. (2013). Transposition of native chromatin for fast and sensitive epigenomic profiling of open chromatin, DNA-binding proteins and nucleosome position. Nat. Methods 10, 1213–1218. doi: 10.1038/nmeth.2688
Chen, C., Ridzon, D. A., Broomer, A. J., Zhou, Z., Lee, D. H., Nguyen, J. T., et al. (2005). Real-time quantification of microRNAs by stem-loop RT-PCR. Nucleic Acids Res. 33:e179. doi: 10.1093/nar/gni178
Chen, Y.-J. J., Johnson, M. A., Lieberman, M. D., Goodchild, R. E., Schobel, S., Lewandowski, N., et al. (2008). Type III neuregulin-1 is required for normal sensorimotor gating, memory-related behaviors, and corticostriatal circuit components. J. Neurosci. 28, 6872–6883. doi: 10.1523/JNEUROSCI.1815-08.2008
Chowdhury, S., Shepherd, J. D., Okuno, H., Lyford, G., Petralia, R. S., Plath, N., et al. (2006). Arc/Arg3.1 interacts with the endocytic machinery to regulate AMPA receptor trafficking. Neuron 52, 445–459. doi: 10.1016/j.neuron.2006.08.033
Clemenson, G. D., Deng, W., and Gage, F. H. (2015). Environmental enrichment and neurogenesis: from mice to humans. Curr. Opin. Behav. Sci. 4, 56–62. doi: 10.1016/j.cobeha.2015.02.005
Coffey, E. T. (2014). Nuclear and cytosolic JNK signalling in neurons. Nat. Rev. Neurosci. 15, 285–299. doi: 10.1038/nrn3729
DaSilva, L. L. P., Wall, M. J., de Almeida, L. P., Wauters, S. C., Januário, Y. C., Müller, J., et al. (2016). Activity-regulated cytoskeleton-associated protein controls AMPAR endocytosis through a direct interaction with clathrin-adaptor protein 2. eNeuro 3, 125–140. doi: 10.1523/ENEURO.0144-15.2016
Dixon, J. R., Selvaraj, S., Yue, F., Kim, A., Li, Y., Shen, Y., et al. (2012). Topological domains in mammalian genomes identified by analysis of chromatin interactions. Nature 485, 376–380. doi: 10.1038/nature11082
Dobin, A., Davis, C. A., Schlesinger, F., Drenkow, J., Zaleski, C., Jha, S., et al. (2013). STAR: ultrafast universal RNA-seq aligner. Bioinformatics 29, 15–21. doi: 10.1093/bioinformatics/bts635
Durand, N. C., Robinson, J. T., Shamim, M. S., Machol, I., Mesirov, J. P., Lander, E. S., et al. (2016a). Juicebox provides a visualization system for Hi-C contact maps with unlimited zoom. Cell Syst. 3, 99–101. doi: 10.1016/j.cels.2015.07.012
Durand, N. C., Shamim, M. S., Machol, I., Rao, S. S. P., Huntley, M. H., Lander, E. S., et al. (2016b). Juicer provides a one-click system for analyzing loop-resolution Hi-C experiments. Cell Syst. 3, 95–98. doi: 10.1016/j.cels.2016.07.002
Edbauer, D., Neilson, J. R., Foster, K. A., Wang, C.-F., Seeburg, D. P., Batterton, M. N., et al. (2010). Regulation of synaptic structure and function by FMRP-associated microRNAs miR-125b and miR-132. Neuron 65, 373–384. doi: 10.1016/j.neuron.2010.01.005
Faraji, J., Karimi, M., Soltanpour, N., Moharrerie, A., Rouhzadeh, Z., Lotfi, H., et al. (2018). Oxytocin-mediated social enrichment promotes longer telomeres and novelty seeking. Elife 7:e40262. doi: 10.7554/eLife.40262
Fernandez-Albert, J., Lipinski, M., Lopez-Cascales, M. T., Rowley, M. J., Martin-Gonzalez, A. M., del Blanco, B., et al. (2019). Immediate and deferred epigenomic signature of neuronal activation. bioRxiv [Preprint]. doi: 10.1101/534115
Ferrer-Ferrer, M., and Dityatev, A. (2018). Shaping synapses by the neural extracellular matrix. Front. Neuroanat. 12:40. doi: 10.3389/fnana.2018.00040
Friedman, Y., Naamati, G., and Linial, M. (2010). MiRror: a combinatorial analysis web tool for ensembles of microRNAs and their targets. Bioinformatics 26, 1920–1921. doi: 10.1093/bioinformatics/btq298
Fu, S., Wang, Q., Moore, J. E., Purcaro, M. J., Pratt, H. E., Fan, K., et al. (2018). Differential analysis of chromatin accessibility and histone modifications for predicting mouse developmental enhancers. Nucleic Acids Res. 46, 11184–11201. doi: 10.1093/nar/gky753
Grégoire, C.-A., Tobin, S., Goldenstein, B. L., Samarut, É, Leclerc, A., Aumont, A., et al. (2018). RNA-sequencing reveals unique transcriptional signatures of running and running-independent environmental enrichment in the adult mouse dentate gyrus. Front. Mol. Neurosci. 11:126. doi: 10.3389/fnmol.2018.00126
Guo, Y., Xu, Q., Canzio, D., Shou, J., Li, J., Gorkin, D. U., et al. (2015). CRISPR inversion of CTCF sites alters genome topology and enhancer/promoter function. Cell 162, 900–910. doi: 10.1016/j.cell.2015.07.038
Hansen, K. D., Langmead, B., and Irizarry, R. A. (2012). BSmooth: from whole genome bisulfite sequencing reads to differentially methylated regions. Genome Biol. 13:R83. doi: 10.1186/gb-2012-13-10-r83
He, C. W., Liao, C. P., and Pan, C. L. (2018). Wnt signalling in the development of axon, dendrites and synapses. Open Biol. 8:180116. doi: 10.1098/rsob.180116
Heun-Johnson, H., and Levitt, P. (2018). Differential impact of Met receptor gene interaction with early-life stress on neuronal morphology and behavior in mice. Neurobiol. Stress 8, 10–20. doi: 10.1016/j.ynstr.2017.11.003
Hu, Y.-S., Long, N., Pigino, G., Brady, S. T., and Lazarov, O. (2013). Molecular mechanisms of environmental enrichment: impairments in Akt/GSK3β, neurotrophin-3 and CREB signaling. PLoS One 8:e64460. doi: 10.1371/journal.pone.0064460
Hübener, M., and Bonhoeffer, T. (2014). Neuronal plasticity: beyond the critical period. Cell 159, 727–737. doi: 10.1016/j.cell.2014.10.035
Huff, J. T., Plocik, A. M., Guthrie, C., and Yamamoto, K. R. (2010). Reciprocal intronic and exonic histone modification regions in humans. Nat. Struct. Mol. Biol. 17, 1495–1499. doi: 10.1038/nsmb.1924
Irier, H., Street, R. C., Dave, R., Lin, L., Cai, C., Davis, T. H., et al. (2014). Environmental enrichment modulates 5-hydroxymethylcytosine dynamics in hippocampus. Genomics 104, 376–382. doi: 10.1016/j.ygeno.2014.08.019
Irimia, M., Weatheritt, R. J., Ellis, J. D., Parikshak, N. N., Gonatopoulos-Pournatzis, T., Babor, M., et al. (2014). A highly conserved program of neuronal microexons is misregulated in autistic brains. Cell 159, 1511–1523. doi: 10.1016/J.CELL.2014.11.035
Jhanwar, S., Ossowski, S., and Davila-Velderrain, J. (2018). Genome-wide active enhancer identification using cell type-specific signatures of epigenomic activity. bioRxiv [Preprint]. doi: 10.1101/421230
Jiang, Y., Matevossian, A., Huang, H.-S., Straubhaar, J., and Akbarian, S. (2008). Isolation of neuronal chromatin from brain tissue. BMC Neurosci. 9:42. doi: 10.1186/1471-2202-9-42
Kao, W. T., Wang, Y., Kleinman, J. E., Lipska, B. K., Hyde, T. M., Weinberger, D. R., et al. (2010). Common genetic variation in neuregulin 3 (NRG3) influences risk for schizophrenia and impacts NRG3 expression in human brain. Proc. Natl. Acad. Sci. U.S.A. 107, 15619–15624. doi: 10.1073/pnas.1005410107
Karlić, R., Chung, H. R., Lasserre, J., Vlahoviček, K., and Vingron, M. (2010). Histone modification levels are predictive for gene expression. Proc. Natl. Acad. Sci. U.S.A. 107, 2926–2931. doi: 10.1073/pnas.0909344107
Kasnauskiene, J., Ciuladaite, Z., Preiksaitiene, E., Matulevičiene, A., Alexandrou, A., Koumbaris, G., et al. (2012). A single gene deletion on 4q28.3: PCDH18 – a new candidate gene for intellectual disability? Eur. J. Med. Genet. 55, 274–277. doi: 10.1016/j.ejmg.2012.02.010
Kempermann, G. (2019). Environmental enrichment, new neurons and the neurobiology of individuality. Nat. Rev. Neurosci. 20, 235–245. doi: 10.1038/s41583-019-0120-x
Khan, A., Fornes, O., Stigliani, A., Gheorghe, M., Castro-Mondragon, J. A., van der Lee, R., et al. (2018). JASPAR 2018: update of the open-access database of transcription factor binding profiles and its web framework. Nucleic Acids Res. 46, D260–D266. doi: 10.1093/nar/gkx1126
Kim, S., Yu, N. K., and Kaang, B.-K. (2015). CTCF as a multifunctional protein in genome regulation and gene expression. Exp. Mol. Med. 47:e166. doi: 10.1038/emm.2015.33
Kim, S., Yu, N. K., Shim, K. W., Kim, J. I., Kim, H., Han, D. H., et al. (2018). Remote memory and cortical synaptic plasticity require neuronal CCCTC-binding factor (CTCF). J. Neurosci. 38, 5042–5052. doi: 10.1523/JNEUROSCI.2738-17.2018
Kim, T. K., Hemberg, M., Gray, J. M., Costa, A. M., Bear, D. M., Wu, J., et al. (2010). Widespread transcription at neuronal activity-regulated enhancers. Nature 465, 182–187. doi: 10.1038/nature09033
Klemm, S. L., Shipony, Z., and Greenleaf, W. J. (2019). Chromatin accessibility and the regulatory epigenome. Nat. Rev. Genet. 20, 207–220. doi: 10.1038/s41576-018-0089-8
Koberstein, J. N., Poplawski, S. G., Wimmer, M. E., Porcari, G., Kao, C., Gomes, B., et al. (2018). Learning-dependent chromatin remodeling highlights noncoding regulatory regions linked to autism. Sci. Signal. 11:eaan6500. doi: 10.1126/scisignal.aan6500
Koopmans, F., van Nierop, P., Andres-Alonso, M., Byrnes, A., Cijsouw, T., Coba, M. P., et al. (2019). SynGO: an evidence-based, expert-curated knowledge base for the synapse. Neuron 103, 217–234.e4. doi: 10.1016/j.neuron.2019.05.002
Krueger, F., and Andrews, S. R. (2011). Bismark: a flexible aligner and methylation caller for Bisulfite-Seq applications. Bioinformatics 27, 1571–1572. doi: 10.1093/bioinformatics/btr167
Langmead, B., Trapnell, C., Pop, M., and Salzberg, S. L. (2009). Ultrafast and memory-efficient alignment of short DNA sequences to the human genome. Genome Biol. 10:R25. doi: 10.1186/gb-2009-10-3-r25
Law, C. W., Chen, Y., Shi, W., and Smyth, G. K. (2014). voom: precision weights unlock linear model analysis tools for RNA-seq read counts. Genome Biol. 15:R29. doi: 10.1186/gb-2014-15-2-r29
Li, H., and Durbin, R. (2010). Fast and accurate long-read alignment with Burrows–Wheeler transform. Bioinformatics 26, 589–595. doi: 10.1093/bioinformatics/btp698
Li, Q., Brown, J. B., Huang, H., and Bickel, P. J. (2011). Measuring reproducibility of high-throughput experiments. Ann. Appl. Stat. 5, 1752–1779. doi: 10.1214/11-AOAS466
Liao, Y., Smyth, G. K., and Shi, W. (2013). The subread aligner: fast, accurate and scalable read mapping by seed-and-vote. Nucleic Acids Res. 41:e108. doi: 10.1093/nar/gkt214
Liao, Y., Smyth, G. K., and Shi, W. (2014). featureCounts: an efficient general purpose program for assigning sequence reads to genomic features. Bioinformatics 30, 923–930. doi: 10.1093/bioinformatics/btt656
Lichti, C. F., Fan, X., English, R. D., Zhang, Y., Li, D., Kong, F., et al. (2014). Environmental enrichment alters protein expression as well as the proteomic response to cocaine in rat nucleus accumbens. Front. Behav. Neurosci. 8:246. doi: 10.3389/fnbeh.2014.00246
Lieberman-Aiden, E., van Berkum, N. L., Williams, L., Imakaev, M., Ragoczy, T., Telling, A., et al. (2009). Comprehensive mapping of long-range interactions reveals folding principles of the human genome. Science 326, 289–293. doi: 10.1126/science.1181369
Lüscher, C., and Malenka, R. C. (2012). NMDA receptor-dependent long-term potentiation and long-term depression (LTP/LTD). Cold Spring Harb. Perspect. Biol. 4:a005710. doi: 10.1101/cshperspect.a005710
Maass, P. G., Barutcu, A. R., and Rinn, J. L. (2019). Interchromosomal interactions: a genomic love story of kissing chromosomes. J. Cell Biol. 218, 27–38. doi: 10.1083/jcb.201806052
Maher, M. P., Wu, N., Ravula, S., Ameriks, M. K., Savall, B. M., Liu, C., et al. (2016). Discovery and characterization of AMPA receptor modulators selective for TARP-γ8. J. Pharmacol. Exp. Ther. 357, 394–414. doi: 10.1124/jpet.115.231712
Mancarci, B. O., Toker, L., Tripathy, S. J., Li, B., Rocco, B., Sibille, E., et al. (2017). Cross-laboratory analysis of brain cell type transcriptomes with applications to interpretation of bulk tissue data. eNeuro 4:ENEURO.0212-17.2017. doi: 10.1523/ENEURO.0212-17.2017
Marco-Sola, S., Sammeth, M., Guigó, R., and Ribeca, P. (2012). The GEM mapper: fast, accurate and versatile alignment by filtration. Nat. Methods 9, 1185–1188. doi: 10.1038/nmeth.2221
Martínez-Cué, C., Baamonde, C., Lumbreras, M., Paz, J., Davisson, M. T., Schmidt, C., et al. (2002). Differential effects of environmental enrichment on behavior and learning of male and female Ts65Dn mice, a model for Down syndrome. Behav. Brain Res. 134, 185–200. doi: 10.1016/S0166-4328(02)00026-8
Martino, A., Ettorre, M., Musilli, M., Lorenzetto, E., Buffelli, M., and Diana, G. (2013). Rho GTPase-dependent plasticity of dendritic spines in the adult brain. Front. Cell. Neurosci. 7:62. doi: 10.3389/fncel.2013.00062
McDonald, M. W., Hayward, K. S., Rosbergen, I. C. M., Jeffers, M. S., and Corbett, D. (2018). Is environmental enrichment ready for clinical application in human post-stroke rehabilitation? Front. Behav. Neurosci. 12:135. doi: 10.3389/fnbeh.2018.00135
Monahan, K., Horta, A., and Lomvardas, S. (2019). LHX2- and LDB1-mediated trans interactions regulate olfactory receptor choice. Nature 565, 448–453. doi: 10.1038/s41586-018-0845-0
Morse, S., Butler, A., Davis, R., Soller, I., and Lubin, F. (2015). Environmental enrichment reverses histone methylation changes in the aged hippocampus and restores age-related memory deficits. Biology (Basel) 4, 298–313. doi: 10.3390/biology4020298
Mulligan, M. K., Abreo, T., Neuner, S. M., Parks, C., Watkins, C. E., Houseal, M. T., et al. (2019). Identification of a functional non-coding variant in the GABAA receptor α2 subunit of the C57BL/6J mouse reference genome: major implications for neuroscience research. Front. Genet. 10:188. doi: 10.3389/fgene.2019.00188
Ohline, S. M., and Abraham, W. C. (2019). Environmental enrichment effects on synaptic and cellular physiology of hippocampal neurons. Neuropharmacology 145(Pt A), 3–12. doi: 10.1016/j.neuropharm.2018.04.007
Pantano, L., Estivill, X., and Martí, E. (2010). SeqBuster, a bioinformatic tool for the processing and analysis of small RNAs datasets, reveals ubiquitous miRNA modifications in human embryonic cells. Nucleic Acids Res. 38:e34. doi: 10.1093/nar/gkp1127
Paraskevopoulou, M. D., Vlachos, I. S., Karagkouni, D., Georgakilas, G., Kanellos, I., Vergoulis, T., et al. (2016). DIANA-LncBase v2: indexing microRNA targets on non-coding transcripts. Nucleic Acids Res. 44, D231–D238. doi: 10.1093/nar/gkv1270
Paulsen, J., Sekelja, M., Oldenburg, A. R., Barateau, A., Briand, N., Delbarre, E., et al. (2017). Chrom3D: three-dimensional genome modeling from Hi-C and nuclear lamin-genome contacts. Genome Biol. 18:21. doi: 10.1186/s13059-016-1146-2
Peter, M., Aschauer, D. F., Pandolfo, R. V., Sinning, A., Grössl, F., Kargl, D., et al. (2020). Rapid nucleus-scale reorganization of chromatin in neurons enables transcriptional adaptation for memory consolidation. bioRxiv [Preprint]. doi: 10.1101/2020.12.03.409623
Pique-Regi, R., Degner, J. F., Pai, A. A., Gaffney, D. J., Gilad, Y., and Pritchard, J. K. (2011). Accurate inference of transcription factor binding from DNA sequence and chromatin accessibility data. Genome Res. 21, 447–455. doi: 10.1101/gr.112623.110
Pons-Espinal, M., Martinez de Lagran, M., and Dierssen, M. (2013). Environmental enrichment rescues DYRK1A activity and hippocampal adult neurogenesis in TgDyrk1A. Neurobiol. Dis. 60, 18–31. doi: 10.1016/j.nbd.2013.08.008
Pu, M., Ni, Z., Wang, M., Wang, X., Wood, J. G., Helfand, S. L., et al. (2015). Trimethylation of Lys36 on H3 restricts gene expression change during aging and impacts life span. Genes Dev. 29, 718–731. doi: 10.1101/gad.254144.114
Quinodoz, S. A., Ollikainen, N., Tabak, B., Palla, A., Schmidt, J. M., Detmar, E., et al. (2018). Higher-order inter-chromosomal hubs shape 3D genome organization in the nucleus. Cell 174, 744–757.e24. doi: 10.1016/j.cell.2018.05.024
Rajarajan, P., Borrman, T., Liao, W., Espeso-Gil, S., Chandrasekaran, S., Jiang, Y., et al. (2019). Spatial genome exploration in the context of cognitive and neurological disease. Curr. Opin. Neurobiol. 59, 112–119. doi: 10.1016/j.conb.2019.05.007
Ramírez, F., Ryan, D. P., Grüning, B., Bhardwaj, V., Kilpert, F., Richter, A. S., et al. (2016). deepTools2: a next generation web server for deep-sequencing data analysis. Nucleic Acids Res. 44, W160–W165. doi: 10.1093/nar/gkw257
Rao, S. S. P., Huntley, M. H., Durand, N. C., Stamenova, E. K., Bochkov, I. D., Robinson, J. T., et al. (2014). A 3D map of the human genome at kilobase resolution reveals principles of chromatin looping. Cell 159, 1665–1680. doi: 10.1016/j.cell.2014.11.021
Rinaldi, L., Datta, D., Serrat, J., Morey, L., Solanas, G., Avgustinova, A., et al. (2016). Dnmt3a and Dnmt3b associate with enhancers to regulate human epidermal stem cell homeostasis. Cell Stem Cell 19, 491–501. doi: 10.1016/j.stem.2016.06.020
Risso, D., Ngai, J., Speed, T. P., and Dudoit, S. (2014). Normalization of RNA-seq data using factor analysis of control genes or samples. Nat. Biotechnol. 32, 896–902. doi: 10.1038/nbt.2931
Robinson, M. D., McCarthy, D. J., and Smyth, G. K. (2010). edgeR: a Bioconductor package for differential expression analysis of digital gene expression data. Bioinformatics 26, 139–140. doi: 10.1093/bioinformatics/btp616
Ronowska, A., Szutowicz, A., Bielarczyk, H., Gul-Hinc, S., Klimaszewska-Łata, J., Dyś, A., et al. (2018). The regulatory effects of Acetyl-CoA distribution in the healthy and diseased brain. Front. Cell. Neurosci. 12:169. doi: 10.3389/fncel.2018.00169
Ross-Innes, C. S., Stark, R., Teschendorff, A. E., Holmes, K. A., Ali, H. R., Dunning, M. J., et al. (2012). Differential oestrogen receptor binding is associated with clinical outcome in breast cancer. Nature 481, 389–393. doi: 10.1038/nature10730
Rountree-Harrison, D., Burton, T. J., Leamey, C. A., and Sawatari, A. (2018). Environmental enrichment expedites acquisition and improves flexibility on a temporal sequencing task in mice. Front. Behav. Neurosci. 12:51. doi: 10.3389/fnbeh.2018.00051
Sadakata, T., Washida, M., Iwayama, Y., Shoji, S., Sato, Y., Ohkura, T., et al. (2007). Autistic-like phenotypes in Cadps2-knockout mice and aberrant CADPS2 splicing in autistic patients. J. Clin. Invest. 117, 931–943. doi: 10.1172/JCI29031
Sams, D. S., Nardone, S., Getselter, D., Raz, D., Tal, M., Rayi, P. R., et al. (2016). Neuronal CTCF is necessary for basal and experience-dependent gene regulation, memory formation, and genomic structure of BDNF and Arc. Cell Rep. 17, 2418–2430. doi: 10.1016/j.celrep.2016.11.004
Schmittgen, T. D., and Livak, K. J. (2008). Analyzing real-time PCR data by the comparative CT method. Nat. Protoc. 3, 1101–1108. doi: 10.1038/nprot.2008.73
Servant, N., Varoquaux, N., Lajoie, B. R., Viara, E., Chen, C.-J., Vert, J.-P., et al. (2015). HiC-Pro: an optimized and flexible pipeline for Hi-C data processing. Genome Biol. 16:259. doi: 10.1186/s13059-015-0831-x
Shen, L., Shao, N.-Y., Liu, X., Maze, I., Feng, J., and Nestler, E. J. (2013). diffReps: detecting differential chromatin modification sites from ChIP-seq data with biological replicates. PLoS One 8:e65598. doi: 10.1371/journal.pone.0065598
Shepherd, J. D., Rumbaugh, G., Wu, J., Chowdhury, S., Plath, N., Kuhl, D., et al. (2006). Arc/Arg3.1 mediates homeostatic synaptic scaling of AMPA receptors. Neuron 52, 475–484. doi: 10.1016/j.neuron.2006.08.034
Smagin, D. A., Galyamina, A. G., Kovalenko, I. L., Babenko, V. N., and Kudryavtseva, N. N. (2018). Aberrant expression of collagen family genes in the brain regions developing under agonistic interactions in male mice. bioRxiv [Preprint], 1–20. doi: 10.1101/276063
Smyth, G. K. (2004). Linear models and empirical bayes methods for assessing differential expression in microarray experiments. Stat. Appl. Genet. Mol. Biol. 3, 1–25. doi: 10.2202/1544-6115.1027
Sparling, J. E., Barbeau, K., Boileau, K., and Konkle, A. T. M. (2020). Environmental enrichment and its influence on rodent offspring and maternal behaviours, a scoping style review of indices of depression and anxiety. Pharmacol. Biochem. Behav. 197:172997. doi: 10.1016/j.pbb.2020.172997
Speisman, R. B., Kumar, A., Rani, A., Pastoriza, J. M., Severance, J. E., Foster, T. C., et al. (2013). Environmental enrichment restores neurogenesis and rapid acquisition in aged rats. Neurobiol. Aging 34, 263–274. doi: 10.1016/j.neurobiolaging.2012.05.023
Stephan, A. H., Barres, B. A., and Stevens, B. (2012). The complement system: an unexpected role in synaptic pruning during development and disease. Annu. Rev. Neurosci. 35, 369–389. doi: 10.1146/annurev-neuro-061010-113810
Stevenson, J. R., McMahon, E. K., Boner, W., and Haussmann, M. F. (2019). Oxytocin administration prevents cellular aging caused by social isolation. Psychoneuroendocrinology 103, 52–60. doi: 10.1016/j.psyneuen.2019.01.006
Su, Y., Shin, J., Zhong, C., Wang, S., Roychowdhury, P., Lim, J., et al. (2017). Neuronal activity modifies the chromatin accessibility landscape in the adult brain. Nat. Neurosci. 20, 476–483. doi: 10.1038/nn.4494
Sztainberg, Y., and Chen, A. (2010). An environmental enrichment model for mice. Nat. Protoc. 5, 1535–1539. doi: 10.1038/nprot.2010.114
Tan, M. C., Widagdo, J., Chau, Y. Q., Zhu, T., Wong, J. J.-L., Cheung, A., et al. (2017). The activity-induced long non-coding RNA Meg3 modulates AMPA receptor surface expression in primary cortical neurons. Front. Cell. Neurosci. 11:124. doi: 10.3389/fncel.2017.00124
Tapial, J., Ha, K. C. H., Sterne-Weiler, T., Gohr, A., Braunschweig, U., Hermoso-Pulido, A., et al. (2017). An atlas of alternative splicing profiles and functional associations reveals new regulatory programs and genes that simultaneously express multiple major isoforms. Genome Res. 27, 1759–1768. doi: 10.1101/gr.220962.117
Tsai, L.-C. L., Chan, G. C.-K., Nangle, S. N., Shimizu-Albergine, M., Jones, G. L., Storm, D. R., et al. (2012). Inactivation of Pde8b enhances memory, motor performance, and protects against age-induced motor coordination decay. Genes Brain Behav. 11, 837–847. doi: 10.1111/j.1601-183X.2012.00836.x
Turrigiano, G. G. (2008). The self-tuning neuron: synaptic scaling of excitatory synapses. Cell 135, 422–435. doi: 10.1016/j.cell.2008.10.008
van Praag, H., Kempermann, G., and Gage, F. H. (2000). Neural consequences of enviromental enrichment. Nat. Rev. Neurosci. 1, 191–198. doi: 10.1038/35044558
Wassouf, Z., Hentrich, T., Samer, S., Rotermund, C., Kahle, P. J., Ehrlich, I., et al. (2018). Environmental enrichment prevents transcriptional disturbances induced by alpha-synuclein overexpression. Front. Cell. Neurosci. 12:112. doi: 10.3389/fncel.2018.00112
Wright, J. W., and Harding, J. W. (2009). Contributions of matrix metalloproteinases to neural plasticity, habituation, associative learning and drug addiction. Neural Plast. 2009:579382. doi: 10.1155/2009/579382
Xu, J., de Winter, F., Farrokhi, C., Rockenstein, E., Mante, M., Adame, A., et al. (2016). Neuregulin 1 improves cognitive deficits and neuropathology in an Alzheimer’s disease model. Sci. Rep. 6:31692. doi: 10.1038/srep31692
Yamada, T., Yang, Y., Valnegri, P., Juric, I., Abnousi, A., Markwalter, K. H., et al. (2019). Sensory experience remodels genome architecture in neural circuit to drive motor learning. Nature 569, 708–713. doi: 10.1038/s41586-019-1190-7
Yang, R., Walder-Christensen, K. K., Kim, N., Wu, D., Lorenzo, D. N., Badea, A., et al. (2019). ANK2 autism mutation targeting giant ankyrin-B promotes axon branching and ectopic connectivity. Proc. Natl. Acad. Sci. U.S.A. 116, 15262–15271. doi: 10.1073/pnas.1904348116
Yu, K., Wu, Y., Zhang, Q., Xie, H., Liu, G., Guo, Z., et al. (2014). Enriched environment induces angiogenesis and improves neural function outcomes in rat stroke model. J. Neurol. Sci. 347, 275–280. doi: 10.1016/j.jns.2014.10.022
Yue, F., Cheng, Y., Breschi, A., Vierstra, J., Wu, W., Ryba, T., et al. (2014). A comparative encyclopedia of DNA elements in the mouse genome. Nature 515, 355–364. doi: 10.1038/nature13992
Zentner, G. E., Tesar, P. J., and Scacheri, P. C. (2011). Epigenetic signatures distinguish multiple classes of enhancers with distinct cellular functions. Genome Res. 21, 1273–1283. doi: 10.1101/gr.122382.111
Zhang, T., Zhang, Z., Dong, Q., Xiong, J., and Zhu, B. (2020). Histone H3K27 acetylation is dispensable for enhancer activity in mouse embryonic stem cells. Genome Biol. 21:45. doi: 10.1186/s13059-020-01957-w
Zhang, T.-Y., Keown, C. L., Wen, X., Li, J., Vousden, D. A., Anacker, C., et al. (2018). Environmental enrichment increases transcriptional and epigenetic differentiation between mouse dorsal and ventral dentate gyrus. Nat. Commun. 9:298. doi: 10.1038/s41467-017-02748-x
Zhang, Y., Kong, F., Crofton, E. J., Dragosljvich, S. N., Sinha, M., Li, D., et al. (2016). Transcriptomics of environmental enrichment reveals a role for retinoic acid signaling in addiction. Front. Mol. Neurosci. 9:119. doi: 10.3389/fnmol.2016.00119
Zhang, Y., Liu, T., Meyer, C. A., Eeckhoute, J., Johnson, D. S., Bernstein, B. E., et al. (2008). Model-based analysis of ChIP-Seq (MACS). Genome Biol. 9:R137. doi: 10.1186/gb-2008-9-9-r137
Zhou, Y., Zhou, B., Pache, L., Chang, M., Khodabakhshi, A. H., Tanaseichuk, O., et al. (2019). Metascape provides a biologist-oriented resource for the analysis of systems-level datasets. Nat. Commun. 10:1523. doi: 10.1038/s41467-019-09234-6
Keywords: environmental enrichment, epigenetics, 3D genome organization, learning, postnatal development, chromatin accessibility, Hi-C, inter-chromosomal contacts
Citation: Espeso-Gil S, Holik AZ, Bonnin S, Jhanwar S, Chandrasekaran S, Pique-Regi R, Albaigès-Ràfols J, Maher M, Permanyer J, Irimia M, Friedländer MR, Pons-Espinal M, Akbarian S, Dierssen M, Maass PG, Hor CN and Ossowski S (2021) Environmental Enrichment Induces Epigenomic and Genome Organization Changes Relevant for Cognition. Front. Mol. Neurosci. 14:664912. doi: 10.3389/fnmol.2021.664912
Received: 06 February 2021; Accepted: 09 April 2021;
Published: 05 May 2021.
Edited by:
Ildikó Rácz, University Hospital Bonn, GermanyReviewed by:
Eran A. Mukamel, University of California, San Diego, United StatesRicardo Marcos Pautassi, Medical Research Institute Mercedes and Martín Ferreyra (INIMEC), Argentina
Copyright © 2021 Espeso-Gil, Holik, Bonnin, Jhanwar, Chandrasekaran, Pique-Regi, Albaigès-Ràfols, Maher, Permanyer, Irimia, Friedländer, Pons-Espinal, Akbarian, Dierssen, Maass, Hor and Ossowski. This is an open-access article distributed under the terms of the Creative Commons Attribution License (CC BY). The use, distribution or reproduction in other forums is permitted, provided the original author(s) and the copyright owner(s) are credited and that the original publication in this journal is cited, in accordance with accepted academic practice. No use, distribution or reproduction is permitted which does not comply with these terms.
*Correspondence: Sergio Espeso-Gil, c2VyZ2lvLmVzcGVzby5naWxAZ21haWwuY29t; Charlotte N. Hor, Y2hhcmxvdHRlbmhvckBnbWFpbC5jb20=
†Present address: Michael Maher, Joseph Carreras Leukaemia Research Institute (IJC), Campus Can Ruti, Barcelona, Spain; Meritxell Pons-Espinal, Bellvitge Biomedical Research Institute (IDIBELL), Hospitalet de Llobregat, Barcelona, Spain; Charlotte N. Hor, Centre for Integrative Genomics, University of Lausanne, Lausanne, Switzerland; Stephan Ossowski, Institute of Medical Genetics and Applied Genomics, University of Tübingen, Tübingen, Germany
‡These authors have contributed equally to this work
$ORCID: Michael Maher, orcid.org/0000-0002-4956-7185