 Chunyang Wang
 Shiwei Liao2†
 Jing Xu
- 1Department of Neurology, Tianjin Medical University General Hospital, Tianjin, China
- 2Tianjin Key Laboratory of Cerebral Vascular and Neurodegenerative Diseases, Department of Neurorehabilitation and Neurology, Tianjin Huanhu Hospital, Tianjin Neurosurgical Institute, Tianjin, China
- 3Department of Neurology, Tianjin Haihe Hospital, Tianjin, China
Background: In the present study, we used a computational method to identify Guillain–Barré syndrome (GBS) related genes based on (i) a gene expression profile, and (ii) the shortest path analysis in a protein–protein interaction (PPI) network.
Materials and Methods: mRNA Microarray analyses were performed on the peripheral blood mononuclear cells (PBMCs) of four GBS patients and four age- and gender-matched healthy controls.
Results: Totally 30 GBS-related genes were screened out, in which 20 were retrieved from PPI analysis of upregulated expressed genes and 23 were from downregulated expressed genes (13 overlap genes). Gene ontology (GO) enrichment and KEGG enrichment analysis were performed, respectively. Results showed that there were some overlap GO terms and KEGG pathway terms in both upregulated and downregulated analysis, including positive regulation of macromolecule metabolic process, intracellular signaling cascade, cell surface receptor linked signal transduction, intracellular non-membrane-bounded organelle, non-membrane-bounded organelle, plasma membrane, ErbB signaling pathway, focal adhesion, neurotrophin signaling pathway and Wnt signaling pathway, which indicated these terms may play a critical role during GBS process.
Discussion: These results provided basic information about the genetic and molecular pathogenesis of GBS disease, which may improve the development of effective genetic strategies for GBS treatment in the future.
Background
As a result of damage to the peripheral nervous system, Guillain–Barré syndrome (GBS) is characterized by rapid-onset muscle weakness. The exact molecular mechanism and epigenetic feature of this disease are still unclear. Therefore, it is of great importance to identify GBS-related genes that could be used as a biomarker for early diagnosis and effective genetic strategies for clinical therapies.
In biomedicine and genomics, trying to identify the disease genes has become one of the most critical and challenging problems. Gene expression profiles can be used to select differentially expressed genes as disease genes. These methods are useful resources and have been widely used (Cai et al., 2010; Huang et al., 2010, 2011; Liu et al., 2010). However, it has not been well solved about the errors and false-positive problem in the high-throughput data (Li et al., 2012b). Thus, it is not a good idea to use only the gene expression profiles to identify novel genes.
According to the “guilt by association” rule, interacting proteins share the same or similar functions, which may participate in the same pathway. First proposed by Nabieva et al. (2005) disease-related genes could be identified from protein–protein interaction (PPI) networks based on existing PPI data. Methods based on the PPI data have been widely used for gene function predictions.
In the present study, we used a computational method to search GBS-related genes through integrating a gene expression profile and a weighted functional PPI network, which may improve the defect of using high-throughput data only. Previous studies also have successfully applied this integrating method for identifying novel genes in various diseases, for example, the influenza A/H7N9 virus infection (Zhang et al., 2014), colorectal cancer (Li et al., 2012b,2013a), lung cancer (Li et al., 2013b), HBV virus infection-related hepatocellular carcinoma (Jiang et al., 2013), retinoblastoma (Li et al., 2012c), etc.
Materials and Methods
Implementation
4273π: Bioinformatics Figure 1 showed the total procedure of our method. In the following sub-sections, details are as follows:
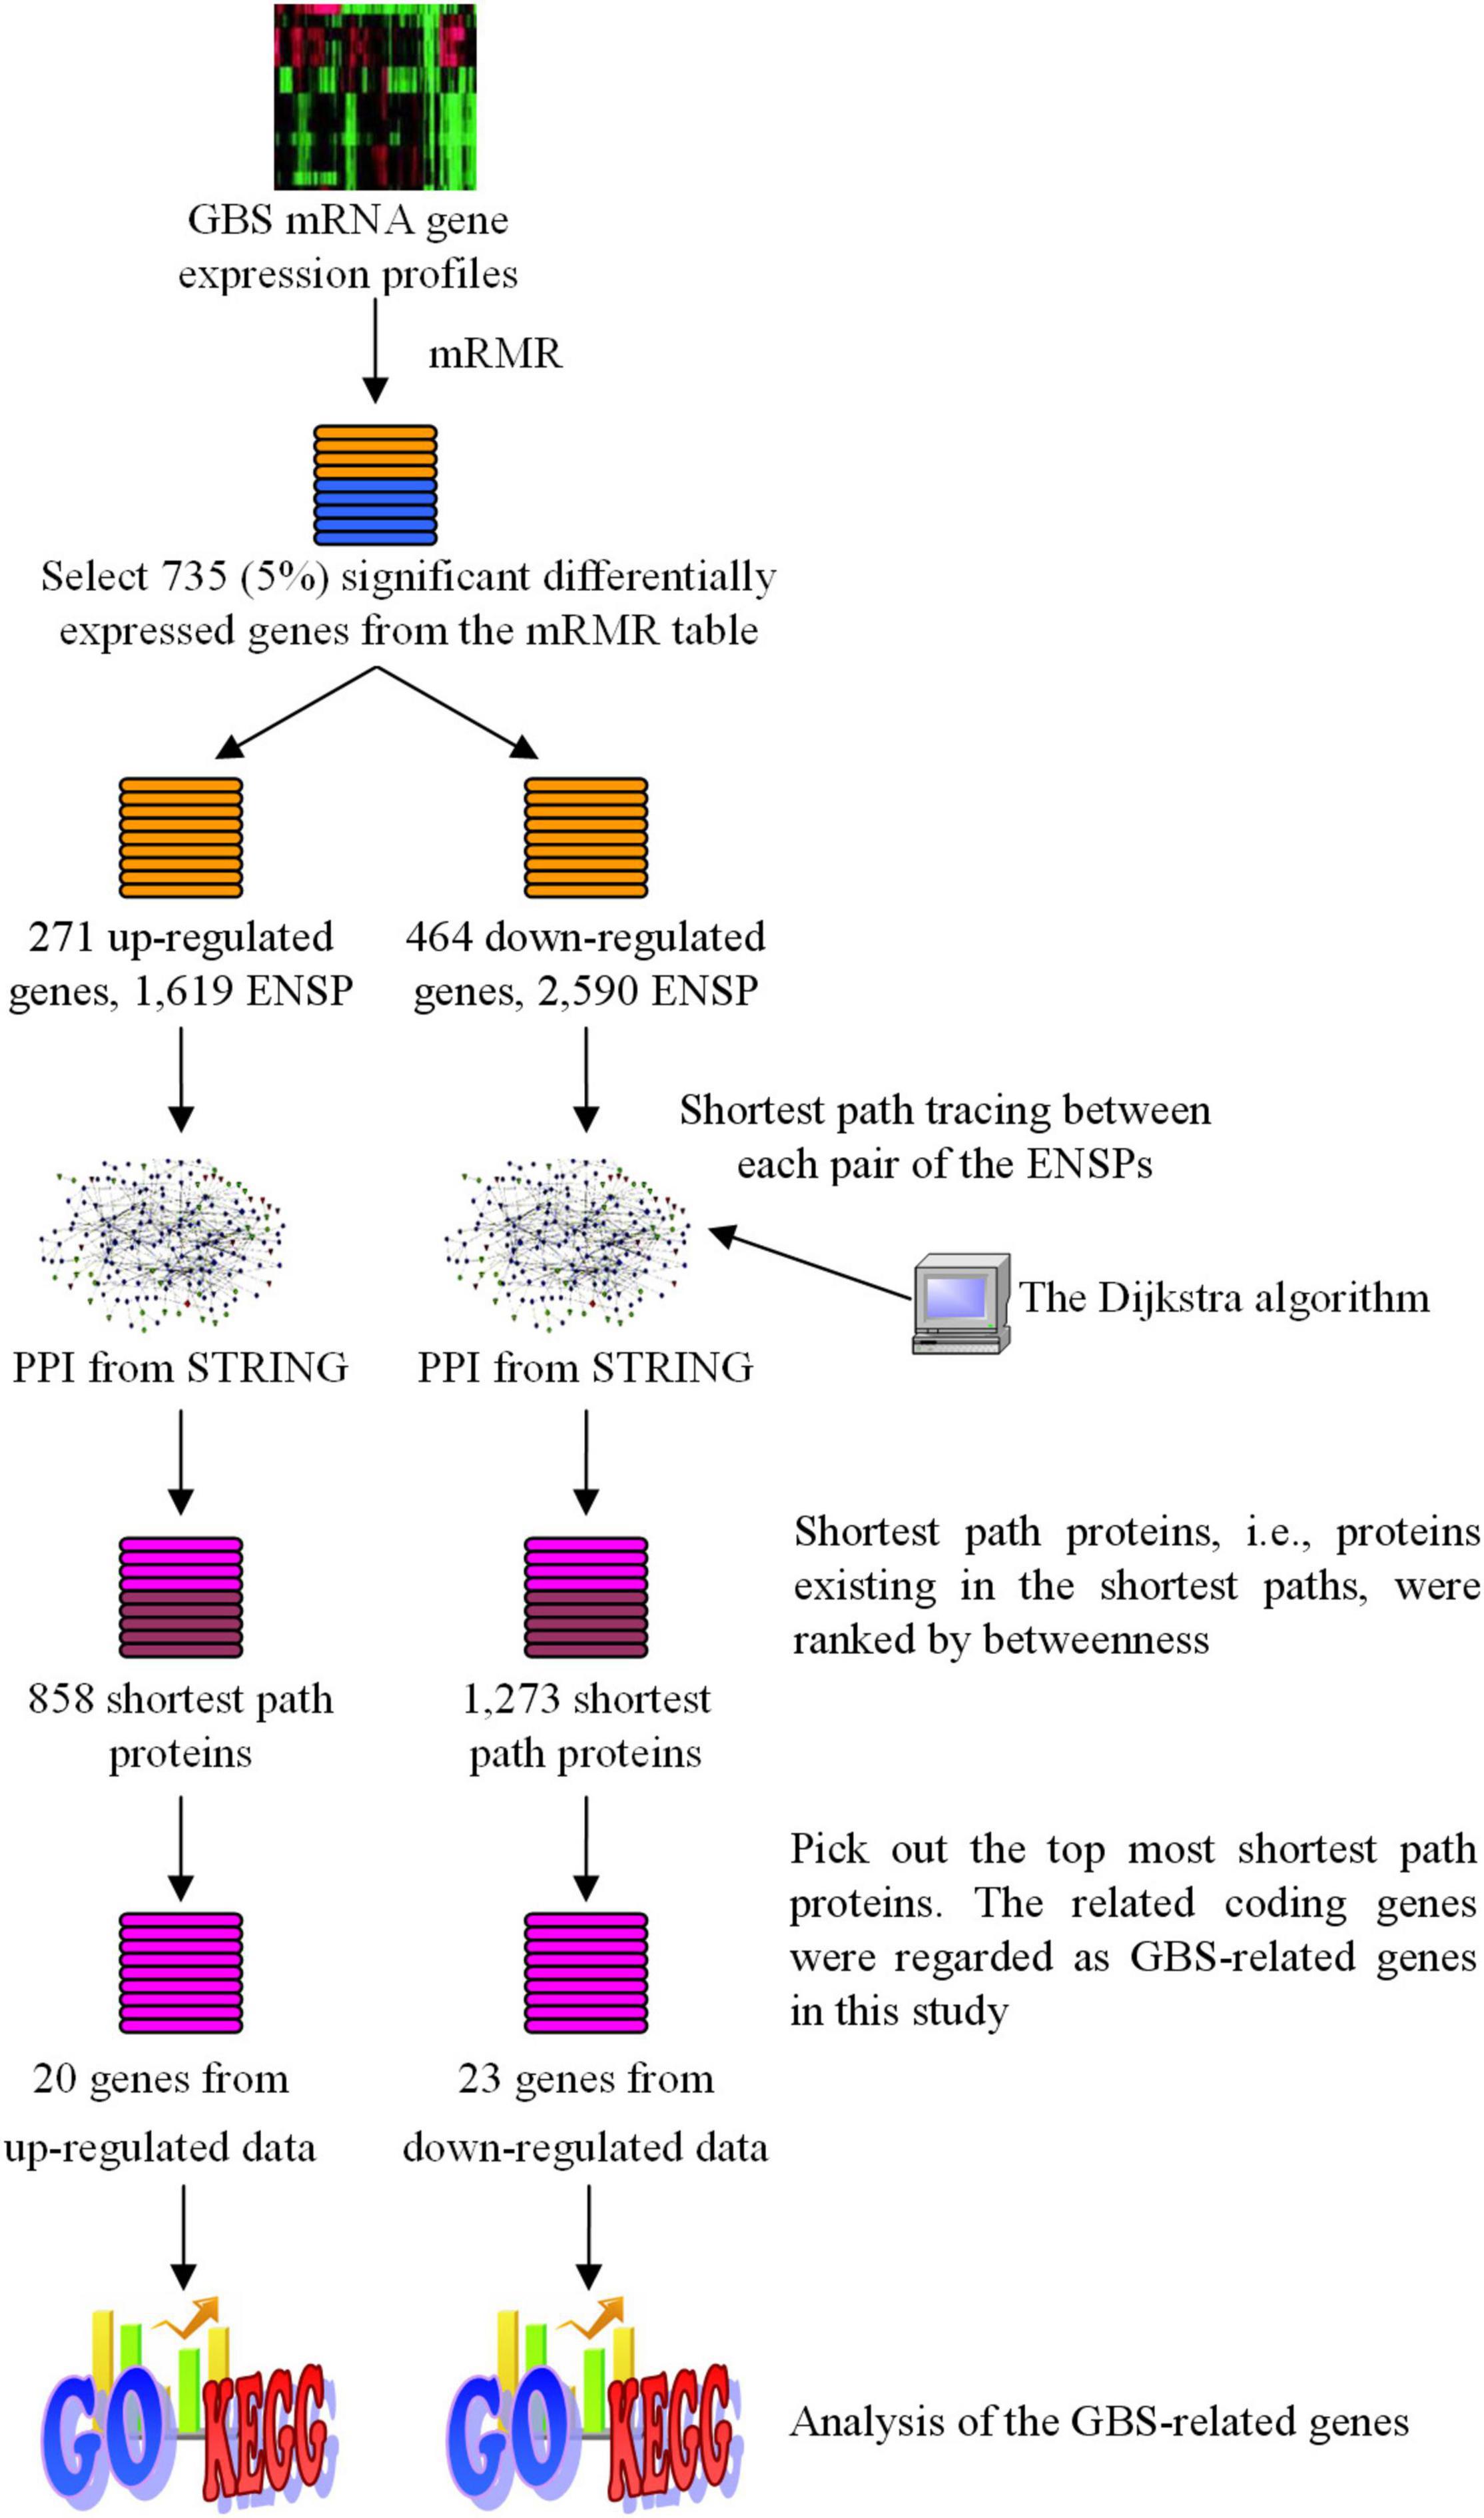
Figure 1. The flowchart of the method developed in this study to identify GBS-related human genes. Target Human Proteins interacted with GBS-related genes were obtained based on sharing GO terms. Shortest path proteins were calculated from the shortest paths between every pair of the Target Human Proteins, by searching by the Dijkstra algorithm in the network constructed from STRING. Finally, for shortest path proteins from the analysis of upregulated genes, top 20 proteins (20 genes) with betweenness > 1,400 were selected, while for downregulated genes the top 24 proteins (23 genes) with betweenness > 4,000 were selected.
mRNA Expression Profiles of Guillain–Barré Syndrome Patients and Healthy Controls
mRNA Microarray analyses were performed on the peripheral blood mononuclear cells (PBMCs) of 4 GBS patients and 4 age- and gender-matched healthy controls. Baseline characteristics are shown in Table 1. Fulfilled the standard diagnostic criteria, GBS patients were recruited from Tianjin Medical University General Hospital (Asbury, 1981). Patients manifested as symmetrical flaccid weakness and decreased reflexes in the absence of alternative causes with cerebrospinal fluid albumincytological dissociation, and electrodiagnostic evidence of neuropathy (Shahrizaila et al., 2021). Blood samples were collected within the peak timing of manifesting GBS and before using glucocorticoid, intravenous immune globulin (IVIG), or plasma exchange. Before enrollment, informed consent was signed from all involved patients. This study was approved by the ethical review committees of Tianjin Medical University General Hospital. Human peripheral blood mononuclear cells (PBMCs) were isolated from all GBS patients and healthy controls. RNA extraction and production of labeled cRNA were conducted as our previous study (Xu et al., 2016). Standard data analyses are provided for RNA quality control. The labeled cRNAs were designed for the global profiling of human lncRNAs, mRNAs, and protein-coding transcripts by hybridizing onto the human LncRNA Expression Microarray V3.0 (Arraystar, Rockville, MD).
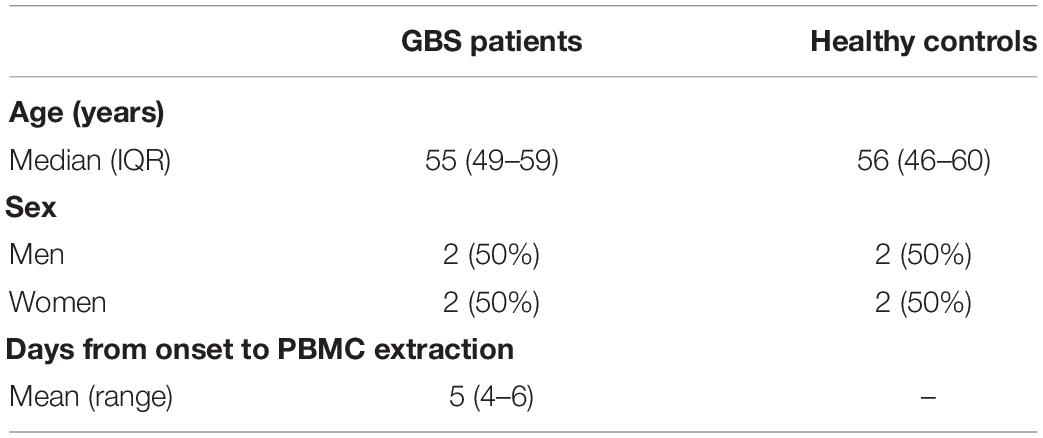
Table 1. Baseline characteristics of GBS patients and healthy controls.
Totally an expression profile dataset of 8 samples, 21,620 probes was obtained. Then signal intensity was log2 transformed and normalized and 14,707 genes were derived from source probes.
The mRMR Method
The maximum relevance minimum redundancy (mRMR) method (Peng et al., 2005; Li et al., 2012a,b; Zhang et al., 2012) was employed to rank the importance of total 14,707 genes examined, according to the Maximum Relevance Minimum Redundancy criterion. Each gene was recognized as a feature during this procedure. Features most important in distinguishing GBS patients and healthy controls were selected according to the Maximum Relevance criterion. Meanwhile, features containing redundant information were excluded by the Minimum Redundancy criterion, according to the previously described procedure (Xu et al., 2016). In brief, two values were calculated using mRMR criteria: value A for relevance and value B for redundancy. The feature is measured using the value A–B. The features is correlated with value A–B (Peng et al., 2005; Li et al., 2012a,b; Zhang et al., 2012).
The mRMR method was used to generate two ordered list: the MaxRel Table and mRMR Table. All the features were ranked only by the Maximum Relevance criterion in the MaxRel Table, while they were ranked by the mRMR criteria in the mRMR Table. The two tables are provided in Supplementary Material 1.
Protein–Protein Interaction Data From Search Tool for the Retrieval of Interacting Genes
As an online database resource, search tool for the retrieval of interacting genes (STRING) (Szklarczyk et al., 2011)1 compiles both experimental and predicted protein–protein interactions with a confidence score to quantify each interaction confidence. STRING retrieved a weighted PPI network. The proteins in that network are expressed as nodes. Edges marked with confidence scores marked interactions between proteins if they interacted with each other. Interacting proteins in the PPI network share much more similar biological functions than non-interactive proteins (Kourmpetis et al., 2010; Ng et al., 2010; Szklarczyk et al., 2011). The explanation is the protein and its interactive ones may from the same protein complex carrying a specific function or may participate in one pathway.
In this study, we used STRING (DAVID 11.5) to construct a graph G with the PPI data. Pathway analysis was performed using DAVID.2
In that graph, proteins were represented as nodes. A d value, not a confidence score (s) was assigned to the weight of each interaction edge. The d value was calculated according to the equationd = 1000×(1−s). Therefore, d value represented protein distances to each other: the smaller distance is correlated with a higher interaction confidence score and more similar functions.
In the present work, we analyzed every two protein interactions from the significant differentially expressed proteins.
Shortest Path Tracing
We used the Dijkstra algorithm to find the shortest path in the graph G between two given proteins. In this study, the Dijkstra algorithm was implemented with R package “igraph.” A shortest path was traced from each 1,619 proteins to all the other ones in the graph, which was for the upregulated genes. For downregulated genes, the shortest path of each of the 2,590 proteins to all the other ones was traced in the graph.
Then we picked out all proteins existing on the shortest paths and ranked these proteins according to their betweenness. For upregulated genes, 858 shortest path proteins were retrieved, while for downregulated genes, 1,273 shortest path proteins were retrieved, as list in Table 2. The 858 and 1,273 shortest path proteins were sequenced using betweenness, respectively.
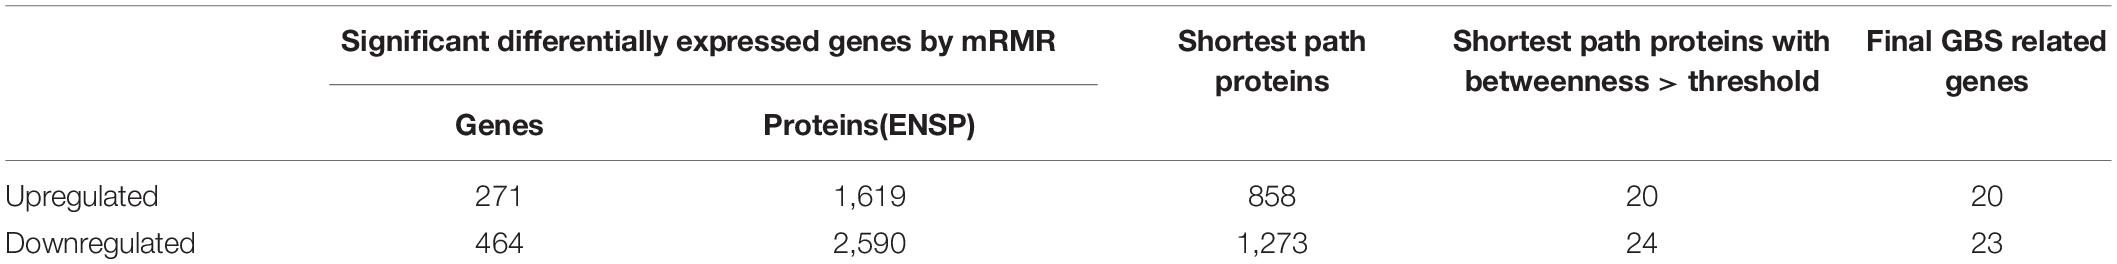
Table 2. Number of genes or proteins in each step of our computational procedures.
The betweenness threshold should be set in order to select significant ones from a ranked list. By a computational method, we can set the threshold differently to yield a different number of gene results. The more the threshold is, the less the genes are. Generally speaking, it is practical to select the top most 20–30 significant genes for further analysis or for experimental validation. Furthermore, the threshold values should be different for upregulated genes and for downregulated ones, because the number of path tracing proteins and the number of shortest path proteins were different.
In this study, for shortest path proteins from the analysis of upregulated genes, top 20 proteins (20 genes) with betweenness > 1,400 were selected, while for downregulated genes the top 24 proteins (23 genes) with betweenness > 4,000 were selected. These 20+23 genes were regarded as the final significant GBS-related genes in the present work and they were list in Tables 3, 4, respectively.
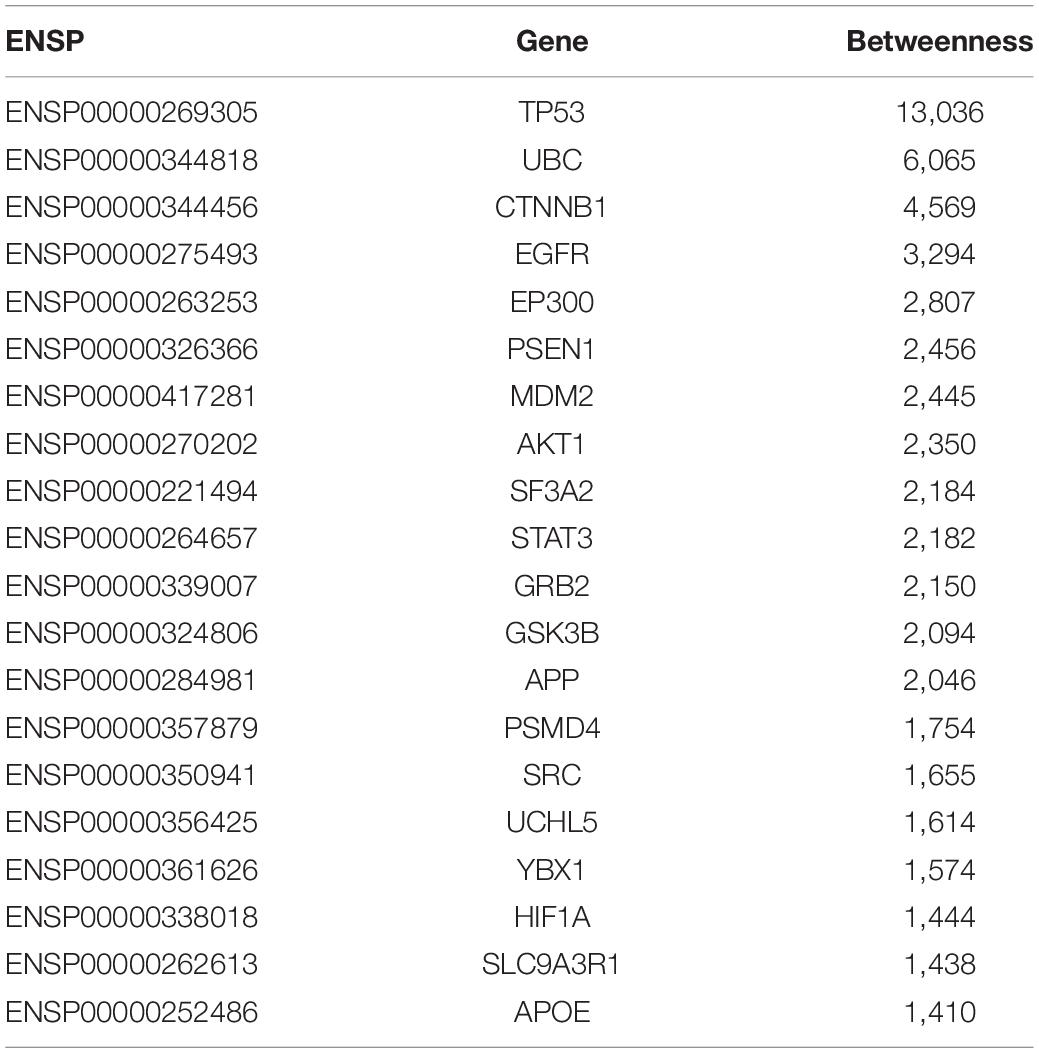
Table 3. The 20 GBS-related genes identified by PPI network from the analysis of upregulated expressed genes from the expression profiles.
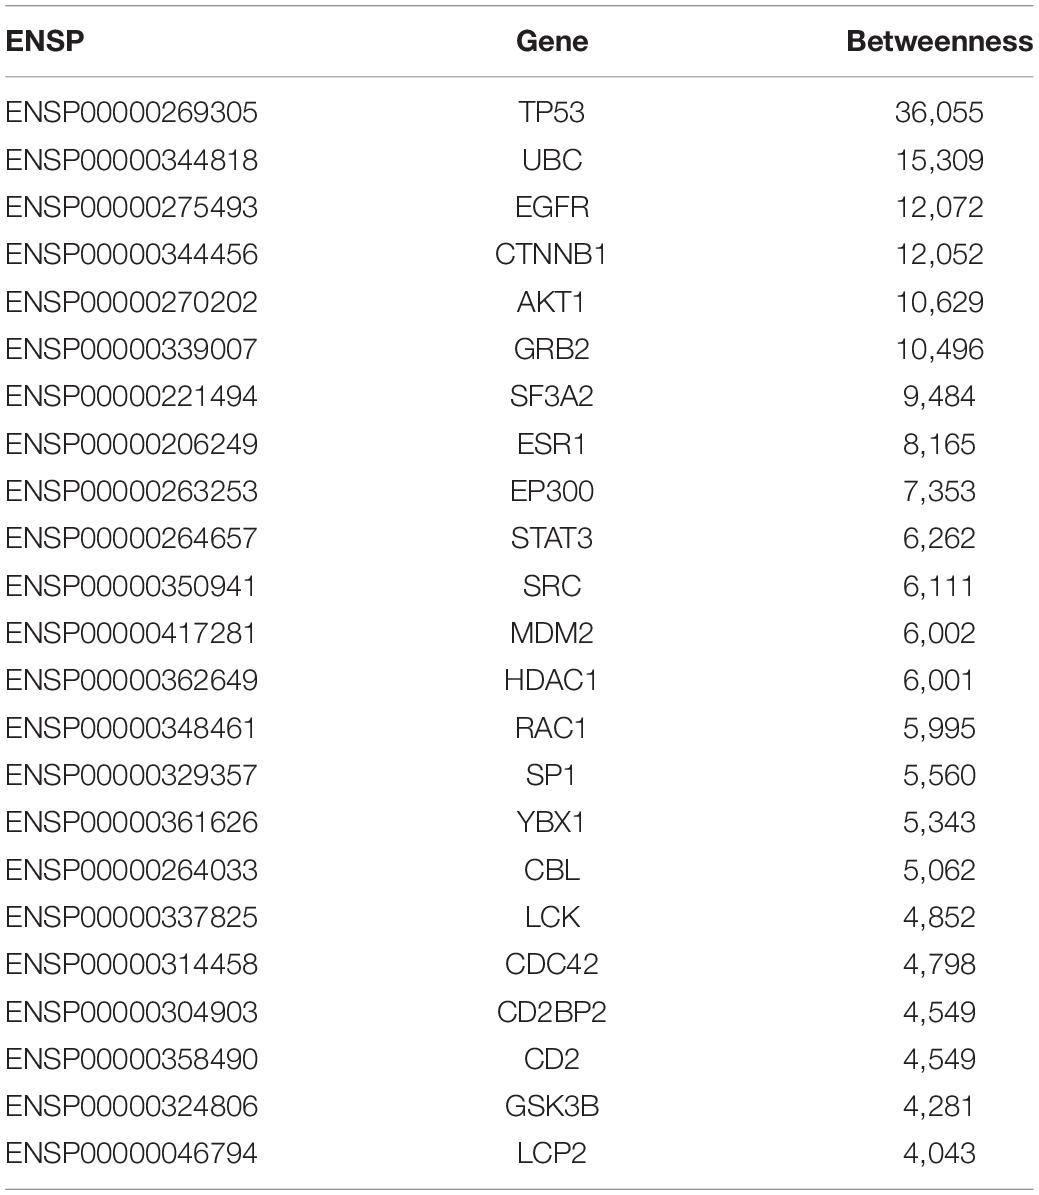
Table 4. The 23 GBS-related genes identified by PPI network from the analysis of downregulated expressed genes from the expression profiles.
Results and Discussion
Guillain–Barré Syndrome-Related Genes
In this study, we select the top 5%, i.e., 735 features, from the mRMR Table. These genes were considered to be significant differentially expressed genes according to the expression profiles and were analyzed in further procedures. In the 735 significant genes, there were 271 upregulated genes and 464 downregulated genes, producing 1,619 and 2,590 protein products, respectively. The upregulated genes and downregulated genes were analyzed, respectively, in the next procedures. The number of the genes and proteins is summarized in Table 2.
As shown in Tables 3, 4, 20 GBS-related genes were identified from the analysis of upregulated significant expressed genes from the gene expression profile data, while 23 GBS-related genes were identified from the data of downregulated ones.
From Tables 3, 4, it can be seen that there were 13 overlap genes, which were TP53, UBC, CTNNB1, EGFR, EP300, MDM2, AKT1, SF3A2, STAT3, GRB2, GSK3B, SRC, and YBX1. These genes were identified both from upregulated analysis and downregulated analysis, indicating they could play more important roles in GBS.
As an important tumor suppressor gene, TP53 takes part in cellular senescence, apoptosis and cell cycle progression (McCubrey et al., 2016). MDM2 has p53-independent transcription factor-like effects in nuclear factor-kappa beta (NF-κB) activation. Therefore, MDM2 promotes tissue inflammation and MDM2 inhibition has potent anti-inflammatory effects in tissue injury (Ebrahim et al., 2015). Increased levels of STAT3 proteins were observed in CD4+ T cells from GBS patients (Liu et al., 2015). Previous study showed that Grb2 promotes the correlation of FasL with adaptin beta. Moreover, in Schwann cells, Grb2 also helps FasL sorting to the cell surface. FasL potentially regulated cell death. Therefore, its cell surface localization is important for controlling local tissue remodeling and inflammation (Thornhill et al., 2008).
In recent years, high-throughput studies and candidate gene studies verified differential expression genes in GBS patients (Safa et al., 2021). In our previous study, we found 114 differentially expressed lncRNAs and 310 differentially expressed mRNAs between GBS patients and healthy controls, in which several gene ontology (GO) terms, such as cytosol, cellular macromolecular complex assembly, cell cycle, ligase activity, protein catabolic process were enriched in gene lists (Xu et al., 2016).
Protein–Protein Interaction Relationship Between the Guillain–Barré Syndrome-Related Genes
We mapped all the GBS-related genes to the PPI network constructed from the STRING database. The PPI relationships between the GBS-related genes were shown in Figure 2. The coding genes of the proteins were denoted as nodes. The 20 GBS-related genes identified from upregulated analysis were represented as red circles, while the 23 genes from downregulated ones were represented as blue circles. Note that there were 13 overlap genes, which were represented as green circles.
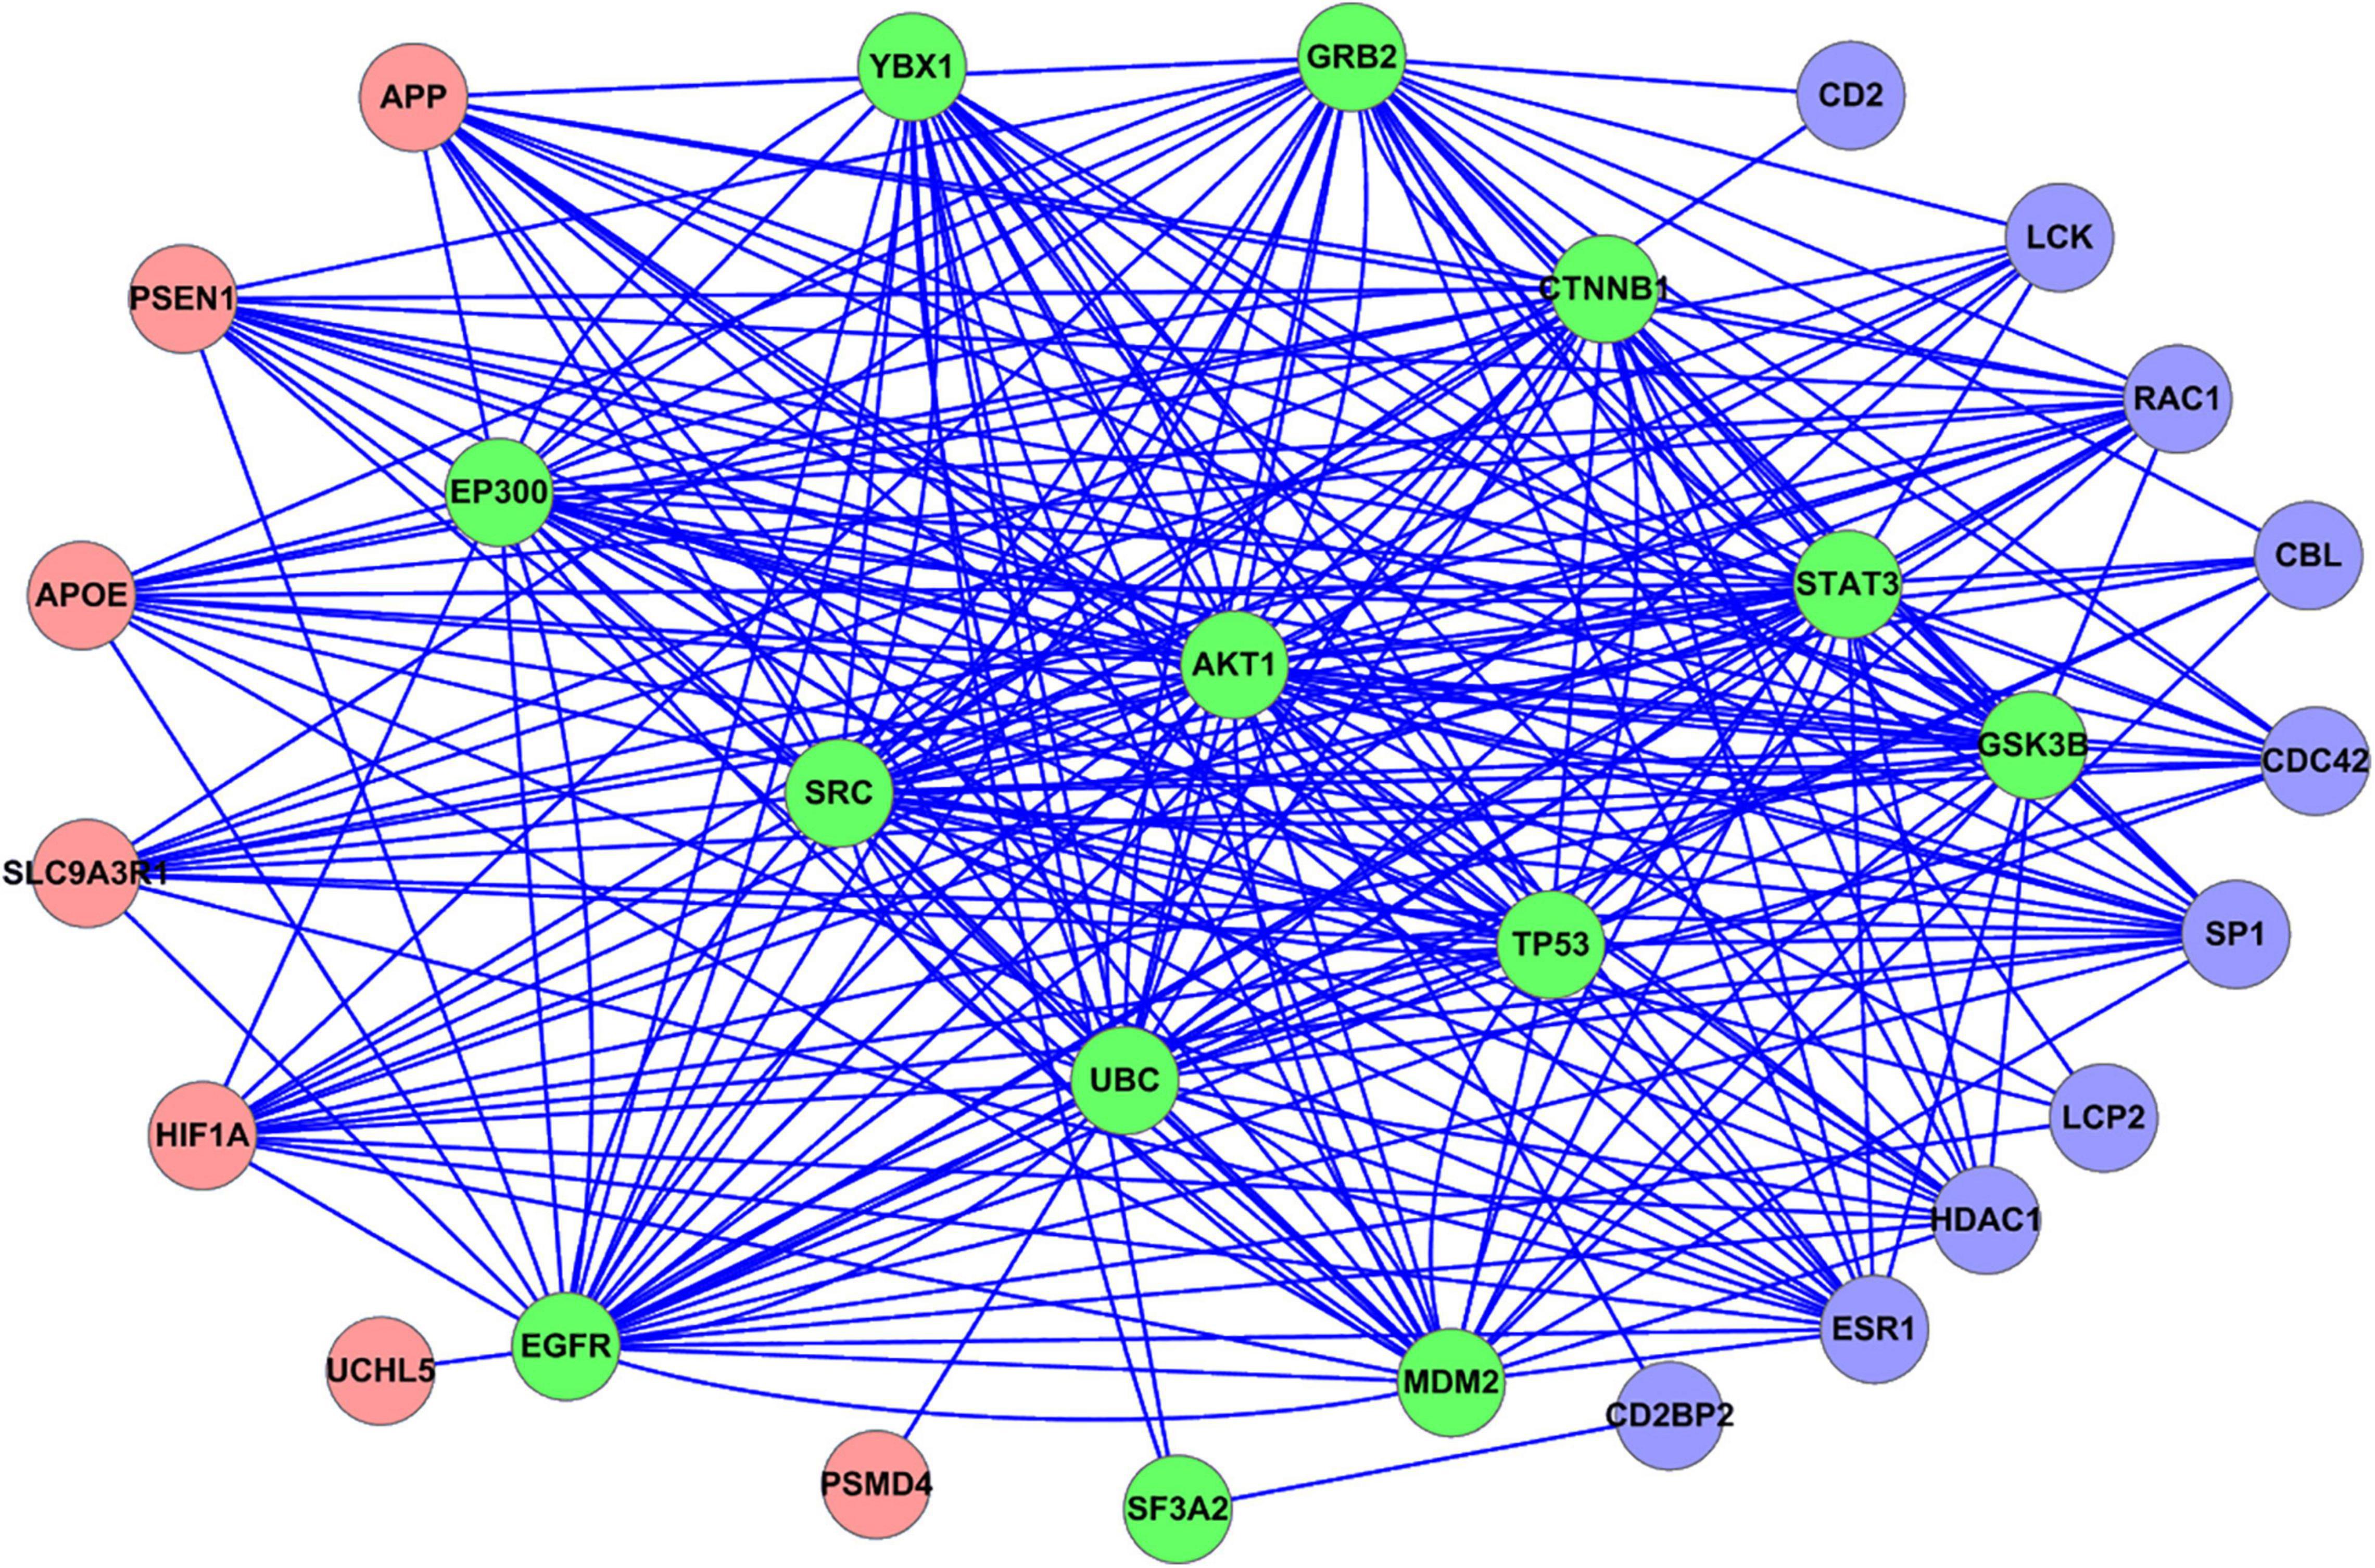
Figure 2. PPI relationship between all the GBS-related genes identified in this study. Red circle represents the GBS-related genes identified from upregulated analysis. Blue circle represents the GBS-related genes identified from downregulated analysis. Green circle represents the overlap GBS-related genes both from upregulated and downregulated analysis.
The DAVID results are provided in Supplementary Material 2. We also plot the GO enrichment results in Figure 3 from the data in Supplementary Material 2. The overlap GO terms in both upregulated and downregulated analysis were listed as follows:
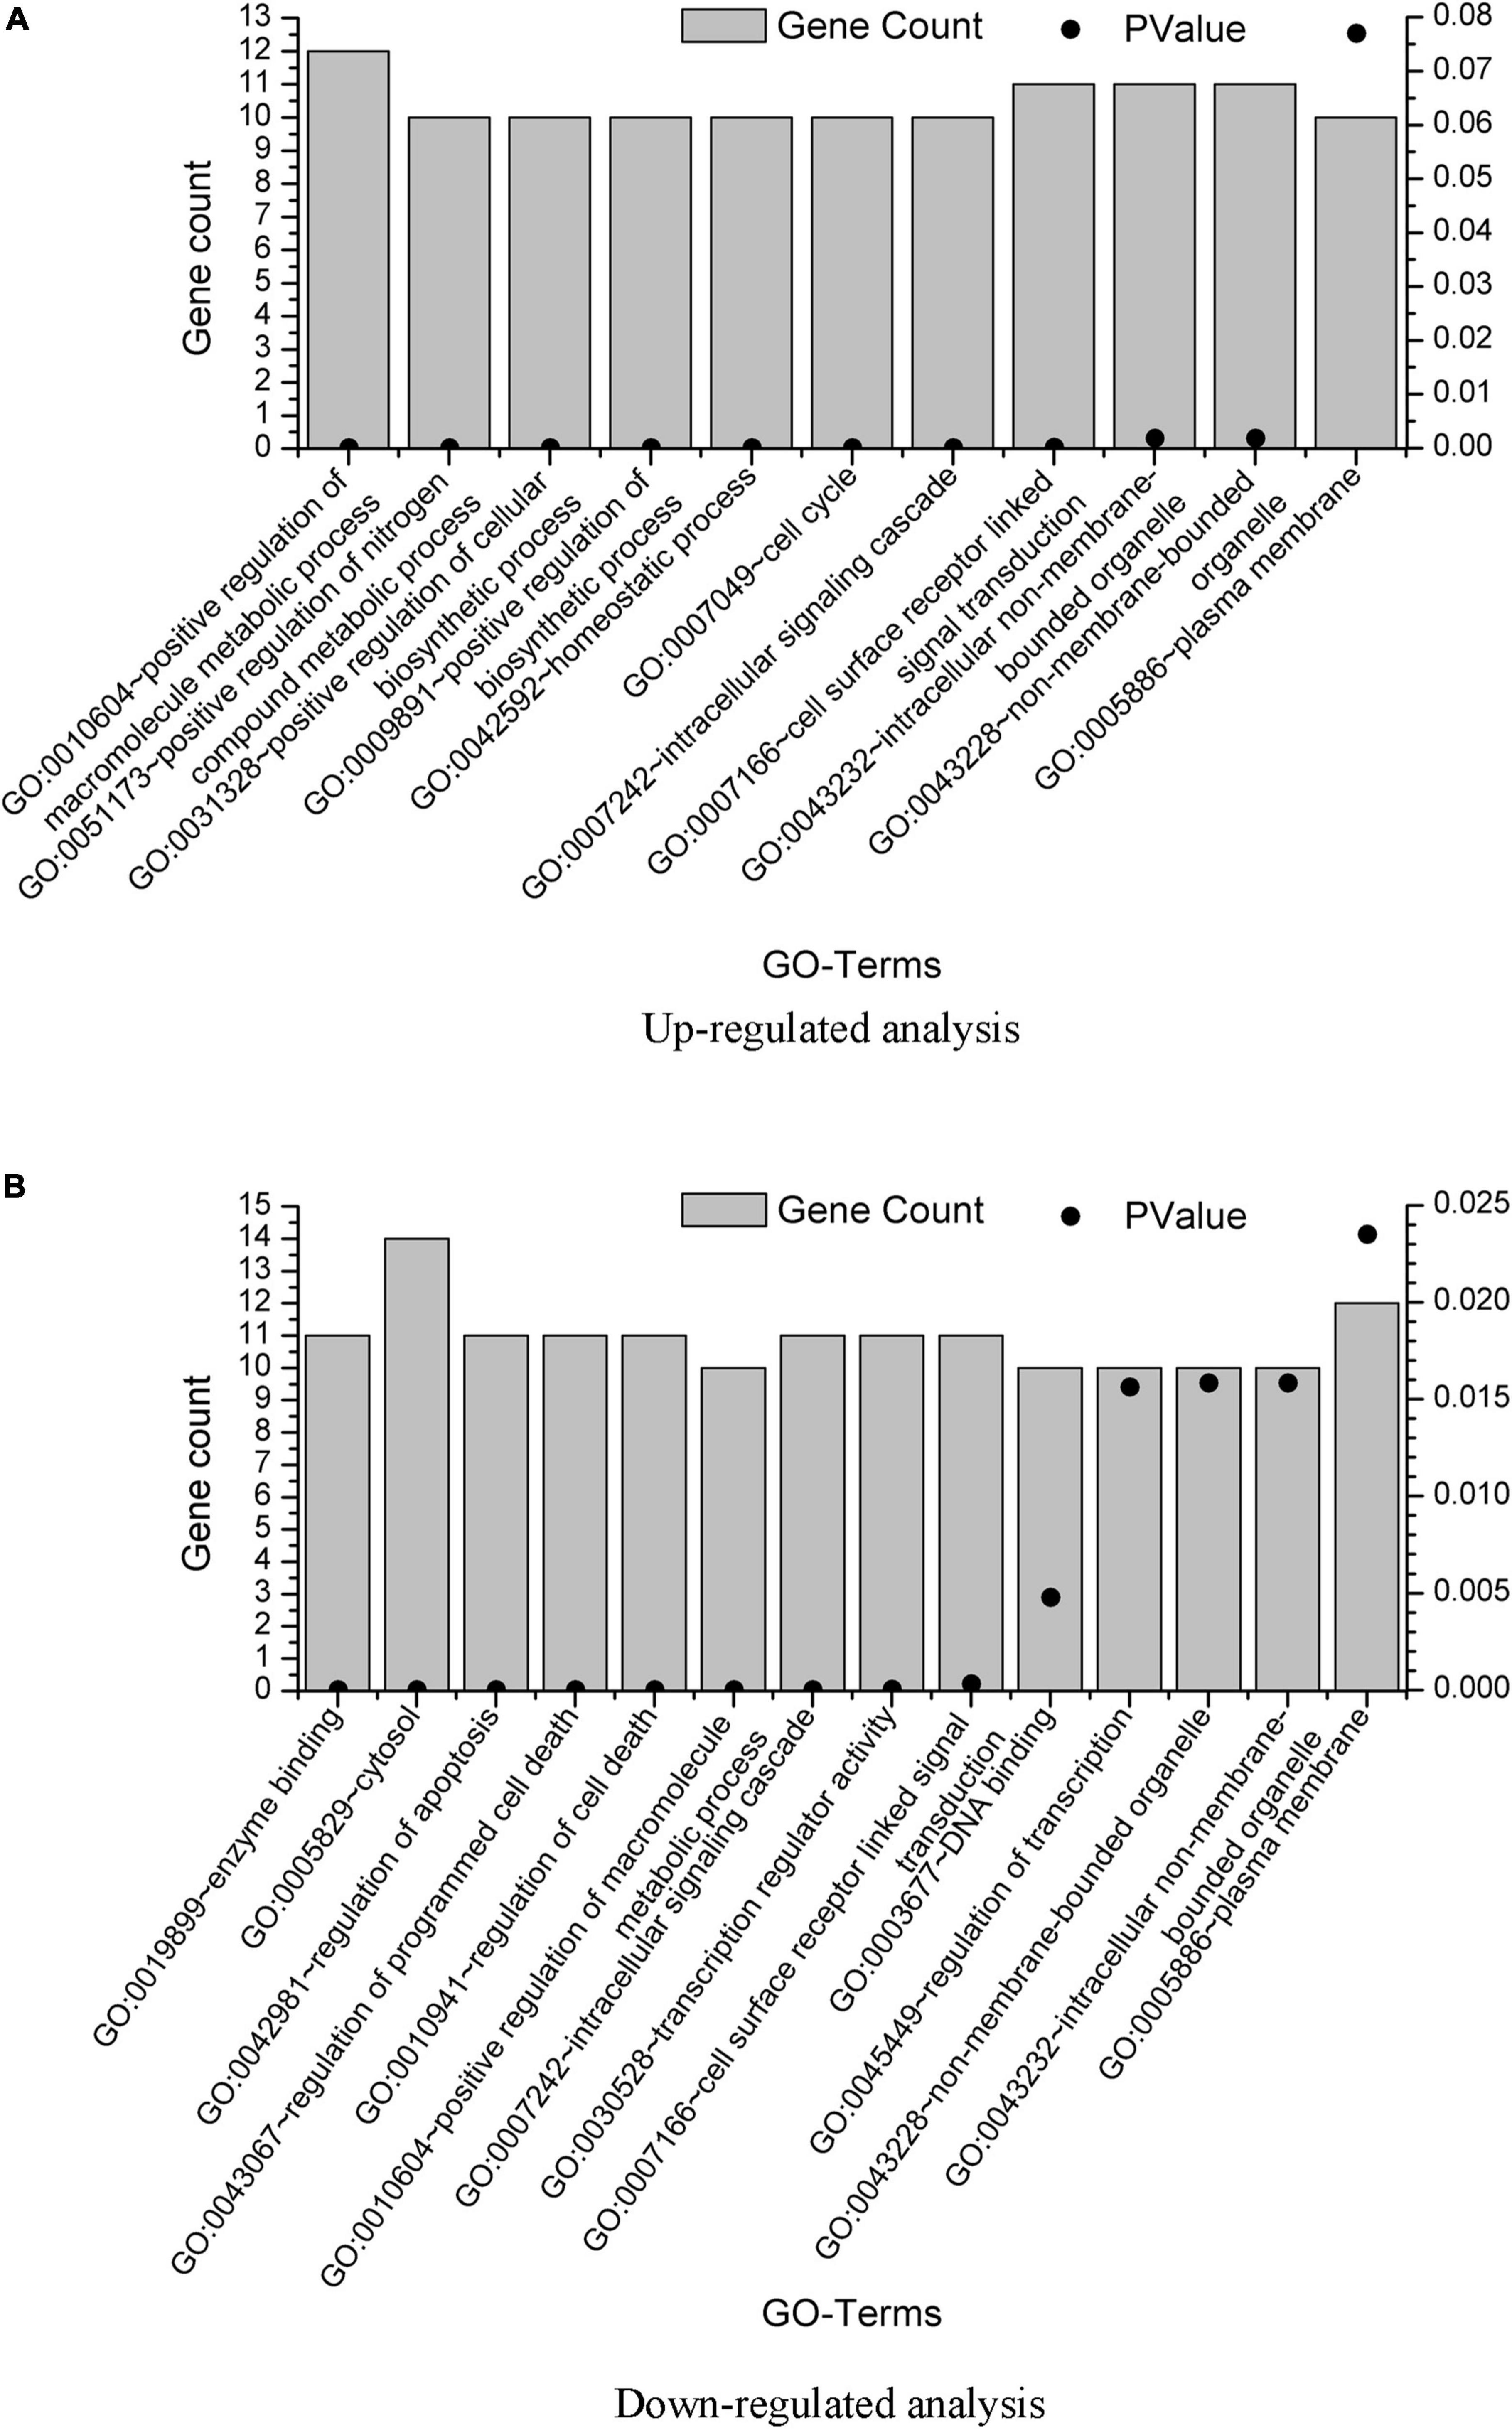
Figure 3. GO term enrichment analysis of the GBS-related genes. GO term enrichment analysis was performed on the 20 genes from upregulated analysis and 23 genes from downregulated analysis, with results plotted in (A,B), respectively. Only pathways with gene count = 10 were shown.
GO:0010604∼positive regulation of macromolecule metabolic process
GO:0007242∼intracellular signaling cascade
GO:0007166∼cell surface receptor linked signal transduction
GO:0043232∼intracellular non-membrane-bounded organelle
GO:0043228∼non-membrane-bounded organelle
GO:0005886∼plasma membrane
KEGG Pathway Enrichment Analysis
Associated signaling pathways were analyzed using DAVID. Using Benjamin multiple testing correction method, the enrichment p-value was corrected to control family-wide false discovery rate under a certain rate (e.g., ≤ 0.05). The results were provided in Supplementary Material 3. We also plot the KEGG pathway enrichment results in Figure 4 from the data in Supplementary Material 3. The overlap KEGG pathway terms in both upregulated and downregulated analysis were listed as follows:
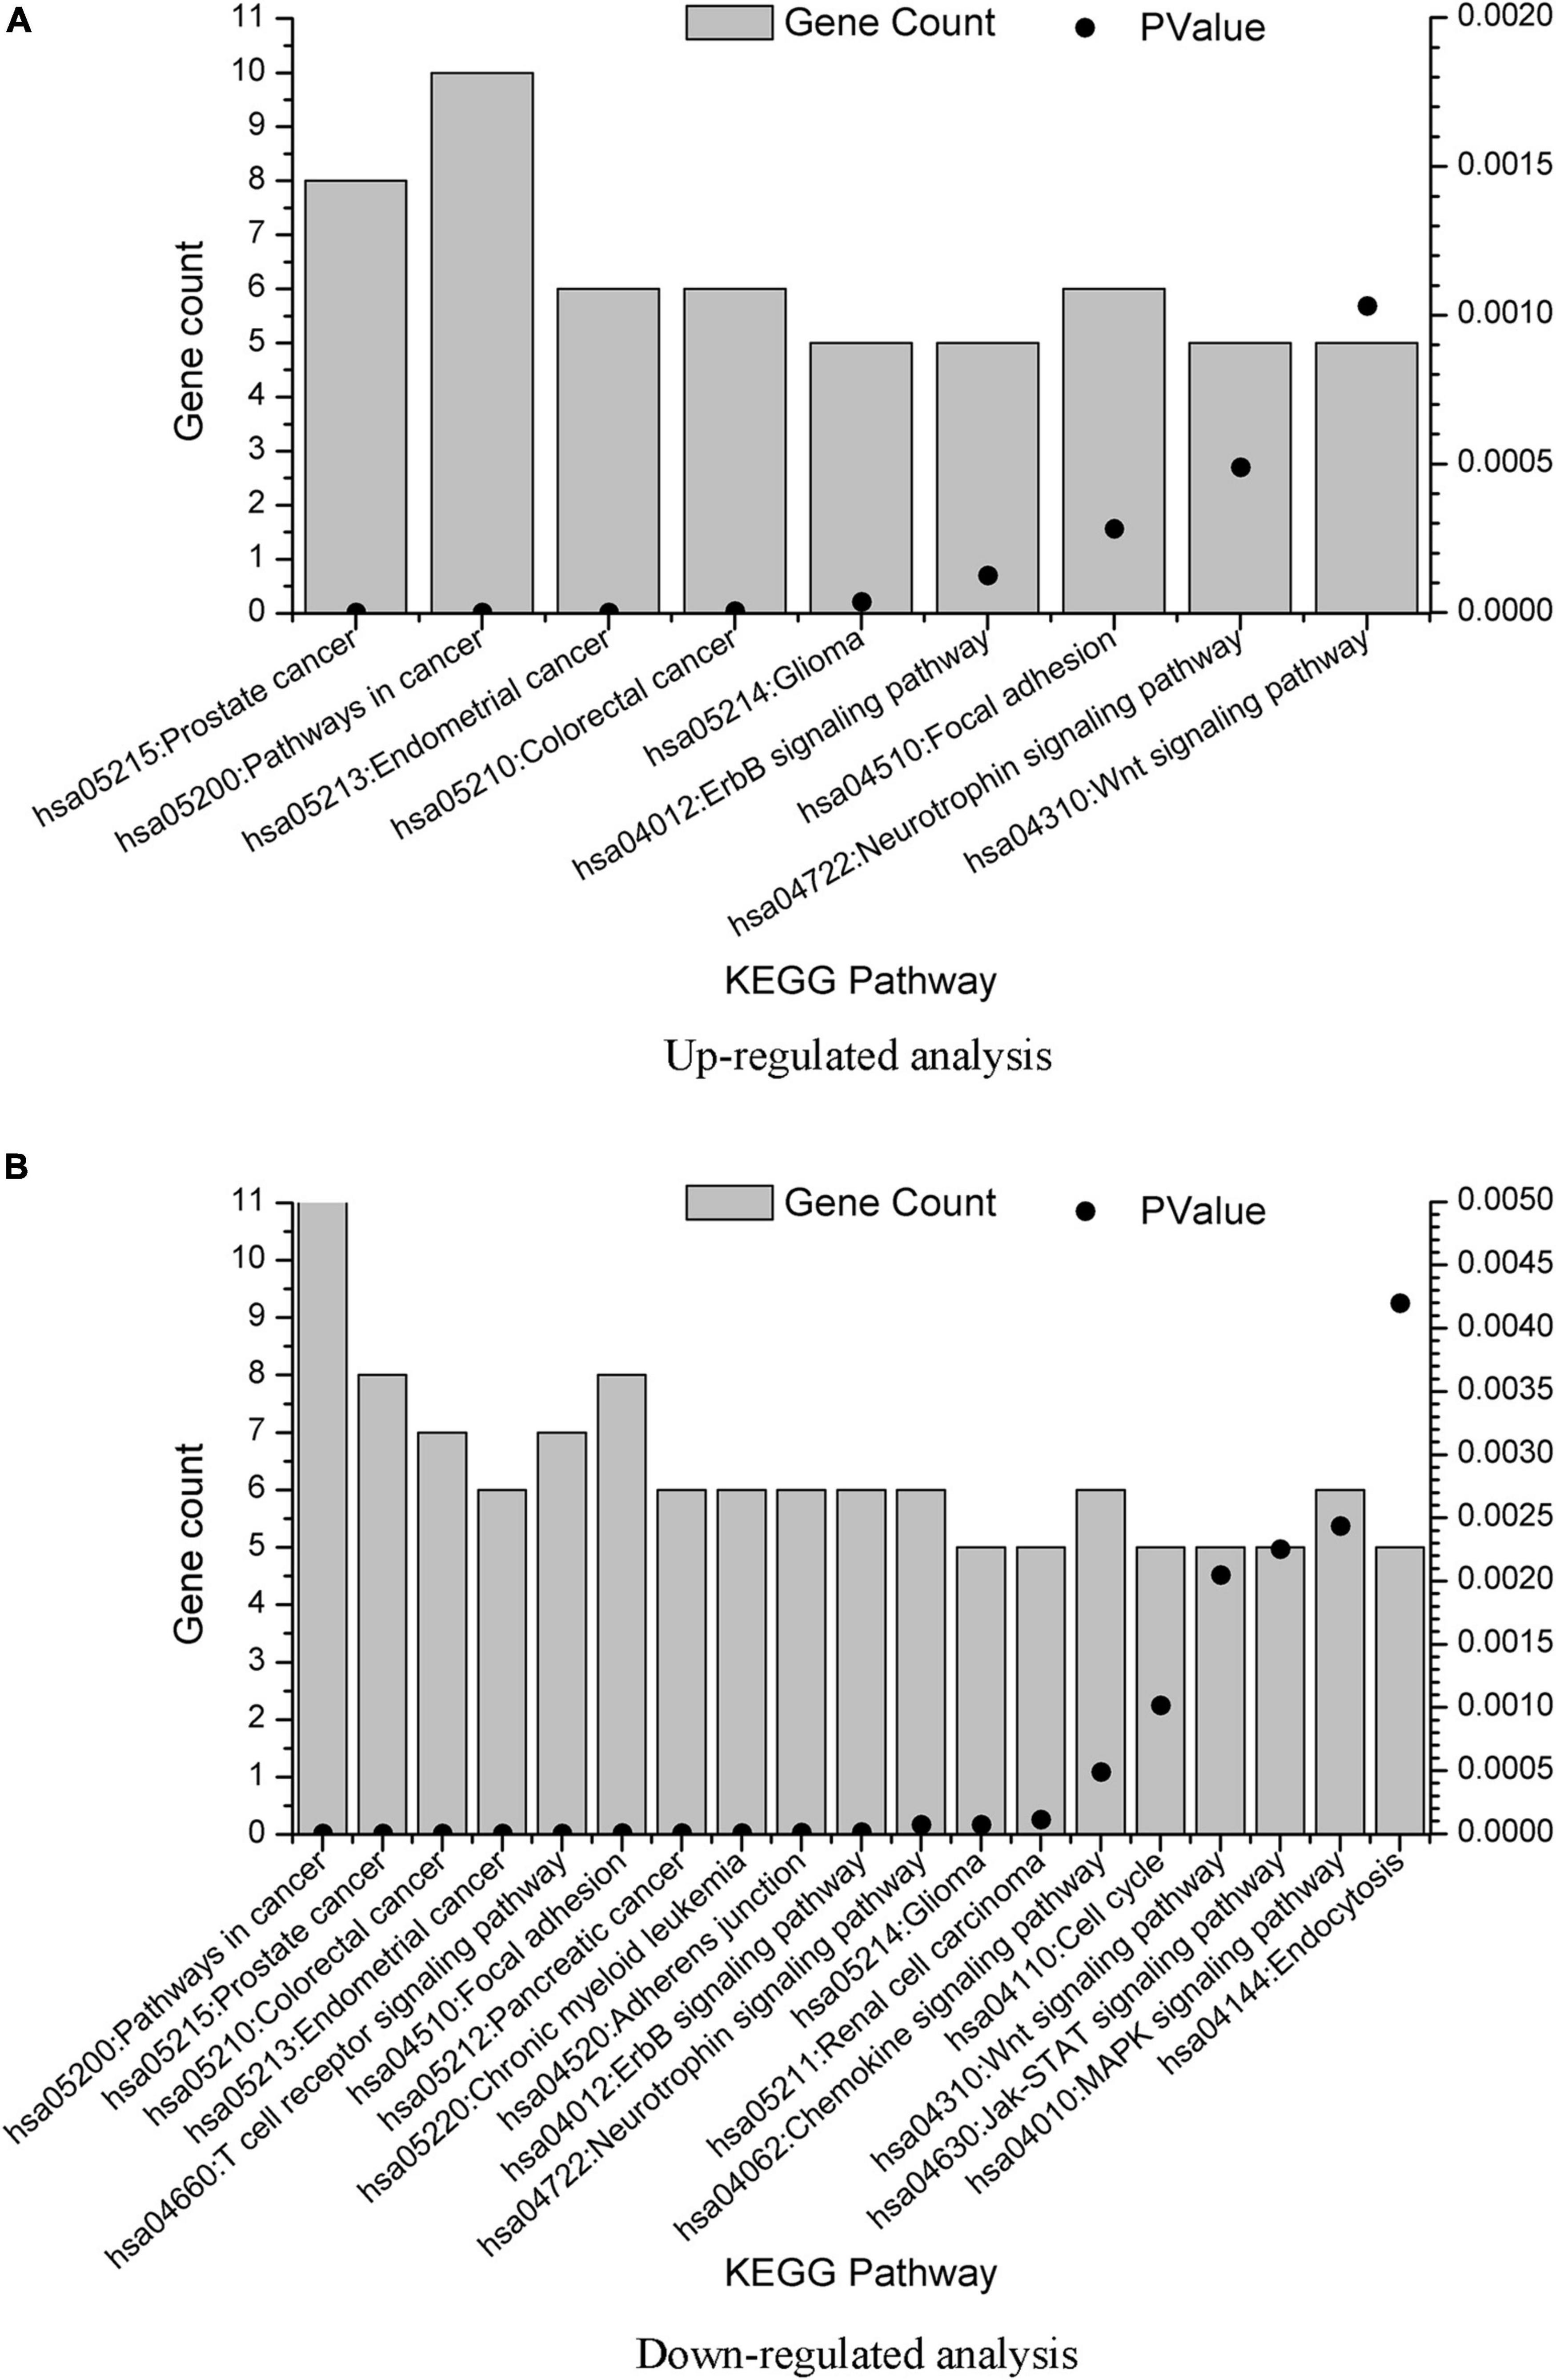
Figure 4. KEGG term enrichment analysis of the GBS-related genes. KEGG term enrichment analysis was performed on the 20 genes from upregulated analysis and 23 genes from downregulated analysis, with results plotted in (A,B), respectively. Only pathways with gene count = 5 were shown.
hsa05215: Prostate cancer
hsa05200: Pathways in cancer
hsa05213: Endometrial cancer
hsa05210: Colorectal cancer
hsa05214: Glioma
hsa04012: ErbB signaling pathway
hsa04510: Focal adhesion
hsa04722: Neurotrophin signaling pathway
hsa04310: Wnt signaling pathway
As one of the promising biomolecules, neurotrophins involved in the modulation of synaptic activity, neuronal survival, and release of neurotransmitters. There were released naturally post-injury with the potential to exhibit better functional recovery (Pandey and Mudgal, 2021). In the present study, we found Neurotrophin signaling pathway in both upregulated and downregulated pathway, which also indicates the role of neurotrophin in GBS pathological mechanism and nerve recovery.
Previous study found that Wnt/β-catenin signals participated in Schwann cell proliferation and apoptosis and acted as positive regulators of myelination (Lush and Piotrowski, 2014). Liu et al. (2020) also demonstrated that Wnt/β-catenin signaling pathway was upregulated in experimental autoimmune neuritis (EAN) rats. In the present study, Wnt signaling pathway was found in both upregulated and downregulated analysis, which was consistent with the above studies.
Conclusion
In biomedicine and genomics, how to identify disease genes is one of the most critical and challenging problems. In this study, using the PPI network, we developed a computational method to search GBS-related genes based on the shortest paths. Totally, 30 most significant genes were screened out, which may imply their direct or indirect effects on the development of GBS, providing clues for further research and experimental validations. These findings may give a new reference for research into GBS pathogenesis and for new strategies for clinical therapies.
Data Availability Statement
The original contributions presented in the study are included in the article/Supplementary Material, further inquiries can be directed to the corresponding author/s.
Ethics Statement
The study was approved by the Ethics Committee of Tianjin Medical University General Hospital. The patients/participants provided their written informed consent to participate in this study.
Author Contributions
CW, SL, and YW contributed to data curation and formal analysis. JX contributed to project administration, funding acquisition, and supervision. XH collected the data. All authors read and approved the final manuscript.
Funding
This funding for the study was provided by the National Natural Science Foundation of China (Grant No. 81601041), the New Century Talents of Tianjin Medical University General Hospital, Medical Foundation of Jieping Wu (Grant No. 320.6750.19089-56), the Youth incubation fund of General Hospital of Tianjin Medical University (Grant No. zyyfy2019007), and the Science and Technology Project of Tianjin Health Commission (Grant No. ZC20145).
Conflict of Interest
The authors declare that the research was conducted in the absence of any commercial or financial relationships that could be construed as a potential conflict of interest.
Publisher’s Note
All claims expressed in this article are solely those of the authors and do not necessarily represent those of their affiliated organizations, or those of the publisher, the editors and the reviewers. Any product that may be evaluated in this article, or claim that may be made by its manufacturer, is not guaranteed or endorsed by the publisher.
Supplementary Material
The Supplementary Material for this article can be found online at: https://www.frontiersin.org/articles/10.3389/fnmol.2022.850209/full#supplementary-material
Supplementary Material 1 | The MaxRel Table and the mRMR Table generated by the mRMR method. To evaluate the importance of all the genes in discriminating GBS and healthy controls from expression profiles, each gene was regarded as a feature and was ranked by only the Maximum Relevance criterion (the MaxRel Table), and by the Maximum Relevance Minimum Redundancy criterion (the mRMR Table). The smaller the index was in the mRMR Table, the more important the gene was.
Supplementary Material 2 | Results of the GO term enrichment analysis on the GBS-related genes by the functional annotation tool DAVID. We performed the analysis on the 20 GBS-related genes from upregulated analysis and on the 23 GBS-related genes from downregulated analysis, respectively. Results only contained the GO terms having genes more than 10.
Supplementary Material 3 | Results of the KEGG pathway enrichment analysis on the GBS-related genes by the functional annotation tool DAVID. We performed the analysis on the 20 GBS-related genes from upregulated analysis and on the 23 GBS-related genes from downregulated analysis, respectively. Results only contained the KEGG pathways having genes more than 5.
Footnotes
References
Cai, Y. D., Huang, T., Feng, K. Y., Hu, L., and Xie, L. (2010). A unified 35-gene signature for both subtype classification and survival prediction in diffuse large B-cell lymphomas. PLoS One 5:e12726. doi: 10.1371/journal.pone.0012726
Ebrahim, M., Mulay, S. R., Anders, H. J., and Thomasova, D. (2015). MDM2 beyond cancer: podoptosis, development, inflammation, and tissue regeneration. Histol. Histopathol. 30, 1271–1282. doi: 10.14670/HH-11-636
Huang, T., Chen, L., Cai, Y. D., and Chou, K. C. (2011). Classification and analysis of regulatory pathways using graph property, biochemical and physicochemical property, and functional property. PLoS One 6:e25297. doi: 10.1371/journal.pone.0025297
Huang, T., Shi, X.-H., Wang, P., He, Z., Feng, K.-Y., Hu, L., et al. (2010). Analysis and prediction of the metabolic stability of proteins based on their sequential features, subcellular locations and interaction networks. PLoS One 5:e10972. doi: 10.1371/journal.pone.0010972
Jiang, M., Chen, Y., Zhang, Y., Chen, L., Zhang, N., Huang, T., et al. (2013). Identification of hepatocellular carcinoma related genes with k-th shortest paths in a protein-protein interaction network. Mol. Biosyst. 9, 2720–2728. doi: 10.1039/c3mb70089e
Kourmpetis, Y. A., van Dijk, A. D., Bink, M. C., van Ham, R. C., and ter Braak, C. J. (2010). Bayesian markov random field analysis for protein function prediction based on network data. PLoS One 5:e9293. doi: 10.1371/journal.pone.0009293
Li, B. Q., Huang, T., Liu, L., Cai, Y. D., and Chou, K. C. (2012b). Identification of colorectal cancer related genes with mRMR and shortest path in protein-protein interaction network. PLoS One 7:e33393. doi: 10.1371/journal.pone.0033393
Li, B. Q., Zhang, J., Huang, T., Zhang, L., and Cai, Y. D. (2012c). Identification of retinoblastoma related genes with shortest path in a protein-protein interaction network. Biochimie 94, 1910–1917. doi: 10.1016/j.biochi.2012.05.005
Li, B. Q., Hu, L. L., Chen, L., Feng, K. Y., Cai, Y. D., and Chou, K. C. (2012a). Prediction of protein domain with mRMR feature selection and analysis. PLoS One 7:e39308. doi: 10.1371/journal.pone.0039308
Li, B. Q., Huang, T., Zhang, J., Zhang, N., Huang, G. H., Liu, L., et al. (2013a). An ensemble prognostic model for colorectal cancer. PLoS One 8:e63494. doi: 10.1371/journal.pone.0063494
Li, B. Q., You, J., Chen, L., Zhang, J., Zhang, N., Li, H. P., et al. (2013b). Identification of lung-cancer-related genes with the shortest path approach in a protein-protein interaction network. Biomed. Res. Int. 2013:267375. doi: 10.1155/2013/267375
Liu, H., Zhang, W., Tian, F. F., Kun, A., Zhou, W. B., Xiao, B., et al. (2015). IL-35 is involved in the pathogenesis of guillain-barre syndrome through its influence on the function of CD4+ T cells. Immunol. Invest. 44, 566–577. doi: 10.3109/08820139.2015.1043671
Liu, Q., Tan, Y., Huang, T., Ding, G., Tu, Z., Liu, L., et al. (2010). TF-centered downstream gene set enrichment analysis: inference of causal regulators by integrating TF-DNA interactions and protein post-translational modifications information. BMC Bioinformatics 11(Suppl. 11):S5. doi: 10.1186/1471-2105-11-S11-S5
Liu, Y., Liu, S., Pan, S., Gong, Q., Yao, J., and Lu, Z. (2020). The dynamic expression of canonical Wnt/SS-catenin signalling pathway in the pathologic process of experimental autoimmune neuritis. Int. J. Neurosci. 130, 1109–1117. doi: 10.1080/00207454.2020.1725511
Lush, M. E., and Piotrowski, T. (2014). ErbB expressing schwann cells control lateral line progenitor cells via non-cell-autonomous regulation of Wnt/beta-catenin. Elife 3:e01832. doi: 10.7554/eLife.01832
McCubrey, J. A., Lertpiriyapong, K., Fitzgerald, T. L., Martelli, A. M., Cocco, L., Rakus, D., et al. (2016). Roles of TP53 in determining therapeutic sensitivity, growth, cellular senescence, invasion and metastasis. Adv. Biol. Regul. 63, 32–48. doi: 10.1016/j.jbior.2016.10.001
Nabieva, E., Jim, K., Agarwal, A., Chazelle, B., and Singh, M. (2005). Whole-proteome prediction of protein function via graph-theoretic analysis of interaction maps. Bioinformatics 21(Suppl. 1), i302–i310. doi: 10.1093/bioinformatics/bti1054
Ng, K. L., Ciou, J. S., and Huang, C. H. (2010). Prediction of protein functions based on function-function correlation relations. Comput. Biol. Med. 40, 300–305. doi: 10.1016/j.compbiomed.2010.01.001
Pandey, S., and Mudgal, J. (2021). A review on the role of endogenous neurotrophins and schwann cells in axonal regeneration. J. Neuroimmune Pharmacol. doi: 10.1007/s11481-021-10034-3 [Epub ahad of print].
Peng, H., Long, F., and Ding, C. (2005). Feature selection based on mutual information: criteria of max-dependency, max-relevance, and min-redundancy. IEEE Trans. Pattern Anal. Mach. Intell. 27, 1226–1238. doi: 10.1109/TPAMI.2005.159
Safa, A., Azimi, T., Sayad, A., Taheri, M., and Ghafouri-Fard, S. (2021). A review of the role of genetic factors in Guillain-Barre syndrome. J. Mol. Neurosci. 71, 902–920. doi: 10.1007/s12031-020-01720-7
Shahrizaila, N., Lehmann, H. C., and Kuwabara, S. (2021). Guillain-Barre syndrome. Lancet 397, 1214–1228. doi: 10.1016/S0140-6736(21)00517-1
Szklarczyk, D., Franceschini, A., Kuhn, M., Simonovic, M., Roth, A., Minguez, P., et al. (2011). The STRING database in 2011: functional interaction networks of proteins, globally integrated and scored. Nucleic Acids Res. 39, D561–D568. doi: 10.1093/nar/gkq973
Thornhill, P. B., Cohn, J. B., Stanford, W. L., and Desbarats, J. (2008). The adaptor protein Grb2 regulates cell surface Fas ligand in Schwann cells. Biochem. Biophys. Res. Commun. 376, 341–346. doi: 10.1016/j.bbrc.2008.08.164
Xu, J., Gao, C., Zhang, F., Ma, X., Peng, X., Zhang, R., et al. (2016). Differentially expressed lncRNAs and mRNAs identified by microarray analysis in GBS patients vs healthy controls. Sci Rep 6:21819. doi: 10.1038/srep21819
Zhang, N., Jiang, M., Huang, T., and Cai, Y. D. (2014). Identification of Influenza A/H7N9 virus infection-related human genes based on shortest paths in a virus-human protein interaction network. Biomed. Res. Int. 2014:239462. doi: 10.1155/2014/239462
Keywords: GBS, genes, mRNA microarray analysis, protein–protein interaction, shortest path
Citation: Wang C, Liao S, Wang Y, Hu X and Xu J (2022) Computational Identification of Guillain-Barré Syndrome-Related Genes by an mRNA Gene Expression Profile and a Protein–Protein Interaction Network. Front. Mol. Neurosci. 15:850209. doi: 10.3389/fnmol.2022.850209
Received: 07 January 2022; Accepted: 24 February 2022;
Published: 17 March 2022.
Edited by:
Guiyou Liu, Tianjin Institute of Industrial Biotechnology (CAS), ChinaReviewed by:
Zhijie Han, Chongqing Medical University, ChinaLaura B. Ferguson, The University of Texas at Austin, United States
Lishuang Qi, Harbin Medical University, China
Copyright © 2022 Wang, Liao, Wang, Hu and Xu. This is an open-access article distributed under the terms of the Creative Commons Attribution License (CC BY). The use, distribution or reproduction in other forums is permitted, provided the original author(s) and the copyright owner(s) are credited and that the original publication in this journal is cited, in accordance with accepted academic practice. No use, distribution or reproduction is permitted which does not comply with these terms.
*Correspondence: Jing Xu, amluZ3h1MDFAdG11LmVkdS5jbg==
†These authors have contributed equally to this work