 Markus Rapedius1*†
 Alison Obergrussberger1†
 Edward S. A. Humphries2
 Stephanie Scholz1Ilka Rinke-Weiss1Tom A. Goetze1Nina Brinkwirth1Maria Giustina Rotordam1Tim Strassmaier3Aaron Randolph3Søren Friis1Aiste Liutkute4,5,6Fitzwilliam Seibertz4,5,6Niels Voigt4,5,6
 Niels Fertig1
- 1Nanion Technologies GmbH, Munich, Germany
- 2Discovery Sciences, BioPharmaceuticals R&D, AstraZeneca, Cambridge, United Kingdom
- 3Nanion Technologies Inc., Livingston, NJ, United States
- 4Institute of Pharmacology and Toxicology, University Medical Center Göttingen, Georg-August University, Göttingen, Germany
- 5German Center for Cardiovascular Research, Partner Site Göttingen, Göttingen, Germany
- 6Cluster of Excellence “Multiscale Bioimaging: From Molecular Machines to Networks of Excitable Cells”, University of Göttingen, Göttingen, Germany
Fluoride has been used in the internal recording solution for manual and automated patch clamp experiments for decades because it helps to improve the seal resistance and promotes longer lasting recordings. In manual patch clamp, fluoride has been used to record voltage-gated Na (NaV) channels where seal resistance and access resistance are critical for good voltage control. In automated patch clamp, suction is applied from underneath the patch clamp chip to attract a cell to the hole and obtain a good seal. Since the patch clamp aperture cannot be moved to improve the seal like the patch clamp pipette in manual patch clamp, automated patch clamp manufacturers use internal fluoride to improve the success rate for obtaining GΩ seals. However, internal fluoride can affect voltage-dependence of activation and inactivation, as well as affecting internal second messenger systems and therefore, it is desirable to have the option to perform experiments using physiological, fluoride-free internal solution. We have developed an approach for high throughput fluoride-free recordings on a 384-well based automated patch clamp system with success rates >40% for GΩ seals. We demonstrate this method using hERG expressed in HEK cells, as well as NaV1.5, NaV1.7, and KCa3.1 expressed in CHO cells. We describe the advantages and disadvantages of using fluoride and provide examples of where fluoride can be used, where caution should be exerted and where fluoride-free solutions provide an advantage over fluoride-containing solutions.
Introduction
Automated patch clamp (APC) instruments are used for a wide variety of applications ranging from basic research into channelopathies and biophysical characteristics of ion channels, through to routine cardiac safety testing (Obergrussberger et al., 2021, 2022). Their use in cardiac safety screening has increased over the years and APC is now an established and accepted technique in most, if not all, safety testing laboratories. It is well-known that fluoride is often used in the internal solution in APC experiments to improve the seal resistance (Zeng et al., 2008) when external calcium (or other divalent cation) are present (Milligan et al., 2009; Obergrussberger et al., 2014, 2018). The mechanism is thought to involve the formation of CaF2 crystals at the interface between the pipette or micro-pore and the cell as described in a recent patent application (Lojkner et al., 2019). Even in manual patch clamp experiments, fluoride has been used to record NaV channels for over 20 years (Cummins et al., 1999; Renganathan et al., 2000; Rugiero et al., 2003), despite known shifts in activation and steady-state inactivation curves of NaV1.9 (Rugiero et al., 2003; Coste et al., 2004), effects on the voltage dependence of conductance and steady-state inactivation of NaV1.7 (Jarecki et al., 2008), shifts in activation and inactivation of NaV1.3 (Meadows et al., 2002), and effects on persistent current of NaV1.3 (Chen et al., 2000). These effects on biophysical properties are not limited to NaV channels, high concentrations of fluoride have been shown to increase mean open duration, and thereby open probability of L-type calcium channels (Ono and Arita, 1999), and influences current amplitude and inactivation of KV1.3 and K2P channels (Herrmann et al., 2020). In addition to effects on biophysical properties of ion channels, fluoride binds to calcium making its use in experiments involving activation of ion channels by internal free calcium somewhat limited, and itself activates certain ion channels such as CFTR (Berger et al., 1998). It is also well-known that fluoride activates G-proteins when complexed with Al3+ present in trace amounts (Li, 2003) and inhibits protein phosphatase (Khatra and Soderling, 1978). Fluoride is used because it improves the seal and allows stable measurements to be performed over long periods of time (Zeng et al., 2008; Föhr et al., 2021). Alternative internal solutions which do not contain fluoride for recording CFTR (Billet et al., 2017; Froux et al., 2020; Becq et al., 2021) or TMEM16A (Obergrussberger et al., 2018) have been used successfully on automated patch clamp devices, but the solutions were not always physiological.
In most experiments run on automated patch clamp instruments, the use of fluoride in the internal solution is no problem, particularly when like is compared with like, i.e., activation and inactivation plots of NaV channels are always run using internal fluoride. However, there may be some cases where fluoride-free, physiological solutions are required, for example, when comparing data with historical data which was recorded in fluoride-free solutions. Alternatively, it may be the case that fluoride cannot be used because of activation of ion channels, inhibition of phosphatase or binding of calcium ions. For these reasons, we have developed a method for high throughput APC experiments using the SyncroPatch 384 which allow fluoride-free, physiological solutions to be used with good success rates for GΩ and sub-GΩ seals. We demonstrate this using the ion channels NaV1.5 and NaV1.7 expressed in CHO (Charles River), hERG expressed in HEK293 (SB Drug Discovery), and KCa3.1 (SK4) also expressed in CHO cells (Charles River). Additionally, preliminary experiments using human induced pluripotent stem cell-derived cardiomyocytes (hiPSC-CMs) were also performed.
Materials and methods
Cell culture and harvesting
The cell lines used here (hERG stably expressed in HEK 293 cells from SB Drug Discovery, Glasgow, United Kingdom, hNaV1.5; hNaV1.7, and KCa3.1 stably expressed in CHO cells all from Charles River, United States) were cultured as previously described (Brueggemann et al., 2004; Brüggemann et al., 2008; Becker et al., 2013; Obergrussberger et al., 2014). In brief, these cells were cultured in T175 culture flasks in the media recommended by the supplier and passaged every 2–3 days when they were 50–80% confluent. The cells were passaged regularly to ensure that the cells were single when passaged and harvested. The cells were prohibited from reaching 100% confluency so that they remained healthy, single, and expressed the ion channel of interest when they were harvested into a cell suspension for recordings. hiPSC-derived cardiomyocytes were generated and cultured as previously described (Seibertz et al., 2022). Briefly, hiPSC cell line UMGi014-C.14 was derived from dermal fibroblasts of healthy male donor and the reprogramming to iPSCs was achieved using integration-free CytoTune iPS 2.0 Sendai Reprogramming Kit (Thermo Fisher Scientific) with the reprogramming factors OCT4, KLF4, SOX2, c-MYC. Directed differentiation into ventricular iPSC-CMs was performed via WNT signaling modulation and subsequent metabolic selection, as previously described (Kleinsorge and Cyganek, 2020). hiPSC-CMs were cultured at 37°C in 5% CO2 in a RPMI Medium 1640 (1X) + GlutaMax™ –I [+] 25 mM HEPES (Thermo Fisher Scientific) supplemented with B-27 (Thermo Fisher Scientific). Experiments were performed on hiPSC-CMs at day 41 post differentiation. All protocols were approved by the Ethics Committee of the University Medical Center Göttingen (No. 10/9/15 and 15/2/20). For experiments on the SyncroPatch 384, cells were harvested into suspension and suction was used to attract a cell to the patch clamp aperture of each well. Since it was a blind method for capture, cells had to be single with few clusters and the cell suspension was free from cell debris, as the presence of cell clusters and debris can decrease the success rate. Cell harvesting was performed as described previously (Brueggemann et al., 2004; Brüggemann et al., 2008; Becker et al., 2013; Obergrussberger et al., 2014) using TrypLE, other suitable enzymes, or even enzyme-free detachment protocols. Cells were then resuspended in extracellular recording solution at a density of ∼500,000 cells/ml.
Automated patch clamp electrophysiology
All cells were recorded in the whole cell mode of the patch clamp technique using the SyncroPatch 384 (Nanion Technologies, Munich, Germany). Electrophysiological protocols were constructed, and data digitized using PatchControl 384 (Nanion Technologies, Munich, Germany). Cells were recorded on both single-hole NPC-384 or NPC-384FF chips with medium or high resistance (4–5.5 or 5–7 MΩ, respectively). In a subset of experiments involving KCa3.1 multi-hole chips with 4 holes (NPC-384/NPC-384FF) 4X high resistance (2.2–3.2 MΩ) per well were used. Cells were harvested into suspension and added to the CellHotel of the SyncroPatch 384 where they were kept at 10°C, shaking at 200 rpm, until used for the experiment. The NPC-384 or NPC-384FF chips were filled with internal solution as indicated in Table 1 and ChipFill external solution. After cells were captured (indicated by an increase in RSeal > 10 MΩ), a brief, transient addition of external solution containing 6 mM Ca2+ was made when standard internal solution and NPC-384 chips were used which was then exchanged to external recording solution before commencement of recordings. When fluoride-free internal solution and NPC-384FF chips were used, the ChipFill external solution was replaced by external recording solution (Table 1) after cells were captured.
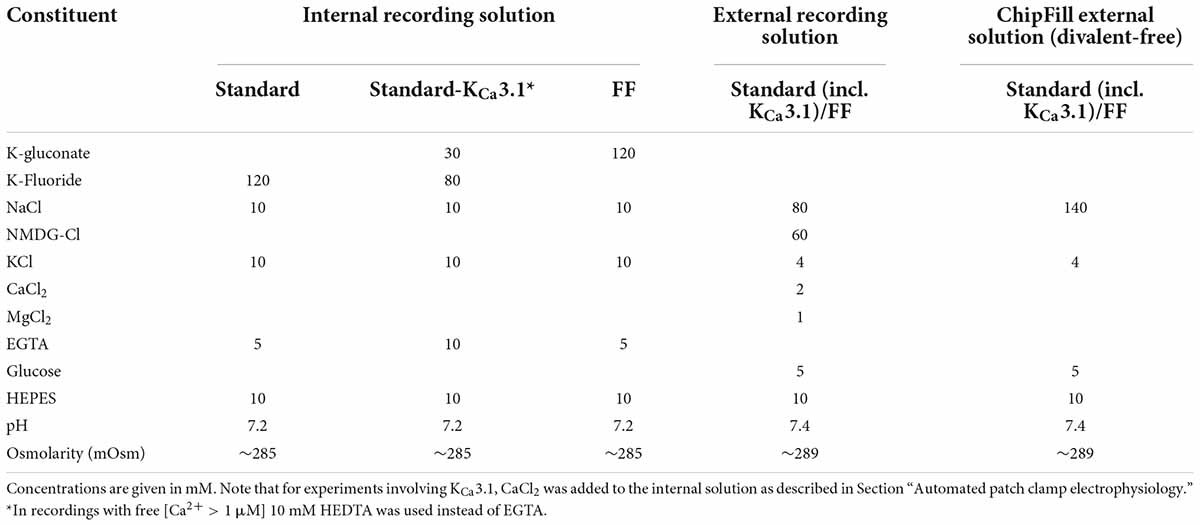
Table 1. Composition of recording solutions for fluoride-containing (referred to as standard internal) and fluoride-free (referred to as FF internal) experiments.
hERG currents were recorded using a double step voltage protocol from a holding potential of −80 mV to +60 mV for 500 ms followed by a step to −40 mV for 500 ms repeated every 15 s. Peak amplitude was measured at the start of the second voltage step (ITail). Current-voltage relationships were recorded using the same voltage-step to +60 mV, but then followed by voltage steps from −120 to 60 mV with 10 mV increments.
NaV1.5 currents were measured using a 3-step protocol, the first step from −120 to 0 mV, the second step from −100 to 0 mV and the 3rd step from −80 to 0 mV, repeated every 10 s. Current-voltage (IV) relationships were recorded using the voltage-step protocol: For the activation IV, a step pulse of 30 ms was applied, starting from −70 mV and increasing in 10 mV increments up to 40 mV with every sweep, at a sweep interval of 2 s. For analysis, the current response to each step was normalized to the cell’s peak current before averaging across all cells. Holding potential was −120 mV.
The inactivation IV pulse protocol consisted of a 500 ms pre-pulse, starting from −100 mV and increasing in 5 mV increments with every sweep up to 20 mV, followed by a 50 ms depolarizing step to 0 mV, at a sweep interval of 5 s. For analysis, each of the current responses to the 50 ms step to 0 mV was normalized to the current response to the 0 mV step following the 500 ms pre-pulse at −120 mV before averaging across all cells. Holding potential was −120 mV.
KCa3.1 was recorded using a voltage ramp protocol from −120 to +60 mV over 198 ms, intersweep holding potential was −80 mV and sweep interval was 5 s. KCa3.1 was activated by internal perfusion of free calcium at 0.3, 1, or 3 μM calculated using Cabuf (freeware from KU Leuven, Belgium).
CaV currents from hiPSC-CMs were recorded using a voltage ramp-step protocol, with a ramp from −80 to −40 mV over 300 ms followed by a step from −40 to 0 mV for 100 ms, holding potential was −80 mV. The ramp section of the protocol was used to inactivate NaV currents. Only the current response to the step to 0 mV is shown in the figure for hiPSC-CMs.
Each well of the SyncroPatch 384 has an individual headstage of the amplifier and, therefore, each well is denoted as n = 1. For success rate and IC50 values across plates, n represents results from 1 NPC-384 chip. With PatchControl 384, parameters such as seal resistance, capacitance and series resistance were determined from each well after application of a test pulse. All parameters are monitored over time and can be recorded for individual experiments.
Method of using fluoride-free physiological solutions on the SyncroPatch 384
To allow for fluoride-free recordings, a combinatory approach is adopted on the SyncroPatch 384 consisting of the usage of a specialized, fluoride-free consumable called NPC-384FF in combination with a proprietary, fully automated method for preparing the NPC-384FF prior to execution of the fluoride-free recording. The automated method of NPC-384FF preparation is available on all SyncroPatch 384 devices.
Quality control parameters
Cells had to pass quality control (QC) parameters to be included in the analysis. For some experiments RSeal > 1 GΩ whereas for other experiments RSeal > 0.25 GΩ was used for single- or equivalent in multi-hole chips. In addition to this, IPeak > 150 pA for hERG; IPeak < −100 pA for NaV1.5 or NaV1.7 and IPeak > 350 pA for single-hole chips and IPeak > 1000 pA for multi-hole chips (4X) for KCa3.1 was also used. In order to guarantee appropriate voltage clamp in our comparisons, the analysis of IV-relationships for NaV1.5 and NaV1.7 recordings included additional quality control parameters on capacitance > 2 pF, current size as well as Rseries that was constrained to −3.0 nA and 20 MΩ, respectively.
Automated patch clamp solutions
See Table 1.
Data analysis
The SyncroPatch 384 platforms have a software package consisting of PatchControl 384 (for data acquisition) and DataControl 384 (for data analysis; both Nanion Technologies, Munich, Germany). Current-voltage plots were calculated using DataControl 384 and fit with Boltzmann equations: for a sigmoidal fit for hERG IV and inactivation NaV1.5 and NaV1.7 IVs. In addition, an extended Boltzmann equation was used: to obtain Vhalf values for activation protocols for NaV1.5 and NaV1.7 where I(V) is the amplitude of the current and G(V) the conductance at voltage V, Erev is the reversal potential. Vhalf is the membrane potential at half-maximal activation or inactivation and Slope is the slope factor.
Concentration response curves were calculated using either cumulative additions or a single point addition approach. When cumulative additions were done, all concentrations of compound were added to each well, in increasing concentrations, and concentration response curves were calculated individually for each well. When single point additions were done, a single concentration of compound was added to each well and the IC50 was calculated across multiple wells. IC50 analysis was done with DataControl 384, concentration response curves were fit with a Hill equation:
Statistics
Data are presented as means ± S.D or means ± S.E.M. Differences between groups were tested using the Student’s t-test for normally distributed data. P-values are reported in the figures. N represents the number of wells examined or the number of chips as indicated in the figures and/or figure legends.
Results
High throughput automated patch clamp to assess effects of internal fluoride on success rate and seal resistance
In APC experiments, high success rates have been reported using internal solutions without fluoride for several targets, such as CFTR, with success rates for completed experiments > 80% (Billet et al., 2017; Brüggemann et al., 2017; Froux et al., 2020; Becq et al., 2021). However, when switching to more physiological solutions, such as K-chloride or K-gluconate-based internal solutions, success rates very rarely reach acceptable ranges for high throughput APC. In fact, under these conditions we observed 9.3 ± 6.1% (RSeal > 1 GΩ + ITail > 150 pA) and 18.6 ± 6.3% (RSeal > 0.25 GΩ + ITail > 150 pA) using hERG expressed in HEK cells (n = 16 NPC-384 chips), in agreement with success rates reported by Zeng et al. (2008). This has posed a limitation in the use of fluoride-free, physiological internal solutions for high throughput APC and was the basis for the development of a special type of consumable, the NPC-384FF, which we have used throughout this study to allow the usage of K-gluconate (or K-chloride) or fluoride-based internal solutions under the same experimental conditions.
First, we evaluated the success rates for seal formation for fluoride-free internal solution compared with standard, fluoride-containing, internal solution using two standard cell culture cell lines. HEK cells expressing hERG as wells as CHO cells expressing NaV1.5 channels were used on the SyncroPatch 384 using either NPC-384 chips and standard internal solution containing fluoride, or NPC-384FF chips with fluoride-free internal solution. For hERG, a classical double voltage-step protocol was used to record hERG tail currents and we determined the number of wells available for recording under both conditions. Using single-hole chips, HEK cells expressing hERG were recorded with a success rate of 77.9 ± 6.1% (n = 10 NPC-384 chips) for RSeal > 1 GΩ + ITail > 150 pA (at the start of the experiment) when standard K-fluoride was used in the internal solution and 35.9 ± 7.9% (n = 32 NPC-384FF chips) when K-gluconate was used in the internal solution (Figure 1A). The success rate increased to 87.2 ± 5.4% (n = 10 NPC-384 chips) in K-fluoride and 59.0 ± 8.5% (n = 32 NPC-384FF chips) in K-gluconate when a QC cutoff for RSeal > 0.25 GΩ + ITail > 150 pA was used. Despite the reduced number of available wells when fluoride-free solution was used, the sealing properties of the recorded cells only slightly differed in their RSeal distribution pattern as illustrated in the histograms (Figure 1C), however, a small, but significant reduction for mean RSeal values was observed (Table 2). Importantly, this did not have a large impact on the stability of the recording over time as only few cells were lost during the experiments and the success rate was similar at the end of the experiment (t = 15 min) as at the start of the experiment (Figure 1A). The differences in mean RSeal might be due to the fact that for the fluoride-free approach, the formation of CaF2 crystals is absent and no elevated external Ca2+ levels are used throughout the entire recording resulting in a reduced success rate. Similar results were observed using CHO cells expressing NaV1.5 channels where a 1-step voltage protocol was used to elicit NaV1.5 peak currents. Again, we first determined the number of available wells in single-hole chips (i.e., the number that passed the QC parameters for RSeal and IPeak) and for NaV1.5-CHO we observed a success rate of 78.0 ± 4.9% (n = 15 NPC-384 chips) for RSeal > 1 GΩ + IPeak < −100 pA (at the start of the experiment) when K-fluoride was used in the internal solution and 41.9 ± 8.6% (n = 17 NPC-384FF chips) when K-gluconate was used in the internal solution (Figure 1B). The success rate increased to 86.1 ± 6.4% (n = 15 NPC-384 chips) in K-fluoride and 55.0 ± 11.7% (n = 17 NPC-384FF chips) in K-gluconate when a QC cutoff RSeal > 0.25 GΩ + IPeak < −100 pA was used. In line with our results with hERG-HEK cells, we observed a similar RSeal distribution pattern for both conditions as illustrated in the histogram (Figure 1D) and a significant difference in mean RSeal values for CHO cells in standard and fluoride-free conditions (Table 3). Similar to hERG-HEK, success rates remained stable over the time course of the experiment, any differences can probably be also attributed to the absence of CaF2 crystal formation as described above. Taken together, the results from both standard cell culture cell lines (HEK293 or CHO) expressing either NaV1.5 or hERG channels suggest that the fluoride-free approach can be used as an alternative to fluoride-containing internal solution in automated patch clamp experiments with reduced, but acceptable success rates. Therefore, our aim was to minimize experimental variability (such as recording solutions, voltage protocols, recording temperature, expression system, and culturing conditions) and provide a systematic comparison of biophysical and pharmacological parameters for four different targets depending on the internal solutions used.
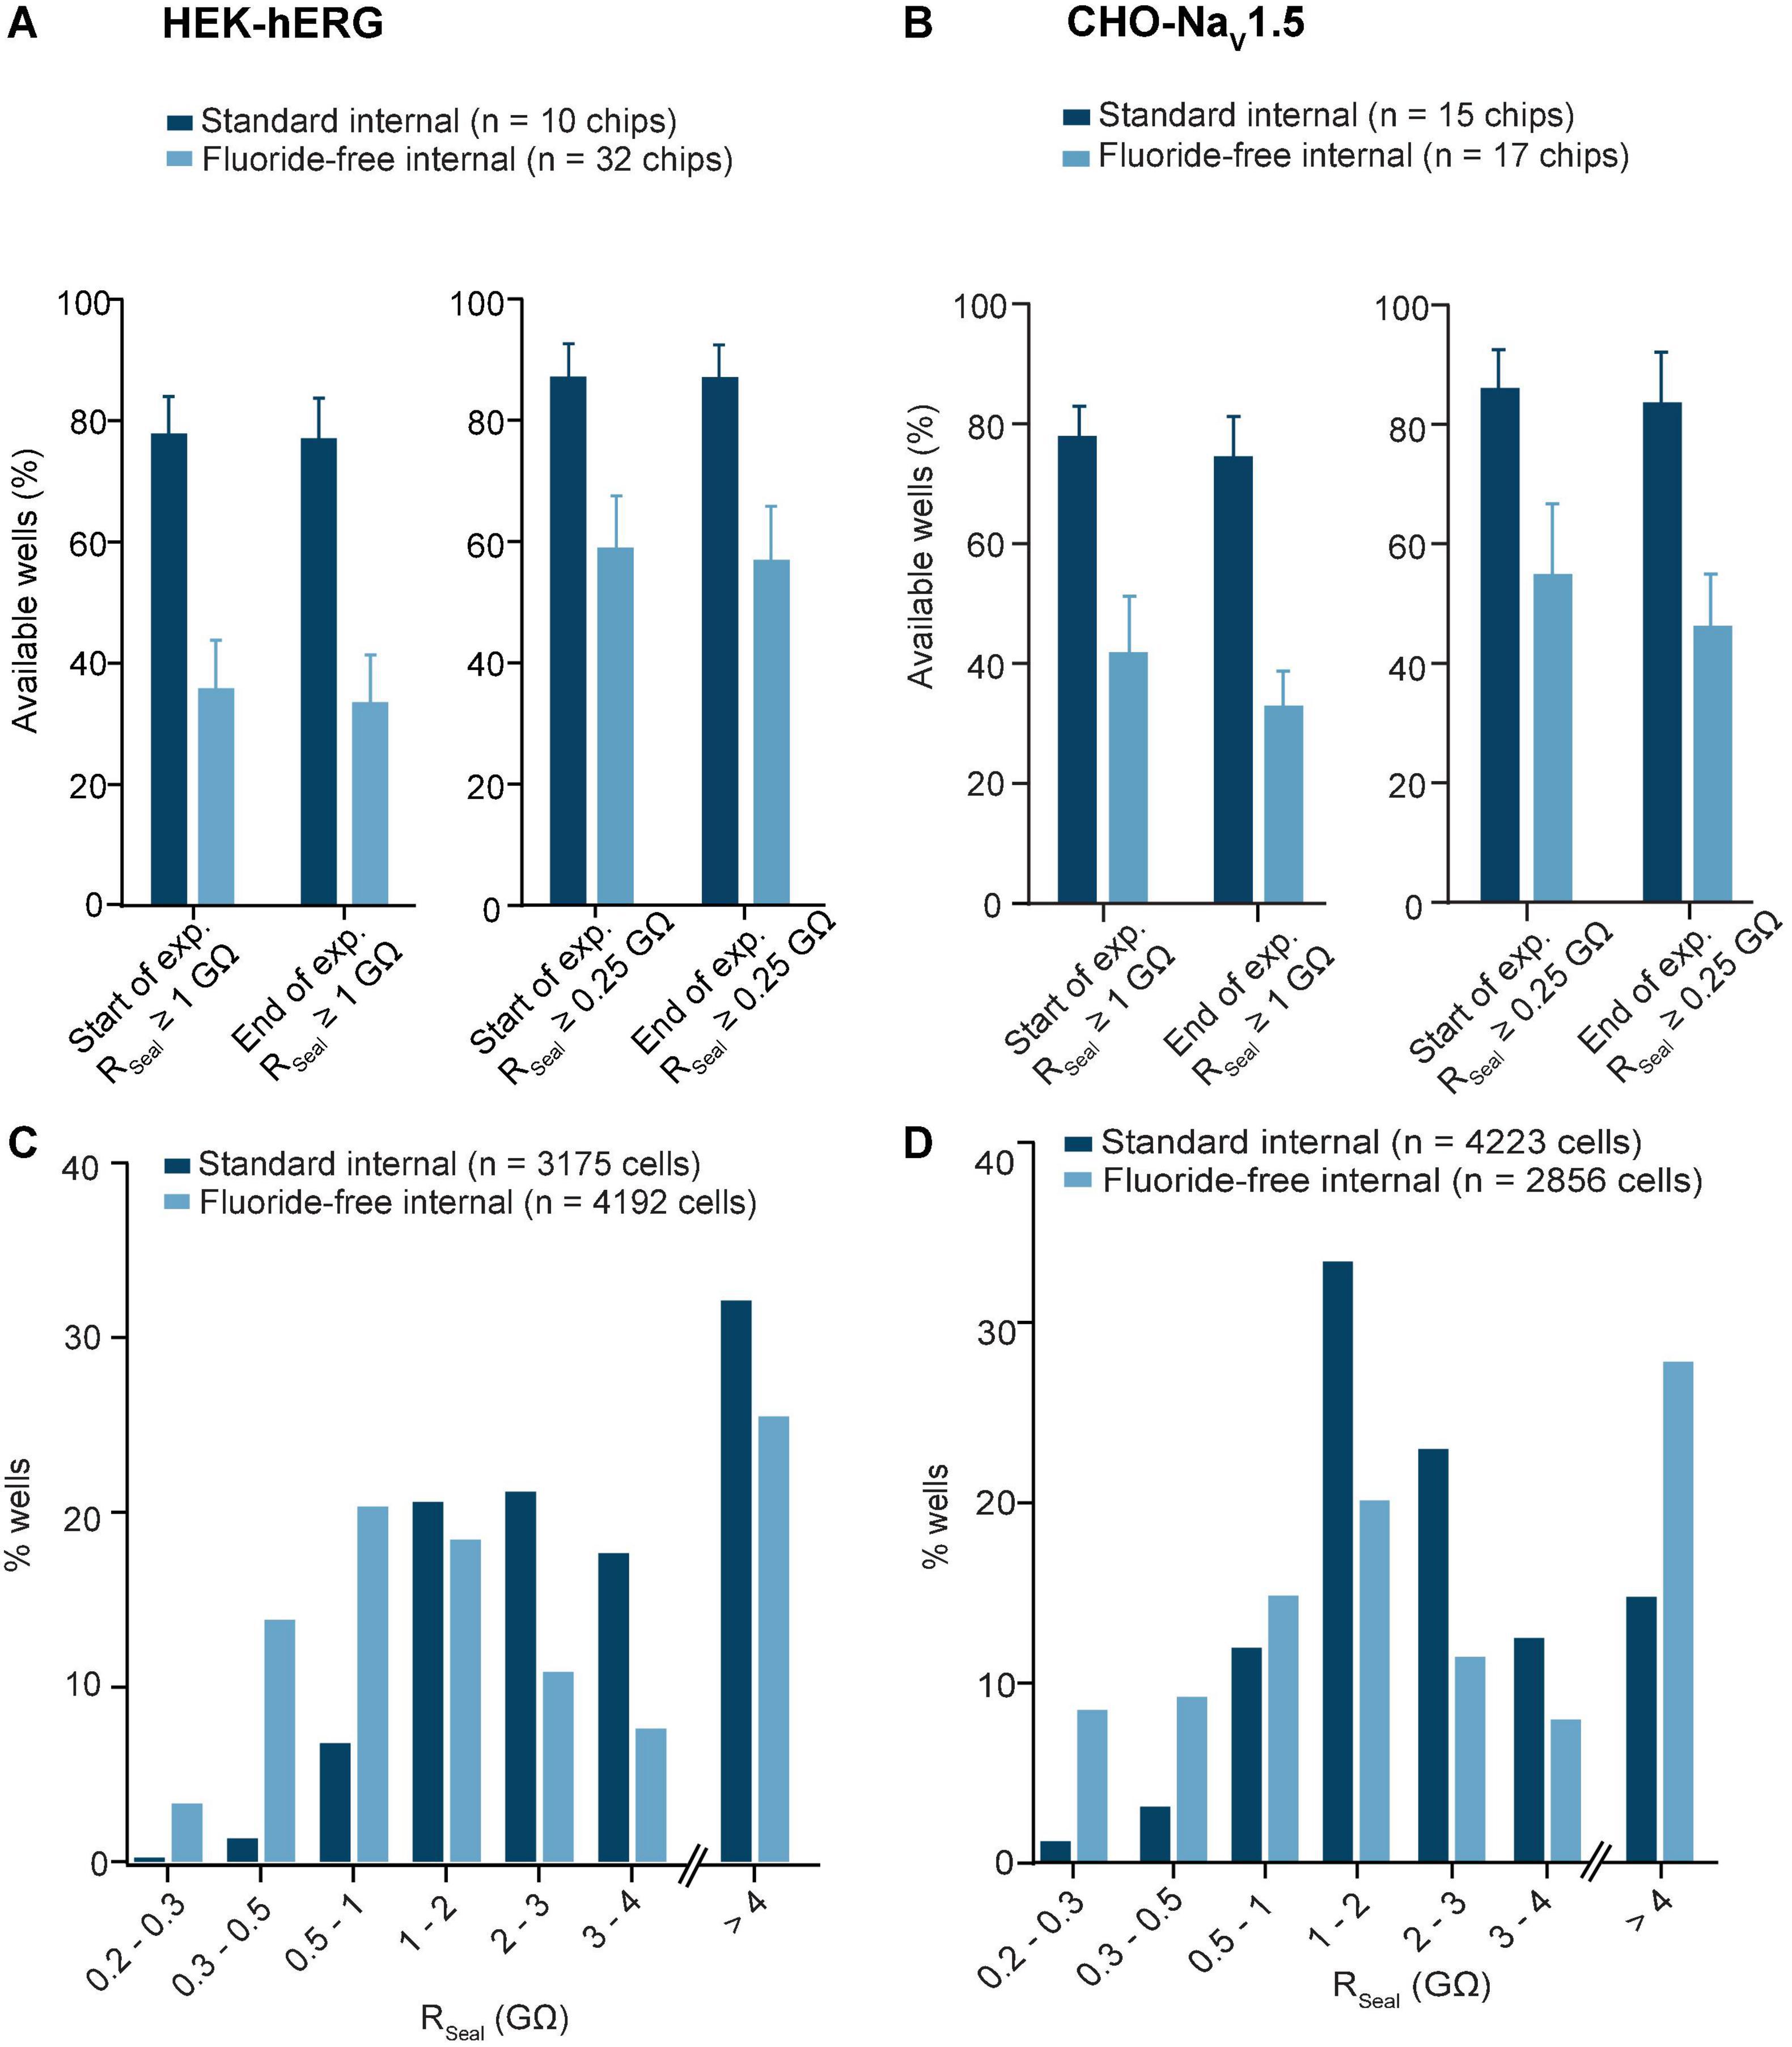
Figure 1. HEK and CHO cells recorded in standard and fluoride-free internal solution. (A) HEK cells expressing hERG were captured with almost 80% success rate for RSeal ≥ 1 GΩ + ITail > 150 pA and almost 40% success rate for RSeal ≥ 1 GΩ in fluoride-free internal solution (left). If a QC cutoff of RSeal ≥ 0.25 GΩ + ITail > 150 pA was used, the success rate was increased in both conditions (right). (B) CHO cells expressing NaV1.5 were captured with almost 80% success rate for RSeal ≥ 1 GΩ + IPeak < –100 pA and over 40% success rate for RSeal ≥ 1 GΩ in fluoride-free internal solution (left). If a QC cutoff of RSeal ≥ 0.25 GΩ + IPeak < –100 pA was used, the success rate was increased in both conditions (right). (C) Histogram plot of the RSeal values for HEK-hERG cells in standard and fluoride-free internal solution. For RSeal > 4 GΩ, although they are high giga-seals, the seal resistance is not accurately calculated and is therefore shown as an extra bar and these RSeal values were not included in the calculation for RSeal (Table 2). (D) Histogram plot of the RSeal values for CHO-NaV1.5 cells in standard and fluoride-free internal. For RSeal > 4 GΩ, although they are high giga-seals, the seal resistance is not accurately calculated and is therefore shown as an extra bar and these RSeal values were not included in the calculation for RSeal (Table 3).
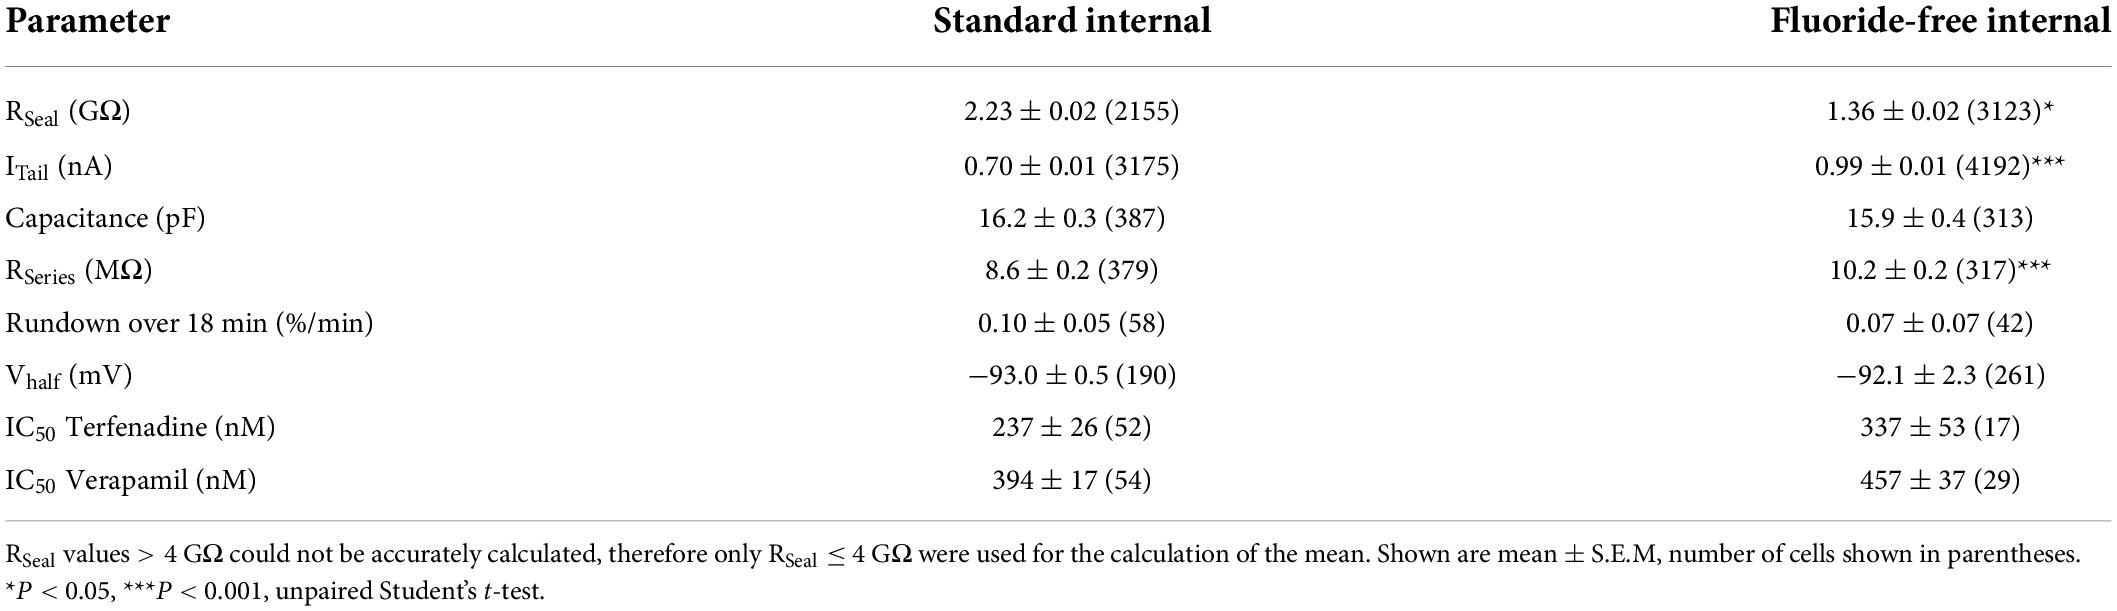
Table 2. Parameters for RSeal, ITail, cell capacitance, RSeries, Rundown, Vhalf, and IC50 values for HEK cells expressing hERG for standard internal and fluoride-free internal solution.
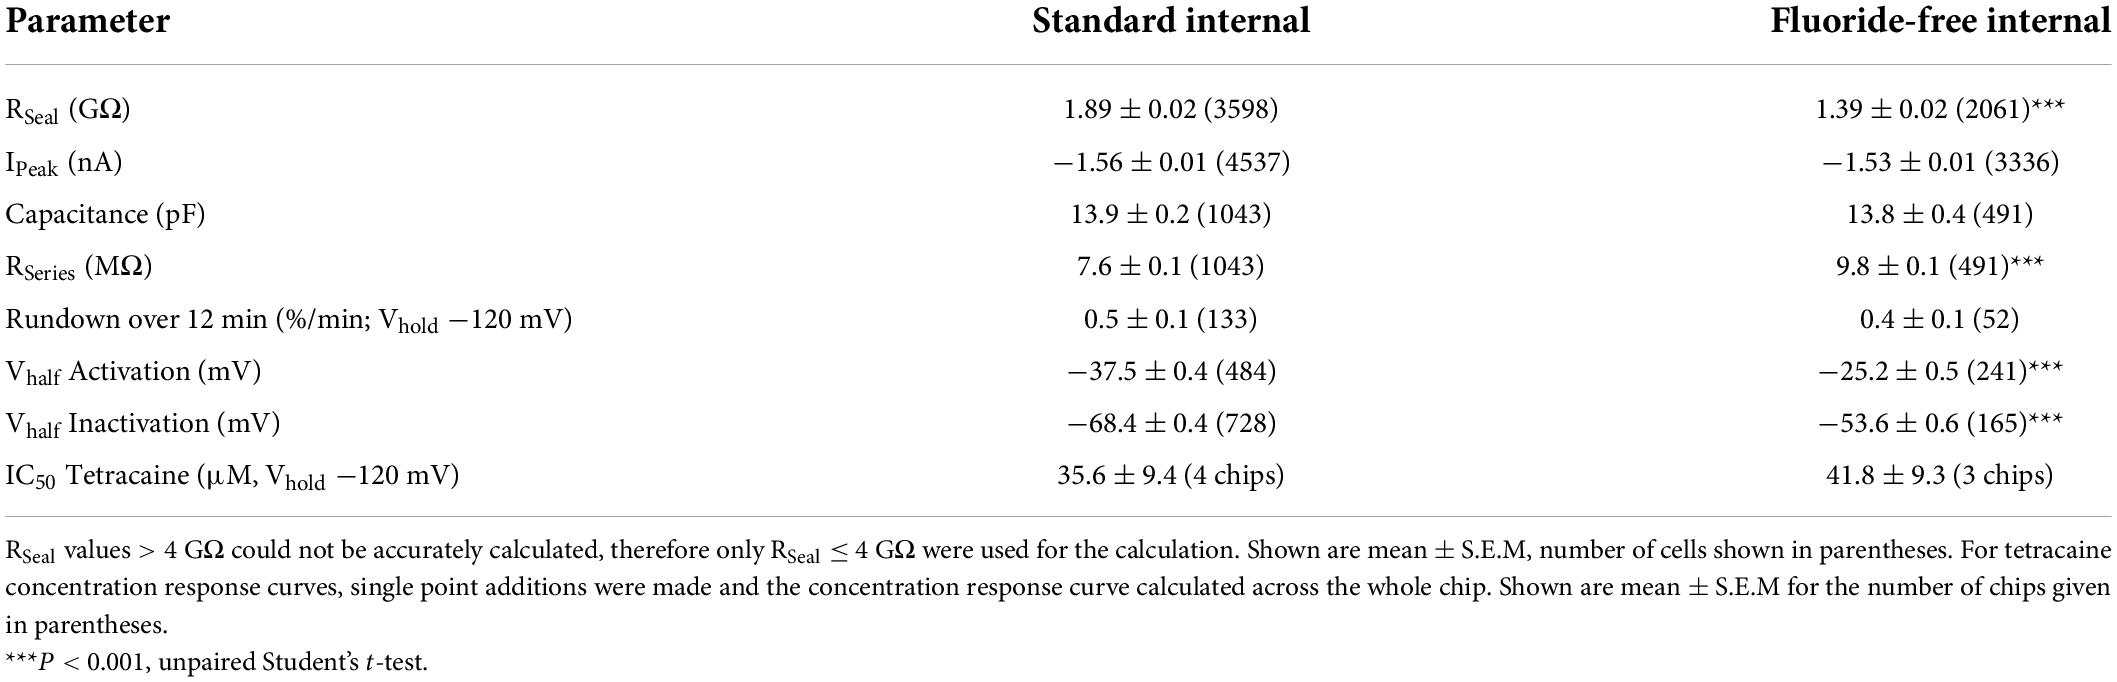
Table 3. Parameters for RSeal, IPeak, rundown, Vhalf Activation, Vhalf Inactivation, and tetracaine IC50 for CHO cells expressing NaV1.5 for standard internal and fluoride-free internal solution.
Effect of internal fluoride on currents, biophysical properties, and pharmacology of hERG expressed in HEK cells
From the hERG-HEK recordings shown in Figures 1A,C we also extracted peak current levels from available wells as displayed in the histogram (Figure 2A). Interestingly, the data showed a difference in the distribution pattern in line with a significantly higher mean peak current level when using fluoride-free solution (Table 2) and single-hole chips. To further understand this difference, we examined the IV relationship using a classical double step inactivation protocol with increasing voltages after initial depolarization to +60 mV using standard and fluoride-free internal solution (Figure 2B) and found a similar IV-relationship that started to deviate for voltages more positive to −40 mV (Figure 2C). The currents were therefore normalized to −40 mV and fitted with a standard Boltzmann equation and resulted in Vhalf values of −93.0 ± 0.5 mV (n = 190 cells) for standard and −92.1 ± 2.3 mV (n = 201 cells) for fluoride-free internal solution with the data pools found to be not significantly different (Figures 2C,D and Table 2). The results imply that voltage dependence per se does not account for the difference in peak current level observed when fluoride-free solution was used. We can also rule out differences in cell size or access resistance as capacitance values were the same in both conditions and Rseries values were only slightly (but significantly) different (Table 2). Furthermore, the recordings were always performed in a comparable way on the same day using the same cells, recording temperature, external solution, and voltage protocol, with the only difference being the internal solution (standard or fluoride-free). This excludes any errors that may have arisen due to different recording conditions. Therefore, the reasons for the differences in increased currents in fluoride-free solution is unclear and further studies, such as detailed IV properties and a kinetic analysis, are required to elucidate the underlying reasons.
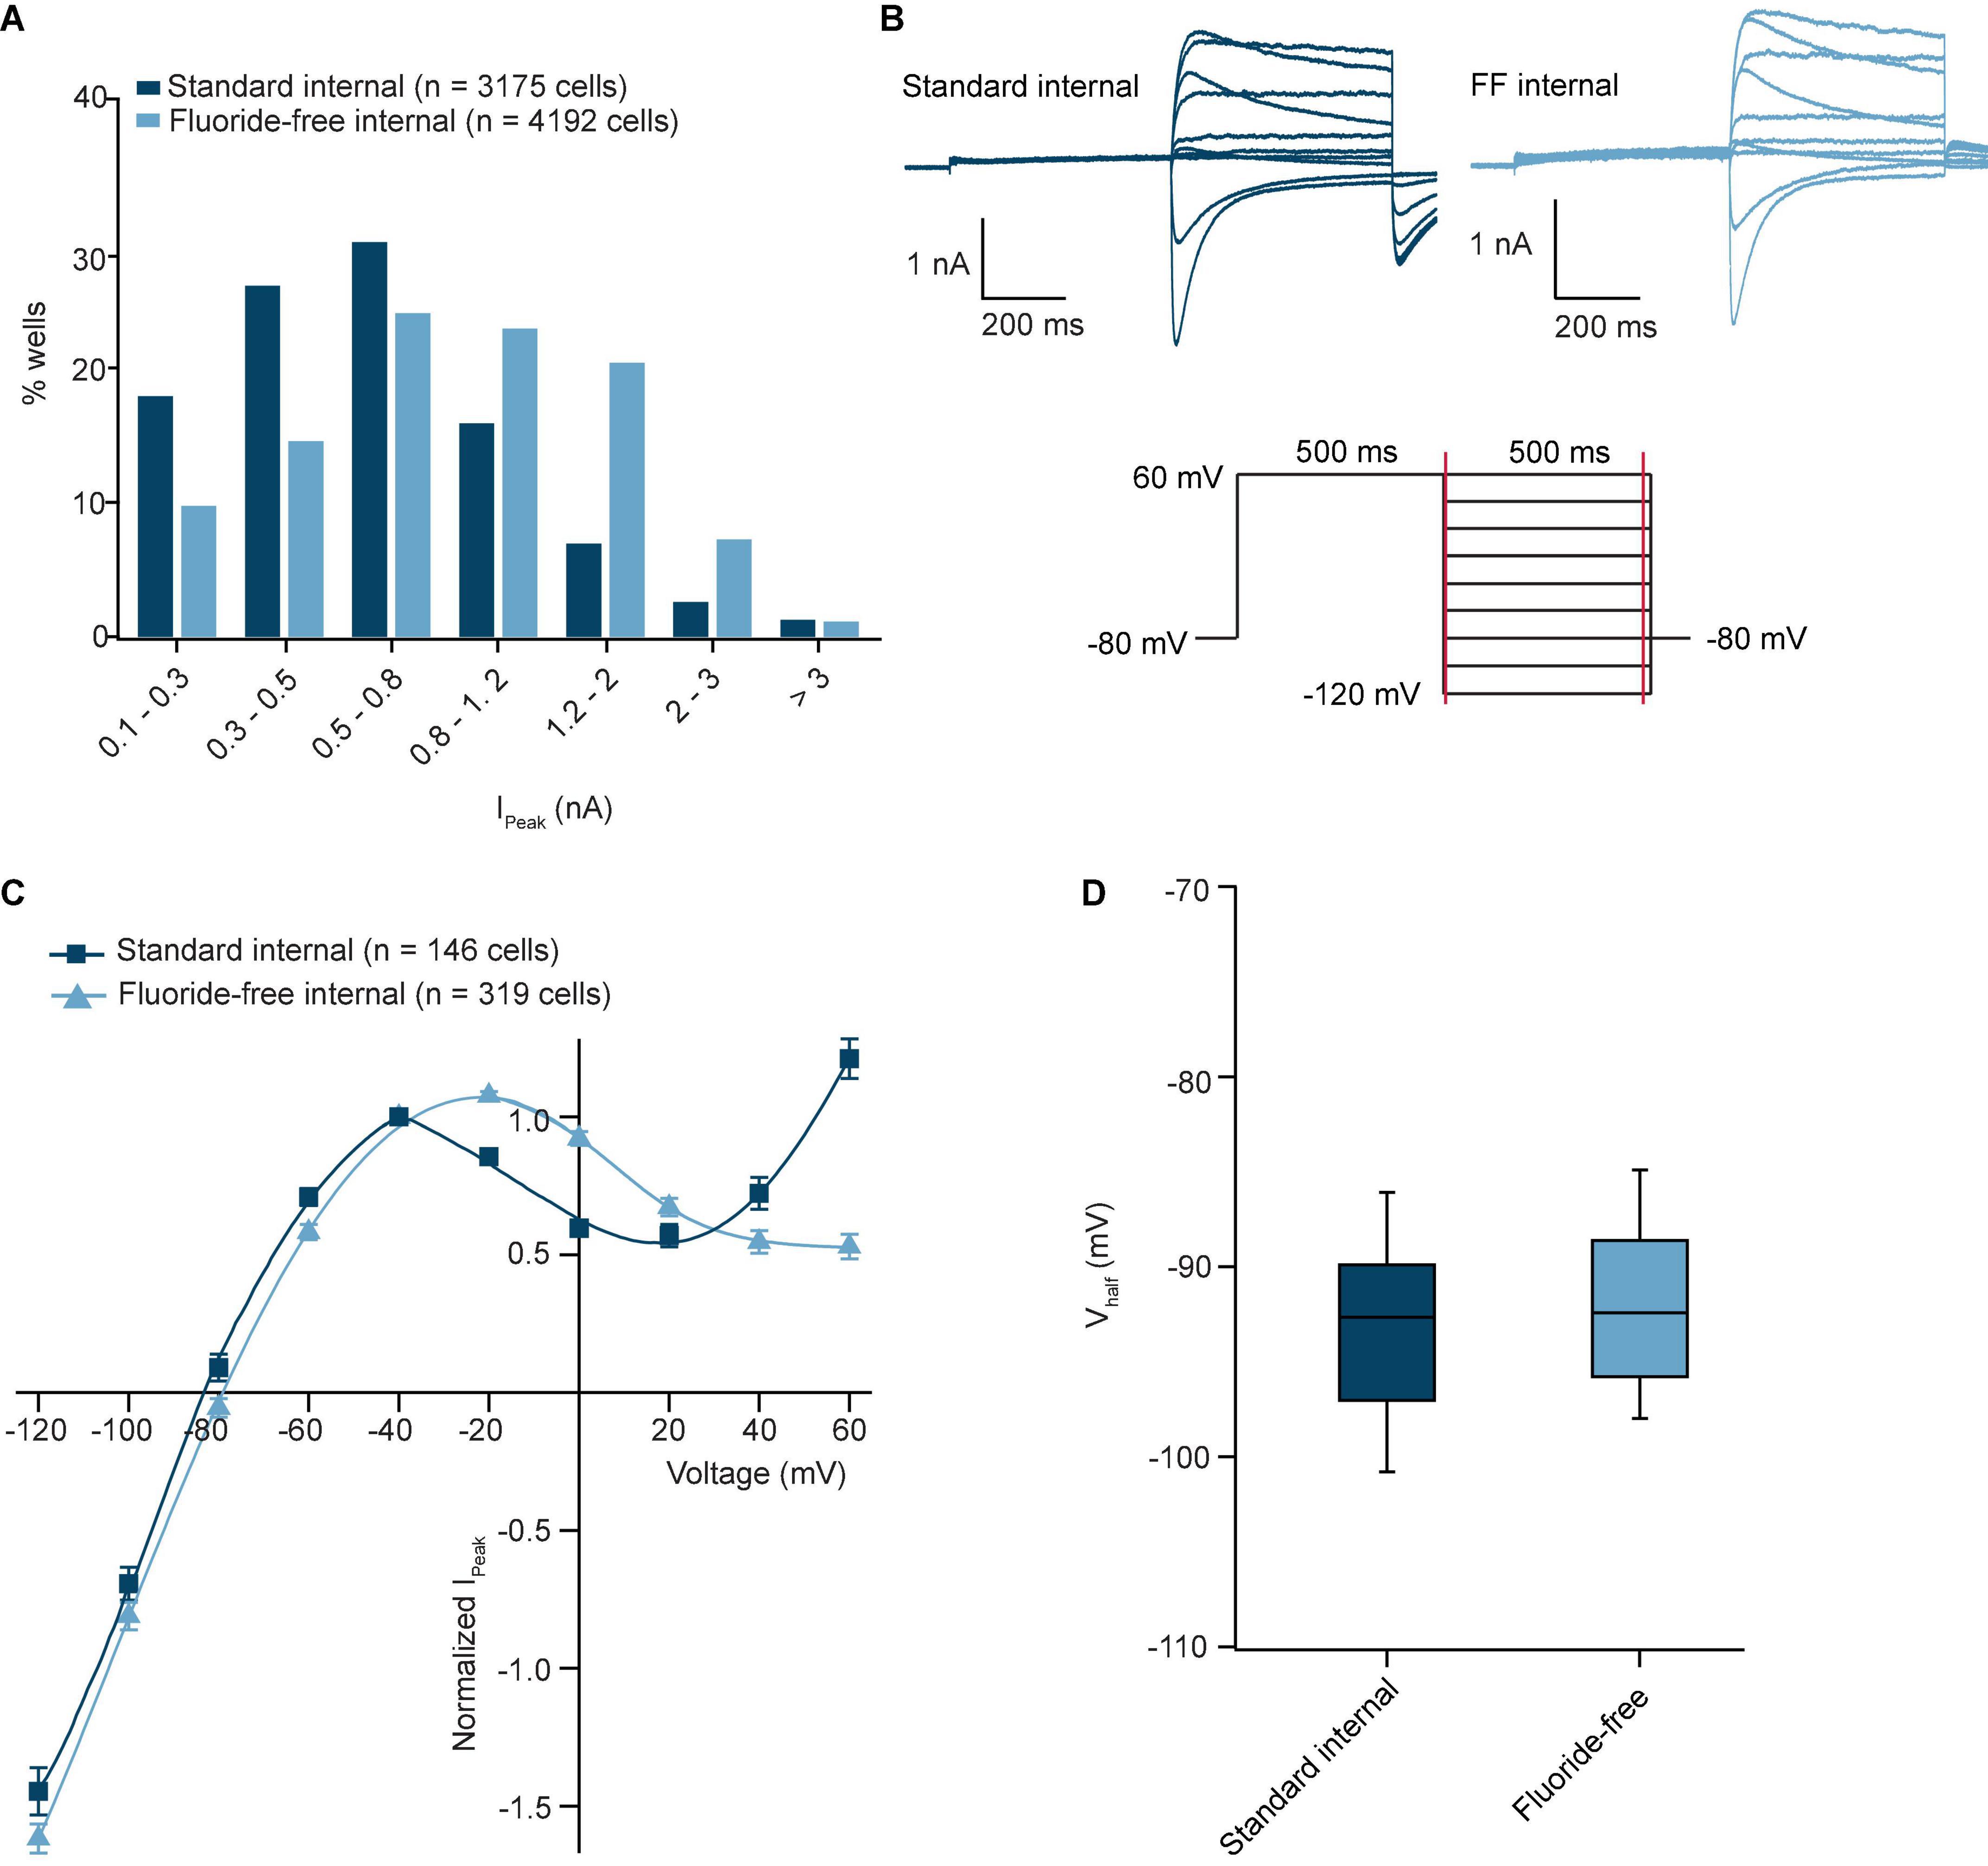
Figure 2. hERG currents in standard internal and fluoride-free internal solution. (A) Histogram plot of IPeak values for standard internal and fluoride-free internal. There was a tendency to higher peak amplitudes in fluoride-free internal solution vs. standard internal. (B) Current-voltage traces of hERG using standard internal (left) and fluoride-free internal (right). The voltage protocol is shown underneath. (C) IV curves for an average of 146 cells in standard internal and 319 cells in fluoride-free solution are shown overlaid. A standard Boltzmann equation (see Section “Data analysis”) was used to fit the curve from –120 to –20 mV. (D) Vhalf values for hERG recorded in standard internal and fluoride-free internal. The Vhalf values of 190 cells in standard internal and 261 cells in fluoride-free internal were not significantly different using a Student’s t-test (P > 0.05).
To investigate the influence of internal fluoride on the pharmacology of hERG channels we compared the IC50s of verapamil and terfenadine in the presence and absence of internal fluoride. Figures 3A,B show traces from an example cell in the presence of increasing concentrations of verapamil in standard and fluoride-free internal solution, respectively. Figures 3C,D show the time course of the experiment for ITail current (at −40 mV) plotted over time using either standard (Figure 3C) or fluoride-free internal solution (Figure 3D) for an average of 54 and 11 cells, respectively. Also shown in Figures 3C,D is the vehicle control (0.3% DMSO, n = 58 cells for standard internal solution and 12 cells for fluoride-free internal) where rundown was low for both groups, <2% over 18 min (Table 2) indicating ITail current amplitude was stable regardless of internal solution used (P = 0.7, Student’s t-test). hERG was blocked by verapamil in a concentration-dependent manner with similar IC50s and the concentration-response curves overlaid almost exactly (Figure 3E, for terfenadine, see Supplementary Figure 1). The spread of IC50s for terfenadine and verapamil was higher when fluoride-free internal solution was used (Figure 3F) but the IC50s were not different to those recorded in standard internal solution (Figure 3F and Table 2). Taken together, despite differences in tail current amplitude, hERG channel voltage dependence of inactivation, recording stability (rundown) as well as pharmacology for the compounds tested seem independent of whether fluoride-free or standard internal solution was used, which has also been suggested by other studies (Zeng et al., 2008) implying that the effect of internal fluoride might not be generalized per se and rather depends on subtype specific modulation of ion channel activity.
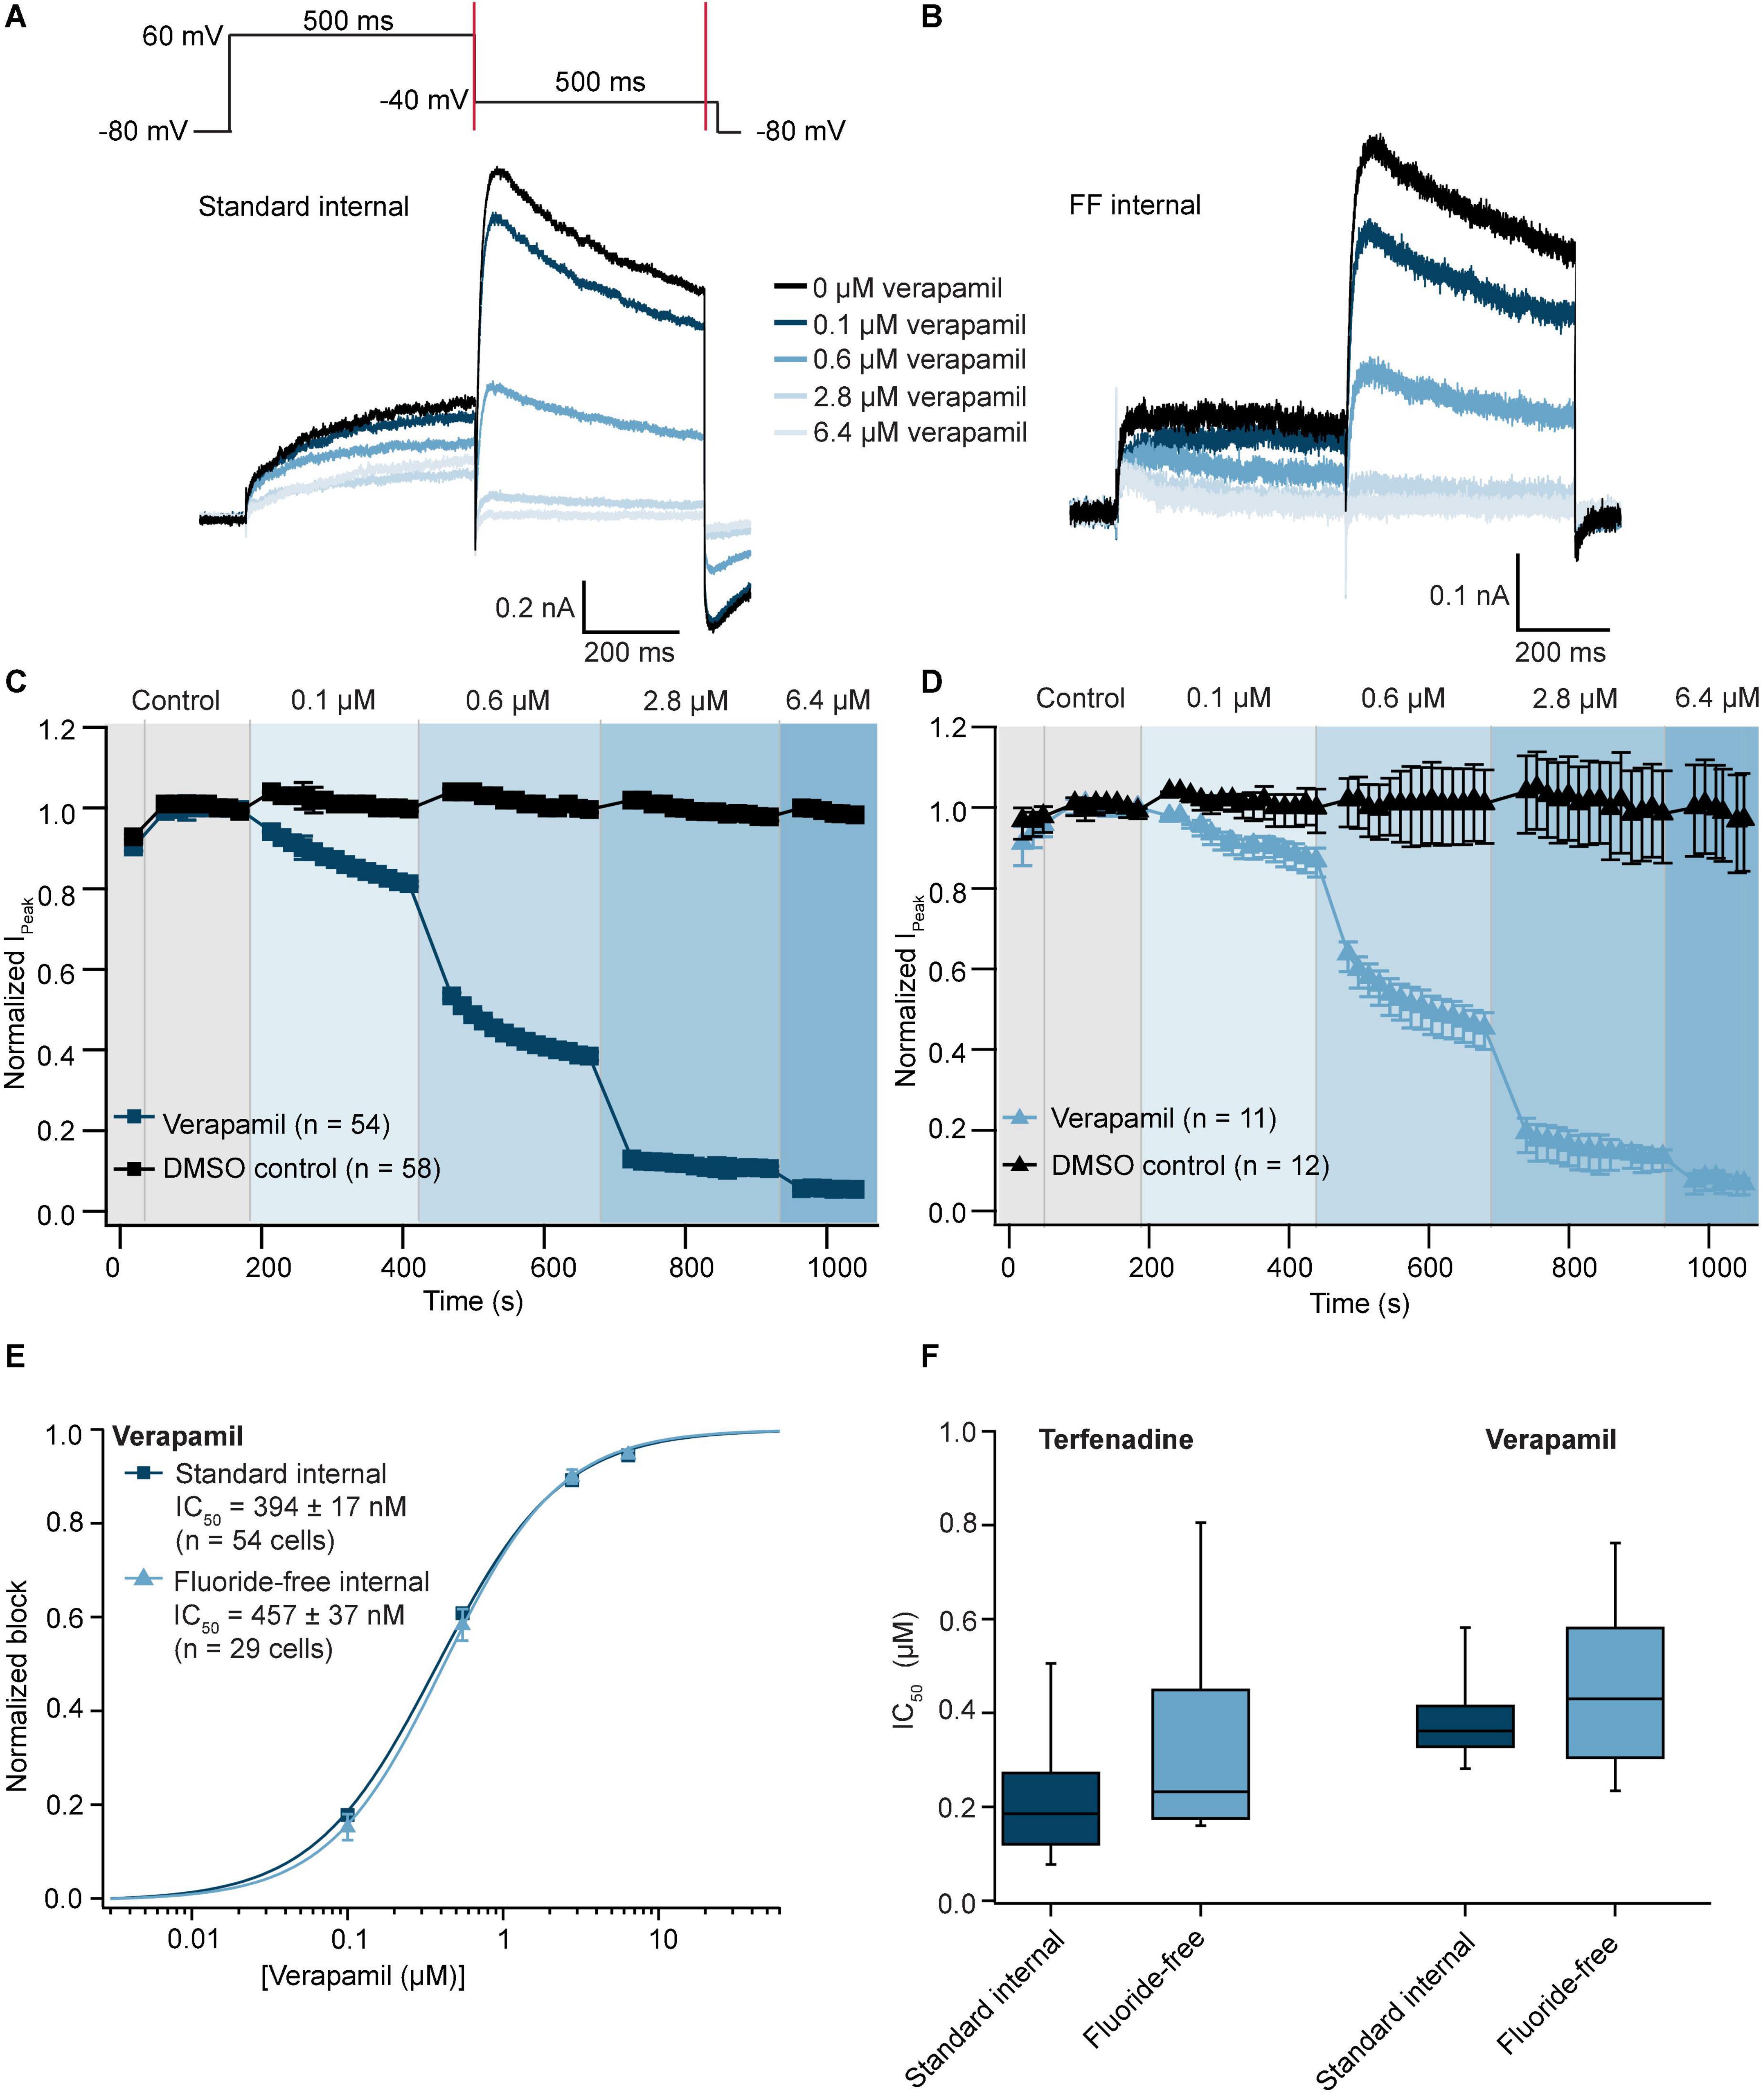
Figure 3. Pharmacology of hERG recorded in standard and fluoride-free internal solution. (A,B) Raw current traces from an example HEK cell expressing hERG recorded in standard internal (A) and fluoride-free internal (B) solution was blocked by increasing concentrations of verapamil [voltage protocol is shown at the top of panel (A)]. (C) Corresponding time course of block by verapamil in standard internal (C) and fluoride-free internal (D), 54 or 11 cells, respectively. Time course of 58/12 cells in DMSO control is also shown within panels (C,D). (E) Concentration response curve for verapamil in standard internal solution or fluoride-free solution are shown overlaid. (F) IC50s for terfenadine and verapamil recorded using standard internal or fluoride-free internal solution are shown as a box plot. The IC50s for verapamil and terfenadine recorded in standard internal or fluoride-free internal solution were not significantly different using a Student’s t-test (P > 0.05).
Effect of internal fluoride on seal resistance, stability, biophysics, and pharmacology of NaV1.5 expressed in CHO cells
From the experiments shown in Figures 1B,D, the peak current levels from available wells are displayed in Figure 4A as a histogram. In contrast to experiments involving hERG, the data showed a very similar distribution pattern consistent with a mean peak current amplitude that was not significantly different between the two groups (P = 0.2, Student’s t-test; Table 3). Furthermore, currents were stable during the time course of the experiment for both groups, with current rundown < 2% over ∼12 min (Table 3). Next, we investigated the effect of internal fluoride on the voltage dependence of activation and fast inactivation. Looking at the literature, there is a relatively large variability in Vhalf values reported for NaV1.5 due to different experimental parameters including voltage protocol, recording solutions, co-expression with β-subunits, recording temperature, holding potential, or cell expression system, the values range from −25 mV (Liu et al., 2003) to −50 mV (McNulty and Hanck, 2004). For this reason, we kept all experimental parameters the same, and only changed the internal solution in order to examine only the effect of fluoride on the Vhalf of activation and inactivation of NaV1.5. Figure 4B shows the voltage protocols used for activation and inactivation of NaV1.5 channels with example traces for both conditions. The results of these experiments are illustrated in Figures 4C,D where the Vhalf of activation was −25.2 ± 0.5 mV (n = 241) for fluoride-free and -37.5 ± 0.4 mV (n = 484) for standard internal solution. A similar difference was observed for the Vhalf of inactivation with −53.6 ± 0.6 mV (n = 165) in fluoride-free and −68.4 ± 0.4 mV (n = 728) using standard internal solution. There is a clear hyperpolarizing effect of fluoride on the voltage sensitivity of NaV1.5 channels which is highlighted in the boxplots shown in Figure 4D with ∼12 mV difference for Vhalf of activation and ∼15 mV for Vhalf of inactivation. Using the same voltage protocols as highlighted in Figure 4B we observed a similar hyperpolarizing shift for voltage activation/inactivation of NaV1.7 expressed in CHO cells when standard K-fluoride internal solution was used. This suggests a common phenotype for the shift of voltage activation/inactivation in NaV1.5 and NaV1.7 channels, however, further studies would be required to confirm whether other members of the NaV family are affected in a same manner. In fact, a previous report indicates sub-type specific differences associated with the use of internal fluoride solutions (Coste et al., 2004).
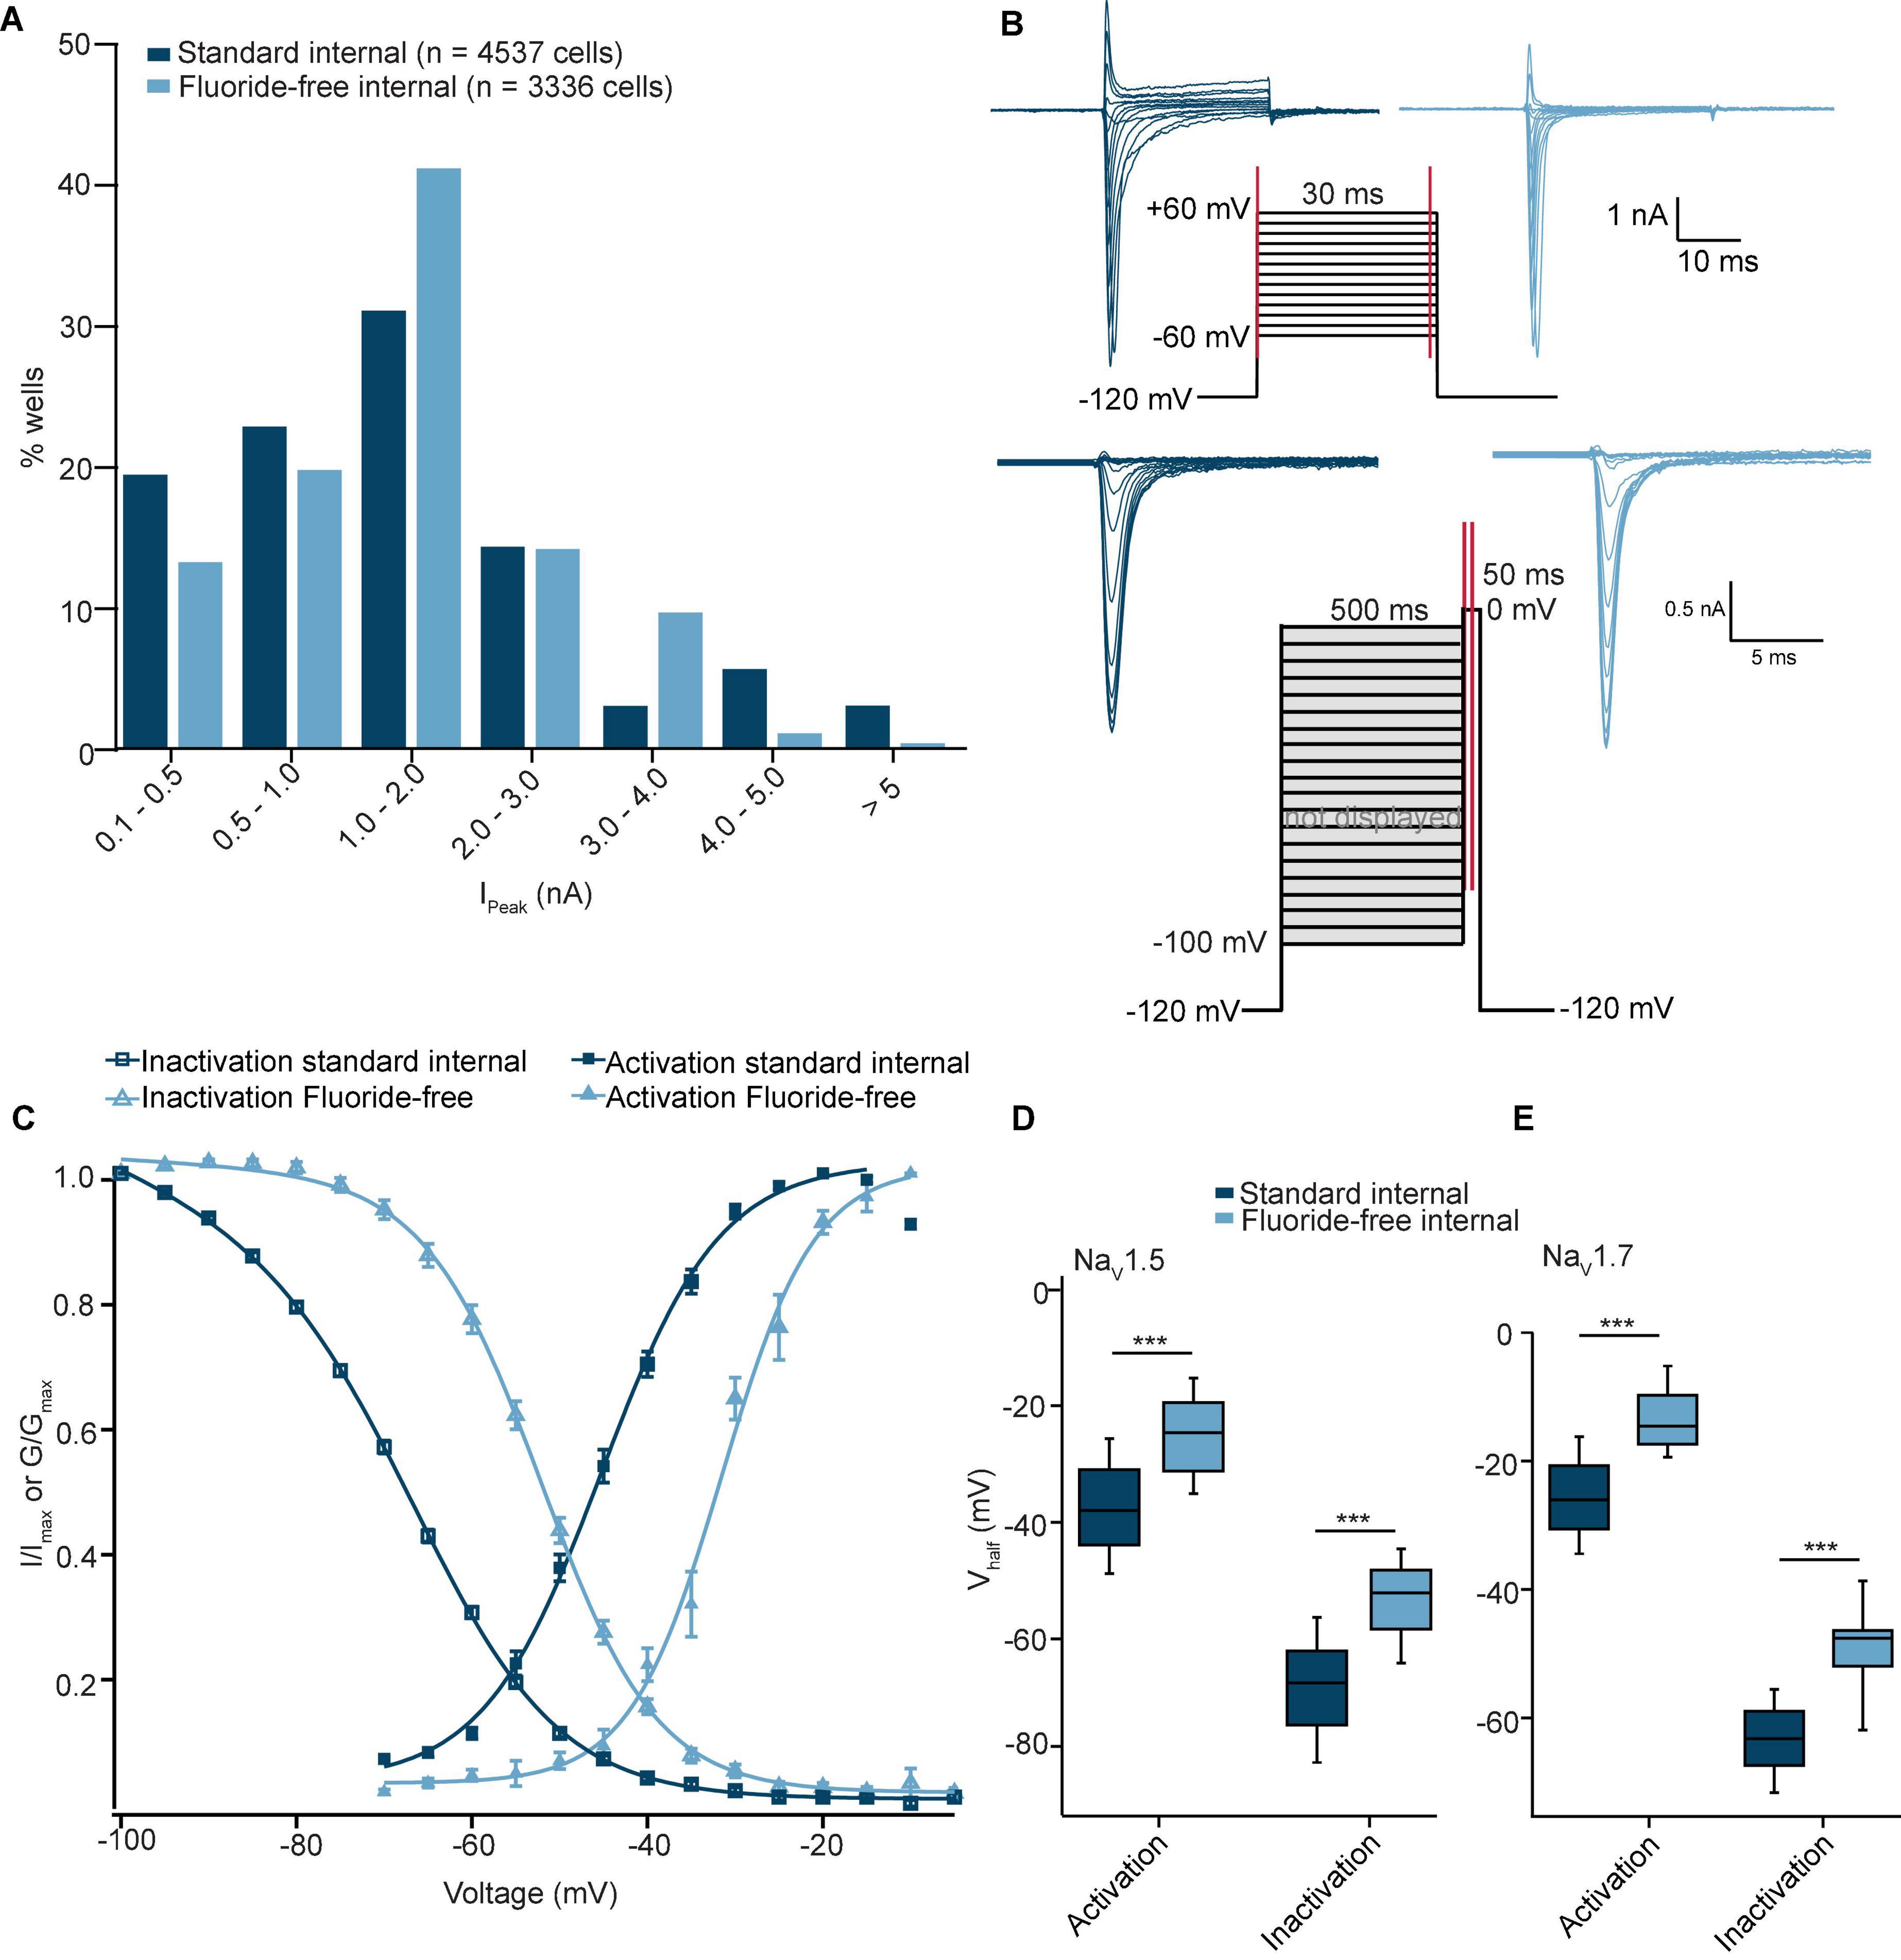
Figure 4. NaV1.5 recorded in standard and fluoride-free internal solution. (A) Histogram plot of IPeak values recorded using standard internal and fluoride-free internal solution. (B) Current-voltage traces of NaV1.5 expressed in CHO cells using an activation protocol (top) and inactivation protocol (bottom) for both conditions. (C) Activation (fit with an extended Boltzmann equation, see Section “Data analysis”) and inactivation IV curves (fit with a Boltzmann equation, see Section “Data analysis”) for NaV1.5 in standard internal and fluoride-free solution are shown overlaid. (D) The Vhalf values of activation of 484 cells in standard internal were significantly more negative compared with 241 cells in fluoride-free internal. The same shift to more negative Vhalf of inactivation was also found for 728 in standard internal fluoride compared with 165 cells in fluoride-free internal (Student’s t-test, ***P < 0.001). (E) A shift in the Vhalf values of activation and inactivation was also observed for NaV1.7 where Vhalf values for activation of 433 cells in standard internal were significantly more negative compared with 29 cells in fluoride-free internal and the Vhalf of inactivation for 493 in standard internal fluoride were significantly more negative compared with 14 cells recorded in fluoride-free internal solution (Student’s t-test, ***P < 0.001).
To test whether fluoride influences pharmacology of NaV1.5 we used the known NaV channel blocker, tetracaine. This was applied as a single concentration of compound to each well, followed by a full block concentration (333 μM). Using a 3-Pulse protocol we were able to compare the block of NaV1.5-mediated currents by tetracaine at three different holding potentials as shown in Figures 5A,B (example traces are shown for the first two pulses only, corresponding to a holding potential of −120 and −100 mV). Figures 5C,D shows the peak current at 0 mV over time using two different holding potentials and tetracaine concentrations as well as vehicle only (0.3% DMSO) applied from the extracellular side. As expected, the potency of inhibition increased with a more depolarized holding potential for both conditions consistent with local anesthetics preferably binding to the inactivated states (Hille, 1977; Hondeghem and Katzung, 1977; Bean et al., 1983; Li et al., 1999). Importantly, the concentration response curves for tetracaine overlaid almost exactly for individual voltages and were not statistically significantly different (Student’s t-test, P > 0.05) for 4 NPC-384 chips in standard internal and 3 NPC-384FF chips in fluoride-free internal solution. However, the IC50s for tetracaine under both conditions decreased ∼4–7 fold from holding potentials of −120 mV compared with −100 and −80 mV (Figures 5E,F and Supplementary Table 1) comparable with values reported for lidocaine in the literature (Bean et al., 1983; Rapedius et al., 2019). In this way, the IC50 of tetracaine on NaV1.5 seems independent of whether fluoride is present or not, which is somewhat surprising given the clear hyperpolarizing effect of internal fluoride on voltage activation/inactivation of NaV1.5 (and NaV1.7) and the dependence of tetracaine IC50 on holding potential. Further studies are needed to elucidate the molecular mechanisms of these differences and how they apply to other compounds.
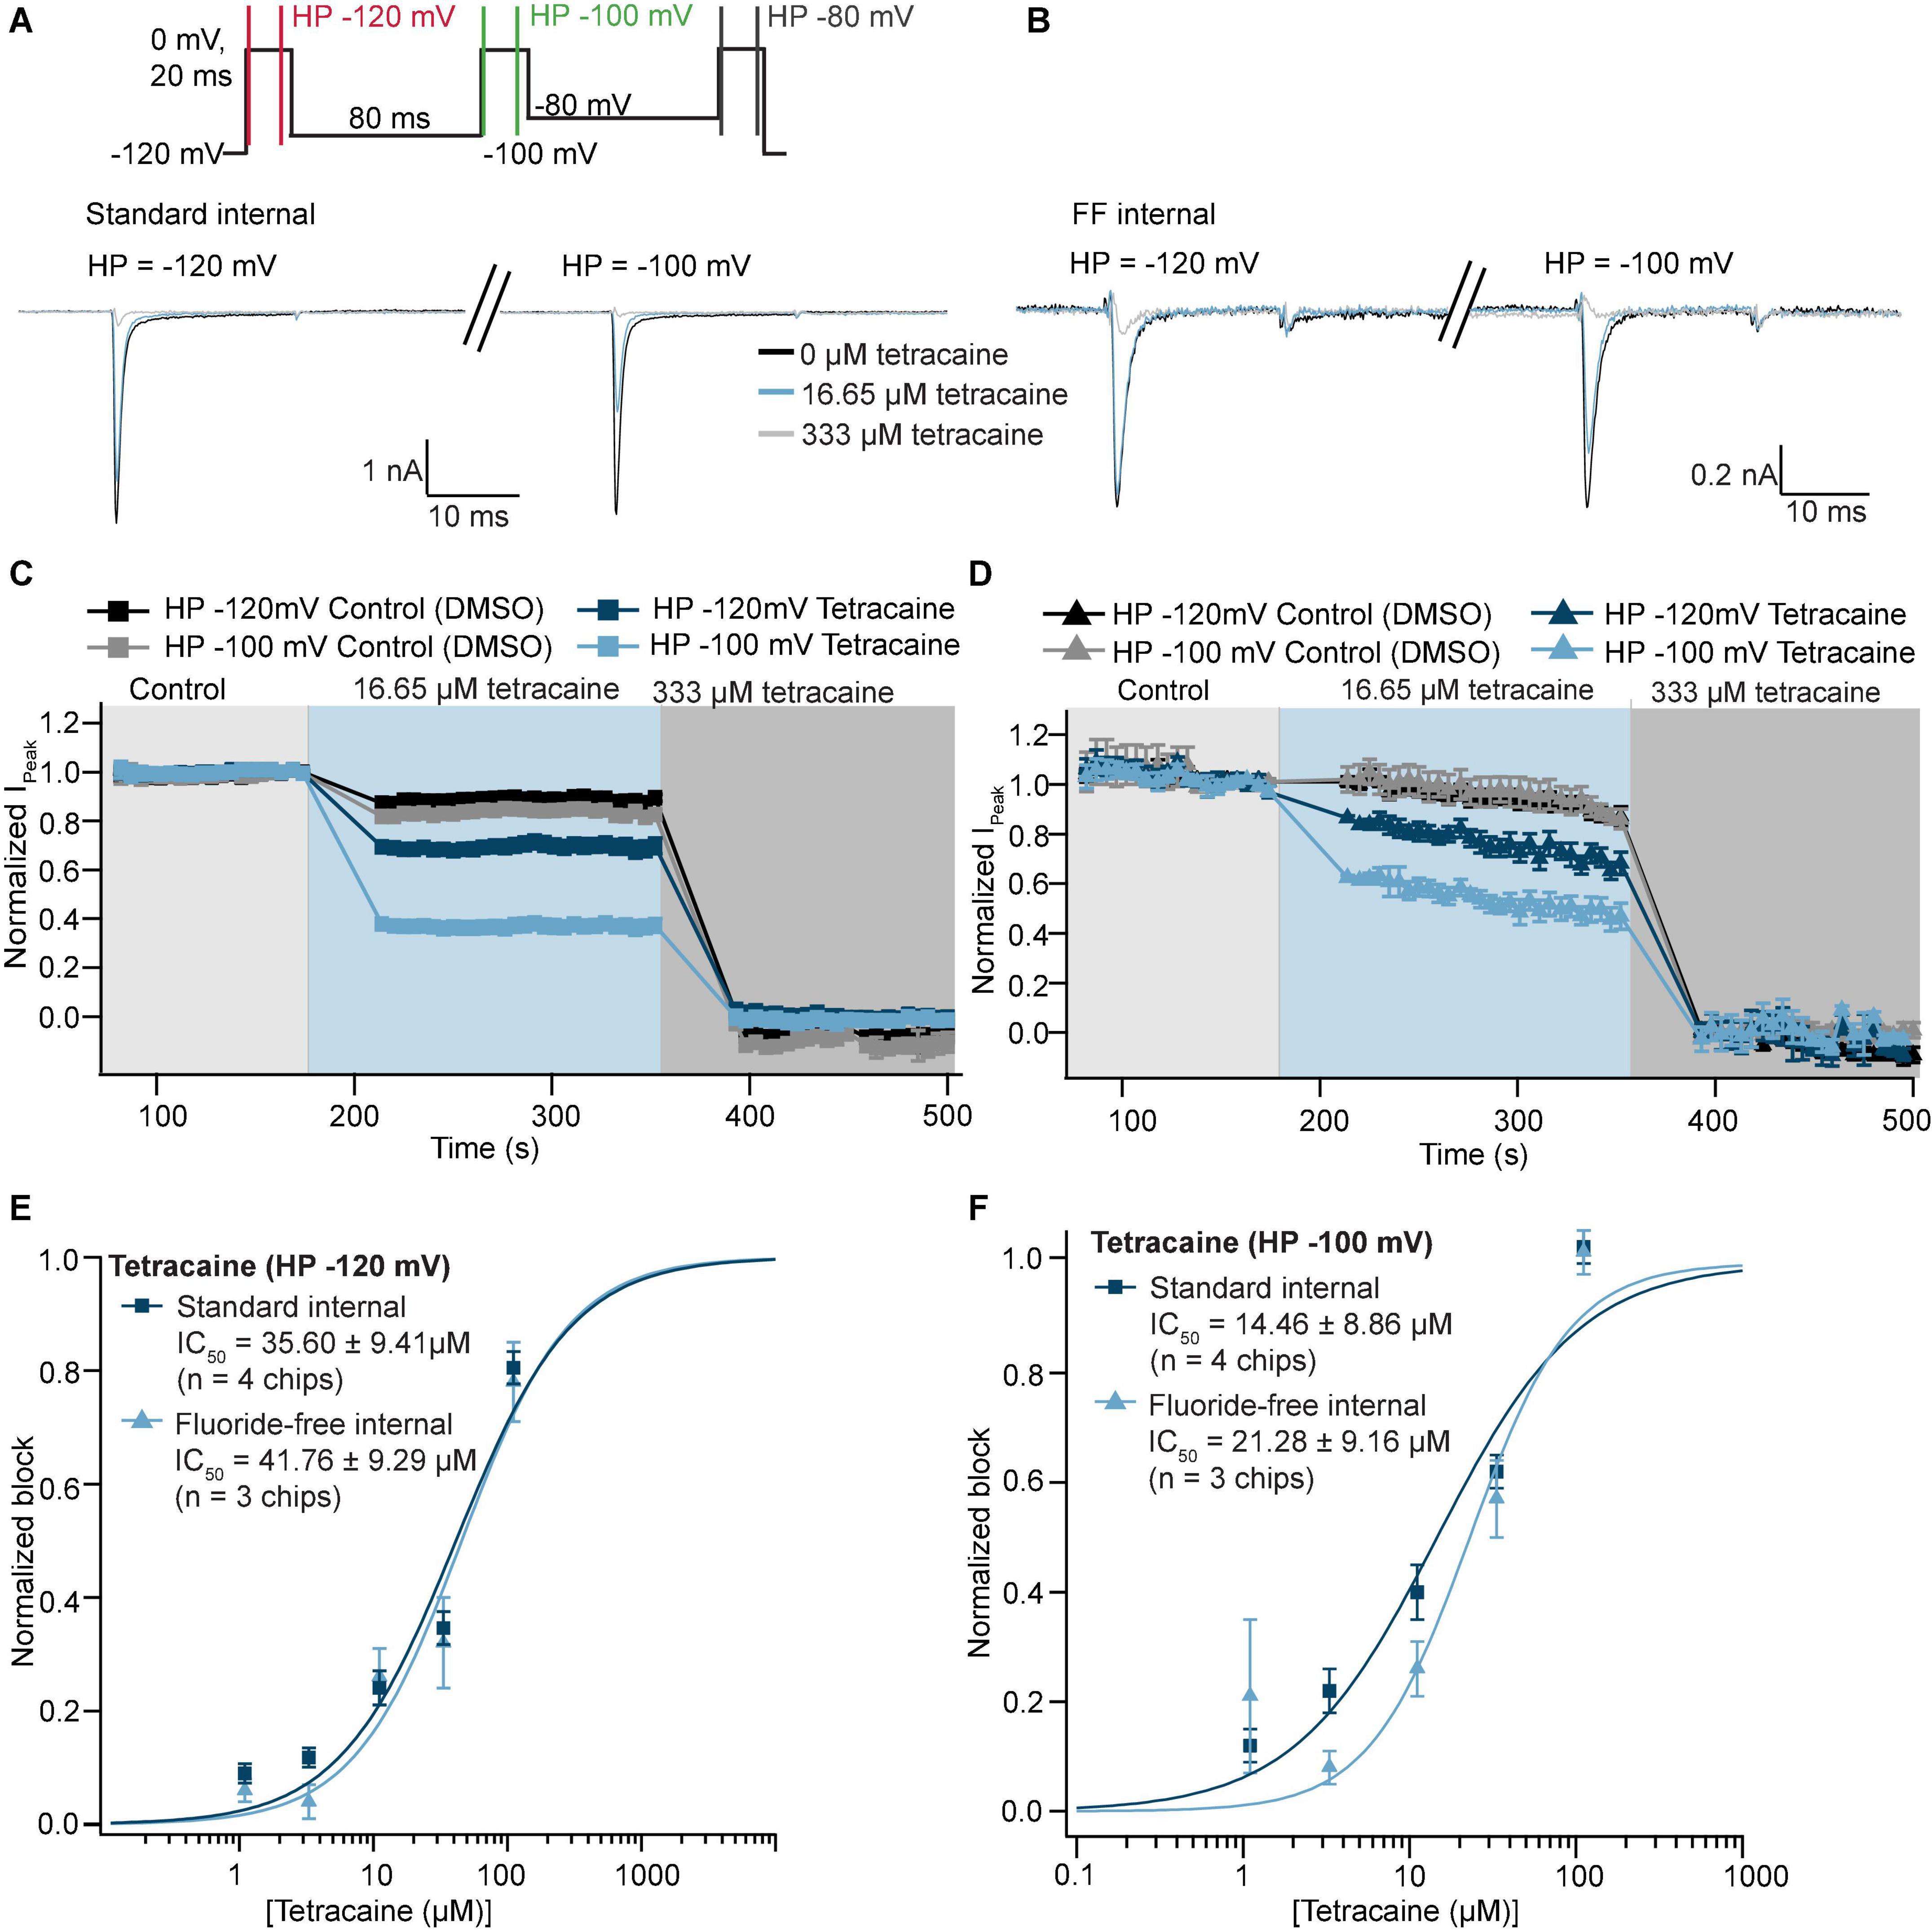
Figure 5. Pharmacology of NaV1.5 recorded in standard and fluoride-free internal solution. (A) Raw current traces from an example CHO cell expressing NaV1.5 recorded in standard internal solution were blocked by tetracaine using a 3-step protocol (voltage protocol shown at the top). Traces elicited by the first (holding potential –120 mV) and second (holding potential –100 mV) step are shown. (B) Raw current traces from an example CHO cell expressing NaV1.5 recorded in fluoride-free internal solution were blocked by tetracaine. (C) Corresponding time course of block by tetracaine in standard internal solution for an average of 23 wells (at different holding potentials), time course in DMSO for an average of 41 wells is also shown. (D) Corresponding time course of block by tetracaine in fluoride-free internal solution for an average of 10 wells (at different holding potentials), time course in DMSO for an average of 35 wells is also shown. (E) Concentration response curves for tetracaine in standard internal solution or fluoride-free solution at a holding potential of –120 mV are shown overlaid. (F) Concentration response curves for tetracaine in standard internal solution or fluoride-free solution at a holding potential of –100 mV are shown overlaid.
Using fluoride-free solution to record KCa3.1 (SK4) channels in the presence of internal Ca2+
We also tested the effect of internal fluoride for an ion channel activated by internal Ca2+ and used the internal perfusion of free Ca2+ to activate KCa3.1 (SK4) channels. CHO cells expressing KCa3.1 were captured with almost 50% success rate for RSeal ≥ 1 GΩ with standard and fluoride-free internal solution (Figure 6A), if a QC cutoff of RSeal ≥ 0.25 GΩ was used, the success rate was increased in both conditions (Figure 6A). As automated patch clamp recordings are sometimes performed using multi-hole chips to improve success of experiments, we also used multi-hole NPC-384 and NPC-384FF chips with 4 holes per well (4X). The success rates for cell capture and sealing were similar using 4X chips compared with single hole (1X) chips for both standard internal and fluoride-free internal solution (Figure 6A). Note that when 4X chips were used, RSeal > 0.25 GΩ is equivalent to RSeal > 1 GΩ with 1X chips and RSeal > 0.05 GΩ is equivalent to RSeal > 0.25 GΩ with 1X chips. A ramp voltage protocol from −120 to 60 mV was applied from a holding potential of −80 mV (Figure 6B). After exchange of the intracellular solution from 0 to 1 μM free intracellular Ca2+ an outwardly rectifying current was observed that was inhibited by external application of 1 mM Ba2+ (Figures 6B,D) when standard internal or fluoride-free internal solution was used. In fact, we observed a slightly higher success rate for available wells that passed the quality control criteria for current (I > 350 pA at 60 mV) after internal free Ca2+ application and RSeal > 0.25 GΩ before internal free Ca2+ application when fluoride-free solution was used (Figure 6C), 70.3 ± 6.9% (n = 9 chips) vs. 60.6 ± 9.4 (n = 8 chips) when standard internal solution was used. Interestingly, when we repeated the same experiment using 4X NPC-384FF chips (quality check criteria for current I > 1 nA at 60 mV) the success rate increased to 94.5 ± 3.5% (n = 2 chips) and 91.2 ± 6.6 (n = 2 chips) when standard internal solution was used. This confirms the benefit of multi-hole chips for assay development in general, and as additional tool for experiments using fluoride-free internal solution.
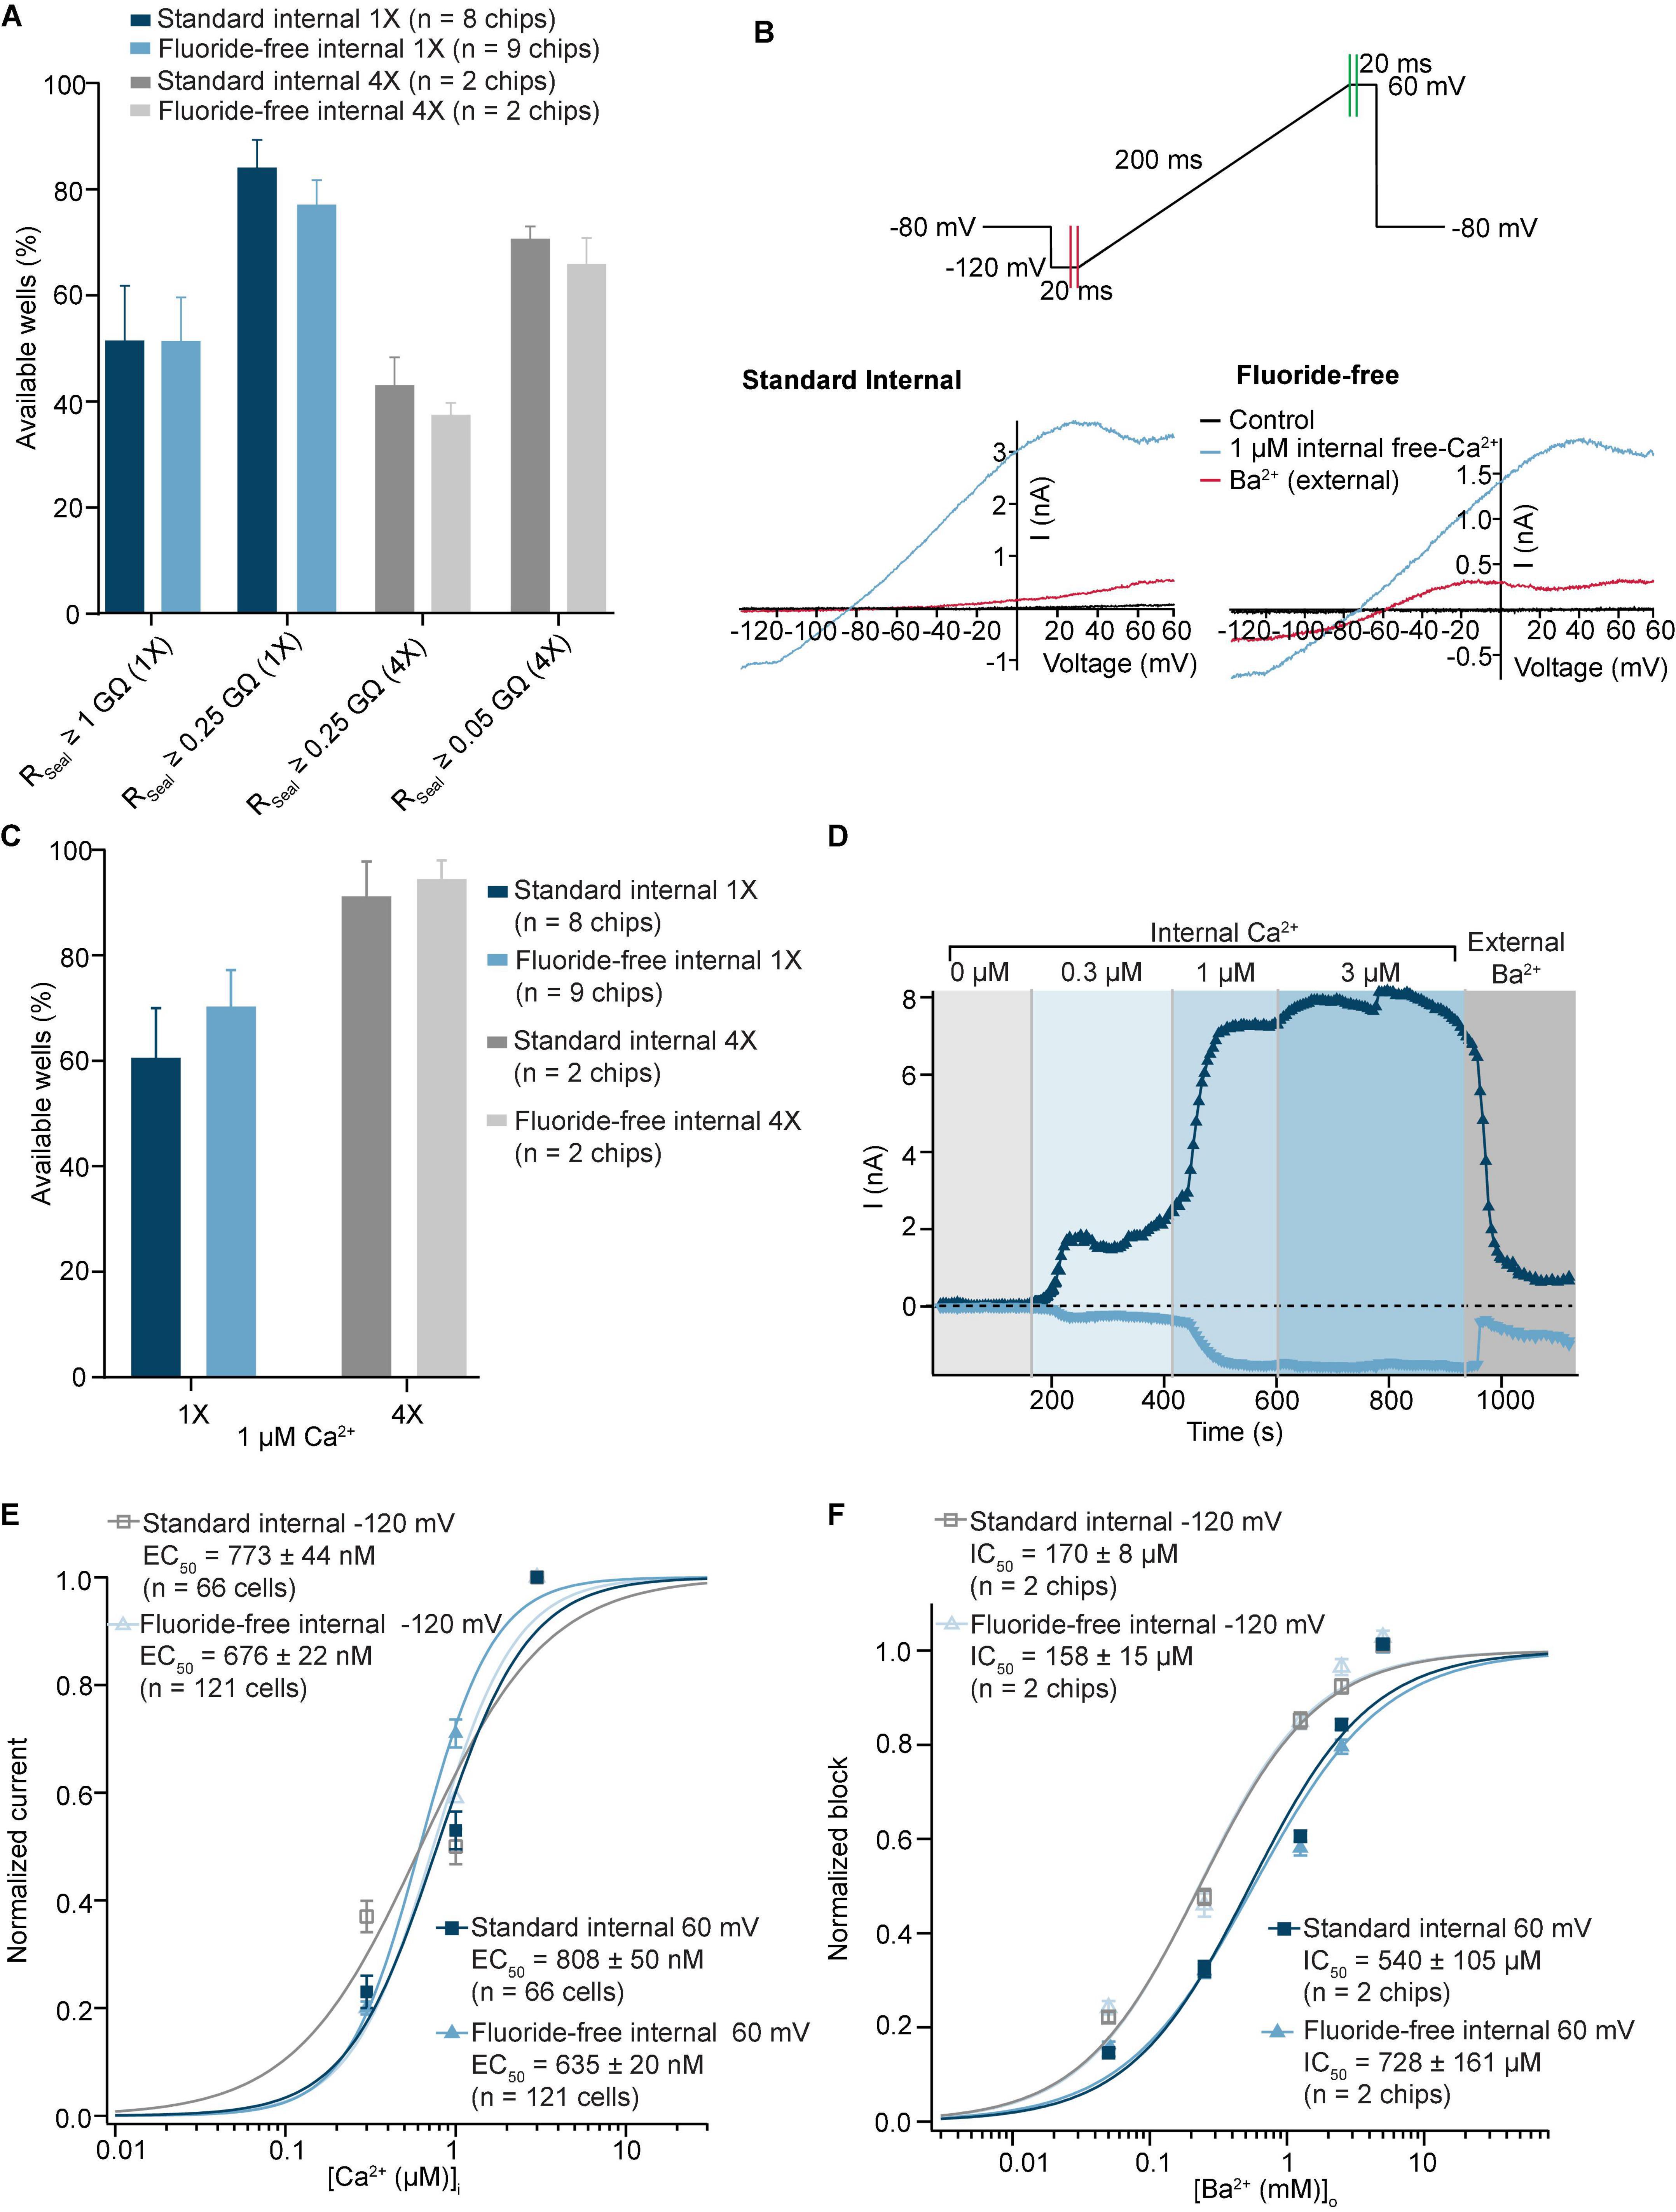
Figure 6. Activation by internal free Ca2+ of KCa3.1 recorded in standard and fluoride-free internal solution. (A) CHO cells expressing KCa3.1 were captured with almost 50% success rate for RSeal ≥ 1 GΩ with standard and in fluoride-free internal solution (left). If a QC cutoff of RSeal ≥ 0.25 GΩ was used, the success rate was increased in both conditions (right). Similar success rates were also achieved with multi-hole (4X) chips (gray). (B) Raw current traces from example CHO cell expressing KCa3.1 recorded in both standard and fluoride-free internal solution, activated by 1 μM free internal Ca2+ and blocked by 1 mM Ba2+ (external). (C) Success rates after applying initial RSeal (>0.25 GΩ) and current QC plot of IPeak values at –120/60 mV for standard and fluoride-free solutions after internal application of 1 μM free Ca2+. (D) IT plot during application of internal free Ca2+ with 0.3, 1, and 3 μM free internal Ca2+ and subsequent block by external Ba2+ (1 mM) at –120/60 mV. (E) Current values at –120 or 60 mV in increasing concentrations of internal free Ca2+ were normalized to maximum peak amplitude and fit using a Hill equation which shows a slightly increased EC50 in standard internal solutions for both voltages. Shown are mean ± S.E.M. (F) Current values at –120 or 60 mV in increasing concentrations of external Ba2+ were normalized to maximum peak amplitude and fit using a Hill equation which showed no difference in the IC50 at –120 mV between standard internal (170 ± 8 μM, n = 2 chips) and fluoride-free internal (158 ± 15 μM, n = 2 chips) or 60 mV, although the IC50 was higher at 60 vs. –120 mV for both groups (540 ± 105 μM, n = 2 chips in standard external and 728 ± 161 μM, n = 2 chips in fluoride-free internal solution). IC50 values are given as mean of 2 chips ± S.D.
Using increasing concentrations of internal free Ca2+, we could estimate the apparent affinity for internal free Ca2+ to elicit KCa3.1 currents (Figure 6E). Both inward (measured at −120 mV) and outward currents (measured at 60 mV) were analyzed, and concentration response curves constructed for standard and fluoride-free solution at the different potentials. The concentration response curves for internal Ca2+ are shown overlaid in Figure 6E. The corresponding current analysis shows that when standard or fluoride-free solution was used, significantly larger peak currents were elicited at 0.3, 1, and 3 μM free internal Ca2+ compared with control (0 μM free internal Ca2+) recorded at 60 mV (P < 0.001), whereas only 1 and 3 μM free internal Ca2+ elicited a significantly larger peak amplitude compared with control (0 μM free internal Ca2+) recorded at −120 mV (P < 0.001), regardless of the internal solution used (Supplementary Figure 2). The data was normalized to the maximum response and fitted using a standard Hill equation (Figure 6E). The EC50 for internal Ca2+ was significantly lower when fluoride-free internal solution was used compared with standard internal solution at both 60 mV (635 ± 20 nM (n = 121) vs. 808 ± 50 nM (n = 66; P < 0.01)) and −120 mV (676 ± 22 nM (n = 121) in fluoride-free solution vs. 773 ± 44 nM (n = 66) in standard internal (P < 0.05)).
We also determined the IC50 for external Ba2+ using either standard internal or fluoride-free internal at −120 and 60 mV using 4X NPC-384 and 4X NPC-384FF chips, with the same ramp protocol shown in Figure 6B. Figure 6F shows the concentration response curves for Ba2+ at −120 and 60 mV in standard and fluoride-free solution. Ba2+ was added as a single concentration to each well and the concentration response curves were constructed across the whole plate where it blocked the current at −120 mV with a higher potency than at 60 mV. Figure 6F shows the average concentration response curves for 2 NPC-384 or 2 NPC-384FF chips. The IC50 for Ba2+ (mean ± S.D.) was 170 ± 8 μM when standard and 158 ± 15 μM when fluoride-free internal solution was used at a voltage of −120 mV. The IC50 increased ∼3-fold to 540 ± 105 μM when standard and 728 ± 161 μM at 60 mV when fluoride-free internal solution was used.
From these results we conclude that the recording of Ca2+-activated K-channels is possible under standard as well as fluoride-free conditions with similar success rates, and even higher success rates for available wells after Ca2+ activation with 4X chips than with 1X chips, making multi-hole chips a useful tool for recording Ca2+-activated K-channels. Given that the EC50 for Ca2+ was lower with fluoride-free internal solution, and peak currents were larger, we suggest that fluoride-free internal solution may provide an advantage over standard fluoride-containing internal solutions for recording Ca2+ activated channels.
Discussion
There is no doubt that automated patch clamp has become an integral part of many electrophysiological assays involving ion channels, including safety pharmacology, lead optimization, target validation, and channelopathy research (Obergrussberger et al., 2021, 2022). Unlike manual patch clamp, the cell cannot be chosen, nor can the patch clamp aperture be moved to improve the seal. In APC, the patch clamp aperture is stationary and solely suction is used to attract the cell to the hole. In both manual and automated patch clamp, suction is then used to further improve the seal and to break into the whole cell configuration. Fluoride has been used in the internal solution in manual and automated patch clamp for years to assist with seal formation (Zeng et al., 2008; Föhr et al., 2021), in particular to record voltage-gated sodium channels where seal resistance and access parameters are critical for good voltage control. The mechanism is thought to involve CaF2 crystals forming at the aperture (Lojkner et al., 2019). However, it is well-documented that fluoride causes shifts in the activation and inactivation kinetics of NaV channels (Meadows et al., 2002; Rugiero et al., 2003; Coste et al., 2004; Jarecki et al., 2008), as well as affecting persistent calcium current in neurons (Kay et al., 1986), activating G-proteins through interaction with Al3+ (Yatani and Brown, 1991; Li, 2003), and inhibits phosphatase activity (Khatra and Soderling, 1978).
Fluoride has little effect on hERG currents
As expected, our data show that success rate as measured by % available wells using strict quality control parameters including RSeal > 1 GΩ or 0.25 GΩ and IPeak > 150 pA was higher when fluoride was used in the internal solution compared with fluoride-free internal solution when HEK cells stably expressing the hERG channel were used. However, with a success rate of around 60% for usable wells (RSeal > 0.25 GΩ) when K-gluconate was used, this results in over 200 usable wells in each experiment lasting approximately 20 min and thus, a vast increase in throughput compared with manual patch clamp. Importantly, there was little change in the number of usable wells at the end of the experiment compared with at the start, indicating that fluoride is not absolutely necessary for long-lasting recordings and 60% for completed experiments is an acceptable success rate for screening.
When fluoride was replaced by gluconate in the internal solution, hERG-mediated currents were slightly, but statistically significantly, larger than when fluoride was present (P < 0.05, unpaired Student’s t-test). This has not been previously reported and the reasons for the difference are not clear, additional studies are required to elucidate the underlying root cause. In our experiments, we can exclude differences in cell size since the cell capacitance values were unchanged in fluoride and fluoride-free solution, and we have also shown that fluoride does not shift the Vhalf of the hERG tail current. This is in agreement with Zeng et al. (2008, 2013) who also reported no effect on tail current activation parameters by fluoride compared with chloride when using the automated patch clamp system, the PatchXpress, and manual patch clamp, although the fluoride vastly increased success rate on the PatchXpress from 10% in K-chloride to 75% in K-fluoride (Zeng et al., 2008). Indeed, we also found no difference in success rate for K-chloride-containing internal solution compared with K-gluconate-containing internal solution (Supplementary Table 3) and can conclude that both gluconate and chloride are suitable alternatives to fluoride for recordings of hERG-HEK on the SyncroPatch 384.
We also compared the IC50 values for two compounds, terfenadine and verapamil, obtained using K-fluoride or K-gluconate and found that the IC50s were not different and agreed well with the range found in the literature (Zeng et al., 2008; Kramer et al., 2013; Crumb et al., 2016; Brinkwirth et al., 2020). From our results and those of Zeng et al. (2008, 2013) we can conclude that fluoride does improve the success rate based on RSeal and completed experiments and does not affect Vhalf of hERG tail current nor pharmacology, at least for the two compounds tested. Therefore, we can further conclude that the use of fluoride in the internal solution for hERG screening can be an advantage due to improved success rate, but fluoride-free internal solution can be used on the SyncroPatch 384 with success rates compatible with high throughput screening.
Fluoride shifts Vhalf of activation and inactivation of NaV1.5 and NaV1.7
CHO cells expressing NaV1.5 were also used on the SyncroPatch 384 in fluoride-free internal solution with similar success rates to HEK expressing hERG indicating that this method can be applied to different cell types and different ion channels. Average RSeal values were >1 GΩ regardless of internal solution used, and no difference in IPeak in fluoride-free internal solution compared with standard fluoride internal solution was observed which contrasts to the results observed with hERG.
Our results show that fluoride in the internal solution causes a negative shift in the Vhalf of activation and inactivation of both NaV1.5 (Figures 4C,D) and NaV1.7 (Figure 4E) which agrees with previous reports that fluoride shifts the Vhalf of activation and inactivation to more negative values of NaV1.3 (Meadows et al., 2002), NaV1.7 (Jarecki et al., 2008), and NaV1.9 (Rugiero et al., 2003; Coste et al., 2004). The values for Vhalf of activation and inactivation for NaV1.5 and NaV1.7 were in good agreement with the literature for fluoride internal (Sheets and Hanck, 1999; Li et al., 2017). Importantly, despite shifts in the Vhalf of activation and inactivation, the IC50 of tetracaine block of NaV1.5 was not statistically different in fluoride-free internal solution compared with standard fluoride (Table 3 and Figures 5E,F). Changing the holding potential from −120 to −100 mV or −80 mV resulted in a more potent IC50 of tetracaine, regardless of fluoride or fluoride-free internal solution was used (see Supplementary Table 1) as expected, as tetracaine and other local anesthetics are state dependent blockers of sodium channels (Hille, 1977; Hondeghem and Katzung, 1977; Bean et al., 1983; Li et al., 1999). The result is somewhat surprising given the fact that internal fluoride acts in a hyperpolarizing fashion and tetracaine is dependent on the holding potential used and may point towards related but independent mechanisms of modulation during transitions between closed, open and inactivated states of NaV1.5 channels as suggested for NaV1.8 and NaV1.9 channels (Coste et al., 2004).
A shift in the activation and inactivation kinetics for cardiac NaV1.5 channels over time has been reported for canine cardiac Purkinje cells (Hanck and Sheets, 1992), rat ventricular cardiac myocytes (Maltsev and Undrovinas, 1997), and rabbit atrial myocytes (Wendt et al., 1992) using manual whole cell patch clamp. In a small study using NaV1.5 expressed in CHO cells, our results also indicate a negative shift in the Vhalf of activation and inactivation over time (data not shown) as previously reported (Hanck and Sheets, 1992; Wendt et al., 1992; Maltsev and Undrovinas, 1997) when activation and inactivation IVs were measured after 10 min compared with immediately after achieving the whole cell configuration. The Vhalf of activation shifted by −0.78 mV/min in fluoride internal and −0.43 mV/min in fluoride-free internal solution. The Vhalf of inactivation shifted by −1.22 mV/min in fluoride and −0.38 mV/min in fluoride-free. In this respect, although the shift in parameters appeared to be more pronounced when fluoride was present, the absence of fluoride did not completely abolish this shift in agreement with Wendt et al. (1992) who also reported a shift in the activation and inactivation parameters regardless of whether fluoride, chloride, aspartate, or glutamate were present in the internal solution. It has been proposed that the shift in activation is dependent on the cytoskeleton (Maltsev and Undrovinas, 1997) and is prevented using the perforated patch technique (Wendt et al., 1992). All our experiments were performed in the whole cell mode of the patch clamp technique, but the use of a perforator in the internal solution would allow perforated patch experiments to be performed.
Temperature has also been shown to affect activation and inactivation of NaV channels where cooled temperatures cause a depolarizing shift in the Vhalf of activation of NaV1.3, 1.5, 1.6, and 1.7 (Kriegeskorte et al., 2022). Increasing the temperature to physiological temperature (36 ± 1°C) can also mildly shift the Vhalf of inactivation to more hyperpolarized potentials (Rotordam et al., 2021). Increased temperatures have also been shown to affect IC50s on hERG current, e.g., erythromycin (Kirsch et al., 2004; Stoelzle et al., 2011) and NaV1.5, e.g., mexiletine (Rotordam et al., 2021). For these reasons, it may be desirable to perform automated patch clamp experiments at physiological temperature. Recording at physiological temperature is more challenging and can result in a lower success rate and shorter recordings. In preliminary experiments at physiological temperature, we found that there was little change in the success rate when fluoride was used in the internal solution (see Supplementary Table 2) but the success rate in fluoride-free solution was slightly lower compared with room temperature [30.0 ± 7.1 (6 chips) for RSeal > 1 GΩ at physiological temperature vs. 41.9 ± 8.6% (17 chips) at room temperature see Supplementary Table 2 and Section “High throughput APC to assess effects of internal fluoride on success rate and seal resistance”], nevertheless, and average RSeal was > 1 GΩ in both conditions (Supplementary Table 2) and recordings lasted approximately 20 min (data not shown).
In conclusion for NaV channels, we could confirm that fluoride shifts the Vhalf of activation and inactivation of NaV1.5 and NaV1.7 as has been reported for other NaV channels (Meadows et al., 2002; Rugiero et al., 2003; Coste et al., 2004; Jarecki et al., 2008) but does not alter the IC50 of tetracaine on Nav1.5 channels. Success rates are higher when using fluoride in the internal solution, as expected, and many labs using both conventional and automated patch clamp use internal fluoride when recording NaV channels and this must be taken into consideration when comparing kinetic parameters with the literature.
Experiments involving Ca2+-activated ion channels
Intracellular Ca2+ activated ion channels pose a challenge to APC devices given the use of internal fluoride solutions and the very low solubility of CaF2 (Ksp = 3.5 × 10⁻¹¹) resulting in unstable amounts of free internal Ca2+ concentrations. Nevertheless, the use of appropriate buffer solutions and chelating agents do allow for the development of high throughput drug discovery on Ca2+-activated K-Channels [please see Section “Materials and methods” (see Table 1) or Srinivasan et al. (2022)]. Our aim was to compare this approach to our recently developed fluoride-free method using a Ca2+-activated K-channel.
When single hole chips were used, the success rate based on seal resistance did not differ much between standard and fluoride-free solutions, which contrasts to the success rate for cells expressing hERG or NaV1.5, however, the success rate based on current amplitude after activation with 1 μM internal free-Ca2+ was increased in experiments where fluoride-free solution was used (Figures 6A,C). Additionally, current amplitudes were larger in fluoride-free internal solution (Supplementary Figure 2) and the EC50 for Ca2+ slightly lower (Figure 6E). Taken together, it would appear, for Ca2+-activated ion channels at least, fluoride-free internal solution should be recommended. When fluoride is present, there is most probably an unknown amount of precipitation of CaF2, even if this is not visible, and this can affect the apparent Ca2+ affinity, not to mention fluoride interfering with intracellular signaling process involving, for example, phosphorylation (Khatra and Soderling, 1978; Li, 2003). Activation of Ca2+-activated K-channels using fluoride is possible on high throughput APC devices, as shown recently for the BK channel by Srinivasan et al. (2022), however, the free internal Ca2+ may be more stable in fluoride-free conditions, especially over time/during the course of the day where precipitation cannot be completely prevented. The use of multi-hole chips with four holes per well (4X) is also possible thus improving the success rate based on current amplitude for both standard and fluoride-free internal solution to over 90%.
Conclusion
In keeping with the topic of this special issue: “Targeting Ion Channels for Drug Discovery: Emerging Challenges for High Throughput Screening Technologies,” we have overcome the challenge of low success rates and low seal resistances on high throughput automated patch clamp devices when using fluoride-free physiological internal solution. Implementation of specialized consumables (NPC-384FF) enables us to report success rates for fluoride-free recordings of approximately 60–80% for RSeal ≥ 0.25 GΩ and 40–50% for RSeal ≥ 1 GΩ. We mainly used a K-gluconate-based internal solution, but we observed similar success rates using K-chloride-based internal solution (Supplementary Table 3). Recordings were also stable, typically lasting around 20 min where cumulative additions of compound or single additions of compound and incubation times of 5 min in compound were used, as per best practice considerations recommended previously for hERG and NaV1.5 (Brinkwirth et al., 2020; Rotordam et al., 2021). In the case of hERG, since fluoride does not appear to exert an obvious influence over inactivation parameters or IC50 values, the user is free to choose whether to use fluoride or fluoride-free internal solution and may prefer fluoride-containing solutions to maximize success rates and minimize cost per data point. For experiments involving NaV channels, the user should be aware that fluoride causes shifts in activation and inactivation parameters and caution should be used when comparing data generated in different solutions. For recording Ca2+-activated channels, success rates for completed experiments are similar under both conditions, however, the response to internal free Ca2+ and estimation of its apparent affinity may be more favorable to pursue when fluoride-free internal solution is used due to complete absence of CaF2 precipitation and, therefore, there is an advantage for the user to be able to utilize fluoride-free solution with success rates exceeding 50% for completed experiments. Coupling fluoride-free internal solution with multi-hole chips increases the success rate for available wells to >90% and is, therefore, also a consideration when designing the experiment in ion channel drug screening.
Additionally, in preliminary recordings we could successfully use the fluoride-free approach for experiments involving stem cell-derived cardiomyocytes (Figure 7). Therefore, the approach is not limited to standard cell lines but could be adopted for a wide range of cell types and experiments to bring conditions used to generate high throughput APC data closer and more comparable to recordings done using manual patch clamp and physiological solutions. Ultimately, this will enhance ion channel characterization and compound testing when using not only cell lines, but also induced pluripotent stem cells and primary cells.
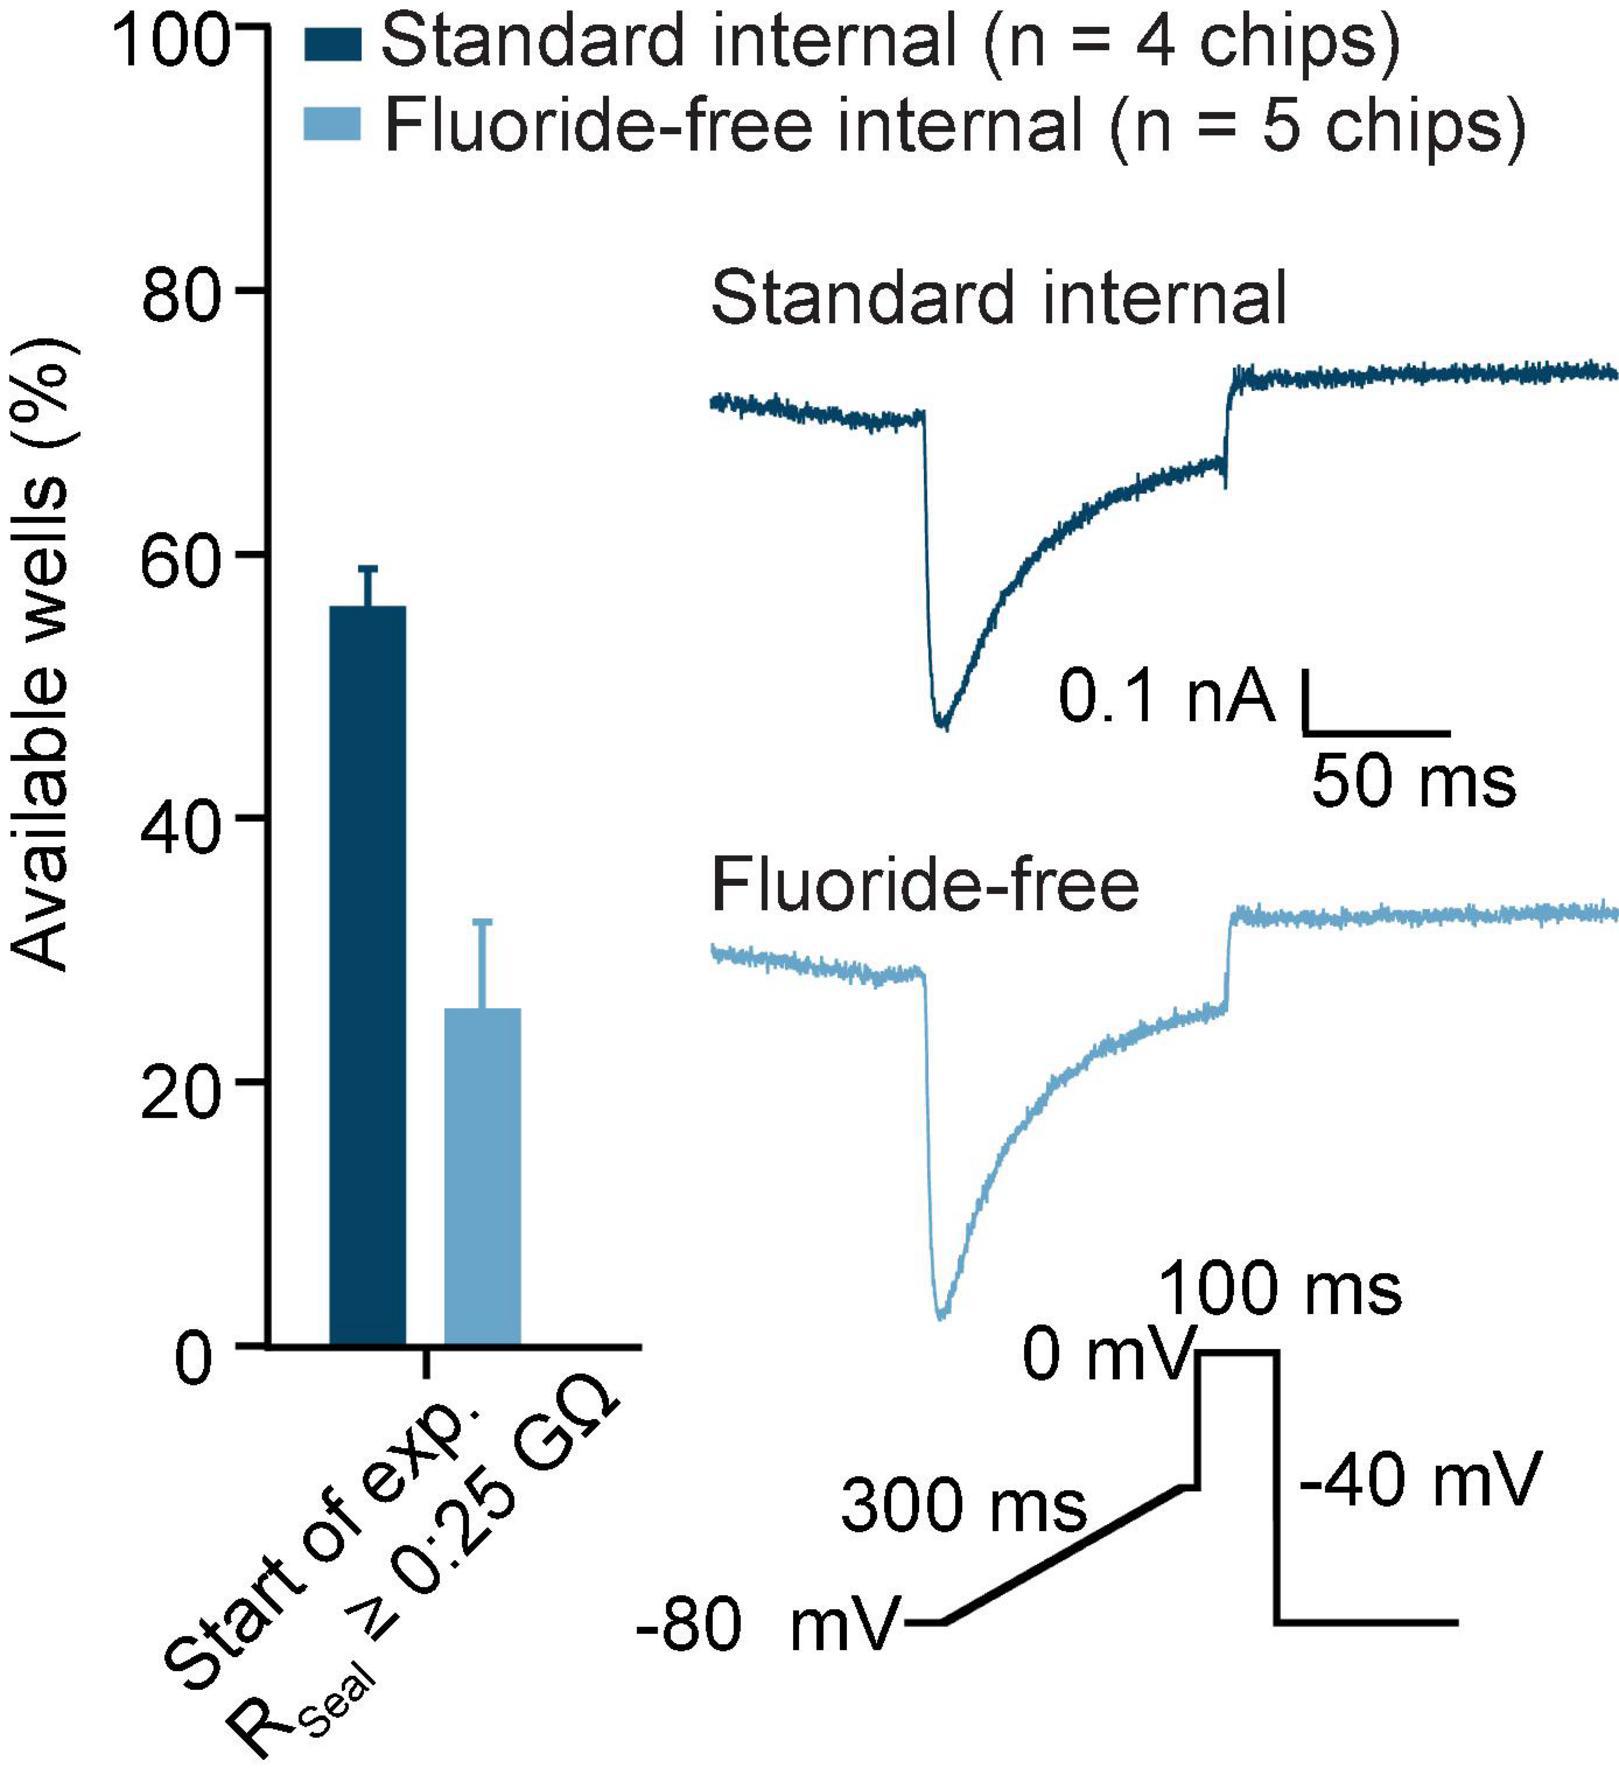
Figure 7. hiPSC-CMs recorded in standard and fluoride-free internal solution. hiPSC-CMs were captured with almost 60% success rate for RSeal ≥ 0.25 GΩ when using standard internal solution and about 25% RSeal ≥ 0.25 GΩ in fluoride-free internal solution in preliminary experiments. The inset shows an example of a CaV current recorded from an example cell in standard (top, dark blue) and fluoride-free (bottom, light blue). The voltage protocol used is also shown and only response to voltage step to 0 mV is shown in the raw trace examples.
Data availability statement
The raw data supporting the conclusions of this article will be made available by the authors, without undue reservation.
Author contributions
MR designed the study, performed the experiments and analysis, and contributed to writing and proofreading the manuscript. AO designed the experiments, analyzed the data, made the figures, and wrote and proofreading the manuscript. SS, TG, NB, and MGR performed the experiments and contributed to writing and proofreading the manuscript. IR-W, TS, and AR performed the experiments and analysis and contributed to writing and proofreading the manuscript. SF designed the study, performed analysis, and contributed to writing and proofreading the manuscript. NF contributed to writing and proofreading the manuscript. AL, FS, and NV provided the iPSC derived cardiomyocytes, helped with the design of experiments, and contributed to writing and proofreading the manuscript. All authors contributed to the article and approved the submitted version.
Funding
This work was supported by grants from the Deutsche Forschungsgemeinschaft (DFG) to NV (VO1568/3-1, VO1568/4-1, IRTG1816, and SFB1002 project A13 and under Germany’s Excellence Strategy—EXC 2067/1—390729940) and from the German Center for Cardiovascular Research to NV (DZHK, 81X2300189, 81X4300102, 81X4300115, and 81X4300112).
Acknowledgments
We thank SB Drug Discovery for kindly providing the hERG-HEK cell line and Charles River Laboratories for kindly providing the NaV1.5-CHO, NaV1.7-CHO, and KCa3.1-CHO cell lines used to compile this manuscript.
Conflict of interest
MR, AO, SS, IR-W, TG, NB, MGR, TS, AR, SF, and NF were employed by Nanion Technologies, the manufacturers of the SyncroPatch 384 used to compile this manuscript. NF was a shareholder in Nanion Technologies. EH was employed by BioPharmaceuticals R&D, AstraZeneca.
The remaining authors declare that the research was conducted in the absence of any commercial or financial relationships that could be construed as a potential conflict of interest.
Publisher’s note
All claims expressed in this article are solely those of the authors and do not necessarily represent those of their affiliated organizations, or those of the publisher, the editors and the reviewers. Any product that may be evaluated in this article, or claim that may be made by its manufacturer, is not guaranteed or endorsed by the publisher.
Supplementary material
The Supplementary Material for this article can be found online at: https://www.frontiersin.org/articles/10.3389/fnmol.2022.982316/full#supplementary-material
References
Bean, B. P., Cohen, C. J., and Tsien, R. W. (1983). ‘Lidocaine block of cardiac sodium channels.’. J. Gen. Physiol. 81, 613–642. doi: 10.1085/jgp.81.5.613
Becker, N., Stoelzle, S., Göpel, S., Guinot, D., Mumm, P., Haarmann, C., et al. (2013). ‘Minimized cell usage for stem cell-derived and primary cells on an automated patch clamp system’. J. Pharmacol. Toxicol. Methods 68, 82–87. doi: 10.1016/j.vascn.2013.03.009
Becq, F., Mirval, S., Carrez, T., Lévêque, M., Billet, A, Coraux, C., et al. (2021). ‘The rescue of F508del-CFTR by elexacaftor/tezacaftor/ivacaftor (Trikafta) in human airway epithelial cells is underestimated due to the presence of ivacaftor’. Eur. Respir. J. 59:2100671. doi: 10.1183/13993003.00671-2021
Berger, H. A., Travis, S. M., and Welsh, M. J. (1998). ‘Fluoride stimulates cystic fibrosis transmembrane conductance regulator Cl- channel activity’. Am. J. Physiol.Lung Cell. Mol. Physiol. 274, L305–L312.
Billet, A., Froux, L., Hanrahan, J. W., and Becq, F. (2017). ‘Development of automated patch clamp technique to investigate CFTR chloride channel function’. Front. Pharmacol. 8:195. doi: 10.3389/fphar.2017.00195
Brinkwirth, N., Takasuna, K., Doi, M., Becker, N., Obergrussberger, A., Friis, S., et al. (2020). ‘Reliable identification of cardiac liability in drug discovery using automated patch clamp: Benchmarking best practices and calibration standards for improved proarrhythmic assessment’. J. Pharmacol. Toxicol. Methods 105:106884. doi: 10.1016/j.vascn.2020.106884
Brueggemann, A., George, M., Klau, M., Beckler, M., Steindl, J., Behrends, J. C., et al. (2004). ‘Ion channel drug discovery and research : The automated nano-patch–clamp © technology’. Curr. Drug Discov. Technol. 1, 91–96. doi: 10.2174/1570163043484833
Brüggemann, A., Farre, C., Haarmann, C., Haythornthwaite, A., Kreir, M., Stoelzle, S., et al. (2008). “Planar patch clamp: Advances in electrophysiology,” in Methods in molecular biology, potassium channels, ed. J. D. Lippiat (Totowa, NJ: Humana Press, a part of Springer Science & Business Media), 165–176. doi: 10.1007/978-1-59745-526-8
Brüggemann, A., Friis, S., Strassmeier, T., Goetze, T., Haarmann, C., Fertig, N., et al. (2017). Characterization of CFTR activators and inhibitors by the use of a planar patch clamp system. Biophys. J. 112:411a. doi: 10.1016/j.bpj.2016.11.2561
Chen, Y. H., Dale, T. J., Xie, X. M., Clare, J. J., Romanos, M. A., Whitaker, W. R., et al. (2000). ‘Cloning, distribution and functional analysis of the type III sodium channel from human brain’. Eur. J. Neurosci. 12, 4281–4289. doi: 10.1111/j.1460-9568.2000.01336.x
Coste, B., Osorio, N., Padilla, F., Crest, M., and Delmas, P. (2004). ‘Gating and modulation of presumptive NaV1.9 channels in enteric and spinal sensory neurons’. Mol. Cell. Neurosci. 26, 123–134. doi: 10.1016/j.mcn.2004.01.015
Crumb, W. J., Vicente, J., Johannesen, L., and Strauss, D. G. (2016). ‘An evaluation of 30 clinical drugs against the comprehensive in vitro proarrhythmia assay (CiPA) proposed ion channel panel’. J. Pharmacol. Toxicol. Methods 81, 251–262. doi: 10.1016/j.vascn.2016.03.009
Cummins, T. R., Dib-Hajj, S. D., Black, J. A., Akopian, A. N., Waxman, S. G., Wood, J. N., et al. (1999). A novel persistent tetrodotoxin-resistant sodium current in SNS-null and wild-type small primary sensory neurons. J. Neurosci. 19:RC43. doi: 10.1523/jneurosci.19-24-j0001.1999
Föhr, K. J., Nastos, A., Zimmer, T., Jungwirth, B., Messerer, D. A. C., Fauler, M., et al. (2021). ‘Block of voltage-gated sodium channels by atomoxetine in a state- and use-dependent manner’. Front. Pharmacol. 12:622489. doi: 10.3389/fphar.2021.622489
Froux, L., Elbahnsi, A., Boucherle, B., Billet, A., Baatallah, N., Hoffmann, B., et al. (2020). ‘Targeting different binding sites in the CFTR structures allows to synergistically potentiate channel activity’. Eur. J. Med. Chem. 190:112116. doi: 10.1016/j.ejmech.2020.112116
Hanck, D. A., and Sheets, M. F. (1992). Time-dependent changes in kinetics of Na+ current in single canine cardiac Purkinje cells’. Am. J. Physiol. Heart Circ. Physiol. 262(4 Pt 2), H1197–H1207. doi: 10.1152/ajpheart.1992.262.4.h1197
Herrmann, A. M., Cerina, M., Bittner, S., Meuth, S. G., and Budde, T. (2020). ‘Intracellular fluoride influences TASK mediated currents in human T cells’. J. Immunol. Methods 487:112875. doi: 10.1016/j.jim.2020.112875
Hille, B. (1977). ‘Local anesthetics: Hydrophilic and hydrophobic pathways for the drug-receptor reaction.’. J. Gen. Physiol. 69, 497–515. doi: 10.1085/jgp.69.4.497
Hondeghem, L. M., and Katzung, B. G. (1977). ‘Time- and voltage-dependent interactions of antiarrhythmic drugs with cardiac sodium channels’. BBA Rev. Biomembr. 472, 373–398. doi: 10.1016/0304-4157(77)90003-X
Jarecki, B. W., Jackson, J. O. II, Cummins, T. R., and Sheets, P. L. (2008). ‘Paroxysmal extreme pain disorder mutations within the D3/S4-S5 linker of Nav1.7 cause moderate destabilization of fast inactivation’. J. Physiol. 586, 4137–4153. doi: 10.1113/jphysiol.2008.154906
Kay, A. R., Miles, R., and Wong, R. K. S. (1986). ‘Intracellular fluoride alters the kinetic properties of calcium currents facilitating the investigation of synaptic events in hippocampal neurons’. J. Neurosci. 6, 2915–2920. doi: 10.1523/jneurosci.06-10-02915.1986
Khatra, B. S., and Soderling, T. R. (1978). ‘Reversible inhibition of skeletal muscle phosphoprotein phosphatase by ATP, phosphate and fluoride’. Biochem. Biophys. Res. Commun. 85, 647–654. doi: 10.1016/0006-291X(78)91211-1
Kirsch, G. E., Trepakova, E. S., Brimecombe, J. C., Erickson, H. D., Kochan, M. C., Shyjka, L. M., et al. (2004). ‘Variability in the measurement of hERG potassium channel inhibition: Effects of temperature and stimulus pattern’. J. Pharmacol. Toxicol. Methods 50, 93–101. doi: 10.1016/j.vascn.2004.06.003
Kleinsorge, M., and Cyganek, L. (2020). ‘Subtype-directed differentiation of human iPSCs into atrial and ventricular cardiomyocytes’. STAR Protoc. 1:100026. doi: 10.1016/j.xpro.2020.100026
Kramer, J., Obejero-Paz, C. A., Myatt, G., Kuryshev, Y. A., Bruening-Wright, A., Verducci, J. S., et al. (2013). ‘MICE models: Superior to the HERG model in predicting Torsade de Pointes.’. Sci. Rep. 3:2100. doi: 10.1038/srep02100
Kriegeskorte, S., Raya, B., Martin, H., Ralf, H., and Angelika, L. (2022). High-throughput electrophysiology reveals subtype specific temperature dependence of sodium channel activation and inactivation. Biophys. J. 121:95A. doi: 10.1016/j.bpj.2021.11.2249
Li, H. L., Galue, A., Meadows, L., and Ragsdale, D. S. (1999). ‘A molecular basis for the different local anesthetic affinities of resting versus open and inactivated states of the sodium channel’. Mol. Pharmacol. 55, 134–141. doi: 10.1124/mol.55.1.134
Li, L. (2003). ‘The Biochemistry and Physiology of Metallic Fluoride: Action, Mechanism, and Implications’. Crit. Rev. Oral Biol. Med. 14, 100–114. doi: 10.1177/154411130301400204
Li, T., Lu, G., Chiang, E. Y., Chernov-Rogan, T., Chen, J., Grogan, J. L., et al. (2017). ‘High-throughput electrophysiological assays for voltage gated ion channels using Syncro Patch 768PE’. PLoS One 12:e0180154. doi: 10.1371/journal.pone.0180154
Liu, H., Atkins, J., and Kass, R. S. (2003). ‘Common molecular determinants of flecainide and lidocaine block of heart Na+ channels: Evidence from experiments with neutral and quaternary flecainide analogues’. J. Gen. Physiol. 121, 199–214. doi: 10.1085/jgp.20028723
Lojkner, L. D., Anders, L., Rafael, S. D., and Roskva, R. K. (2019). Seal Enhancer’. Copenhagen. Available online at: https://uspto.report/patent/app/20190383792 (accessed August 4, 2022).
Maltsev, V. A., and Undrovinas, A. I. (1997). ‘Cytoskeleton modulates coupling between availability and activation of cardiac sodium channel’. Am. J. Physiol. Heart Circ. Physiol. 273, H1832–H1840. doi: 10.1152/ajpheart.1997.273.4.h1832
McNulty, M. M., and Hanck, D. A. (2004). ‘State-dependent mibefradil block of Na+ channels’. Mol. Pharmacol. 66, 1652–1661. doi: 10.1124/mol.66.6.1652
Meadows, L. S., Chen, Y. H., Powell, A. J., Clare, J. J., and Ragsdale, D. S. (2002). ‘Functional modulation of human brain Nav1.3 sodium channels, expressed in mammalian cells, by auxiliary β1, β2 and β3 subunits’. Neuroscience 114, 745–753. doi: 10.1016/S0306-4522(02)00242-7
Milligan, C. J., Li, J., Sukumar, P., Majeed, Y., Dallas, M. L., English, A., et al. (2009). ‘Robotic multiwell planar patch-clamp for native and primary mammalian cells.’. Nat. Protoc. 4, 244–255. doi: 10.1038/nprot.2008.230
Obergrussberger, A., Friis, S., Brüggemann, A., and Fertig, N. (2021). ‘Automated patch clamp in drug discovery: Major breakthroughs and innovation in the last decade’. Exp. Opin. Drug Discov. 16, 1–5. doi: 10.1080/17460441.2020.1791079
Obergrussberger, A., Goetze, T. A., Brinkwirth, N., Becker, N., Friis, S., Rapedius, M., et al. (2018). ‘An update on the advancing high-throughput screening techniques for patch clamp-based ion channel screens: Implications for drug discovery’. Exp. Opin. Drug Discov. 13, 269–277. doi: 10.1080/17460441.2018.1428555
Obergrussberger, A., Haarmann, C., Rinke, I., Becker, N., Guinot, N., Brueggemann, A., et al. (2014). “Automated patch clamp analysis of nACha7 and NaV 1.7 channels,” in Current protocols in pharmacology, ed. S. J. Enna (Hoboken, NJ: John Wiley & Sons Inc). doi: 10.1002/0471141755.ph1113s65
Obergrussberger, A., Rinke-Weiß, I., Goetze, T. A., Rapedius, M., Brinkwirth, N., Becker, N., et al. (2022). ‘The suitability of high throughput automated patch clamp for physiological applications’. J. Physiol. 600, 277–297. doi: 10.1113/JP282107
Ono, K., and Arita, M. (1999). ‘Mechanism of fluoride action on the L-type calcium channel in cardiac ventricular myocytes.’. Cell Calcium 26, 37–47. doi: 10.1054/ceca.1999.0050
Rapedius, M., Obergrussberger, A., Becker, N., Rinke-Weiß, I., Rotordam, M. G., et al. (2019) High throughput pharmacology of NaV 1.5 channels on nanion’s SyncroPatch 384PE. Available online at: https://www.nanion.de/images/phocadownloadpap/Application_Notes/Nanion_APP_Note_384PE_NaV1_5_06003.pdf (accessed June 27, 2022).
Renganathan, M., Cummins, T. R., Hormuzdiar, W. N., and Waxman, S. G. (2000). ‘α-SNS Produces the slow TTX-resistant sodium current in large cutaneous afferent DRG neurons’. J. Neurophysiol. 84, 710–718. doi: 10.1152/jn.2000.84.2.710
Rotordam, M. G., Obergrussberger, A., Brinkwirth, N., Takasuna, K., Becker, N., Horváth, A., et al. (2021). ‘Reliable identification of cardiac conduction abnormalities in drug discovery using automated patch clamp II: Best practices for Nav1.5 peak current in a high throughput screening environment’. J. Pharmacol. Toxicol. Methods 112:107125. doi: 10.1016/j.vascn.2021.107125
Rugiero, F., Mistry, M., Sage, D., Black, J. A., Waxman, S. G., Crest, M., et al. (2003). ‘Selective expression of a persistent tetrodotoxin-resistant Na+ current and Nav1.9 Subunit in myenteric sensory neurons’. J. Neurosci. 23, 2715–2725. doi: 10.1523/jneurosci.23-07-02715.2003
Seibertz, F., Rapedius, M., Fakuade, F. E., Tomsits, P., Cyganek, L., Becker, N., et al. (2022). A modern automated patch-clamp approach for high throughput electrophysiology recordings in native cardiomyocytes. Commun Biol. (in press).
Sheets, M. F., and Hanck, D. A. (1999). ‘Gating of skeletal and cardiac muscle sodium channels in mammalian cells’. J. Physiol. 514(Pt 2), 425–436.
Srinivasan, S. R., Huang, H., Chang, W.-C., Nasburg, J. A., Nguyen, H. M., Strassmaier, T., et al. (2022). Discovery of novel activators of large-conductance calcium-activated potassium channels for the treatment of cerebellar ataxia’. Mol. Pharmacol. 102, 17–28. doi: 10.1124/molpharm.121.000478
Stoelzle, S., Obergrussberger, A., Brüggemann, A., Haarmann, C., George, M., Kettenhofen, R., et al. (2011). ‘State-of-the-art automated patch clamp devices: Heat activation, action potentials, and high throughput in ion channel screening’. Front. Pharmacol. 2:76. doi: 10.3389/fphar.2011.00076
Wendt, D. J., Starmer, C. F., and Grant, A. O. (1992). ‘Na channel kinetics remain stable during perforated-patch recordings’. Am. J. Physiol. Cell Physiol. 263, C1234–C1240. doi: 10.1152/ajpcell.1992.263.6.c1234
Yatani, A., and Brown, A. M. (1991). ‘Mechanism of fluoride activation of G protein-gated muscarinic atrial K+ channels’. J. Biol. Chem. 266, 22872–22877. doi: 10.1016/s0021-9258(18)54435-5
Zeng, H., Balasubramanian, B., Penniman, J. R., Kinose, F., Salata, J. J., and Lagrutta, A. (2013). ‘Halide ion effects on human ether-à-go-go related gene potassium channel properties’. Assay Drug Dev. Technol. 11, 544–550. doi: 10.1089/adt.2013.531
Keywords: automated patch clamp, ion channels, hERG, NaV1.5, physiological solutions, KCa3.1, NaV1.7, fluoride
Citation: Rapedius M, Obergrussberger A, Humphries ESA, Scholz S, Rinke-Weiss I, Goetze TA, Brinkwirth N, Rotordam MG, Strassmaier T, Randolph A, Friis S, Liutkute A, Seibertz F, Voigt N and Fertig N (2022) There is no F in APC: Using physiological fluoride-free solutions for high throughput automated patch clamp experiments. Front. Mol. Neurosci. 15:982316. doi: 10.3389/fnmol.2022.982316
Received: 30 June 2022; Accepted: 26 July 2022;
Published: 22 August 2022.
Edited by:
Ciria Hernandez, University of Michigan, United StatesReviewed by:
Daohua Jiang, Institute of Physics (CAS), ChinaSamuel Goodchild, Xenon Pharmaceuticals Inc., Canada
Copyright © 2022 Rapedius, Obergrussberger, Humphries, Scholz, Rinke-Weiss, Goetze, Brinkwirth, Rotordam, Strassmaier, Randolph, Friis, Liutkute, Seibertz, Voigt and Fertig. This is an open-access article distributed under the terms of the Creative Commons Attribution License (CC BY). The use, distribution or reproduction in other forums is permitted, provided the original author(s) and the copyright owner(s) are credited and that the original publication in this journal is cited, in accordance with accepted academic practice. No use, distribution or reproduction is permitted which does not comply with these terms.
*Correspondence: Markus Rapedius, bWFya3VzLnJhcGVkaXVzQG5hbmlvbi5kZQ==
†These authors have contributed equally to this work