 Eli-Eelika Esvald1,2†
 Jürgen Tuvikene1,2,3†
 Carl Sander Kiir1†Annela Avarlaid1Laura Tamberg1Alex Sirp1Anastassia Shubina1
 Florencia Cabrera-Cabrera1Arno Pihlak2Indrek Koppel1
 Kaia Palm2
 Tõnis Timmusk1,2*
- 1Department of Chemistry and Biotechnology, Tallinn University of Technology, Tallinn, Estonia
- 2Protobios LLC, Tallinn, Estonia
- 3dxlabs LLC, Tallinn, Estonia
Brain-derived neurotrophic factor (BDNF) promotes the survival and functioning of neurons in the central nervous system and contributes to proper functioning of many non-neural tissues. Although the regulation and role of BDNF have been extensively studied, a rigorous analysis of the expression dynamics of BDNF and its receptors TrkB and p75NTR is lacking. Here, we have analyzed more than 3,600 samples from 18 published RNA sequencing datasets, and used over 17,000 samples from GTEx, and ~ 180 samples from BrainSpan database, to describe the expression of BDNF in the developing mammalian neural and non-neural tissues. We show evolutionarily conserved dynamics and expression patterns of BDNF mRNA and non-conserved alternative 5′ exon usage. Finally, we also show increasing BDNF protein levels during murine brain development and BDNF protein expression in several non-neural tissues. In parallel, we describe the spatiotemporal expression pattern of BDNF receptors TrkB and p75NTR in both murines and humans. Collectively, our in-depth analysis of the expression of BDNF and its receptors gives insight into the regulation and signaling of BDNF in the whole organism throughout life.
Introduction
BDNF is a member of the neurotrophic family of secreted proteins and has well-established roles in the nervous system, e.g., in neuronal survival and differentiation, synapse formation and maturation, and development of neural circuits (Park and Poo, 2013; Wang et al., 2022). Moreover, BDNF is associated with numerous neuropsychiatric disorders, such as depression, bipolar disorder, schizophrenia, addiction, and various neurodevelopmental conditions (Autry and Monteggia, 2012; Wang et al., 2022). In recent years the functions of BDNF have been demonstrated in various non-neural tissues, including the heart (Donovan et al., 2000; Fulgenzi et al., 2015; Li et al., 2022), lung (Paris et al., 2020), skin (Rutlin et al., 2014), mammary gland (Liu et al., 2012; Sar Shalom et al., 2019), and skeletal muscle (Delezie et al., 2019; Ahuja et al., 2021). Furthermore, BDNF regulates blood insulin levels (Yang et al., 2019; Fulgenzi et al., 2020), and BDNF signaling is important in kidney development (García-Suárez et al., 2006; Endlich et al., 2018) and serves as a potential marker for chronic kidney disease (Afsar and Afsar, 2022). In humans, BDNF also contributes to platelet aggregation (Boukhatem et al., 2021). Taken together, BDNF signaling is important in both the nervous system and in non-neural tissues, highlighting the importance of understanding its developmental regulation.
BDNF protein is synthesized as a prepro-precursor protein into the endoplasmic reticulum, with the pre-region cleaved co-translationally, resulting in proBDNF. proBDNF is processed to mature BDNF protein either in the Golgi apparatus (Mowla et al., 1999, 2001) or extracellularly (Lee et al., 2001). Both proBDNF and mature BDNF form non-covalently associated dimers and bind two types of receptors, TrkB and p75NTR, and therefore affect cells in a diverse way (Lu et al., 2005). The TrkB receptor is a member of the tropomyosin-related kinase family of tyrosine kinases and binds either mature BDNF or NT-4 (Reichardt, 2006). Binding of neurotrophins causes TrkB dimerization and activation of Ras-MAPK, PI3K-Akt, and PLCγ1-IP3/DAG signaling pathways (Reichardt, 2006). The TrkB protein-encoding gene NTRK2 encodes several TrkB isoforms generated by alternative splicing, and the main isoforms in humans are the full-length TrkB isoform (hereafter TrkB-FL), and the C-terminally truncated isoforms TrkB-T1 and TrkB-Shc, both of which lack the tyrosine kinase domain, though the latter retains the Shc-binding site (Stoilov et al., 2002; Luberg et al., 2010). While the TrkB-T1 isoform sequesters both BDNF and TrkB-FL (Haapasalo et al., 2002) and therefore functions as a dominant-negative TrkB isoform, it can also elicit intracellular signals on its own, e.g., to regulate calcium influx in glial cells and cardiomyocytes (Tessarollo and Yanpallewar, 2022). Similarly, the TrkB-Shc isoform acts as a dominant-negative regulator of TrkB signaling as the TrkB-FL does not phosphorylate TrkB-Shc after dimerization (Stoilov et al., 2002). The p75NTR receptor is a member of tumor necrosis factor receptor superfamily and binds all neurotrophins – NGF (Sutter et al., 1979), BDNF (Rodriguez-Tebar et al., 1990), NT-3 (Rodríguez-Tébar et al., 1992), and NT-4 (Rydén et al., 1995). The p75NTR receptor preferentially binds proneurotrophins, whereas TrkB preferentially binds mature neurotrophins (Reichardt, 2006). Following proneurotrophin binding, p75NTR activates NF-kB, RhoA, and Jun kinase pathways which promote neuronal survival, inhibit neurite growth, or induce apoptosis, respectively (Reichardt, 2006). During development p75NTR signaling induces normal cell death, while in adults it triggers apoptosis after injury (Kraemer et al., 2014). In summary, the different effects of BDNF on target cells and tissues depend on the expression of specific TrkB isoforms and the p75NTR receptor.
The genes encoding neurotrophins are highly conserved throughout vertebrates, and they have been proposed to originate from a single ancestral gene (Hallböök et al., 1991; Hallböök, 1999). In murines the Bdnf gene contains eight 5′ non-coding exons that are controlled by distinct promoter regions and are spliced to the common protein-coding 3′ exon (Timmusk et al., 1993b; Aid et al., 2007). The activity-dependent subcellular localization of Bdnf transcripts in neurons has been thoroughly studied (Tongiorgi et al., 1997; Pattabiraman et al., 2005; Chiaruttini et al., 2008, 2009; Baj et al., 2013, 2016; Singer et al., 2018; Colliva and Tongiorgi, 2021). Moreover, studies in mice have shown that different Bdnf transcripts regulate dendrite complexity (Maynard et al., 2017) and impairing the expression of specific Bdnf transcripts has distinct functional consequences. For example, loss of Bdnf exon I-containing transcripts results in increased body weight, reduced thermogenesis (You et al., 2020), heightened aggression in male mice (Maynard et al., 2016), and impaired maternal care (Maynard et al., 2018). In contrast, loss of Bdnf exon IV transcripts affects the development of inhibitory synapses (Hong et al., 2008; Sakata et al., 2009), disrupts sleep and sensory information processing, and impairs fear memory retrieval (Hill et al., 2016).
Here, we aimed to evaluate the potential role of BDNF throughout mammalian development by revisiting the expression of BDNF using bioinformatical analysis of published RNA sequencing datasets. First, we analyzed the spatiotemporal expression of BDNF mRNA, including transcripts with different 5′ exons and 3′ untranslated regions (UTRs), in neural and non-neural tissues of different mammals. We also examined the expression of BDNF receptors TrkB and p75NTR. We then focused on the cell type-specific BDNF expression in adult mice and humans using available single-cell sequencing data. Finally, we complemented the bioinformatics data on BDNF expression at the protein level in the nervous system and non-neural tissues during development of three widely used murine animal models: BALB/c and C57BL/6 J mice and Wistar rats. Altogether, the comprehensive description of the expression patterns of BDNF and its receptors across different tissues and developmental stages provides a highly valuable resource to the neurotrophin research community.
Materials and methods
Bioinformatical analysis
Raw data in fastq format from previously published RNA sequencing datasets (Keane et al., 2011; ENCODE Project Consortium, 2012; Merkin et al., 2012; Fagerberg et al., 2014; Yu et al., 2014; Vied et al., 2016; Li et al., 2017; Söllner et al., 2017; Tabula Muris Consortium, Overall coordination, Logistical coordination, Organ collection and processing, Library preparation and sequencing, Computational data analysis, 2018; Cardoso-Moreira et al., 2019; Luo et al., 2020; Shafik et al., 2021; Rayan et al., 2022), were obtained from EMBL-EBI European Nucleotide Archive database using www.sra-explorer.info. Accession numbers for all datasets are shown in Supplementary Table 1.
Adapter and quality trimming were performed using BBDuk (part of BBMap version 38.90) with the following parameters: ktrim = r k = 23 mink = 11 hdist = 1 tbo qtrim = lr trimq = 10 maq = 10 minlen = 25. Mouse sequencing reads were mapped to mm10 (primary assembly and annotation obtained from GENCODE, release M25, GRCm38), rat sequencing reads were mapped to rn6 (primary assembly and annotation obtained from Ensembl, release 104, RGSC 6.0/Rnor_6.0), human sequencing reads were mapped to hg19 (primary assembly and annotation obtained from GENCODE, release 37, GRCh37), rhesus macaque sequencing reads were mapped to Mmul_10 (primary assembly and annotation obtained from Ensembl, release 108, Mmul_10), rabbit sequencing reads were mapped to OryCun2.0 (primary assembly and annotation obtained from Ensembl, release 108, OryCun2.0) and opossum sequencing reads were mapped to ASM229v1 genome (primary assembly and annotation obtained from Ensembl, release 108, ASM229v1) using STAR aligner (version 2.7.4a) with default parameters. To increase sensitivity for unannotated splice junctions, splice junctions obtained from the 1st pass were combined per dataset and filtered as follows: junctions on mitochondrial DNA and non-canonical intron motifs were removed; only junctions detected in at least 10% of samples (rounded up to the nearest integer) in the whole dataset were kept. Filtered junctions were added to the 2nd pass mapping using STAR aligner. RNA sequencing reads were assigned to features using FeatureCounts (version 2.0.1). The following parameters were used for paired-end data: -p –B –C –J; and single-end data: -J. To count 3’ UTR/exon sequencing reads for BDNF and NTRK2, a custom SAF file was used (Supplementary Table 2 Custom SAF files). To characterize the total BDNF, 5′ exon and 3’ UTR levels throughout development, NTRK2 3′ exons and NGFR levels, counts per million (CPM) of the assigned RNA sequencing reads were calculated, and normalized with the length of the feature in kb where indicated. To analyze changes in BDNF 3′ long UTR proportions during development, CPM of the long 3’ UTR region was length-normalized and divided with the length-normalized CPM of BDNF coding sequence (CDS), therefore showing the levels of transcripts with long 3’ UTR from the total BDNF. The UCSC Liftover tool was used to convert the coordinates of BDNF coding sequence, 5′ exons and 3’ UTRs from data of human to rhesus macaque, and from mouse to rabbit and opossum genomes.
Meta-analysis of both mouse and rat data was performed to study Bdnf, Ntrk2 and Ngfr expression during development. For analyzing the expression of unique Bdnf 5′ exons, length-normalized 5′ exon CPM values were further normalized with length-normalized Bdnf CDS CPMs for the corresponding samples. To visualize the distribution of transcripts with Bdnf 5′ exons, sums of the normalized 5′ exon values were calculated in each group and divided by the total sum of all normalized 5′ exon values in the group, showing the composition in percentages. The results were visualized using ggplot2 (version 3.3.5) in R (version 4.1.2).
Data mining and visualization was also performed on human Genotype-Tissue Expression project (GTEx) portal gene and exon datasets (dbGaP Accession phs000424.v8.p2), human developmental transcriptome data from BrainSpan (RNA-Seq Gencode v10 summarized to genes and RNA-Seq Gencode v10 summarized to exons), and The Human Protein Atlas1 mouse transcript (24. RNA isoform data) and brain subregion gene data (16. RNA mouse brain subregion sample gene data). The human GTEx data used for the analyses were obtained from the GTEx Portal2 on 12/01/2021, the human BrainSpan data were obtained from the BrainSpan Atlas of the Developing Human Brain3 on 12/01/2021 and the mouse data from The Human Protein Atlas (see footnote 1) were obtained on 13/09/2021. For the pre-analyzed datasets, the level of each 5′ exon was normalized using the sum of all annotated 5′ exons or transcripts containing the respective 5′ exons in the respective sample to calculate the 5′ exon ratios. Then the distribution of 5′ exons usage in BDNF transcripts was visualized as described previously.
Mimotope variation analysis
To determine the epitope of 3C11 anti-BDNF monoclonal antibody (Icosagen, catalogue #327–100), mimotope-variation analysis was used as described previously (Sadam et al., 2018, 2021). Raw peptide counts in each sample were normalized with total peptide count. The 12-mer peptides obtained from the MVA workflow or from sequencing of the input E. coli M13 phage library were then aligned to different mouse, rat and human neurotrophin protein sequences (obtained from Uniprot) matching in at least 6 amino acid positions. Alignment loads were calculated as sum of normalized peptide counts aligning to each of the amino acid positions, with each amino acid position counted only once per unique peptide. To reduce the effect of spurious alignment of high-count peptides, the peptide with the highest normalized count was removed from the analysis for each amino acid position. Relative antibody binding at each amino acid position was calculated as fold over the input library alignment load.
Protein lysates
Animal work was performed as published in Sirp et al. (2022). All experiments concerning animals were performed in agreement with the local ethics committee and European Directive 2010/63/EU. Briefly, BALB/c mouse strain (Envigo), C57BL/6 J (Envigo), and Wistar rats (RccHan:WI, Envigo) were housed in conventional polycarbonate or H-TEMP polysulfone cages (2–4 animals per cage) with ad libitum access to clean water and food pellets (ssniff Spezialdiäten, GmbH) under a 12-h light/dark cycle in humidity and temperature-controlled room (temperature 22 ± 1°C and humidity 50 ± 10%).
The female mouse estrous cycle was monitored by visual observations (Champlin et al., 1973) followed by breeding in the evening. The presence of vaginal post-coitum protein plug was confirmed the next morning (no later than 12 h from breeding) and determined as embryonic 0.5 gestational stage. To obtain samples from embryonic stages, the pregnant mothers were euthanized by carbon dioxide inhalation, pups were collected, and embryonic brains were dissected in ice-cold 1× phosphate-buffered saline (PBS) solution. Postnatal (P) 0 stage was determined as the day of the birth and all other ages followed accordingly. Samples were collected from both female and male animals. To collect postnatal brain samples, rats and mice were killed by cervical dislocation and decapitated with a guillotine.
Protein lysates were prepared as described in Sirp et al. (2022). Briefly, tissue samples were dissected in ice-cold 1× phosphate-buffered saline (PBS) and stored at −80°C until further use. For each investigated time point, tissue samples from 2 to 3 different animals were combined and homogenized in ice-cold RIPA buffer [50 mM Tris–HCl (pH 8.0), 150 mM NaCl, 1% NP-40, 0.5% Na-deoxycholate, 0.5% sodium dodecyl sulfate (SDS), 1× cOmplete™ Protease Inhibitor Cocktail (Roche)]. For brain and non-neural tissues 7 and 10 μL RIPA per 1 mg of tissue, respectively, was used. All samples were homogenized using tissue grinder PELLET PESTLE® Cordless Motor (Kimble-Chase, DWK Life Sciences), sonicated 15 s with Torbeo Ultrasonic probe sonicator (36810-series, Cole Parmer), and centrifuged at 4°C at 16,000 g for 20 min. Soluble fraction was kept as protein lysate and protein concentration was measured using Pierce™ BCA Protein Assay Kit (Thermo Scientific).
Western blot
Fifty micrograms of total protein and different amounts of recombinant mature BDNF protein (Icosagen, cat. no P-105-100) were separated on 15% SDS-PAGE gel and transferred to a PVDF membrane using Trans-Blot Turbo Transfer system (Bio-Rad, Mixed MW program [1,3A, 25 V (const), 7 min)]. The membrane was blocked for 1 h at room temperature in 5% skimmed milk in TBST buffer (1× Tris-buffered saline (pH 7.4) and 0.1% Tween-20), incubated overnight at 4°C with primary anti-BDNF antibody (Icosagen, cat. no 327–100, clone 3C11, 1 mg/mL, 1:1000) in 2% milk-TBST, and overnight at 4°C with secondary antibody anti-mouse IgG conjugated with horseradish peroxidase (Thermo Fisher Scientific, 1:5000) in 2% milk-TBST. After both incubations, the membrane was washed 3 times with TBST for 5 min at room temperature.
Chemiluminescence signal was produced with SuperSignal™ West Femto or Atto Maximum Sensitivity Substrate (Thermo Fisher Scientific) and measured using imaging system ImageQuant Las 4,000 (GE Healthcare Life Sciences). For loading control, the membrane was stained with Coomassie solution (0.1% Coomassie Brilliant Blue R-250 Dye, 25% ethanol, 7% acetic acid), followed by washes with destaining solution (30% ethanol, 10% acetic acid) and rinsing with tap water. The membrane was imaged using ImageQuant Las 4,000 (GE Healthcare Life Sciences).
BDNF protein levels were quantified using densitometric analysis on ImageQuant TL software (GE Healthcare Life Sciences). As indicated in the figure legend, the amounts of BDNF protein in the tissue lysates were calculated based on the calibration curve of recombinant BDNF protein.
CRISPR interference-mediated silencing of Bdnf expression
The preparation and growing of Sprague Dawley rat primary cortical neurons was performed as described in Esvald et al. (2022). The used guide RNA (gRNA) sequences targeting either Bdnf promoters I or IV (pI or pIV), or control gRNA were as follows: Bdnf pI gRNA 1 5’-GTCACGTAACTGGCTCAGAG-3′, Bdnf pI gRNA 2 5’-GCCCTAGCCTGACAAGGCGA-3′, Bdnf pIV gRNA 1 5’-GCACTAGAGTGTCTATTTCG-3′, Bdnf pIV gRNA 2 5’-GATTTCATGCTAGCTCGCCG-3′, control gRNA 5’-GCTGATCTATCGCGGTCGTC-3′. Lentiviruses encoding the gRNAs or dCas9-KRAB were generated as described in Esvald et al. (2022). Neurons were infected with the indicated lentiviruses on the day of plating, half of culture media was changed at 2 days in vitro (DIV) and 5 DIV. A final concentration of 10 μM FDU (Sigma) was added to the media from 2 DIV. At 7 DIV, spontaneous neuronal activity was suppressed by adding 1 μM tetrodotoxin (Tocris Bioscience), and the cells were treated with 25 mM KCl (with 5 μM D-APV (Cayman Chemical Company) to reduce excitotoxicity) for 6 h at 8 DIV. RNA extraction, cDNA synthesis and qPCR, and protein extraction were conducted as described previously in Esvald et al. (2022). Protein concentration was measured using Pierce BCA Protein Assay kit (Thermo Scientific) and 15 μg of total protein was loaded on the gel along with bacterially expressed recombinant proBDNF (Alomone labs, cat. no B-257) and recombinant mature BDNF (Icosagen).
Overexpression of BDNF-V5 in HEK293 cells
Rat Bdnf coding sequence was cloned into pcDNA3.1/V5-His-TOPO expression vector (Life Technologies) where the CMV promoter was replaced with EF1α promoter. HEK293 cells were grown in Minimum Essential Medium (MEM, Corning, cat. no 10-010-CV) supplemented with 10% fetal bovine serum (PAN Biotech), 100 U/mL penicillin, and 100 μg/mL streptomycin (Gibco). The cells were transfected on 12-well plate with PEI (Sigma) with 1.5 μg DNA per well using 1:2 DNA:PEI ratio. Cells were lysed 24 h post transfection directly into 1x Laemmli buffer (containing 5% β-mercaptoethanol) and proteins were subjected to SDS-PAGE and Western blot using anti-V5 antibody (Thermo Fisher Scientific, #R960-25, 1:5000) or anti-BDNF 3C11 antibody.
Results
Bdnf mRNA levels in murine brain during development
As BDNF is widely studied in murines and it plays an important role in the developing central nervous system, we set out to first describe the spatiotemporal expression pattern of Bdnf in mouse and rat development using various publicly available RNA sequencing datasets (listed in Supplementary Table 3). Our analysis shows that total Bdnf mRNA levels increase remarkably during development in the whole brain of both mouse (Figure 1A) and rat (Figure 1B). Of the analyzed tissues, the highest levels of Bdnf mRNA were detected in the adolescent and adult mouse hippocampus (Figure 1A) and in the adolescent rat cerebral cortex (Figure 1B).
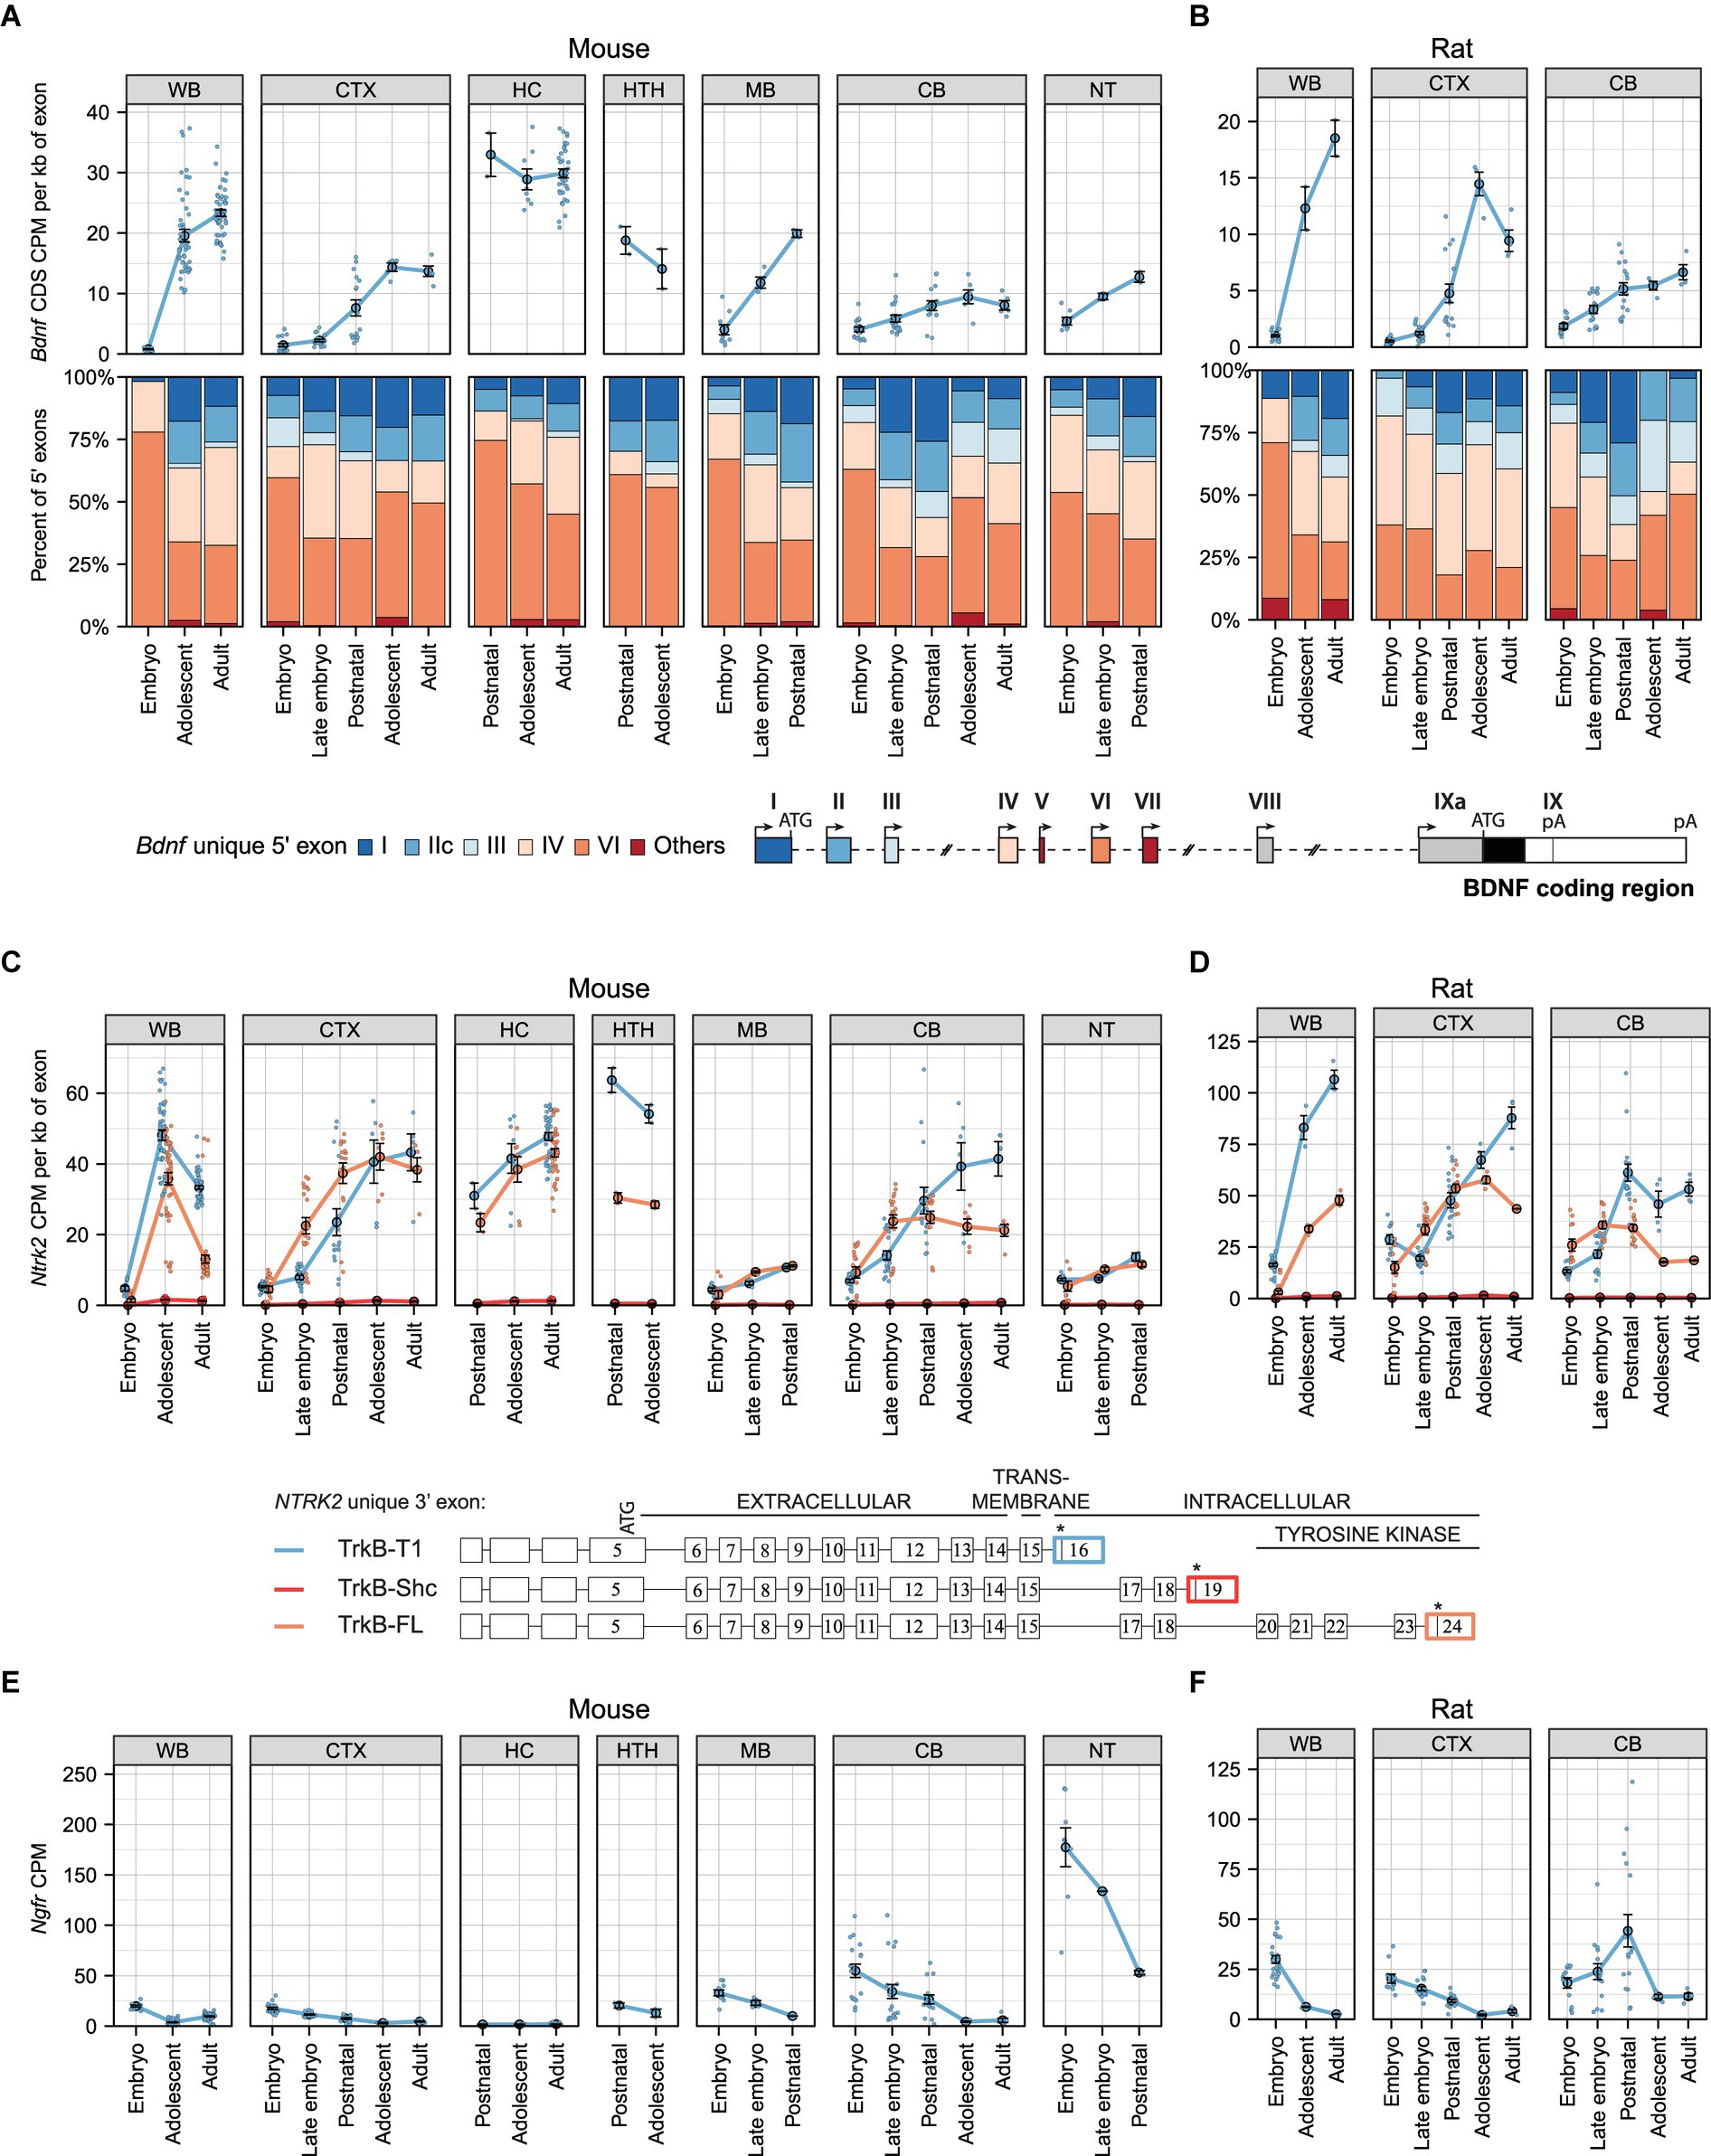
Figure 1. The expression levels of mRNAs encoding BDNF and its receptors TrkB (Ntrk2 mRNA) and p75NTR (Ngfr mRNAs) during murine development in different brain regions. Meta-analysis of Bdnf, Ntrk2 (encoding TrkB) and Ngfr (encoding p75NTR) expression levels in mouse (A,C,E) and rat (B,D,F) brain regions throughout development. Levels in embryo (E10.5-E14.5/E11-E15 mouse/rat), late embryo (E15.5-E18.5/E17-E20 mouse/rat), postnatal (P0-P14), adolescent (P22-56) and adult (P62+) animals are shown. (A,B) Total Bdnf expression measured by levels of Bdnf coding sequence (CDS, upper panel) and distribution of Bdnf 5′ exons (lower panel) are shown as depicted on the schematics of murine gene structure with different colors. The exons indicated with gray color were not included in the analysis of 5′ exons. (C,D) The mRNA levels of different TrkB isoforms based on the levels of unique 3′ exons of the Ntrk2 gene (rat or mouse counterpart of human NTRK2 exons 16, 19, 24). The 3′ exons specific for TrkB isoforms TrkB-T1, TrkB-Shc, and TrkB-FL were measured as shown with colors on the schematics [adapted from Luberg et al. (2010)]. Asterisks on the schematics mark stop-codons. (E,F) Total Ngfr mRNA expression levels. Data from individual animals are shown as small dots, circles indicate mean values and error bars represent standard error of the mean (SEM). All used datasets and underlying data are shown in Supplementary Table 3. WB – whole brain, CTX – cerebral cortex, CB – cerebellum, HC – hippocampus, HTH – hypothalamus, MB – midbrain, NT – neural tube, CDS – coding sequence, CPM – counts per million.
We then analyzed the developmental expression of Bdnf transcripts which differ in their 5′ exons. We detected all main Bdnf transcripts, with most transcripts containing 5′ exons IV and VI, and a lower proportion of transcripts containing exons I, IIc, and III (Figures 1A,B). Bdnf exon I and IIc-containing mRNAs contribute more to total Bdnf mRNA levels in the mouse cerebral cortex and hypothalamus and less in the hippocampus (Figure 1A), which is in agreement with previously published contribution of different Bdnf transcripts to BDNF protein levels in these brain regions (Maynard et al., 2016). Notably, the relative proportion of Bdnf exon I and IIc transcripts generally increases and proportion of Bdnf exon VI transcripts slightly decreases during mouse and rat development (Figures 1A,B). In contrast to other brain regions, the proportion of Bdnf exon I-containing transcripts decreases during postnatal cerebellar development in both mouse and rat (Figures 1A,B). Taken together, our results show developmental upregulation of total Bdnf mRNA levels and specific regulation of Bdnf transcripts in different parts of the central nervous system.
Bdnf mRNA levels in adult brain in different mouse strains
Next, we aimed to determine whether Bdnf levels are similar in different laboratory mouse strains, and we found that the levels of Bdnf in the whole brain and hippocampi of adult mice are relatively stable between the strains (Supplementary Figure S1A, Supplementary Table 4). The proportions of different Bdnf transcripts are roughly consistent between different mouse strains, although the hippocampus of PWD/Ph strain exhibits higher proportion of exon I and IIc-containing transcripts than the other analyzed strains (Supplementary Figure S1A). Despite some fluctuations, total Bdnf mRNA levels and proportions of transcripts are similar between mouse strains.
Bdnf mRNA levels in different brain regions of adult mouse and rat
A comprehensive analysis of different brain regions in adult mouse shows that total Bdnf mRNA levels vary substantially, with the highest levels of Bdnf mRNA found in the hippocampus and different cortical regions, and the lowest in the striatum (caudate putamen; Supplementary Figure S2A; Supplementary Table 5). Bdnf exon I-, IIc-, IV- and VI-containing transcripts are the major Bdnf transcripts and are expressed in different brain regions, with Bdnf exon I and IV generally accounting for over half of the Bdnf transcripts (Supplementary Figure S2A). Interestingly, the proportion of exon I and IIc-containing transcripts is the highest in the septum, amygdala, thalamus, hypothalamus, midbrain, and pons and medulla, where these transcripts form approximately half of the total Bdnf mRNA pool (Supplementary Figure S2A). In contrast, retina, pituitary gland, and cerebellum almost completely lack Bdnf exon I-containing transcripts (Supplementary Figure S2A).
Similarly, in the adult rat central nervous system the highest total Bdnf mRNA levels are in the hippocampus and different cortical regions (Supplementary Figure S3A; Supplementary Table 6). Major Bdnf transcripts contain exons I, IIc, IV, or VI, however, exon III also remarkably contributes to the total Bdnf pool in many brain regions (Supplementary Figure S3A). It is worth noting that in this dataset, Bdnf exon VI-containing transcripts do not contribute significantly to total Bdnf mRNA levels in different cortical regions (Supplementary Figure S3A). Altogether, our results show that total Bdnf mRNA levels and proportion of transcripts vary between brain regions in both adult mouse and rat.
TrkB mRNA expression levels in mouse and rat brain during development
Next, we aimed to revisit the expression of different Ntrk2 mRNAs encoding different TrkB protein isoforms (hereafter referred to as TrkB mRNAs). Our analysis shows that both full-length TrkB (hereafter TrkB-FL) and truncated TrkB-T1 mRNA levels increase remarkably in both mouse (Figure 1C) and rat (Figure 1D) whole brain during development. In mouse the mRNA levels of TrkB-T1 and TrkB-FL increase and are mostly similar throughout development, except in the hypothalamus and adult mouse cerebellum where the TrkB-T1 mRNA levels are much higher than the levels of TrkB-FL (Figure 1C). Interestingly, in rat the expression levels of TrkB-T1 isoform reach higher levels than the full-length isoform in both cerebral cortex and cerebellum during development (Figure 1D). Notably, the mRNA levels of TrkB-Shc isoform are almost undetectable in the studied mouse and rat brain regions (Figures 1C,D). In different adult mouse and rat brain regions, TrkB-T1 mRNA levels are consistently higher than full-length TrkB isoforms (Supplementary Figures S2B, S3B). Collectively, our results show upregulation of TrkB isoform mRNA levels during murine development, with higher levels of TrkB-T1 than TrkB-FL.
The mRNA levels of different TrkB isoforms vary in different mouse strains. For example, the mRNA levels of TrkB-T1 and TrkB-FL isoforms are roughly equal in the whole brain of adult BALB/cJ and C57BL6/6NJ mice, whereas TrkB-T1 is expressed at a higher level than TrkB-FL in adult NZO, NOD/Ltj, and 129S1 mice (Supplementary Figure S1B). The mRNA levels of different TrkB isoforms are more stable in the hippocampus of different mouse strains (Supplementary Figure S1B). In summary, our results reveal that BDNF signaling may differ between mouse strains due to the varying expression of TrkB isoforms.
p75NTR mRNA expression levels in mouse and rat brain during development
Next, we analyzed the expression levels of the other BDNF receptor, p75NTR. Our results show that the expression of the Ngfr gene (encoding p75NTR, hereafter referred to as p75NTR mRNA) mainly decreases in both mouse (Figure 1E) and rat (Figure 1F) development, implying that TrkB, whose expression shows the opposite trend, is the main receptor of BDNF in the adult brain. The mRNA levels of p75NTR are low and slightly differ between mouse strains in the whole brain but are more similar in the hippocampi (Supplementary Figure S1C). Interestingly, in the adult mouse brain the levels of p75NTR are generally very low, with the highest expression seen in the retina (Supplementary Figure S2C), where TrkB isoform mRNAs are expressed at very low levels (Supplementary Figure S2B). In adult rat brain regions, the levels of p75NTR are also low, with the highest levels detected in the medial preoptic area (Supplementary Figure S3C). Taken together, our results show a developmental decrease in the levels of p75NTR in the murine central nervous system.
Expression levels of total Bdnf mRNA and different transcripts in mouse and rat non-neural tissues during development
We next focused on describing the expression of Bdnf and its receptors in non-neural tissues. Our analysis shows that during murine development the total Bdnf mRNA levels increase in mouse heart and decrease in testis (Figure 2A; Supplementary Table 7), whereas in rat total Bdnf mRNA levels strongly increase in the heart, but decrease in the liver, kidney, testis, and ovary to almost undetectable levels by adulthood (Figure 2B). In contrast to mouse, Bdnf mRNA levels in rat kidney decrease during development (Figure 2B).
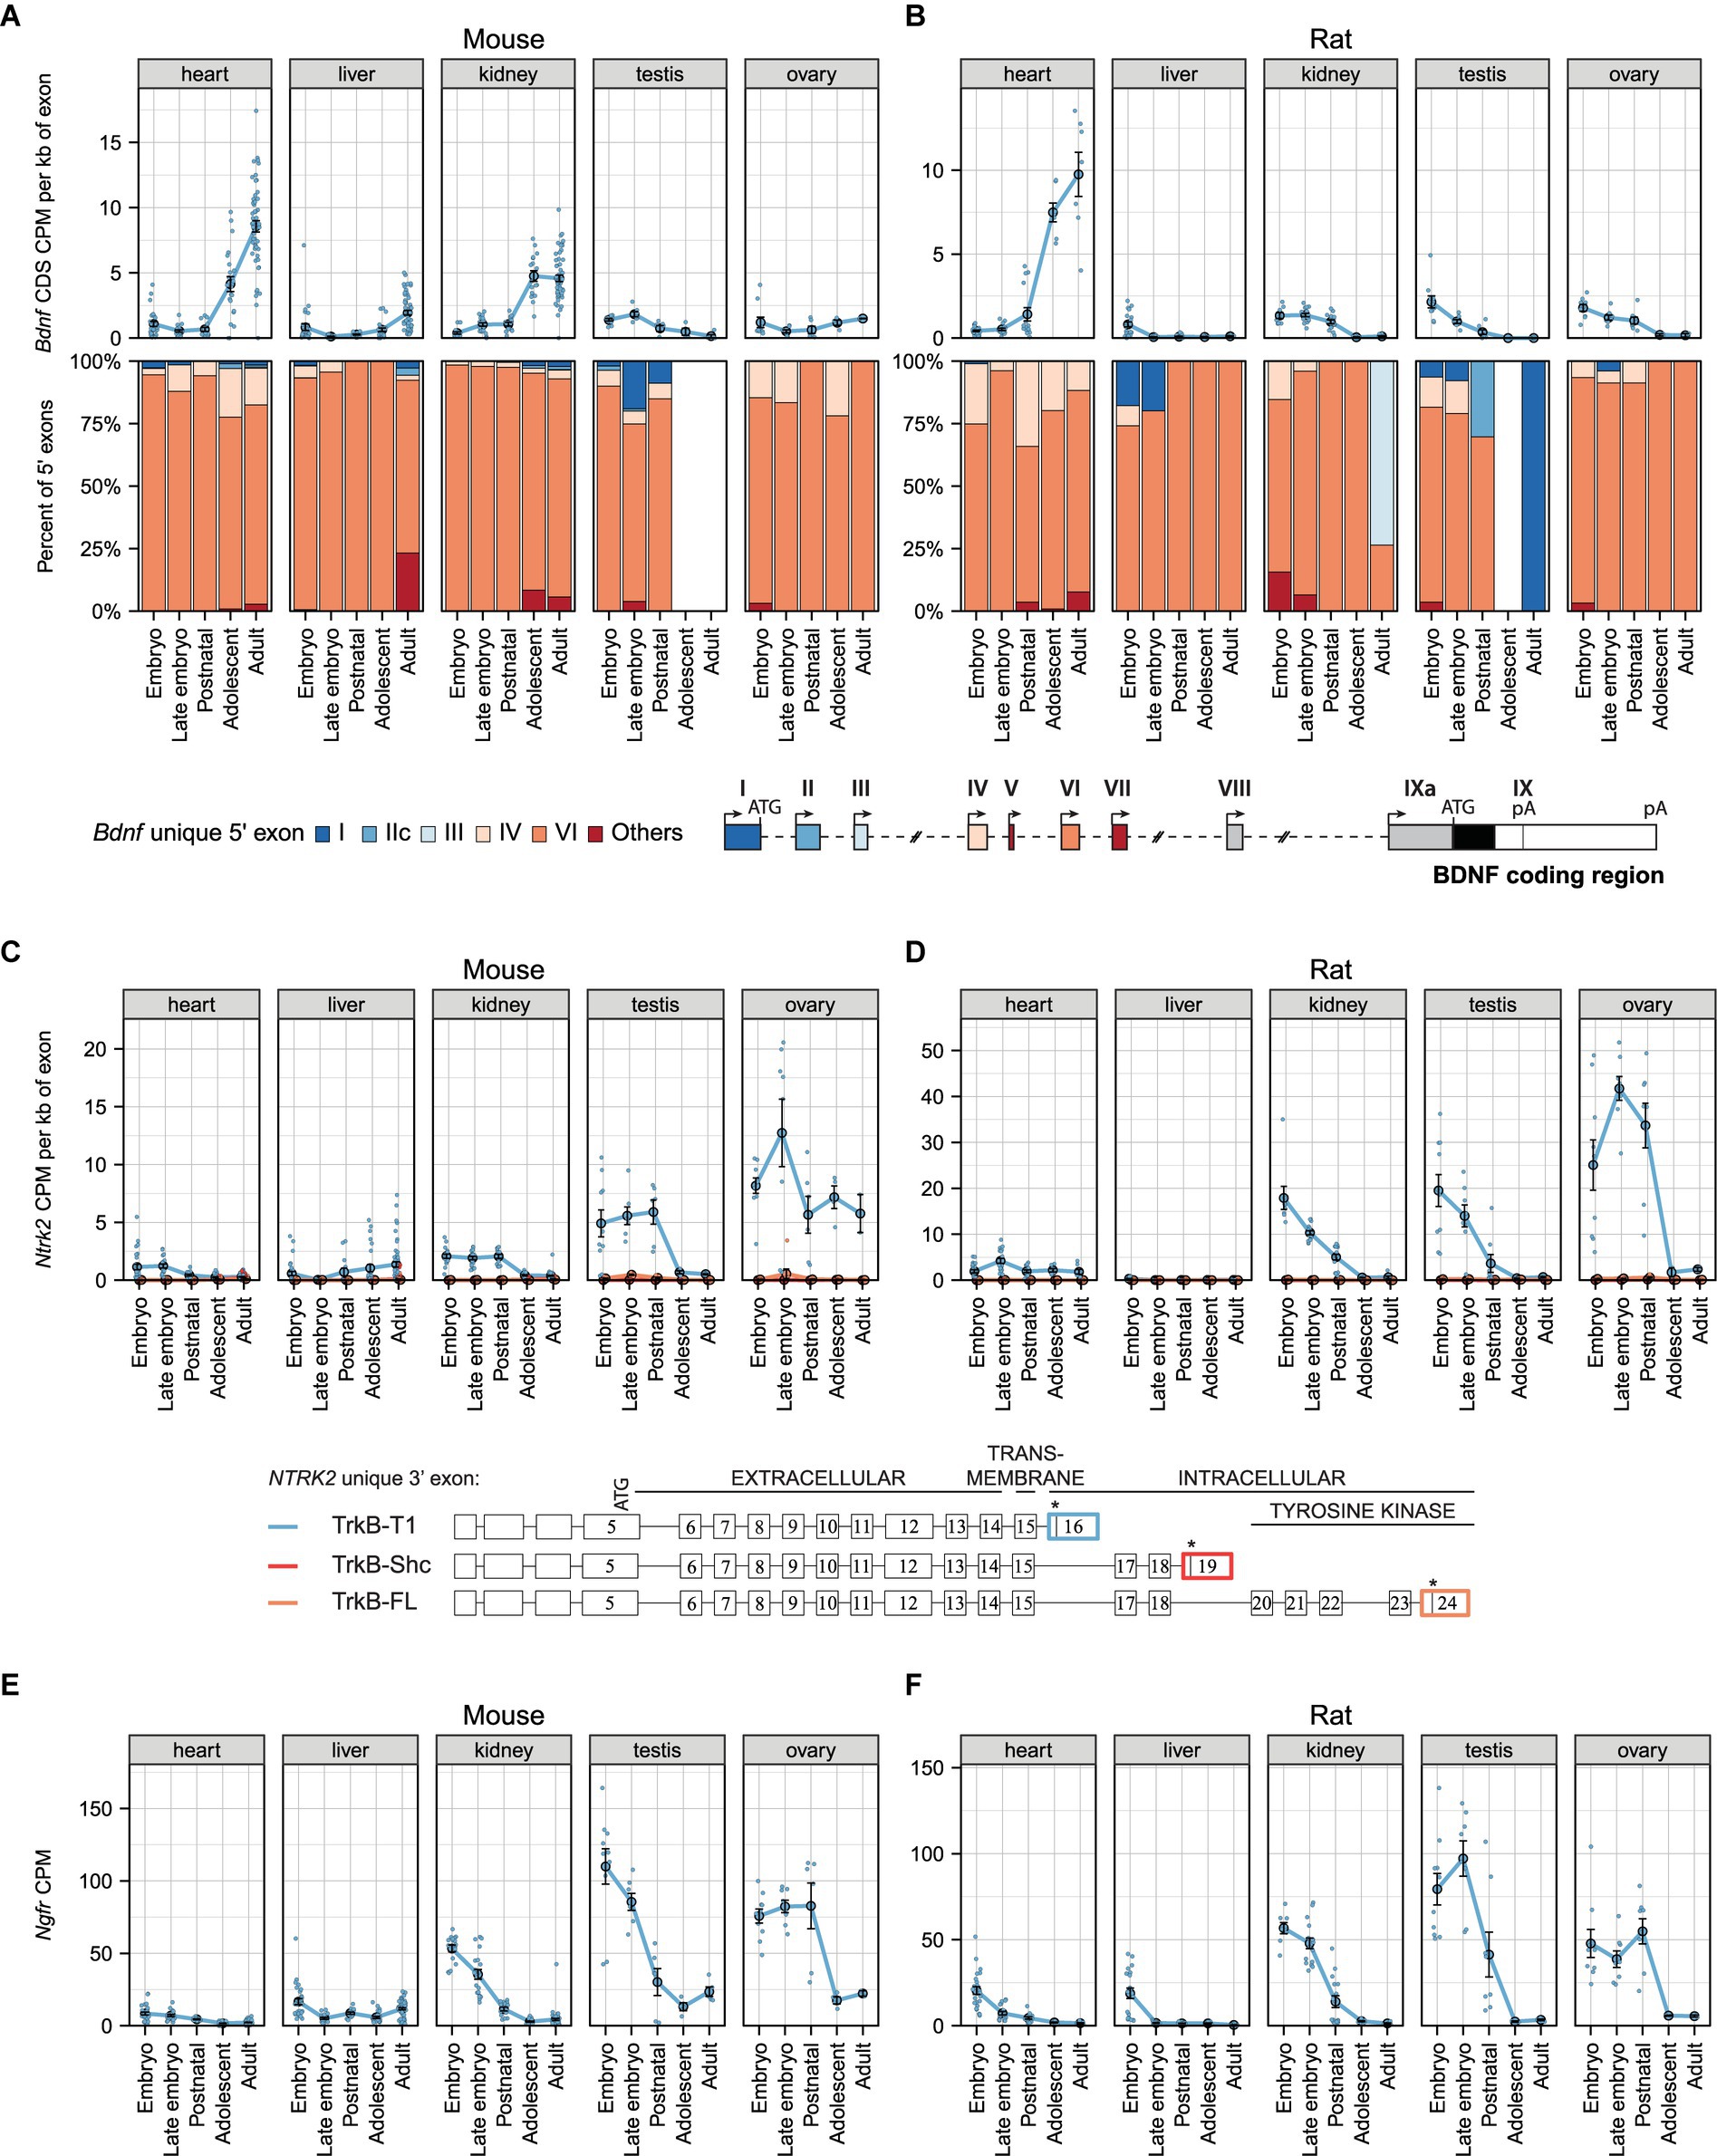
Figure 2. The expression levels of mRNAs encoding BDNF and its receptors TrkB (Ntrk2 mRNAs) and p75NTR (Ngfr mRNAs) during development in murine non-neural tissues. Meta-analysis of Bdnf, Ntrk2 (encoding TrkB) and Ngfr (encoding p75NTR) expression in mouse (A,C,E) and rat (B,D,F) non-neural tissues during development. The expression levels in embryo (E10.5-E14.5/E11-E15 mouse/rat), late embryo (E15.5-E18.5/E17-E20 mouse/rat), postnatal (P0-P14), adolescent (P22-56) and adult (P62+) animals are shown. (A,B) Total Bdnf expression measured by levels of Bdnf coding sequence (CDS, upper panel) and distribution of levels of Bdnf 5′ exons (lower panel) are shown as depicted on the schematics of murine gene structure. The exons indicated with gray color were not included in the analysis of 5′ exons. White box in the proportion of Bdnf 5′ exons indicates that the expression of Bdnf was too low for this calculation. (C,D) The mRNA levels of different TrkB isoforms based on the levels of unique 3′ exons of the Ntrk2 gene (rat or mouse counterpart of human exon 16, 19, 24). The 3′ exons specific for TrkB isoforms TrkB-T1, TrkB-Shc, and TrkB-FL are shown on the schematics (adapted from Luberg et al. (2010)). Asterisks on the schematics mark stop-codons. (E,F) Total Ngfr mRNA expression levels. Data from individual animals are shown as small dots, circles indicate mean values and error bars represent standard error of the mean (SEM). All used datasets and underlying data are shown in Supplementary Table 7. CDS – coding sequence, CPM – counts per million.
We next focused on the expression of different Bdnf 5′ transcripts and determined that Bdnf exon VI-containing transcripts are the major Bdnf transcripts in murine non-neural tissues, contributing to over 75% of total Bdnf transcripts throughout development (Figures 2A,B). Interestingly, Bdnf exon IV transcripts are expressed, although at low levels, in both mouse and rat heart (Figures 2A,B). Also, Bdnf exon I and IIc-containing transcripts are present in the testis during early development in both mouse and rat (Figures 2A,B). Collectively, our results show developmentally regulated levels of Bdnf mRNA in certain murine non-neural tissues where the majority of Bdnf transcripts contain exon VI.
mRNA levels of TrkB isoforms and p75NTR in mouse and rat non-neural tissues during development
We next investigated mRNA levels of different TrkB isoforms during the development of mouse and rat in non-neural tissues. The major TrkB isoform in murine non-neural tissues is TrkB-T1, while TrkB-FL and TrkB-Shc isoforms are almost undetectable (Figures 2C,D). In the kidney, testis, and ovary, the expression of TrkB-T1 isoform is high in early developmental stages and decreases during development (Figures 2C,D). Our analysis also shows that TrkB-T1 isoform is expressed at very low levels in both mouse and rat heart and liver (Figures 2C,D). Similar expression patterns are observed for p75NTR mRNA levels (Figures 2E,F). Altogether, our results show developmental downregulation of TrkB-T1 isoform and p75NTR in murine non-neural tissues.
Bdnf, TrkB, and p75NTR mRNA levels in various tissues in adult murines
We next conducted a meta-analysis of adult mouse and rat neural and non-neural tissues, combining data from various sources (see Supplementary Table 8 for details). Compared to non-neural tissues, Bdnf expression levels are consistently higher in the murine brain (Supplementary Figures S4A,B; Supplementary Table 8). Among the non-neural tissues that significantly express Bdnf, the heart and lung show similar Bdnf mRNA levels to those found in the brain. Other non-neural tissues that express Bdnf include the stomach, kidney, and heart in mouse (Supplementary Figure S4A) and the esophagus in rat (Supplementary Figure S4B). While the dominant Bdnf transcripts in both mouse and rat brain contain exons I, IIc, IV and VI, in most non-neural tissues the major Bdnf transcripts contain exon VI (Supplementary Figures S4A,B). Transcripts containing Bdnf exons I, IIc, and IV also contribute to total Bdnf mRNA levels in adult mouse skin, bone, and adipose tissue (Supplementary Figure S4A). In summary, our results show that some adult murine non-neural tissues express total Bdnf mRNA at comparable levels to those in the brain and the majority of Bdnf transcripts contain exon VI.
Interestingly, while both TrkB-FL and TrkB-T1 isoforms are expressed in adult murine brain, only TrkB-T1 mRNA is expressed in the non-neural tissues – in mouse lung, skin, adipose tissues, esophagus, ovary, and adrenal gland (Supplementary Figure S4C) and in rat lung, esophagus, ileum, and spleen (Supplementary Figure S4D). p75NTR mRNA levels are expressed highest in mouse in skin, mesenteric adipose tissue, spleen, ovary, and testis, and the levels in other tissues show similar low expression levels as in the brain (Supplementary Figure S4E). In rat the p75NTR mRNA levels are highest in the cerebellum, thymus, spleen, and various parts of the digestive system (Supplementary Figure S4F). Overall, our results show TrkB-T1 and p75NTR expression in some adult murine non-neural tissues.
Bdnf, TrkB, and p75NTR mRNA levels in various mouse tissues during aging
Finally, we analyzed Bdnf, TrkB, and p75NTR mRNA levels in aging mouse. In the whole brain and most studied mouse non-neural tissues, total Bdnf mRNA levels are relatively stable throughout adult life, except for gonadal adipose tissue and lung, where the total Bdnf mRNA levels increase during aging (Supplementary Figure S5A; Supplementary Table 9). In non-neural tissues, Bdnf transcripts mainly contain exon VI, albeit in heart a very consistent expression of both Bdnf exon IV- and VI-containing transcripts is observed (Supplementary Figure S5A). During mouse aging the proportion of Bdnf exon I- and IIc-containing transcripts increases in mesenteric adipose tissue and decrease in gonadal adipose tissues (Supplementary Figure S5A). In the brain, TrkB-T1 and TrkB-FL isoforms are both stably expressed throughout life (Supplementary Figure S5B). Of the analyzed non-neural tissues, skin, adipose tissues, and lung show expression of TrkB-T1 isoform, where no major changes in the expression during aging are seen (Supplementary Figure S5B). p75NTR is expressed in the skin, different adipose tissues, liver, and spleen, with the expression levels increasing in the skin and spleen and decreasing in the mesenteric adipose tissues during aging (Supplementary Figure S5C). Collectively, Bdnf and TrkB mRNA levels do not change notably within one tissue during mouse aging.
BDNF, TRKB, and P75NTR mRNA expression levels in human brain during development
Next, we aimed to determine the expression pattern of BDNF and its receptors in humans. Compared to the murine BDNF gene structure, the human BDNF gene is more complex and has two additional 5′ exons (Vh and VIIIh) (Pruunsild et al., 2007). Overall, BDNF transcripts are generated similarly in humans and murines, however, in rare cases multiple 5′ exons are used in humans (e.g., BDNF exons VIII and VIIIh can be used as internal exons) (Pruunsild et al., 2007). Our analysis shows that total BDNF mRNA levels rise in different brain regions during human development (Figure 3A; Supplementary Table 10), reaching the highest levels in the adult hippocampus and infant thalamus (Figure 3A). In the striatum almost no BDNF mRNA can be detected (Figure 3A). Taken together, our results show developmental upregulation of BDNF mRNA levels in the human brain.
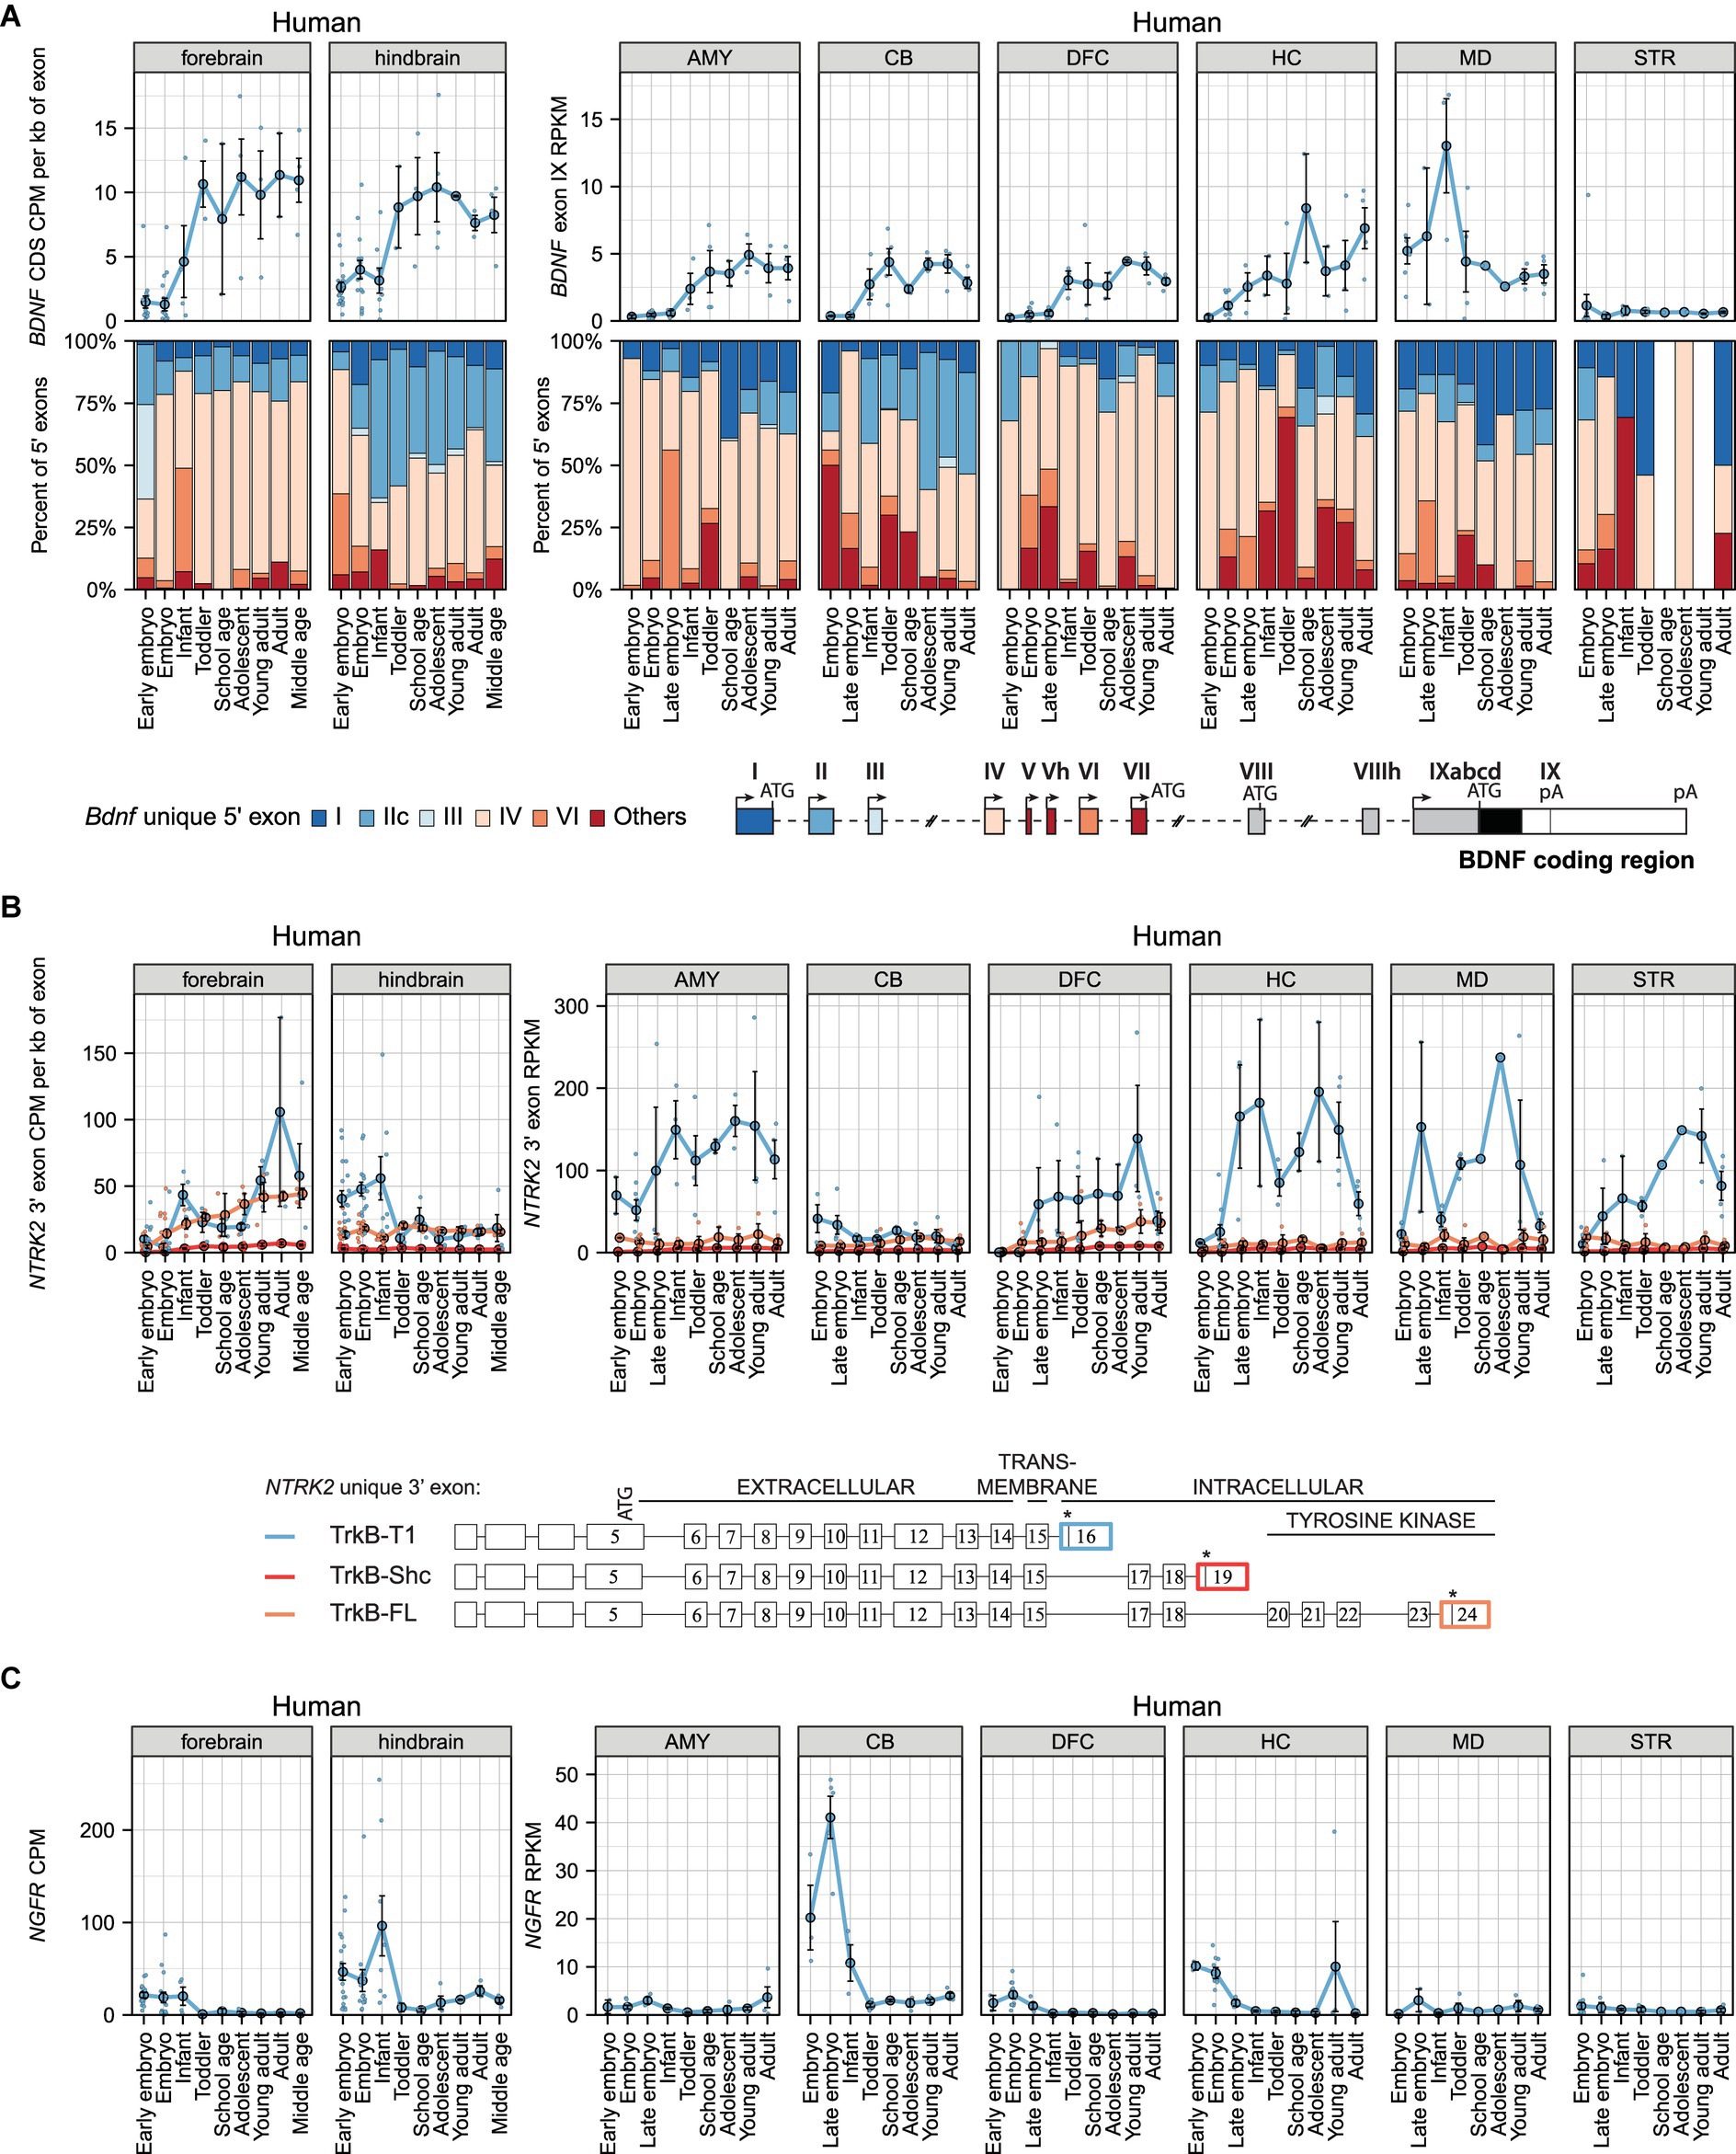
Figure 3. The expression levels of mRNAs encoding BDNF and its receptors TRKB (NTRK2 mRNAs) and p75NTR (NGFR mRNAs) in human brain regions throughout development. Visualization of BDNF, NTRK2 (encoding TRKB) and NGFR (encoding P75NTR) expression data from Cardoso-Moreira et al. (2019) (left panels) and human developmental transcriptome data from BrainSpan project (right panels). The expression levels in early embryo [0–9 postcoital week (PCW)], embryo (10–19 PCW), late embryo (20–39 PCW), infant (younger than 12 months), toddler (1–4 years old), school age (7–8 years old), adolescent (10–17 years old), young adult (18–29.99 years old), adult (30–39.99 years old), and middle-aged (40–58 years old) humans are shown. (A) Total BDNF expression measured by levels of BDNF coding sequence (CDS, upper panel) and distribution of levels of BDNF 5′ exons (lower panel) are shown as depicted on the schematics of human gene structure. The exons indicated with gray color were not included in the analysis of 5′ exons. (B) The mRNA levels of different TrkB isoforms based on the levels of unique 3′ exons of NTRK2 gene (exon 16, 19, 24). The 3′ exons specific for TRKB isoforms TRKB-T1, TRKB-SHC, and TRKB-FL are shown on the scheme (adapted from Luberg et al. (2010)). Asterisks on the schematics mark stop-codons. (C) Total NGFR mRNA expression levels. Data from individual animals are shown as small dots, circles indicate mean values and error bars represent standard error of the mean (SEM). All used datasets and underlying data are shown in Supplementary Table 10. AMY – amygdaloid complex, CB – cerebellar cortex, DFC – dorsolateral prefrontal cortex, HC – hippocampus (hippocampal formation), MD – mediodorsal nucleus of thalamus, STR – striatum, CDS – coding sequence, CPM – counts per million.
Our analysis further shows that BDNF exon IV-containing transcripts are the most ubiquitously expressed in different brain regions, while the proportions of BDNF exon VI-containing transcripts are low (Figure 3A). Notably, in the hindbrain and cerebellum BDNF exon IIc transcripts comprise a remarkable proportion of total BDNF mRNA, and this proportion increases during development, whereas the proportion of BDNF exon I transcripts is very low in these brain regions (Figure 3A). In contrast, in the mediodorsal nucleus of thalamus, BDNF exon I-containing transcripts notably contribute to the total BDNF mRNA pool throughout development and a high proportion of exon I transcripts is also seen in the amygdala and adult hippocampus (Figure 3A). Overall, it appears that BDNF exon IV-containing transcripts are the main transcripts in most human brain regions (except the cerebellum), whereas other transcripts show brain region-specific expression patterns.
Next, we analyzed the mRNA levels of TRKB and P75NTR. Our analysis shows that TRKB-T1 is the main isoform expressed in most brain regions (except the cerebellum) across all developmental stages (Figure 3B). Furthermore, TRKB-T1 mRNA levels remarkably decrease in the adult hippocampus, thalamus, and striatum compared to levels in young adults (Figure 3B). Interestingly, the mRNA levels of TRKB-FL isoform increase in the forebrain and dorsolateral prefrontal cortex during development (Figure 3B). In other studied brain regions, the mRNA levels of TRKB-FL are low and TRKB-SHC expression is almost undetectable (Figure 3B). Finally, we focused on P75NTR mRNA levels in the human brain and determined that it is expressed at low levels, except in the embryonic hindbrain and cerebellum, which showed high expression levels (Figure 3C). Our results suggest that in adult humans the main BDNF receptor in the brain is TRKB.
BDNF, TRKB, and P75NTR mRNA levels in human non-neural tissues during development
Next, we investigated BDNF expression in human non-neural tissues. Our analysis shows that BDNF is expressed at low levels and its expression decreases in the heart, kidney, and ovary, and increases in the testis during development (Figure 4A; Supplementary Table 11). In adult human, BDNF mRNA expression is highest in the nervous system, but also in the arteries and heart, prostate, and lung (Supplementary Figure S6A; Supplementary Table 12). BDNF exon IV and VI-containing transcripts are the main BDNF transcripts expressed in human non-neural tissues (Figure 4A; Supplementary Figure S6A).
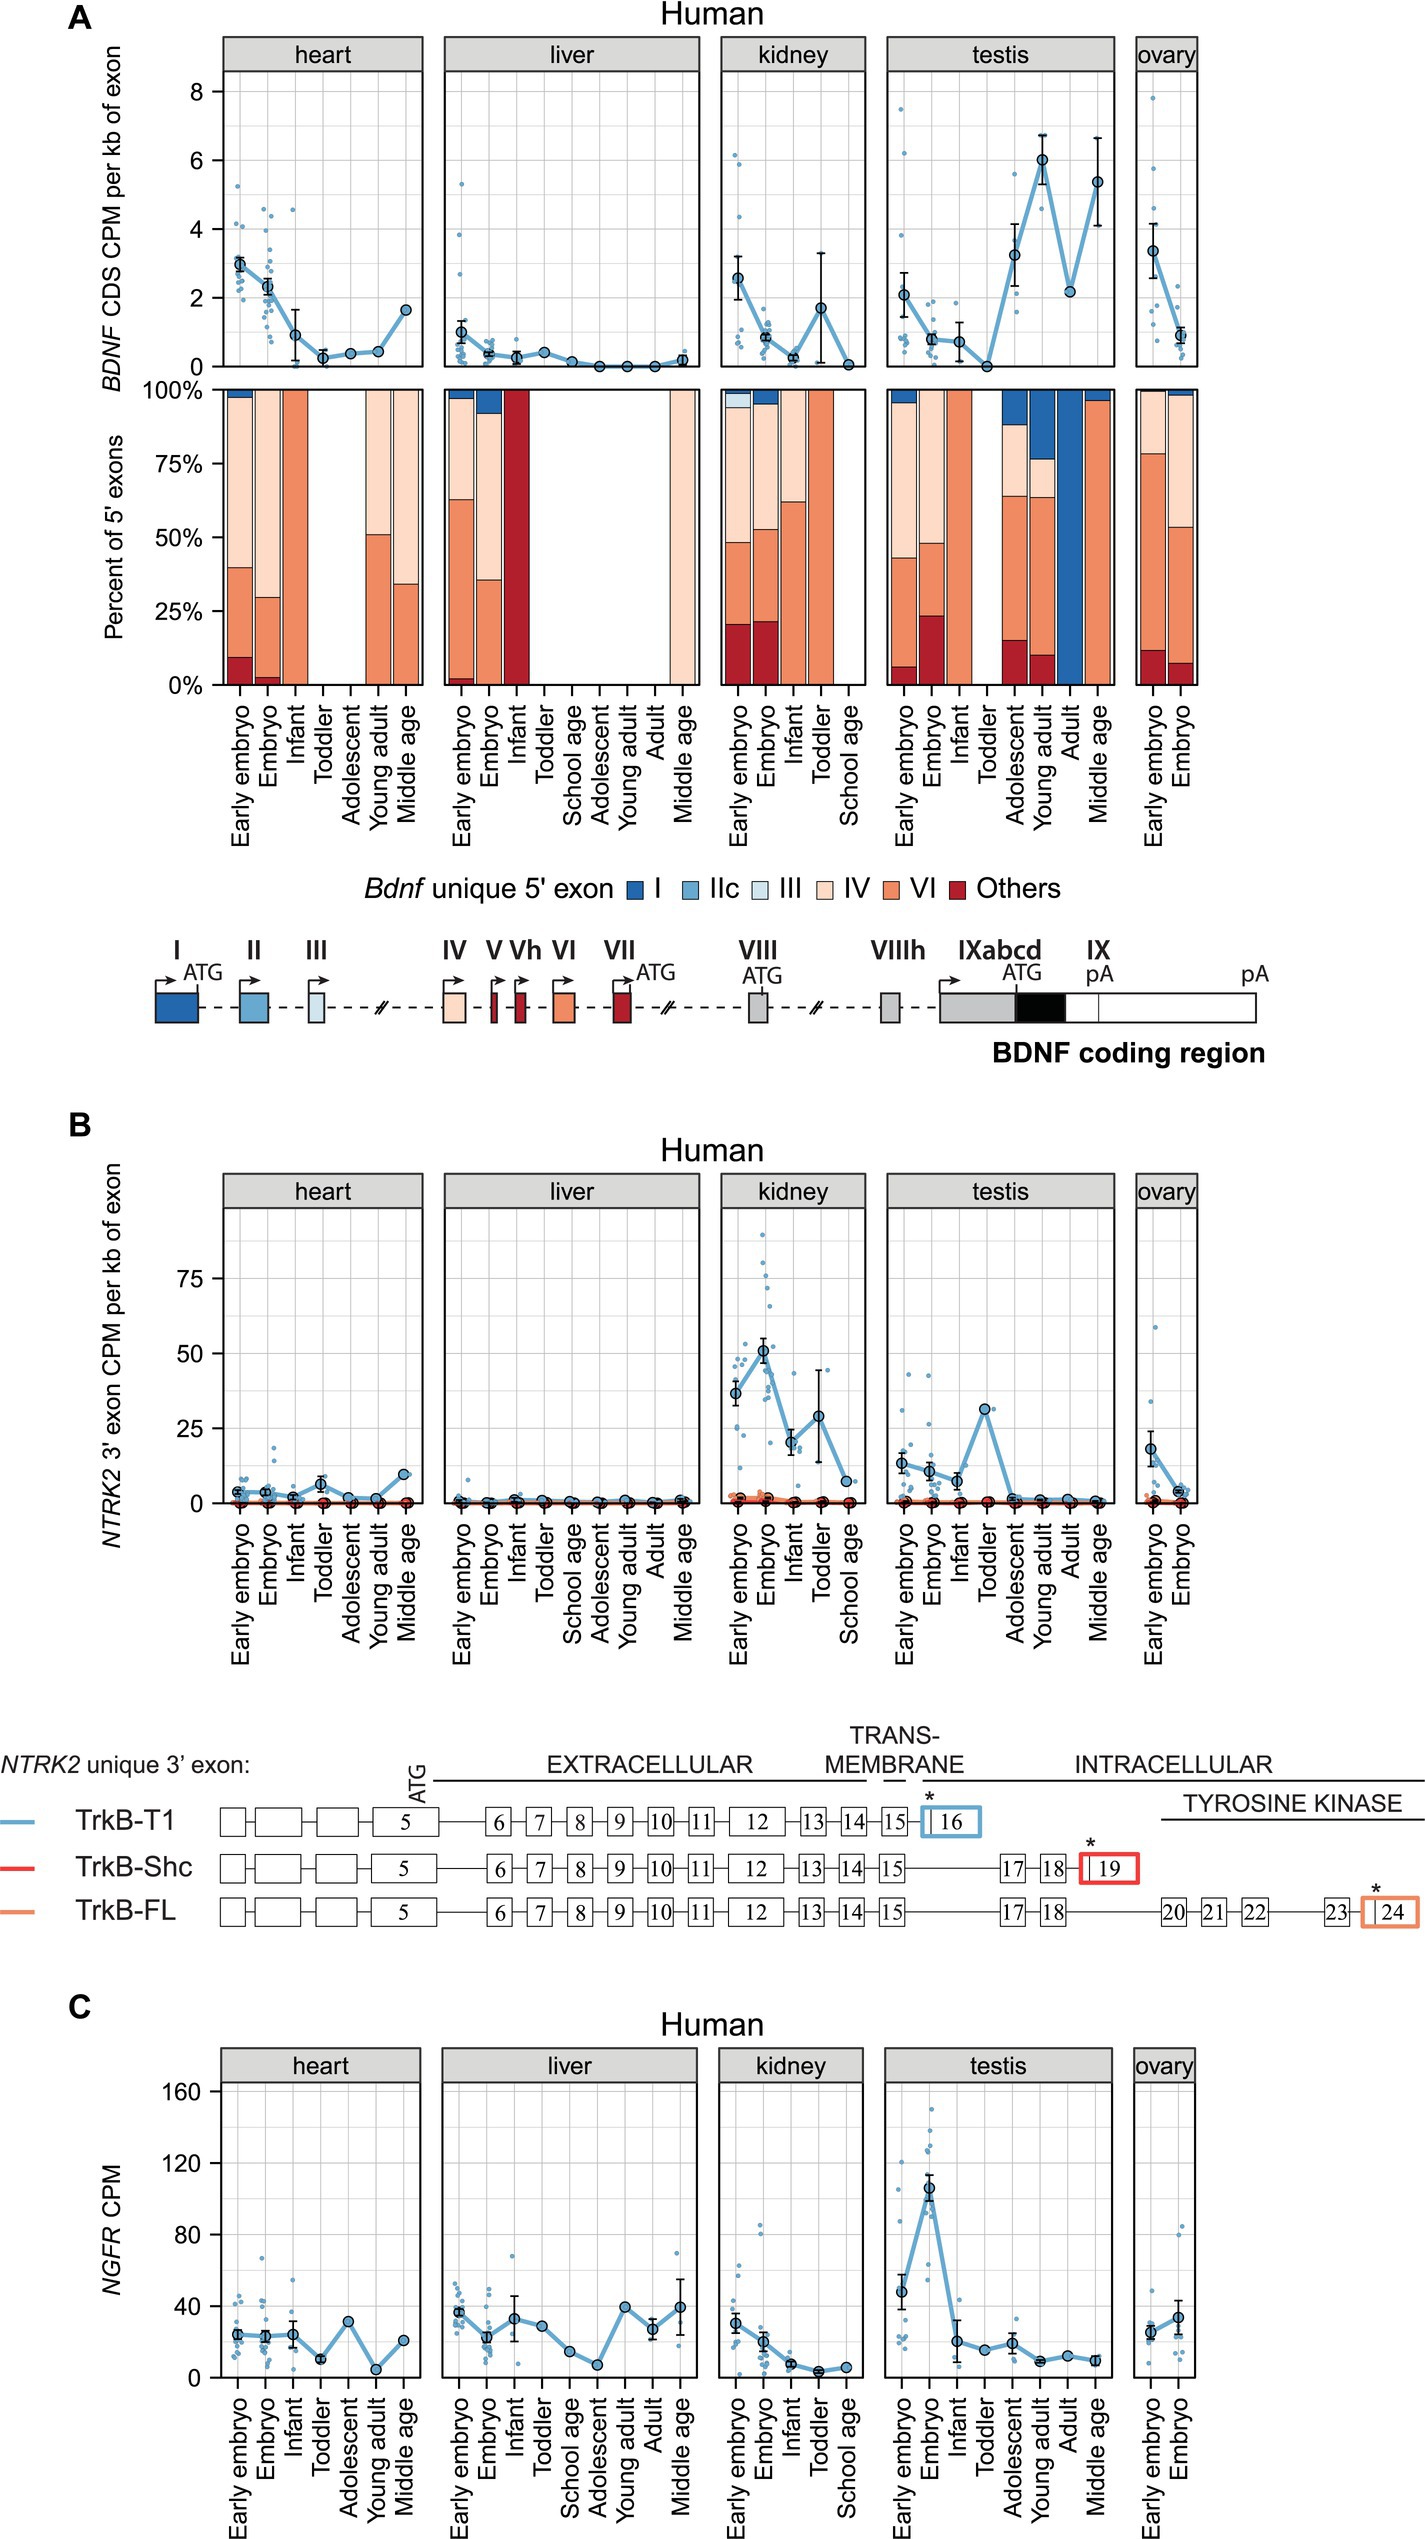
Figure 4. The expression levels of mRNAs encoding BDNF and its receptors TRKB (NTRK2 mRNAs) and p75NTR (NGFR mRNAs) in human non-neural tissues. The expression levels of BDNF, NTRK2 (encoding TRKB), and NGFR (encoding P75NTR) mRNAs in early embryo [0–9 postcoital week (PCW), embryo (10–19 PCW), late embryo (20–39 PCW), infant (younger than 12 months), toddler (1–4 years old), school age (7–8 years old), adolescent (10–17 years old), young adult (18–29.99 years old), adult (30–39.99 years old), and middle-aged (40–58 years old) humans are shown (data from Cardoso-Moreira et al. (2019)]. (A) Total BDNF mRNA levels measured by levels of BDNF coding sequence (CDS, upper panel) and distribution of levels of BDNF 5′ exons FIGURE 4 (Continued)(lower panel) are shown as depicted on the schematics of human BDNF gene structure. The exons indicated with gray color were not included in the analysis of 5′ exons. (B) The mRNA levels of different TRKB isoforms based on the levels of unique 3′ exons of NTRK2 gene (exon 16, 19, 24). The 3′ exons specific for TRKB isoforms TRKB-T1, TRKB-SHC, and TRKB-FL are shown on the scheme (adapted from Luberg et al. (2010)). Asterisks on the scheme mark stop-codons. (C) Total NGFR mRNA expression levels. All used datasets and underlying data are shown in Supplementary Table 11. Data from individual animals are shown as small dots, circles indicate mean values and error bars represent standard error of the mean (SEM). CDS – coding sequence, CPM – counts per million.
The BDNF receptor TRKB-T1 is the only TRKB isoform that is expressed in human non-neural tissues, with the highest levels in embryonic kidney, but found at lower levels also in the heart, testis, and ovary (Figure 4B). During development, the levels of TRKB-T1 decrease in the kidney, testis, and ovary (Figure 4B). Interestingly, in adult human TRKB-T1 is also expressed in non-neural tissues where BDNF is expressed, e.g., in arteries, mammary tissue, adipose tissue, and thyroid (Supplementary Figure S6B). Finally, P75NTR is expressed in the heart, liver, and ovary at similar and stable levels throughout development, while the expression of P75NTR decreases during development in the kidney and testis (Figure 4C). In adult human, the mRNA expression of P75NTR is notably higher in non-neural tissues than in different brain regions, and surprisingly shows the highest expression in the tibial nerve (Supplementary Figure S6C).
Evolutionary analysis of BDNF gene expression in mammalian development
Next, to study whether the expression of BDNF is evolutionarily conserved among mammals, we focused on BDNF mRNA levels and proportions of its transcripts throughout mammalian development. Our results show that during development total BDNF mRNA levels generally increase and reach similar levels in human, rhesus macaque, mouse, rat, and rabbit forebrain and hindbrain, but reach remarkably higher levels in the adult opossum forebrain and hindbrain (note different scale for opossum in the figure) (Figure 5; Supplementary Table 13). Although total BDNF mRNA levels are quite similar in the forebrain of different mammals, we noted significant differences in the expression of different BDNF transcripts (Figure 5A). In human and rhesus macaque forebrain, vast majority (> 75%) of BDNF transcripts are exon IV mRNAs, followed by lower levels of exon I and IIc mRNAs and almost no contribution by exon VI mRNAs (Figure 5A). Surprisingly, in mouse and rat forebrain, all Bdnf 5′ exons contribute to Bdnf mRNA levels (Figure 5A). Although exon VI mRNAs are also prevalent in the early development of rabbit and opossum forebrain, the proportion of exon VI-containing transcripts drops quickly during development to almost undetectable levels in the adult organism. It appears that the proportion of transcripts arising from the first cluster of BDNF exons (exon I, IIc, and III) has decreased during mammalian evolution, with the highest levels seen in opossum and lowest in primates (Figure 5A). In human and rhesus macaque hindbrain, BDNF transcripts containing exon IIc and IV are the main transcripts, while in mouse, rat, rabbit, and opossum Bdnf exon VI also contributes notably to the total pool of BDNF (Figure 5B). Collectively, our results show evolutionary differences in the expression of different BDNF transcripts in mammalian brain.
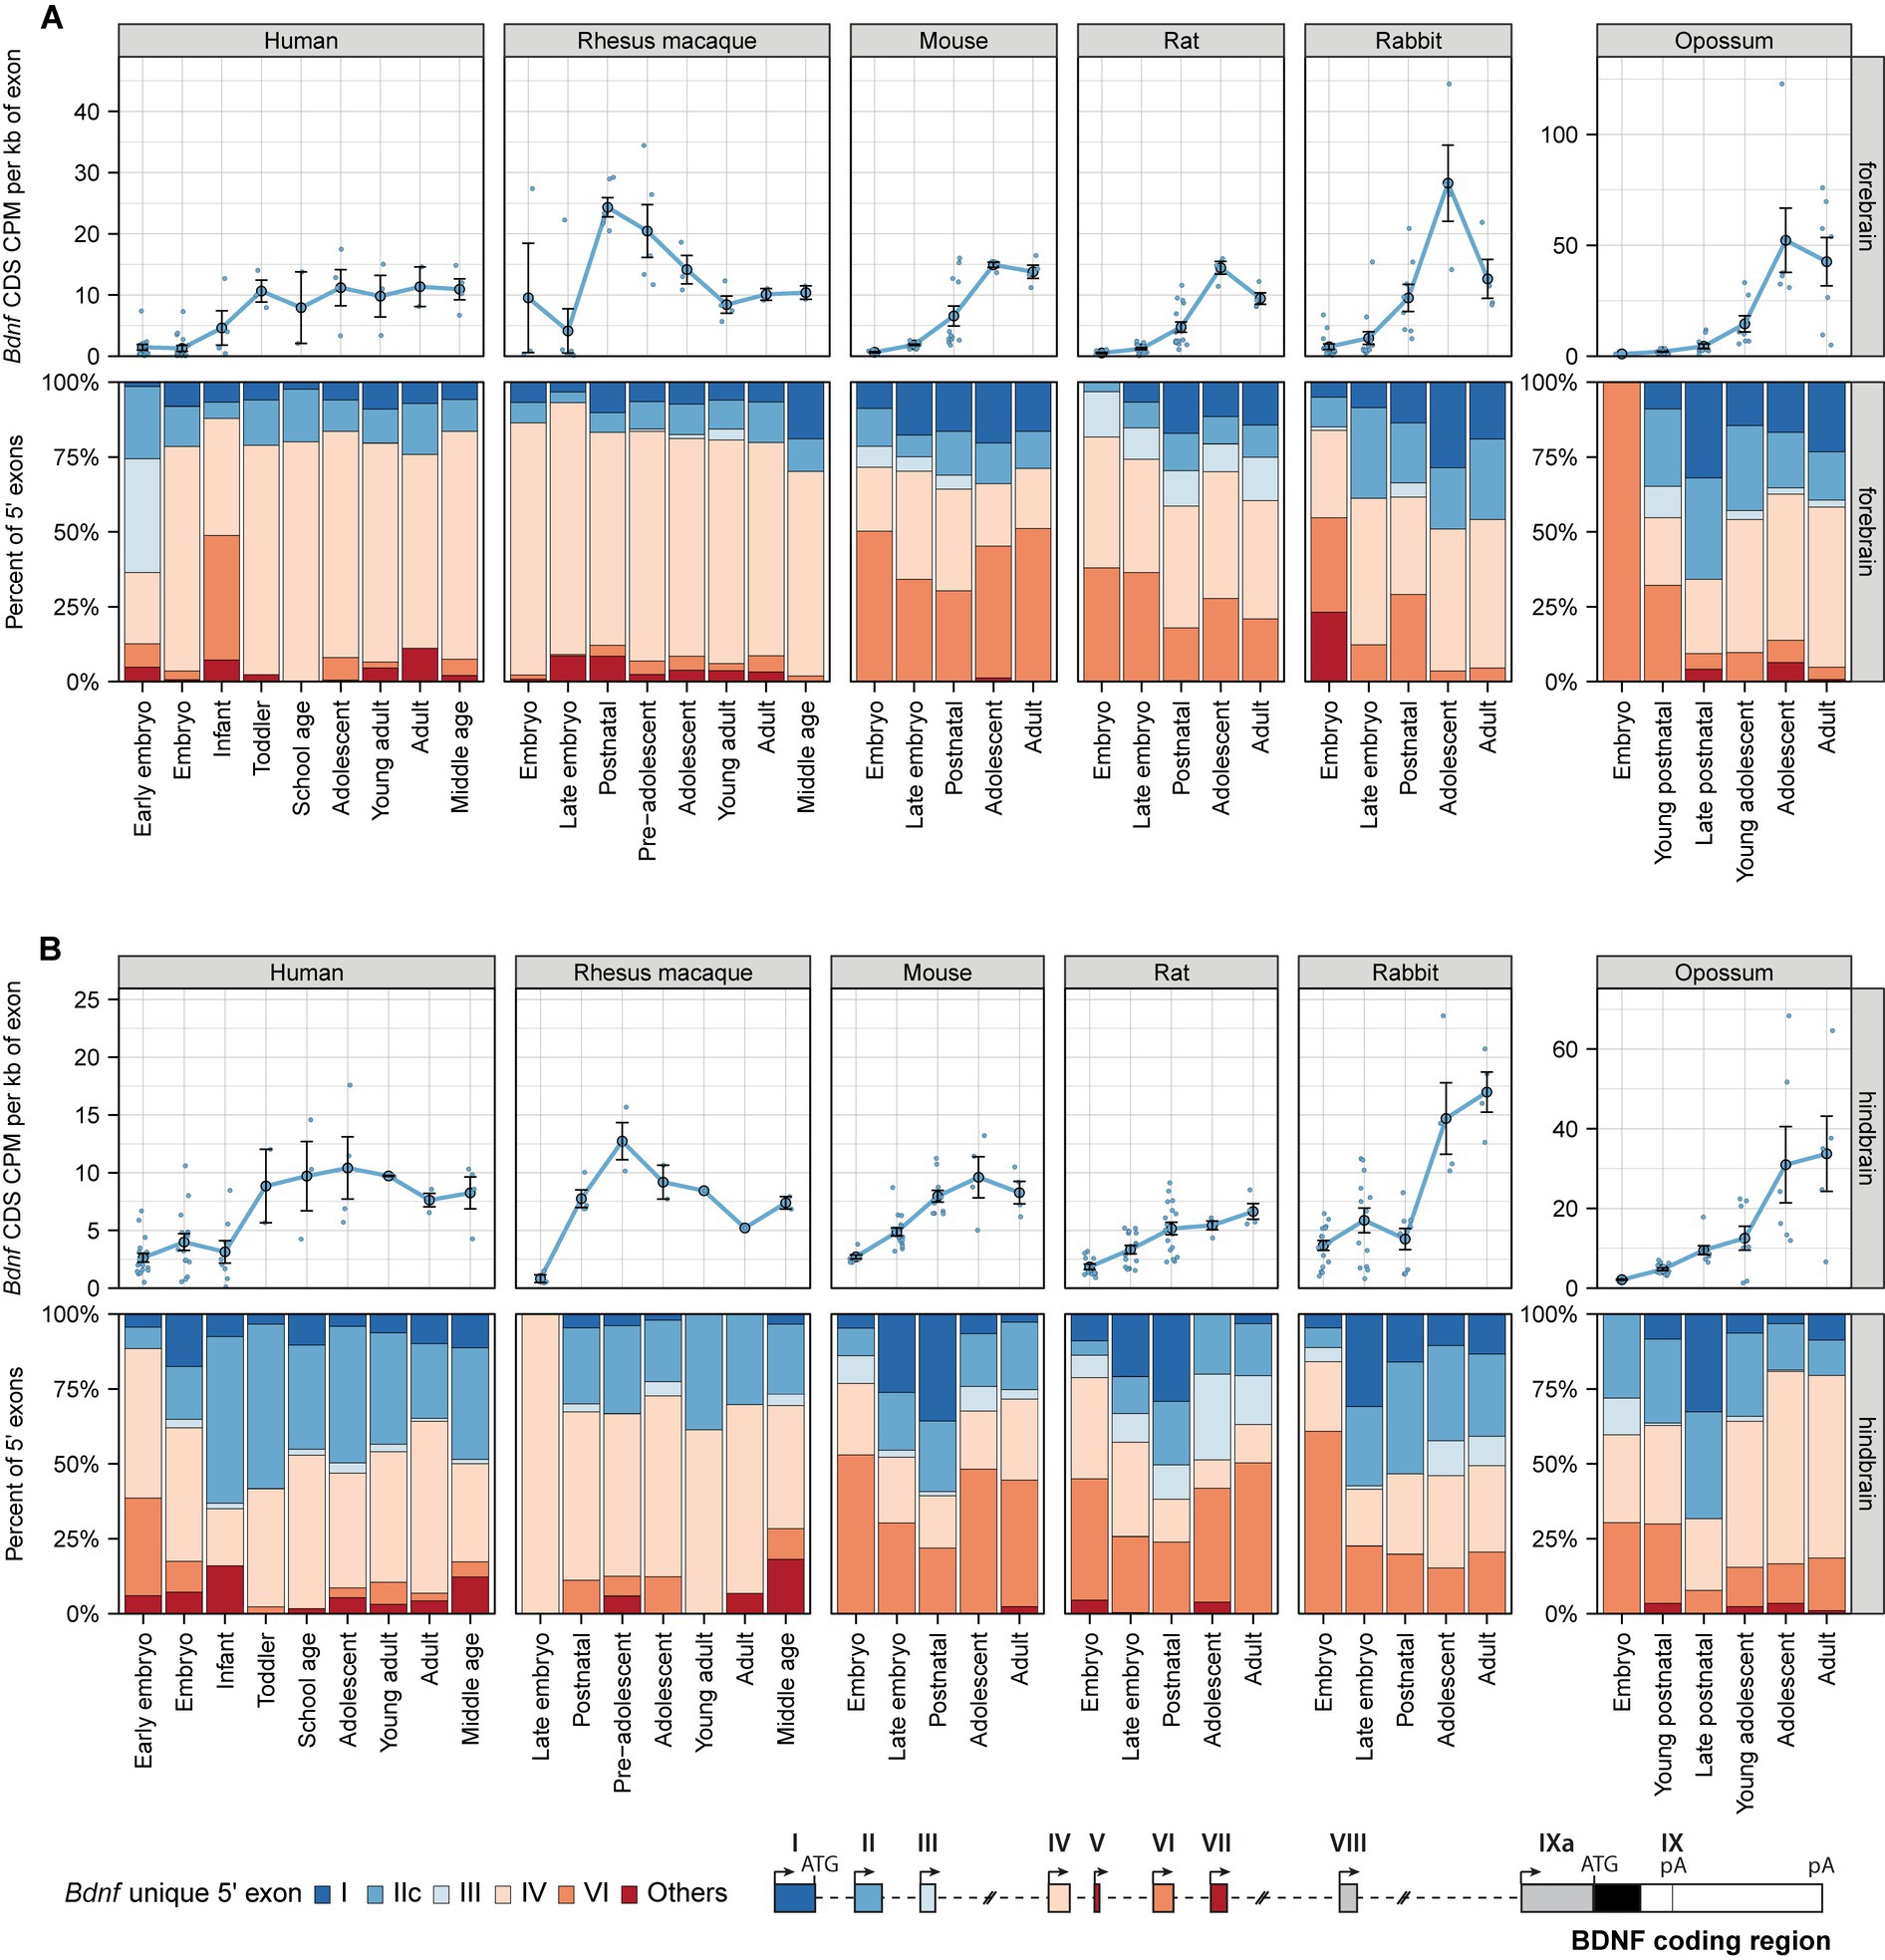
Figure 5. BDNF mRNA expression levels in the brain of different mammals. Total BDNF mRNA levels in forebrain (A) and hindbrain (B) measured by levels of BDNF coding sequence (CDS, upper panels) and distribution of levels of BDNF 5′ exon-specific mRNAs (lower panels) are shown with the exons depicted below in the schematics of murine Bdnf gene structure. The exons indicated with gray color were not included in the analysis of expressed 5′ exons. BDNF mRNA levels in humans are shown in early embryo (0–9 postcoital week (PCW)), embryo (10–19 PCW), late embryo (20–39 PCW), infant (younger than 12 months), toddler (1–4 years old), school age (7–8 years old), adolescent (10–17 years old), young adult (18–29.99 years old), adult (30–39.99 years old), and middle-aged (40–58 years old); in rhesus macaques in embryo (E93-E109), late embryo (PE112-E130), postnatal (P0-P24), pre-adolescent (0.5–1 years old), adolescent (2–3 years old), young adult (8–11 years old), adult (14–15 years old), and middle-aged (20–26 years old) animals; in mouse and rats in embryo (E10.5-E14.5/E11-E15 mouse/rat), late embryo (E15.5-E18.5/E17-E20 mouse/rat), postnatal (P0-P14), adolescent (P22-56), and adult (P62+) animals; in rabbits in embryo (E12-E19.5), late embryo (E21-E27), postnatal (P10-P14), adolescent (P84), and adult (P186-P548) animals; in opossums in late embryo (E13.5), young postnatal (P0-P6), late postnatal (P10-P21), young adolescent (P28-P60), adolescent (P90-P120), and adult (P150-P180) animals [data from (2019)]. All used datasets and underlying data are shown in Supplementary Table 13. Data from individual animals are shown as small dots, circles indicate mean values and error bars represent standard error of the mean (SEM). CDS – coding sequence, CPM – counts per million.
Next, we studied BDNF mRNA levels in non-neural tissues during mammalian development. Total BDNF mRNA levels are mostly similar within one tissue among the different studied mammals (Supplementary Figure S7; Supplementary Table 14). Some exceptions are rhesus macaque heart, mouse and rabbit kidney, and opossum and rhesus macaque testis, where BDNF mRNA levels are higher than in the respective tissue in other studied mammals (Supplementary Figures S7A,C,D, respectively). Overall, the majority of BDNF transcripts contain exon VI, however, BDNF exon IV also contributes to BDNF mRNA levels in these mammals, although at a much lower level in murines when compared to the other studied mammals (Supplementary Figure S7).
Expression of BDNF transcripts with alternative 3’ UTRs
In addition to different promoter regions and the resulting 5′ exons in BDNF gene, BDNF exon IX contains alternative polyadenylation sites that can result in transcripts with either a short or long 3′ untranslated region (UTR) (Timmusk et al., 1993b; Fukuchi and Tsuda, 2010). BDNF transcripts with short 3’ UTR are more stable (Castrén et al., 1998) and are more associated with polysomes than transcripts with long 3’ UTR, suggesting better translatability (Timmusk et al., 1994b). As there are functional differences between the transcripts with different 3’ UTR lengths (Lekk et al., 2023), we set out to analyze the expression levels of BDNF transcripts with different 3’ UTRs in different tissues and to see whether the choice of the polyadenylation signal is evolutionarily conserved.
Our analysis shows that in the forebrain of human, rhesus macaque, mouse, rat, rabbit, and opossum the relative levels of BDNF transcripts with long 3’ UTR slightly decrease during development, dropping down to 30% of total BDNF transcripts in adulthood (Figure 6A; Supplementary Table 15). In contrast, in hindbrain the relative levels of transcripts with long 3’ UTR slightly increase during development, reaching up to 50% of all Bdnf transcripts in adult animals, and the highest increase is observed in middle aged rhesus macaques (up to 80%) (Figure 6B). In non-neural tissues, the relative levels of BDNF transcripts with long 3’ UTR is either stable with around ~50% of all transcripts or slightly decrease during development in the heart, liver, kidney, and ovary, and substantially decrease in the testis of the studied animals (except in rabbit) (Supplementary Figure S8; Supplementary Table 16). Collectively, our analysis indicates that the usage of BDNF alternative polyadenylation signals is relatively conserved in mammalian evolution.
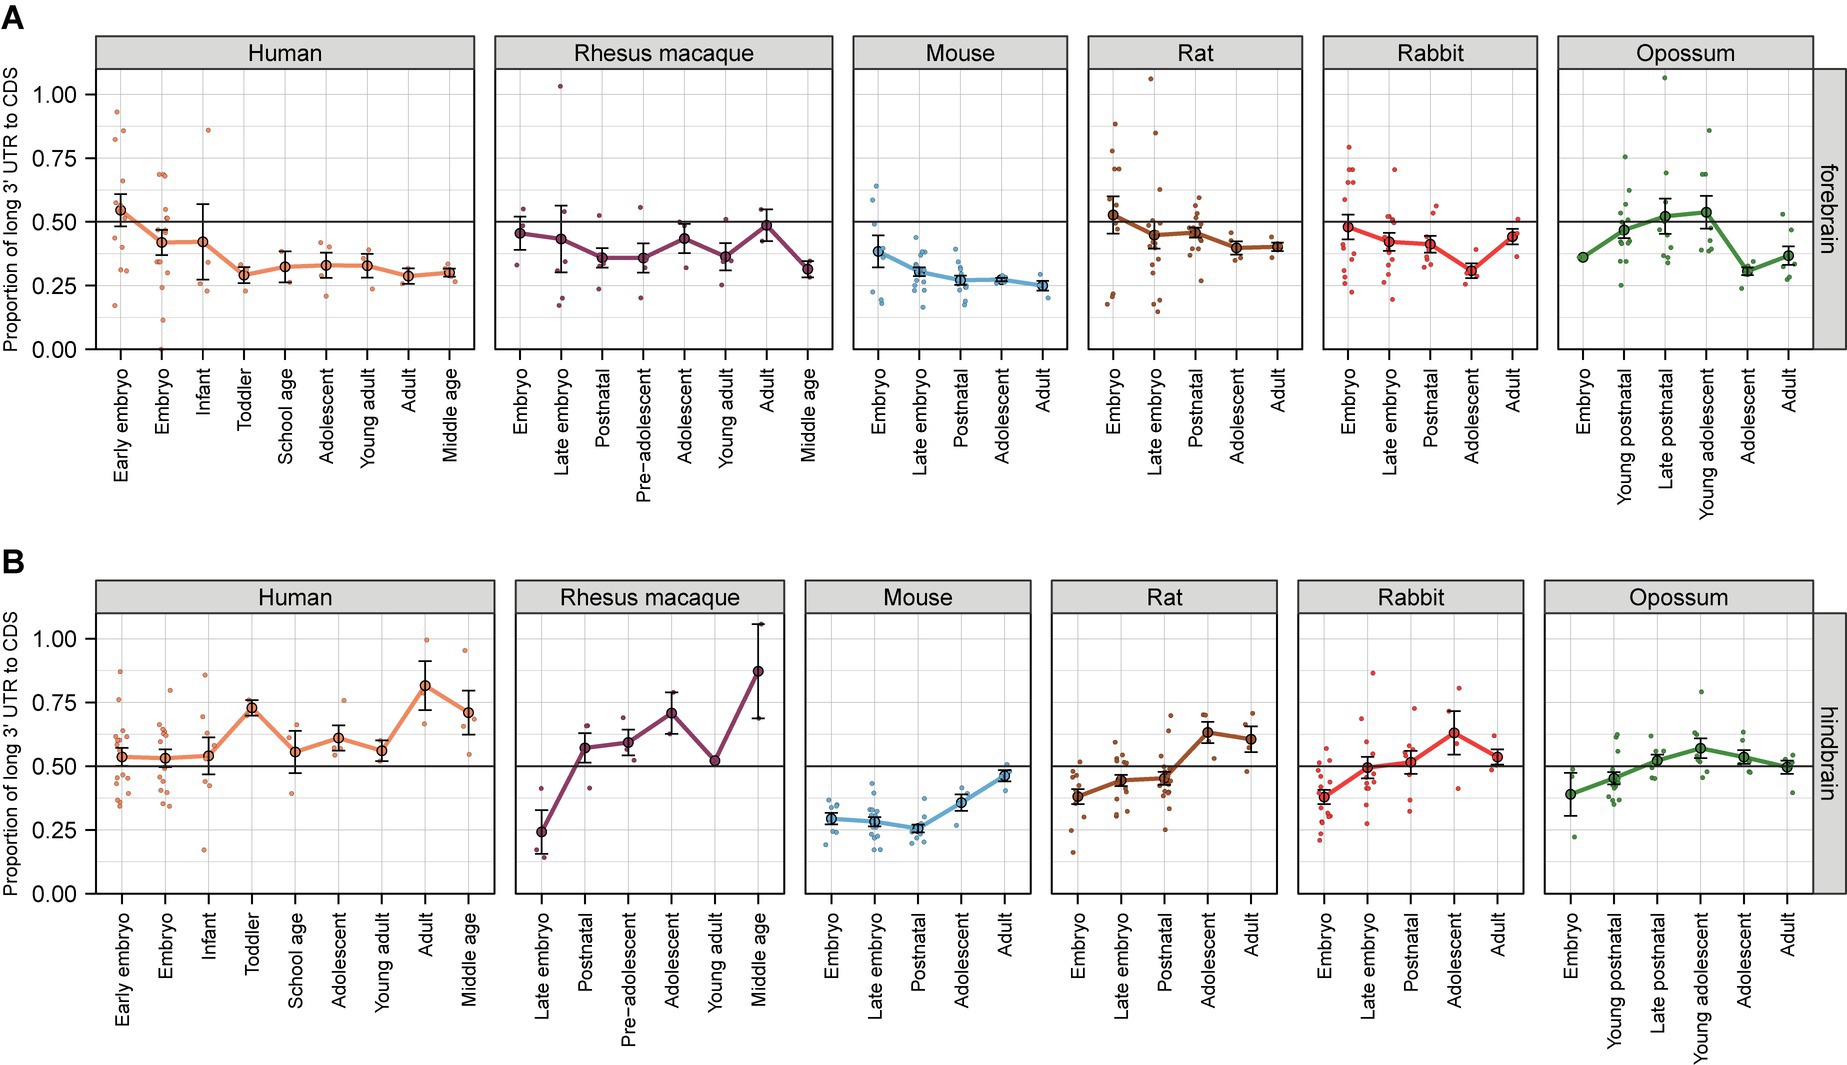
Figure 6. The proportion of BDNF transcripts with long 3′ untranslated region in the brain of different mammals. The ratio of BDNF transcripts with long 3′ untranslated region (UTR) is shown in forebrain (A) and hindbrain (B) relative to total BDNF mRNA levels measured by levels of BDNF coding sequence (CDS). All used datasets and underlying data are shown in Supplementary Table 15. For more information on age classifications, see legend of Figure 5 (data from Cardoso-Moreira et al., 2019). Data from individual animals are shown as small dots, circles indicate mean values and error bars represent standard error of the mean (SEM). CDS – coding sequence.
Next, we conducted a comprehensive adult meta-analysis of different datasets to further describe BDNF transcripts with alternative 3’ UTRs in several different tissues in adult human, mouse, and rat. In agreement with our previous results, the highest proportion of long 3’ UTR transcripts is observed in human hindbrain (Supplementary Figure S9A; Supplementary Table 17), mouse cerebellum, bone and bone marrow, spleen, small intestine, and ovary (Supplementary Figure S9B), and rat cerebellum, uterus, adrenal gland, and lung (Supplementary Figure S9C). Altogether, our data suggests differential regulation of BDNF alternative polyadenylation in different tissues.
BDNF expression in different cell types based on single cell RNA sequencing
We next used publicly available single cell RNA-sequencing data accessible through the CellxGene database (Chan Zuckerberg Initiative, n.d.) to describe the cell types where BDNF is expressed. As expected, in the brain the most prevalent expression of BDNF is in glutamatergic neurons in both mouse (Table 1) and human (Table 2). Unfortunately, the studied CellxGene single cell datasets did not contain any data on sensory neurons, where the function of BDNF protein was discovered (Barde et al., 1978, 1980, 1982) and which are substantially lost in Bdnf knock-out animals (Ernfors et al., 1994; Jones et al., 1994). To further elucidate the expression of Bdnf, TrkB and p75NTR expression in the nervous system, we used single cell RNA sequencing data of the adolescent mouse nervous system by Zeisel et al. (2018) (Web tool accessible from http://mousebrain.org/adolescent/). According to this data, the Bdnf gene is mainly expressed in excitatory neurons in the central nervous system, and in sensory neurons in the peripheral nervous system (Figure 7). In contrast, TrkB shows widespread expression in different neurons throughout the nervous system, as well as in astrocytes (Figure 7). The expression of p75NTR is mainly constrained to certain subtypes of cholinergic neurons, and sympathetic and sensory neurons (Figure 7).
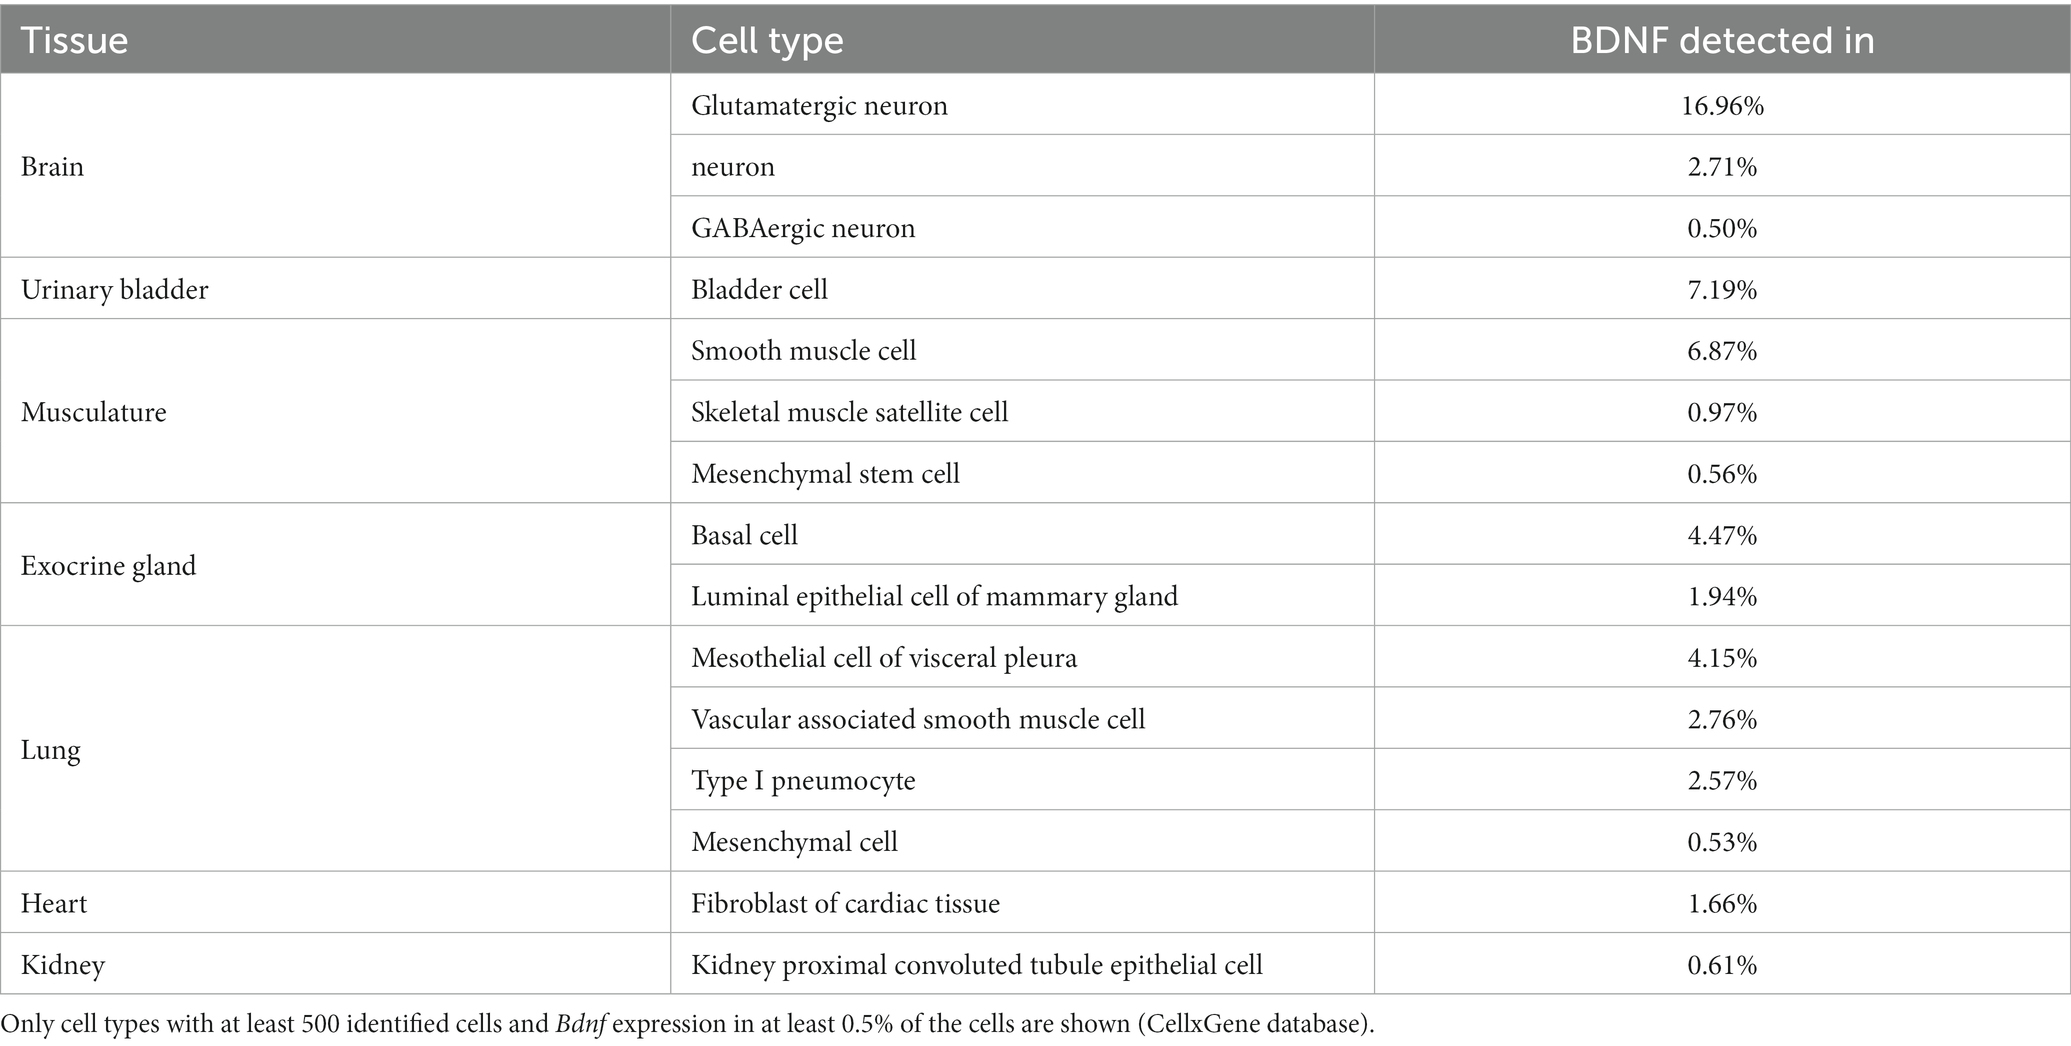
Table 1. Bdnf mRNA expression in mouse tissues according to single cell RNA sequencing.
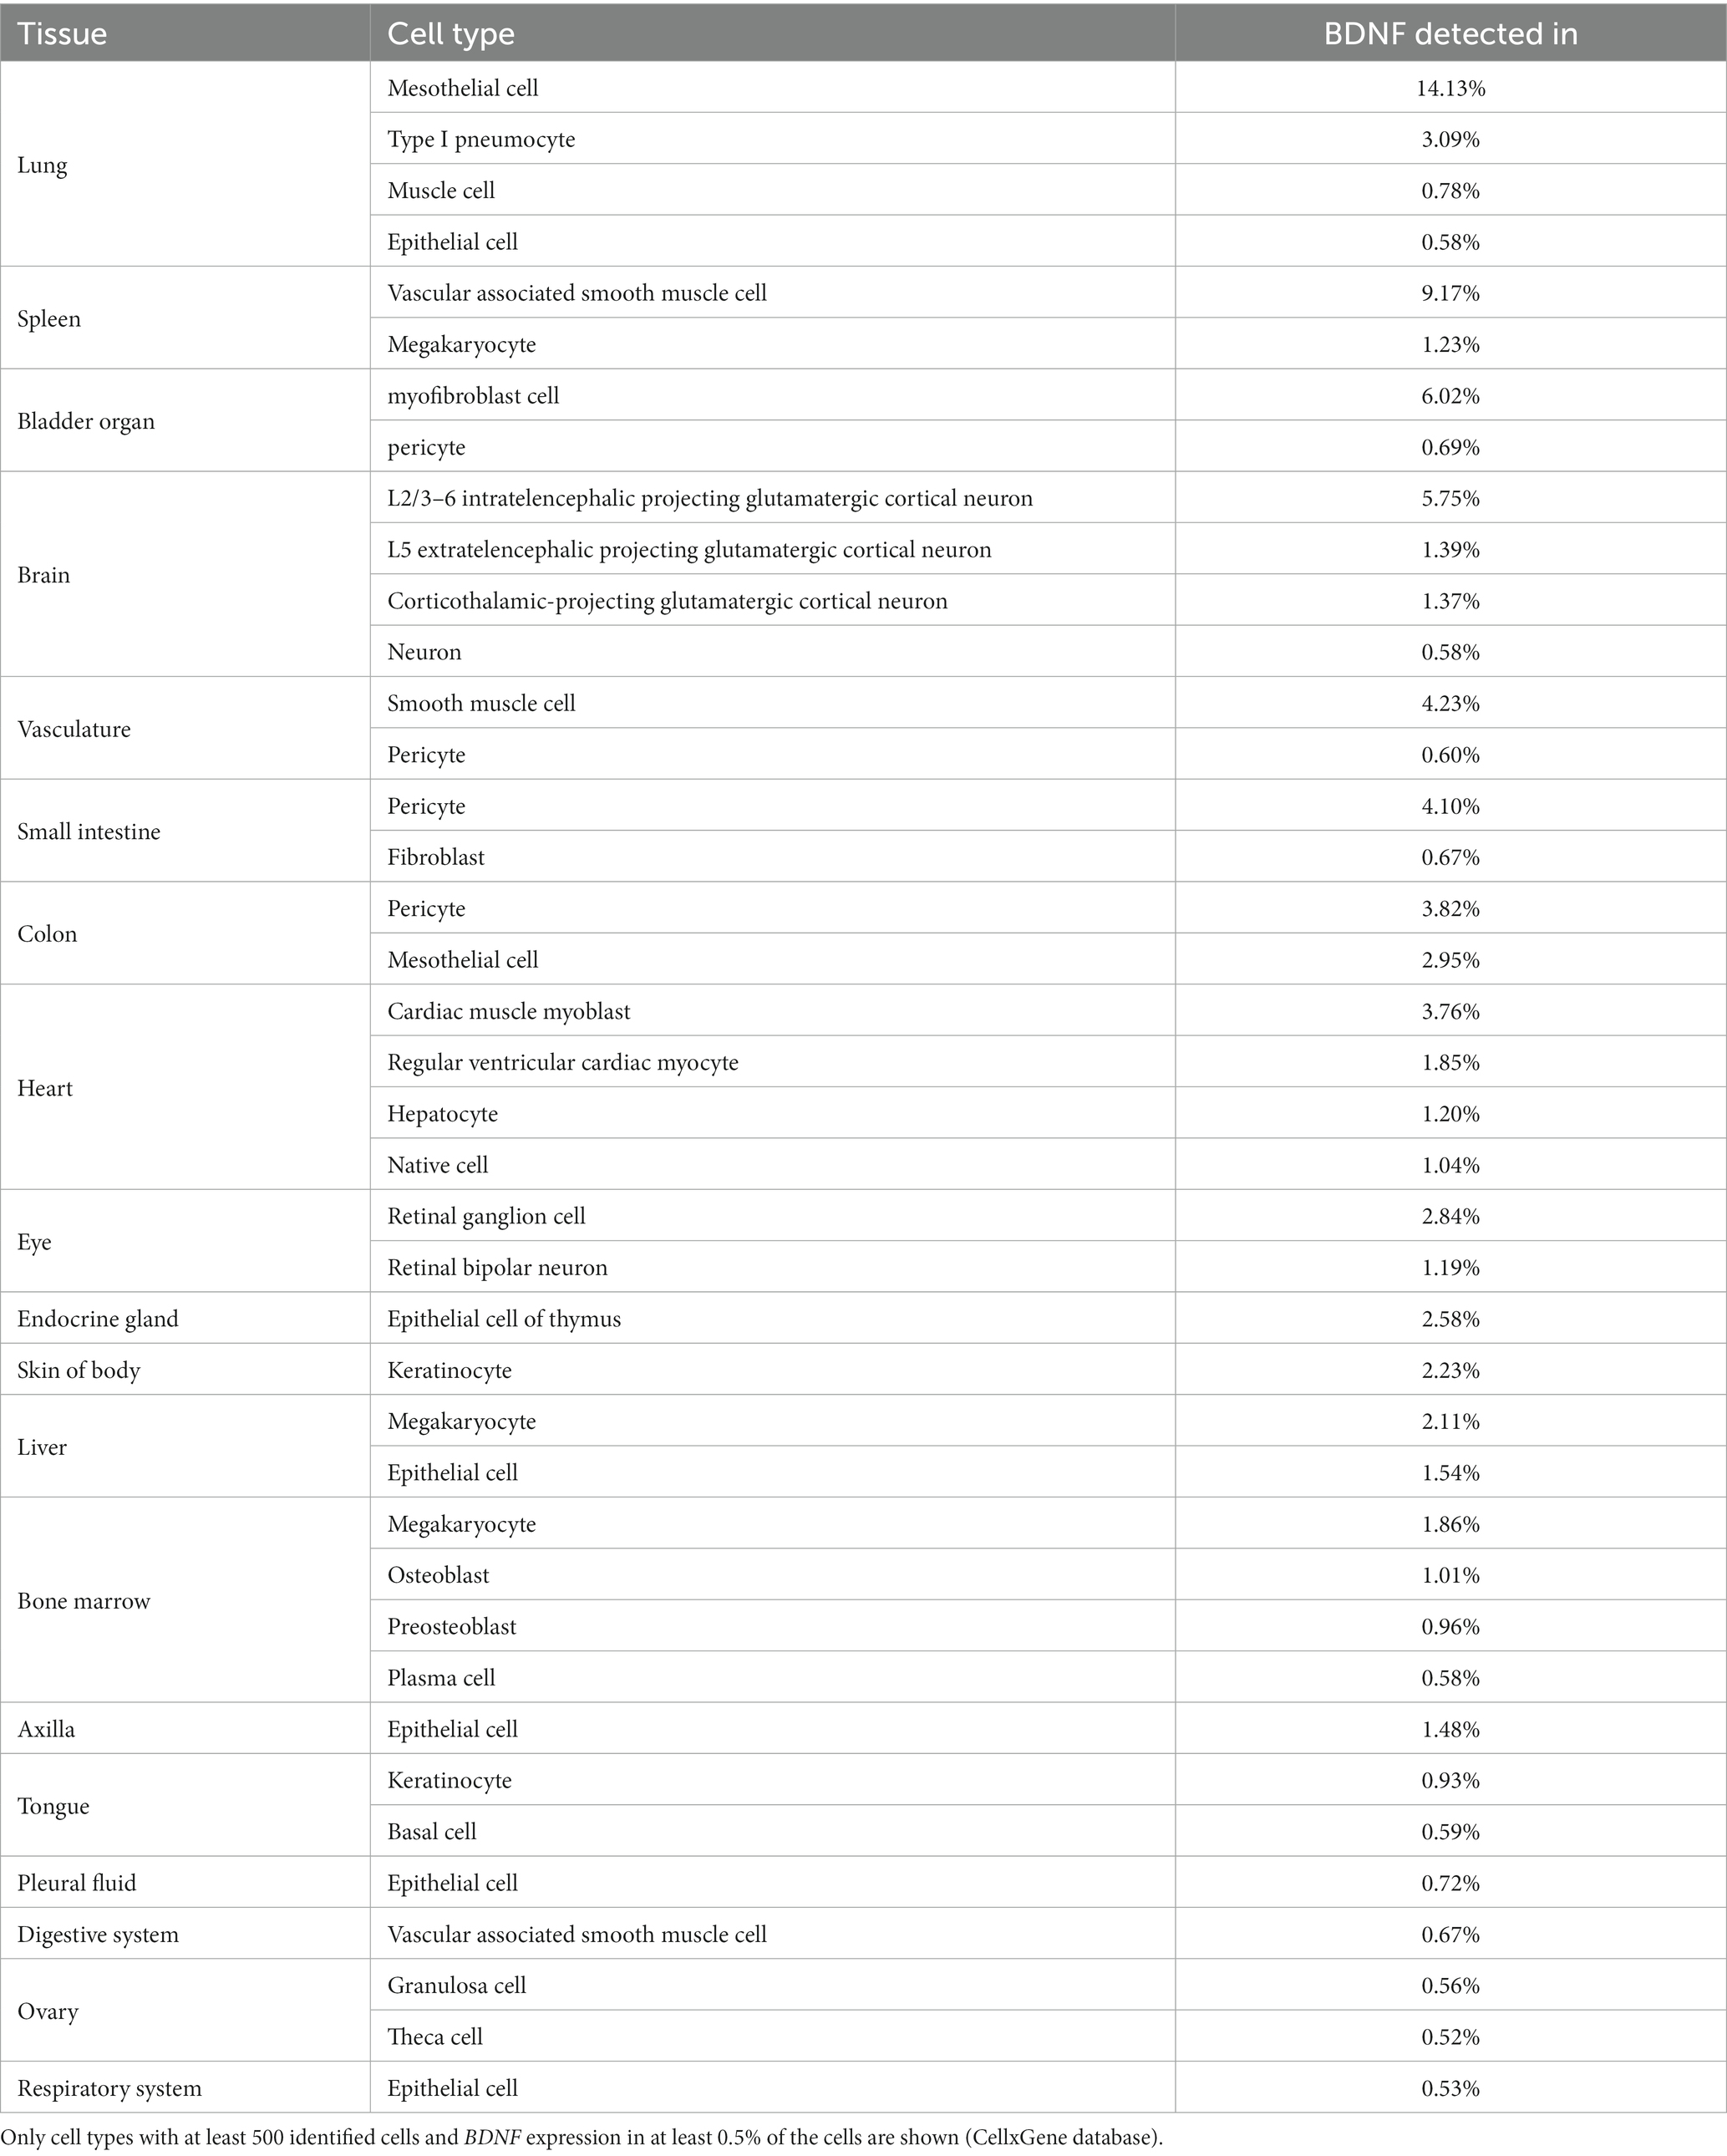
Table 2. BDNF mRNA expression in human tissues according to single cell RNA sequencing.
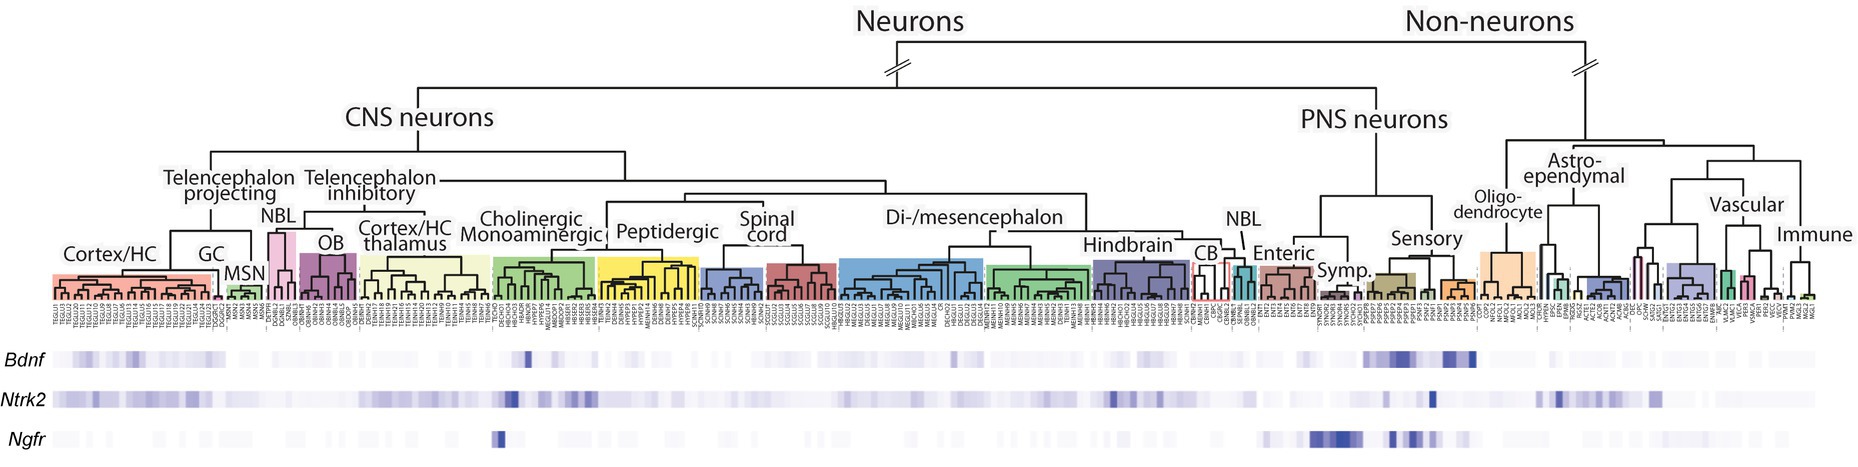
Figure 7. The expression of Bdnf, TrkB (Ntrk2 gene), and p75NTR (Ngfr gene) mRNA in adolescent mouse nervous systems according to single cell RNA sequencing. Single cell RNA sequencing data of postnatal day 10–30 mice from Zeisel et al. (2018) was visualized using Mouse Brain Atlas from the Linnarson lab (http://mousebrain.org/). A deeper blue color indicates stronger expression of the indicated gene. The different cell types and their origins are shown above.
In mouse non-neural tissues, Bdnf is expressed in luminal epithelial cells in the mammary gland, in cardiac fibroblasts, in various cell types in the lung, in smooth muscle cells and in bladder cells (Table 1). In human non-neural tissues, BDNF is mainly expressed in epithelial and mesothelial cells, e.g., in the colon and lung (Table 2). In addition, we determined widespread BDNF gene expression in megakaryocytes, pericytes and smooth muscle cells of the vasculature (Table 2). In the human heart, BDNF is expressed in both myocytes and myoblasts (Table 2). In summary, our data show that only certain types of specialized cells produce BDNF.
BDNF protein levels in mouse and rat brain during development
BDNF mRNA and protein expression levels do not always spatially correlate, as BDNF protein can be anterogradely transported between brain regions (Conner et al., 1997). For example, while there is almost no Bdnf mRNA in the striatum (Hofer et al., 1990; Timmusk et al., 1994b), the existing BDNF protein (Radka et al., 1996; Baquet et al., 2004) is transported there from the cerebral cortex (Altar et al., 1997; Baquet et al., 2004) and is necessary for the proper development of the striatum (Baquet et al., 2004). Moreover, there are high BDNF protein levels in the adult rat pituitary gland although Bdnf mRNA levels there are low (Yan et al., 1997). Therefore, it is possible that BDNF protein can be detected in tissues lacking BDNF mRNA. To investigate BDNF protein levels, we analyzed different brain regions throughout the development of the commonly used mouse strains BALB/c and C57BL/6 J and Wistar rat by Western blot analysis.
For Western blot analysis, we chose the 3C11 monoclonal anti-BDNF antibody (Icosagen) that has been previously validated using protein lysates of Bdnf knock-out animals (Andreska et al., 2020; Wosnitzka et al., 2020). We have previously shown that the 3C11 antibody can detect both proBDNF and mature BDNF in rat cultured neurons after prolonged depolarization (Esvald et al., 2022). To confirm the specificity of the signal seen in Western blot, we silenced the expression of Bdnf using CRISPR interference system targeted to Bdnf promoters I and IV in cultured cortical neurons (Figures 8A,B). CRISPR interference led to decreased levels of Bdnf mRNA and also proBDNF and mature BDNF protein as expected. We also show that this antibody can detect both mature and proBDNF with similar efficiency (Figure 8C). We conclude that the 3C11 BDNF antibody can recognize endogenous levels of both proBDNF and mature BDNF.
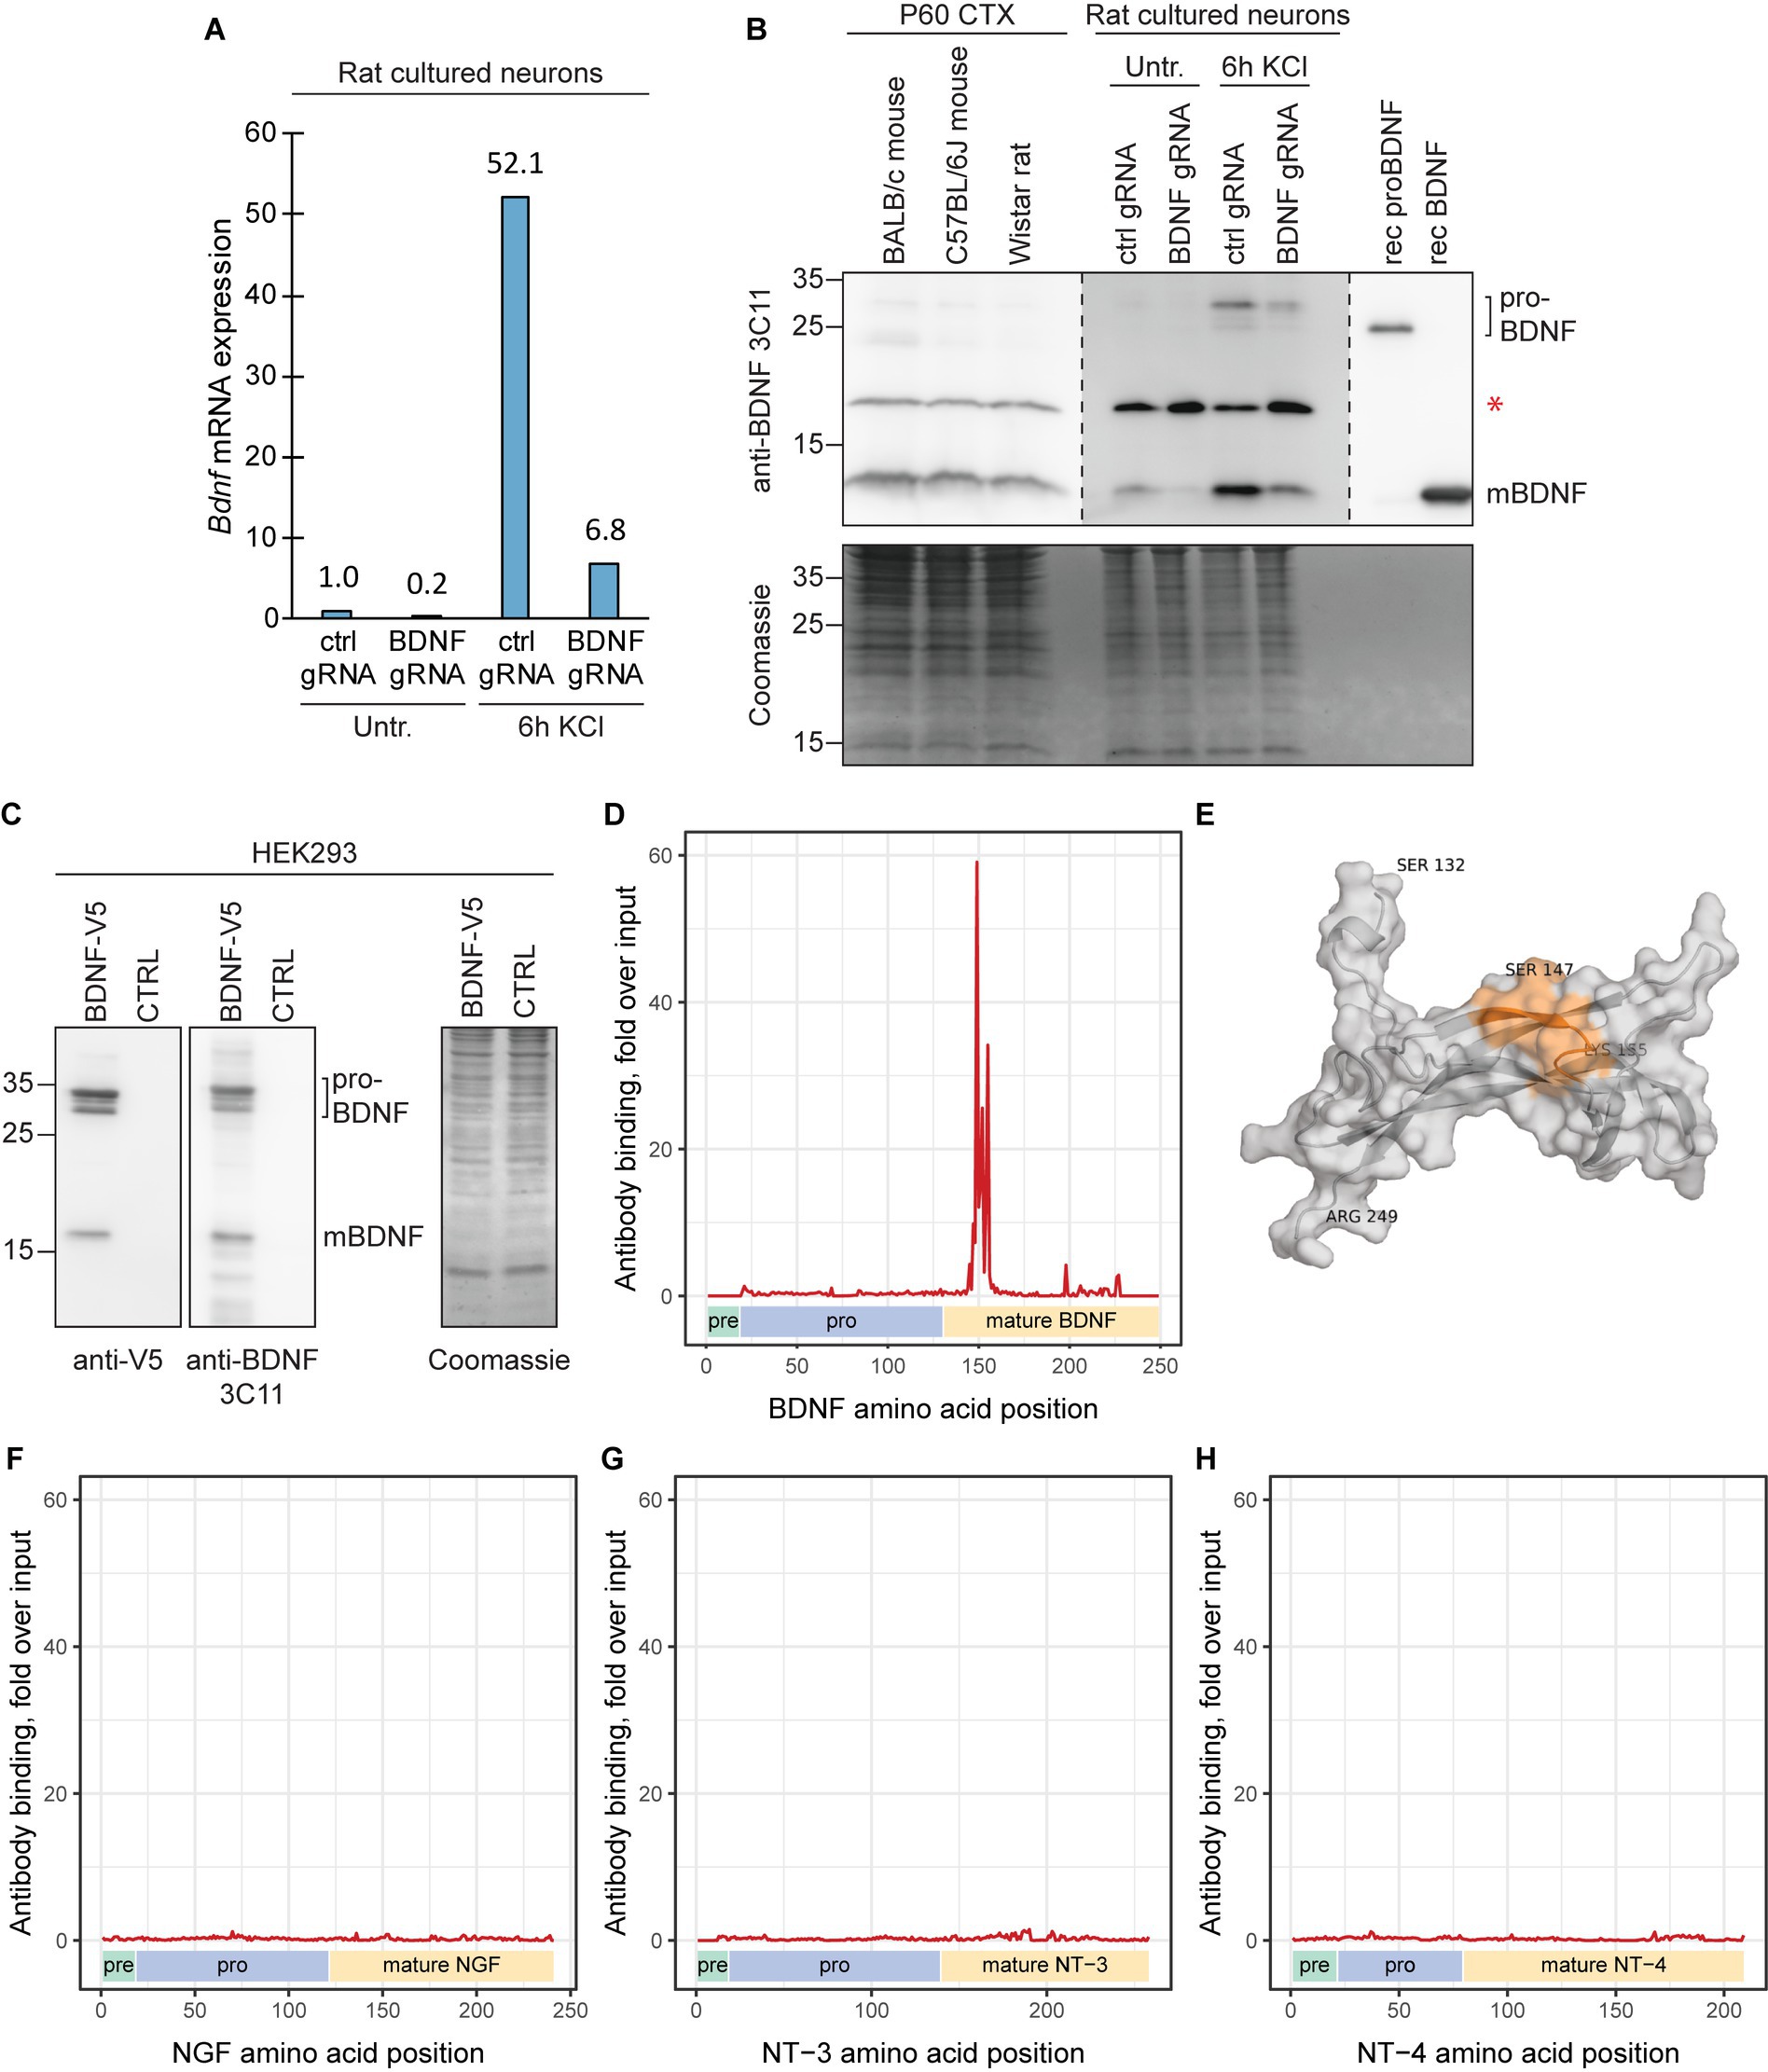
Figure 8. The epitope of Icosagen 3C11 anti-BDNF antibody resides between BDNF amino acids 147–155. (A) The specificity of the anti-BDNF 3C11 antibody (Icosagen) was tested in cultured rat cortical neurons. Bdnf gene expression was silenced using CRISPR interference system (dCas9-KRAB) targeting Bdnf promoters I and IV. The neurons were treated at 8 DIV with 25 mM KCl for 6 h. Total Bdnf mRNA levels were measured by RT-qPCR. (B) BDNF protein levels in adult murine cerebral cortex and in BDNF-silenced and KCl-treated cultured cortical neurons along with recombinant proBDNF and mature BDNF were measured by Western blot. Note that the endogenous proBDNF in rat neurons has slower mobility compared to the bacterially expressed recombinant human proBDNF probably due to glycosylation. Red asterisk marks an unspecific signal. (C) The efficiency of the anti-BDNF 3C11 antibody to detect proBDNF and mature BDNF was also tested in HEK293 cells by overexpressing BDNF-V5 and performing Western blot with anti-V5 and anti-BDNF antibody. (D,F,G,H) The epitope of the anti-BDNF 3C11 antibody (Icosagen) was determined using mimotope variation analysis (MVA). x-axis indicates the amino acid position of mouse BDNF (D), NGF (F), NT-3, (G), or NT-4 (H) protein (Uniprot IDs P21237, P01139, P20181, Q80VU4, respectively). Pre, pro and mature neurotrophin domains are shown below the graph. Alignment load for each amino acid position was calculated as the sum of normalized counts of aligning 12-mer peptides (with maximum 6 mismatches) obtained from MVA or from direct sequencing of the input phage library. y-axis depicts anti-BDNF antibody alignment load fold enrichment compared to the alignment load of the input library. Specific signal of antibody binding can be seen for amino acids 147SEWVTAADK155, residing in the N-terminal region of mature BDNF. (E) Depiction of the identified epitope (Ser147-Lys155) on the 3D structure model of the mature BDNF protein (residues Ser132-Arg249). The epitope (in orange) of the 3C11 anti-BDNF antibody (combined cartoon and surface representation, gray). The protein model was obtained from the AlphaFold Protein Structure Database (AF-P21237-F1-model-v4) and visualized using PyMOL.
To further characterize the antibody, we performed antibody epitope mapping using mimotope variation analysis (MVA) (Sadam et al., 2018, 2021), a next generation phage display method that has been shown to be suitable for mapping the epitopes of purified antibodies (Kasak et al., 2017). Our MVA results indicate that the epitope for the 3C11 anti-BDNF antibody consists of amino acids 147SEWVTAADK155 in the mature region of the BDNF protein (Figures 8D,E). Furthermore, this region in BDNF protein is 100% conserved between mouse, rat, human and other mammals. In addition, we detected no major cross-reactivity of the anti-BDNF antibody with other neurotrophic factors using MVA (Figures 8F–H).
Our results show that in the whole brain of BALB/c and C57BL/6 J mice BDNF protein levels gradually increase, peak during the third postnatal week, and remain high in adulthood (Figure 9A). In most BALB/c brain regions BDNF protein levels peak at the second or third postnatal week, while the pons shows an earlier peak at P7 (Figures 9B,E). In C57BL/6 J mouse, BDNF protein levels peak at third postnatal week in most regions, although in the hypothalamus, thalamus, and pons the peak is already seen at P5 (Figures 9C,E). In Wistar rat, the levels of BDNF peak at P10-P30 in most brain regions, although the highest BDNF protein expression in the cerebellum was seen at P0 (Figures 9D,E).
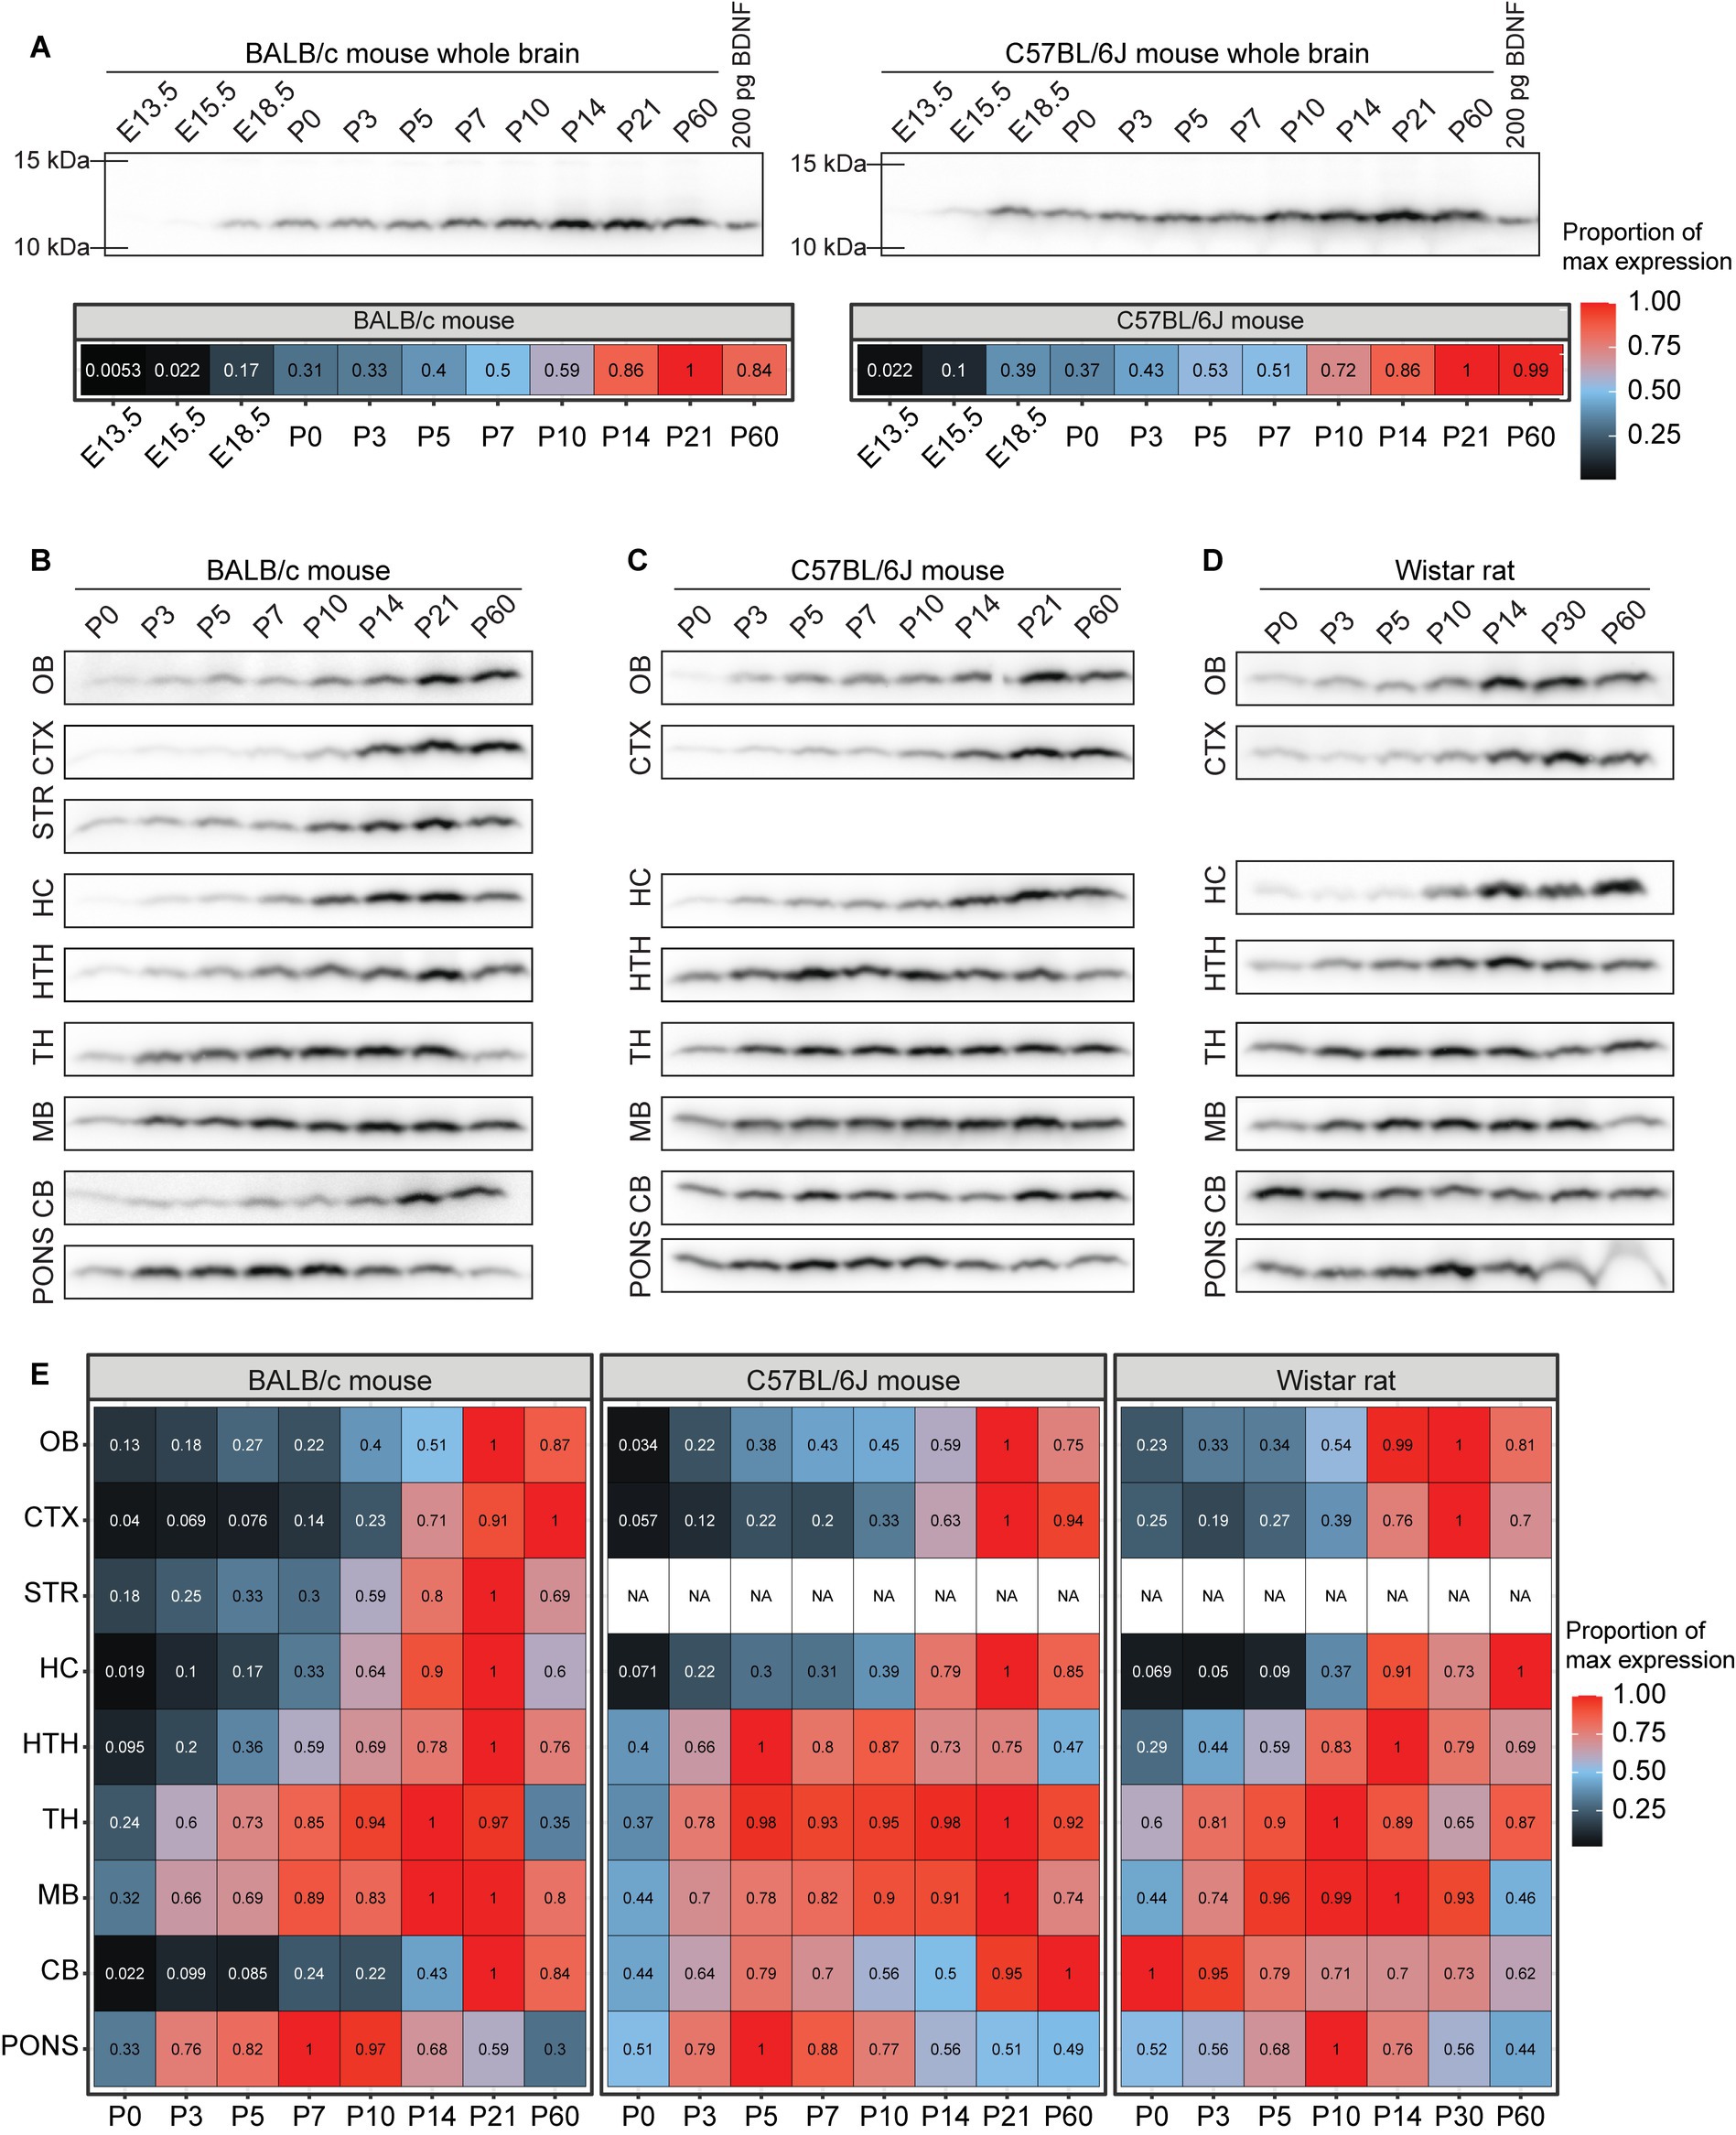
Figure 9. The dynamics of BDNF protein expression in BALB/c mouse, C57BL/6 J mouse and Wistar rat brain regions during development. BDNF protein levels measured by Western blot in BALB/c and C57BL/6 J mouse, and Wistar rat different brain regions throughout development. Fifty micro gram total protein lysate was loaded per lane. (A) BDNF protein levels in the whole brain of BALB/c and C57BL/6 J mice (upper panel) and densitometric quantification (lower panel). The maximal BDNF expression level in the respective mouse line in the respective brain region was set as 1. BDNF protein levels in different brain regions of (B) BALB/c mouse, (C) C57BL/6 J mouse, and (D) Wistar rat during development. (E) Densitometric quantification of BDNF protein expression levels. The maximal BDNF expression level in the respective animal model brain region was set as 1. E – embryonic day, P – postnatal day, OB – olfactory bulb, CTX – cerebral cortex, STR – striatum, HC – hippocampus, HTH – hypothalamus, TH – thalamus, MB – midbrain, CB – cerebellum, NA – not analyzed.
Next, we analyzed BDNF protein levels among different brain regions of adult murines. In both BALB/c and C57BL/6 J mice the highest levels of BDNF protein are found in the hypothalamus (Figures 10A,B,D) and in Wistar rat the highest levels are in the hippocampus (Figures 10C,D). In all studied animal models, the lowest levels of BDNF protein are in olfactory bulb and cerebellum (Figure 10). Notably, only mature BDNF protein was present in the brain, and virtually no proBDNF protein could be detected. The levels of proBDNF seem to be at least an order of magnitude lower than levels of mature BDNF in adult murine brain (Figures 10A–C). Collectively, our results show complex spatiotemporal regulation of the expression of BDNF protein in murine brain.
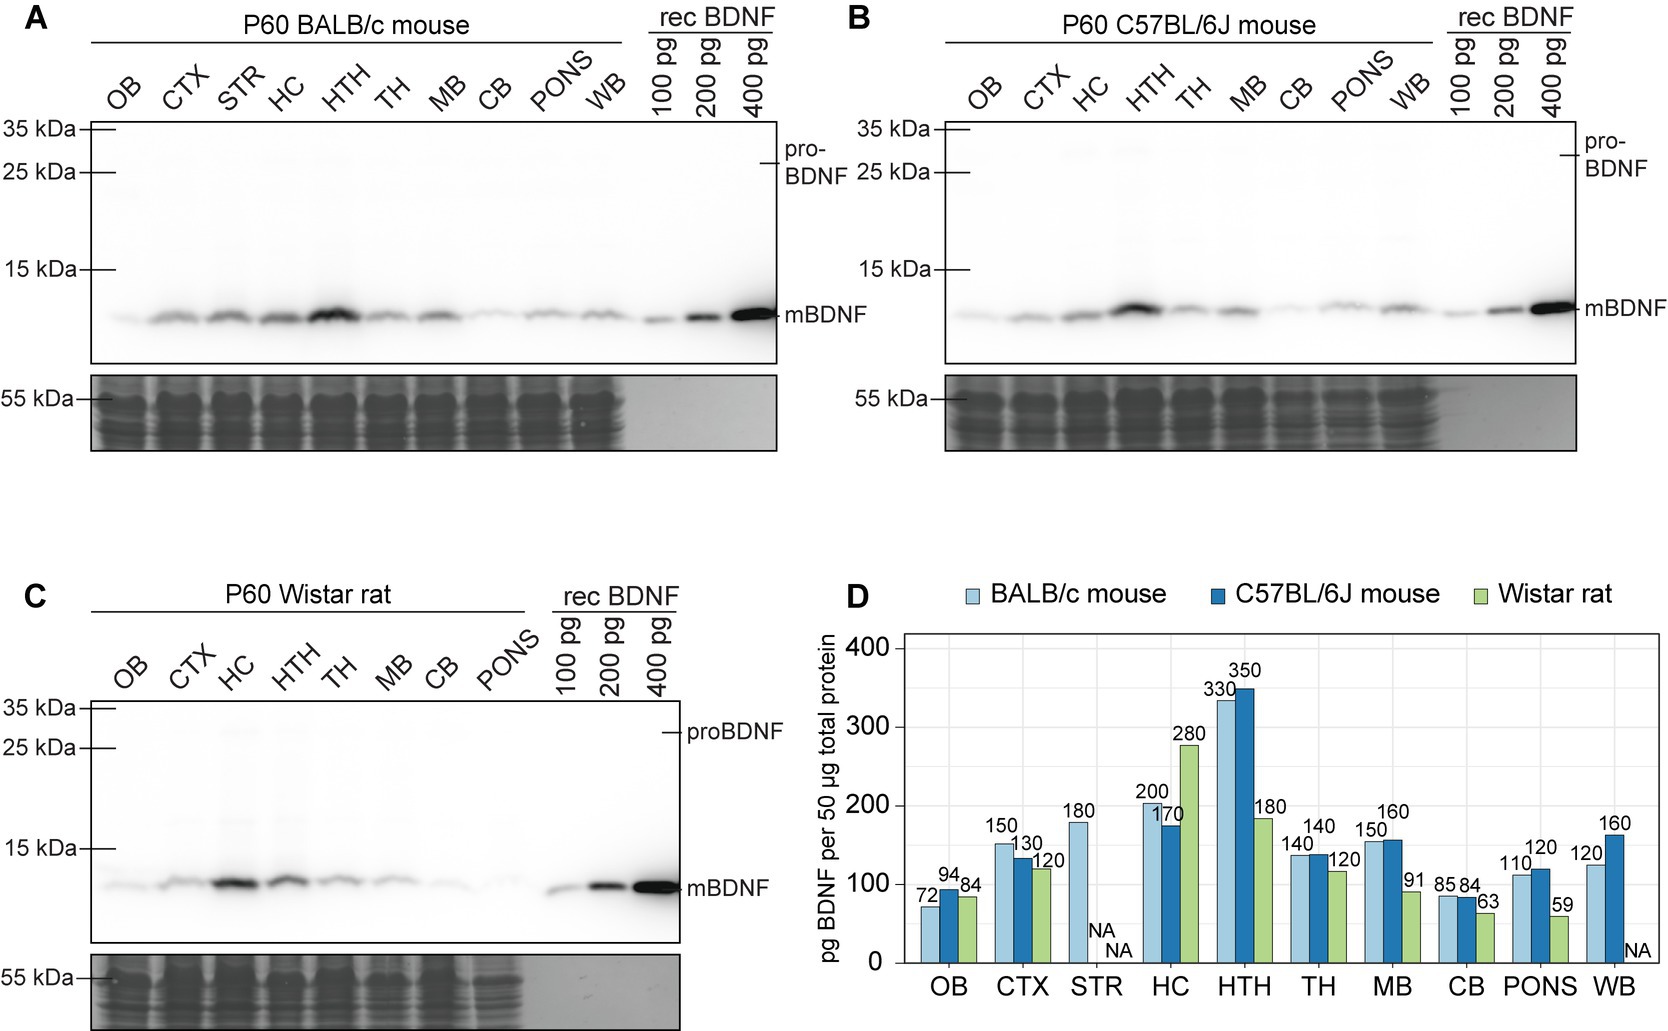
Figure 10. The expression of BDNF protein in adult BALB/c and C57BL/6 J mice, and Wistar rat brain regions. Shown are BDNF protein levels measured by Western blot in BALB/c (A) and C57BL/6 J (B) mouse, and Wistar rat (C) different brain regions at postnatal day 60 (P60). Fifty micro gram total protein lysate was loaded per lane. (D) Densitometric quantification of BDNF protein and calculated amounts using calibration curve based on recombinant BDNF protein levels. P – postnatal day, OB – olfactory bulb, CTX – cerebral cortex, STR – striatum, HC – hippocampus, HTH – hypothalamus, TH – thalamus, MB – midbrain, CB – cerebellum, WB – whole brain, NA – not analyzed.
BDNF protein levels in murine non-neural tissues during development
As the RNA sequencing analysis showed BDNF expression in numerous non-neural tissues and various roles for BDNF in non-neural tissues have been shown (see Introduction for references), we finally analyzed BDNF protein levels in the non-neural tissues of BALB/c and C57BL/6 J mice and Wistar rat. First, our results show that in BALB/c and C57BL/6 J mice and Wistar rats, BDNF protein levels in non-neural tissues are generally lower than those detected in most brain regions, e.g., being barely detectable in the liver and thymus, regardless of the developmental stage (Figures 10, 11D). C57BL/6 J mouse and Wistar rat, and at lower levels also BALB/c mouse, all show expression of BDNF protein in the lung during postnatal development, with virtually no levels at P0 and relatively high levels at P14 and P60 (Figure 11). Second, in both mouse strains, the bladder and stomach were among the non-neural tissues with the highest BDNF protein levels, which tend to decrease during postnatal development (Figures 11A,B,D), whereas Wistar rat show minimal BDNF protein in these tissues (Figures 11C,D). The opposite can be seen for the spleen, which shows very low BDNF protein levels in mice (Figures 11A,B,D), whereas BDNF protein can be readily detected in Wistar rat (Figures 11C,D). In the skeletal muscle BDNF protein was seen at P0 but not at P14 and P60 in both mouse strains. In Wistar rat skeletal muscle BDNF protein was not detected during postnatal development. As it has been reported that there is no BDNF protein in mouse blood (Radka et al., 1996), and the strong Western blot signals in mouse plasma is showing a slightly higher apparent molecular weight (denoted with red asterisks), we conclude that these signals are unspecific. However, we detected BDNF protein with correct apparent molecular weight in Wistar rat plasma (Figure 11), in agreement with the previously published results (Radka et al., 1996; Chacón-Fernández et al., 2016). Altogether, our results show BDNF protein expression in many mouse and rat non-neural tissues, although the protein levels in different murines are not as consistent as in the central nervous system.
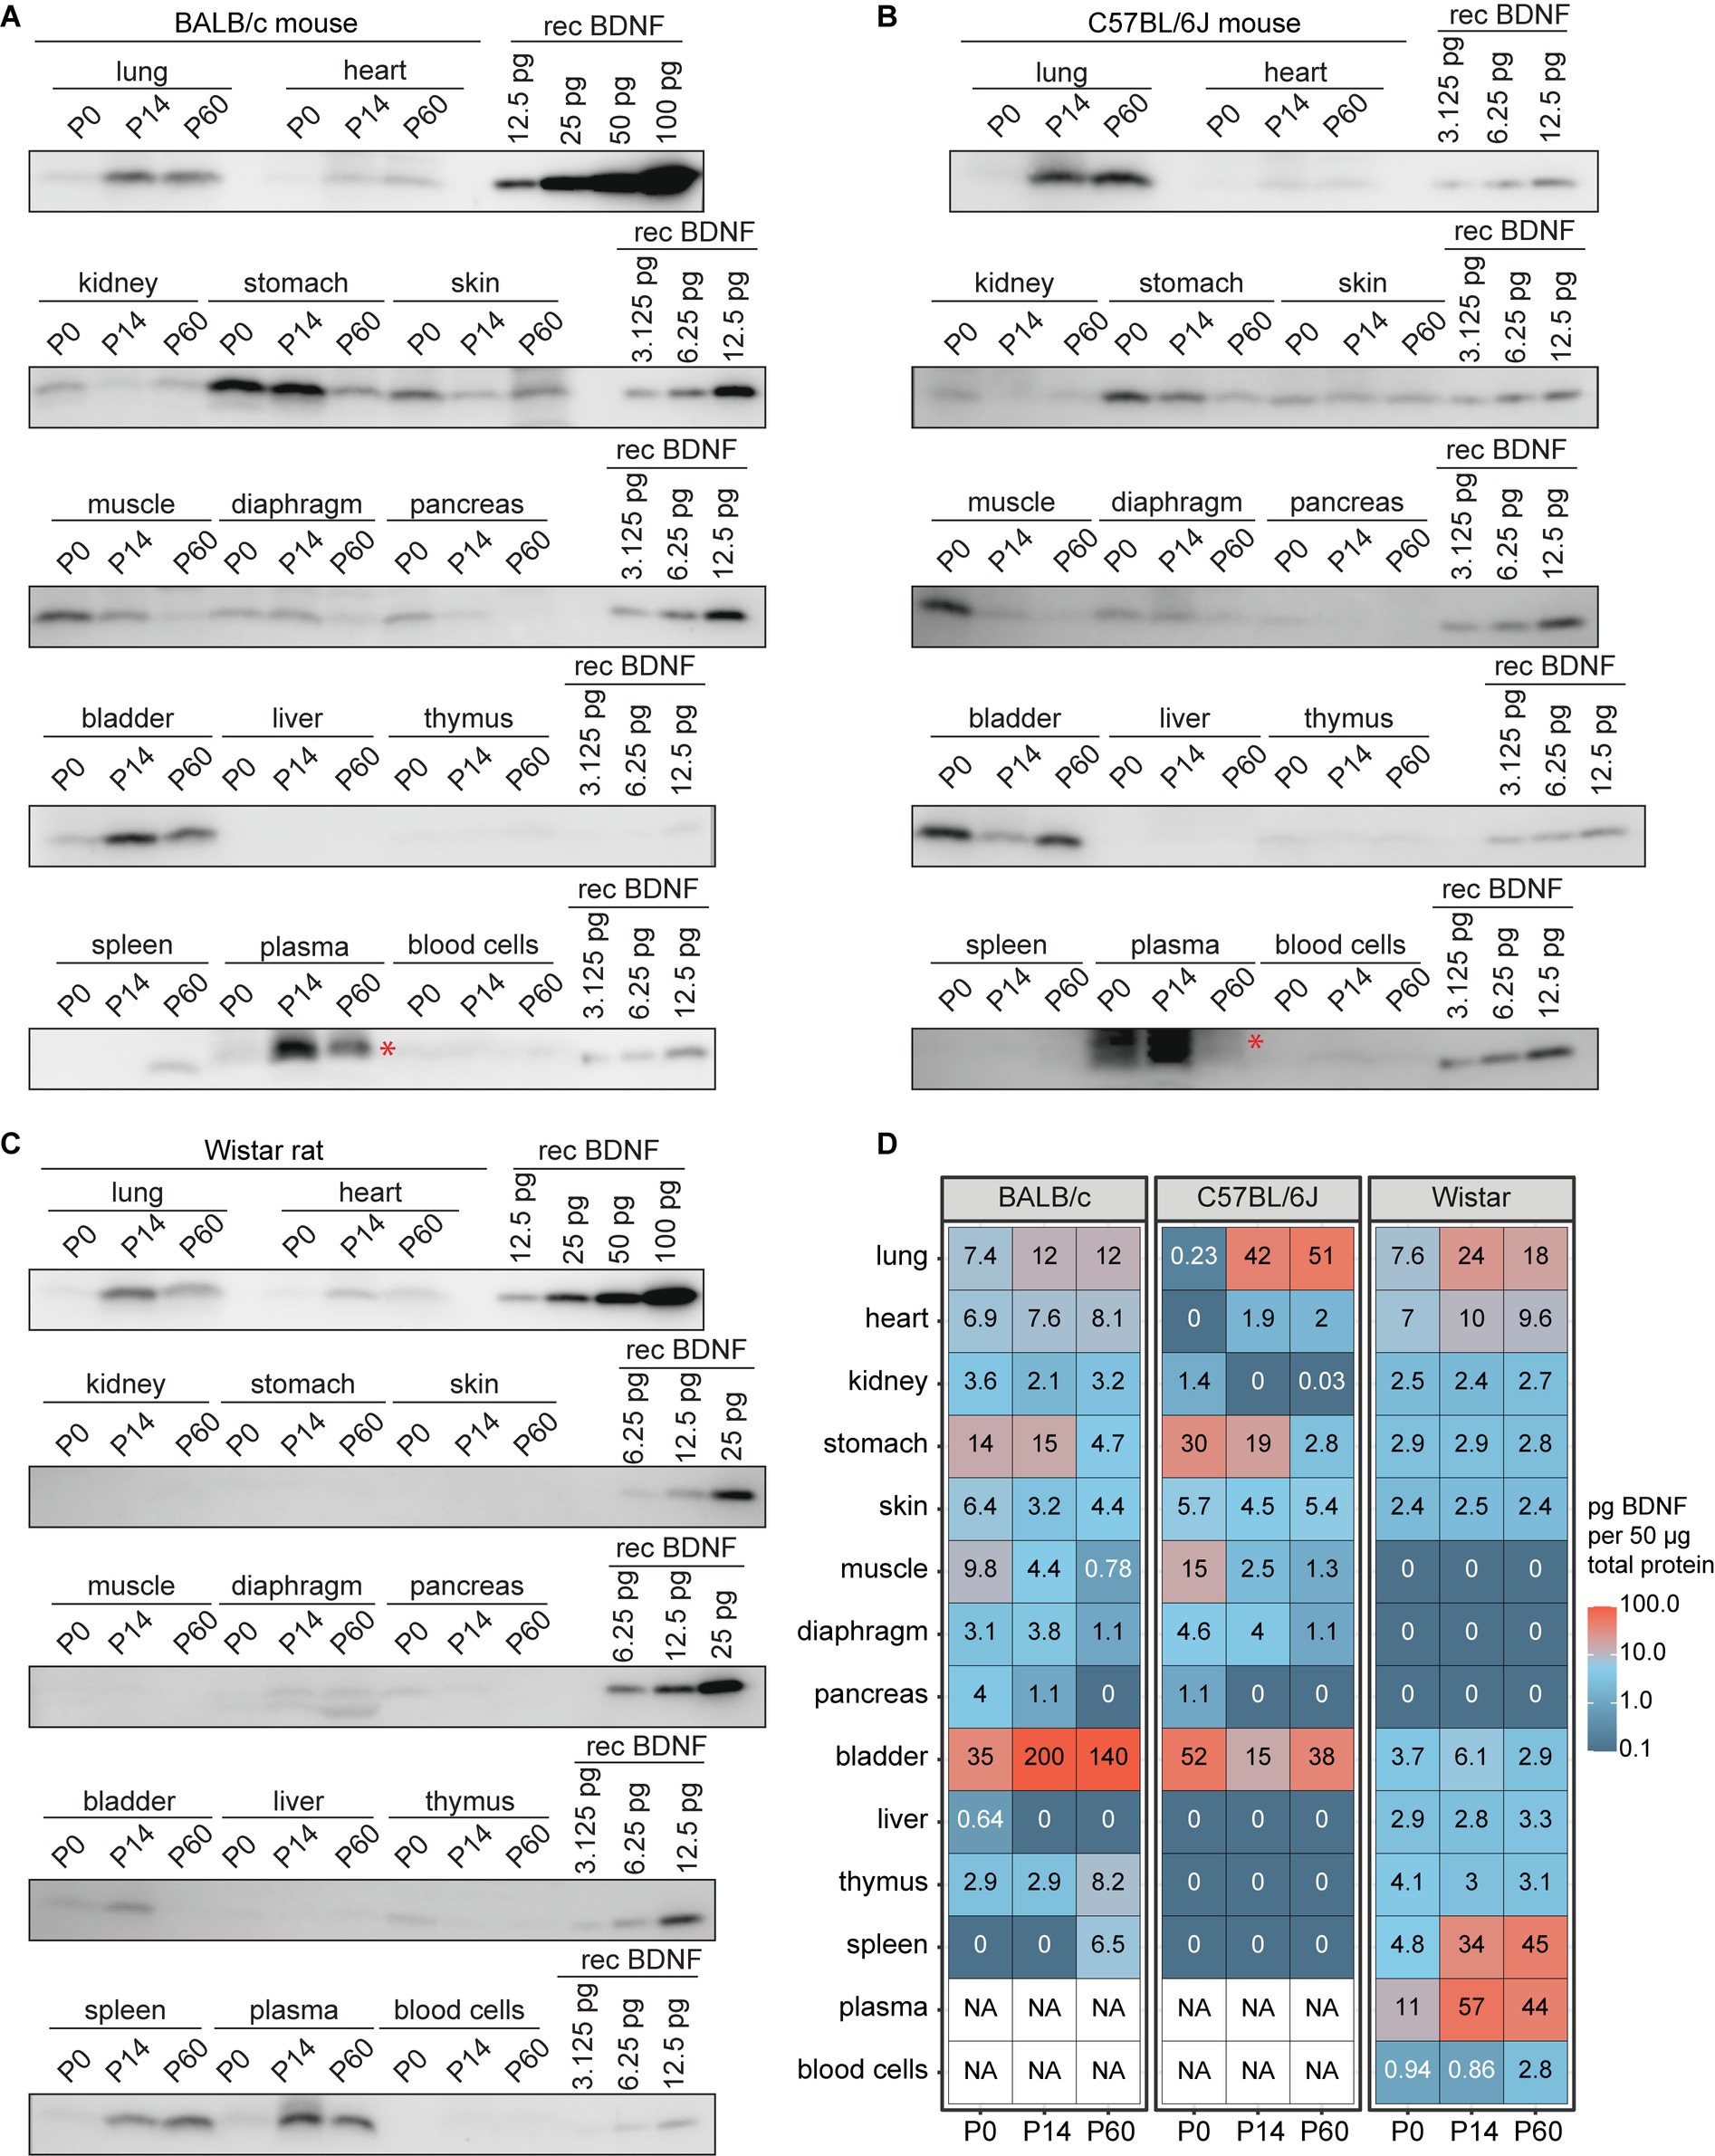
Figure 11. BDNF protein levels in non-neural tissues of BALB/c and C57BL/6 J mice and Wistar rat during development. BDNF protein levels measured by Western blot in BALB/c (A) and C57BL/6 J (B) mouse, and Wistar rat (C) non-neural tissues throughout development. Fifty micro gram total protein lysate was loaded per lane. (D) Quantification of BDNF protein levels based on recombinant BDNF (rec BDNF) signals that were used to calculate calibration curve for each blot. Numbers in the heatmap show BDNF protein quantity in pg. per 50 μg of total protein. Red asterisk marks an unspecific signal in mice plasma and blood cells, possibly masking the BDNF protein signal (A,B) and therefore no quantification of BDNF protein was performed [NA in white boxes in panel (D)]. NA – not available, P – postnatal day.
Discussion
In the current study we used RNA sequencing data from over 3,600 samples across 18 published datasets, and over 17,000 samples from GTEx, and approximately 180 samples from the BrainSpan database to generate a comprehensive understanding of BDNF, TRKB, and P75NTR mRNA expression in different mammalian tissues, complementing the previous studies (Hofer et al., 1990; Timmusk et al., 1993a,b, 1994a,b; Conner et al., 1997; Croll et al., 1998; Das et al., 2001; Stoilov et al., 2002; Silhol et al., 2005; Aid et al., 2007; Pruunsild et al., 2007; Kumanogoh et al., 2008; Luberg et al., 2010; West et al., 2014; Pattwell et al., 2022). Furthermore, using a highly specific and sensitive antibody capable of detecting low picogram levels of BDNF, we complemented the bioinformatically obtained data by thoroughly characterizing BDNF protein levels in both the nervous system and non-neural tissues throughout mouse and rat development.
The regulation of Bdnf gene expression has primarily been studied in the cerebral cortex and hippocampus, where BDNF is highly expressed (West et al., 2014). We (Esvald et al., 2022) and others (Flavell et al., 2008; McDowell et al., 2010; Lyons et al., 2012) have shown brain region-specific differences in Bdnf gene regulation between the cerebral cortex and hippocampus. For instance, Bdnf expression in the cortex is regulated by CaRF (McDowell et al., 2010), and potentially by FOXP1, SATB family members, and BCL11A (Esvald et al., 2022). In contrast, in the hippocampus, Bdnf expression is regulated by MEF family members (Flavell et al., 2008; Lyons et al., 2012) and possibly by PROX1 (Esvald et al., 2022). Our results here demonstrate high Bdnf mRNA and protein expression also in other brain regions, e.g., in the hypothalamus, thalamus, midbrain, and pons, in addition to the cerebral cortex and hippocampus. It is plausible that there are brain region and/or cell type-specific regulatory mechanisms involved. Unfortunately, the mechanisms of Bdnf gene regulation in these brain regions have not been studied thoroughly. To the best of our knowledge, previously only the zinc finger transcription factor retinoic acid-induced 1 (RAI1) has been shown to regulate Bdnf expression in the hypothalamus (Burns et al., 2010; Huang et al., 2016; Javed et al., 2021; Esvald et al., 2022), and the nuclear receptor subfamily 4 group A member 2 (NR4A2, also known as NURR1) in midbrain neurons (Volpicelli et al., 2007), cerebellar granule neurons (Barneda-Zahonero et al., 2012) and hippocampal neurons (Català-Solsona et al., 2023), but not in cortical neurons (Abdollahi and Fahnestock, 2022). We hypothesize that in addition to widely expressed transcription factors, novel tissue- and cell-type specific regulators control the expression of Bdnf gene in these brain regions.
In addition to the brain, important roles for BDNF have recently been described in many non-neural tissues (see the Introduction section for more information and references). Adding to the previously known non-neural tissues where Bdnf is expressed, e.g., heart, muscle, lung, kidney (Timmusk et al., 1993a; Aid et al., 2007), we extend this list by reporting Bdnf expression in murine esophagus, forestomach, skin, and adipose tissues, and in human circulatory system, prostate, bladder, pituitary gland, and fibroblasts. Considering the high levels of TRKB-T1 mRNA in circulatory and integumentary system, our results warrant further studies of BDNF functions in these tissues. In addition, we show that in murines, the highest BDNF protein levels are found in lung, heart, stomach, and bladder. Notably, according to single-cell data, BDNF expression is limited to specific cell types in many tissues, such as fibroblasts in the adult mouse heart. Our analysis also reveals that BDNF is expressed by various cell types in the vascular system. Altogether, our results imply that BDNF can be produced only by certain specialized cell populations and still possibly play a crucial role in the proper development and/or functioning of an organ.
Already more than 20 years ago it was shown that Bdnf homozygous knock-out mice die within weeks after birth due to cardiac failure (Donovan et al., 2000). Since then, BDNF has been shown to play an important role in heart function in different mouse models (Li et al., 2022; Yang et al., 2022). However, our analysis reveals contrasting developmental expression dynamics of BDNF in the heart across different organisms, with an increase in Bdnf mRNA levels in murines and a decrease in humans. Considering this non-conserved expression pattern, further studies are needed to clarify the precise function and expression of BDNF in the developing and adult human heart. It would also be of interest to study the functional role of BDNF in the bladder, where its biological functions have not yet been described. In fact, currently no gene regulatory mechanism for BDNF expression has been identified in non-neural tissues. Therefore, it would be also interesting to explore the regulation of BDNF expression in the specific cell populations that express BDNF in the non-neural tissues.
BDNF gene contains several different promoters that direct the expression of BDNF transcripts with different 5’ UTRs (Aid et al., 2007; Pruunsild et al., 2007). The existence of different promoters has been shown to provide tissue-specific expression of Bdnf (Timmusk et al., 1993b). Although the expression of different Bdnf transcripts have been analyzed in different tissues in both murines (Aid et al., 2007) and humans (Pruunsild et al., 2007), the published semiquantitative RT-PCR results do not allow direct comparison of the relative levels of different Bdnf transcripts. Our comprehensive analysis provides, for the first time, the proportions of different transcripts and how they contribute to total BDNF mRNA levels throughout development in different mammalian tissues. We found that different BDNF transcripts contribute to the total BDNF mRNA pool in different brain regions. For example, the most prevalent transcripts in the hypothalamus contain exon I, in the cerebellum exon II, in the cerebral cortex exon IV, and in the amygdala and thalamus one third of BDNF transcripts contain exon I. This is in agreement with previous results demonstrating that loss of BDNF synthesis from specific Bdnf transcripts differentially reduces BDNF protein levels across brain regions (Maynard et al., 2016). Our results imply that different mechanisms regulate specific BDNF transcripts in a brain region- and tissue-dependent manner, potentially providing the foundation for the distinct biological functions of different BDNF transcripts (see Introduction).
In agreement with previously published findings (Aid et al., 2007; Pruunsild et al., 2007), we also demonstrate that the expression of BDNF exon I, II, and III transcripts is mainly brain-specific, whereas exon IV and VI transcripts are expressed in both neural and non-neural tissues. Our results reveal distinct tissue-specific usage of alternative BDNF transcripts, emphasizing the specialized regulatory mechanisms of BDNF expression across various tissues. This possibly arises from the specific cell types expressing distinct BDNF transcripts. For example, it has been shown that neurons express all major BDNF transcripts, whereas astrocytes express only exon IV and VI-containing transcripts (Koppel et al., 2018). The limited expression of BDNF exons I-III possibly results from the combination of active repression in non-neuronal cells by neuron-restrictive silencer factor (NRSF) that binds BDNF promoter II (Schoenherr and Anderson, 1995; Timmusk et al., 1999; Zuccato et al., 2003), and a neuron-specific enhancer increasing the expression of the aforementioned transcripts (Tuvikene et al., 2021). Further studies are needed to elucidate the temporal, cell- and transcript-specific pattern of BDNF expression in different brain regions as well as non-neural tissues in various physiological and pathophysiological conditions.
It has been proposed that the evolution of gene regulatory regions drives the differences in gene expression between species and underlies the evolution of complex phenotypes (Wilson and Odom, 2009; Romero et al., 2012). During evolution, the human BDNF gene has acquired additional exons and potential translation initiation sites compared to the murine Bdnf gene (Pruunsild et al., 2007). Furthermore, BDNF proximal promoters contain evolutionarily non-conserved cis-elements that result in different stimulus-dependent regulation, such as the CRE element in the human BDNF promoter IX which is absent from the murine promoter but is present in primates (Esvald et al., 2020). In contrast, the mature BDNF protein amino acid sequence is highly conserved among mammals, indicating the functional importance of BDNF protein (Lucaci et al., 2022). Here, we show that total BDNF mRNA levels are similar, while the usage of different BDNF promoter regions varies between mammals, suggesting evolutionary changes in proximal promoter and/or enhancer regions. Although there seem to be tissue-specific differences in the usage of 5′ exons, the usage of alternative polyadenylation signals and the resulting 3’ UTRs are conserved throughout mammalian evolution. Notably, as total BDNF mRNA levels in the brain are roughly similar in mammals (except for opossum), the upregulation of certain BDNF transcripts seems to result in downregulation of other BDNF transcripts, implying remarkable feedback loops for maintaining stable total BDNF expression levels.
In this study, we provide a comprehensive description of BDNF protein levels in murine brain regions and non-neural tissues. Our results show that BDNF protein levels peak at P21 and at P10-14 in most mouse and rat brain regions, respectively. In adult murines, the highest levels of BDNF protein are found in the hippocampus and hypothalamus, which is in agreement with the well-established role of BDNF in memory and learning processes in the hippocampus (Park and Poo, 2013), and metabolic control in the hypothalamus (Unger et al., 2007; An et al., 2015). Interestingly, our results also indicate that Bdnf mRNA levels do not always reflect BDNF protein levels. For example, while the total Bdnf mRNA levels in mouse hypothalamus and cortical regions are similar, the BDNF protein levels in the hypothalamus are much higher. This discrepancy could be explained by high proportion of exon I-containing Bdnf transcripts, which exhibit higher translation efficiency (Koppel et al., 2015), and low proportion of Bdnf transcripts with long 3’ UTR, which are less associated with polysomes than transcripts with short 3’ UTR (Timmusk et al., 1994b) in the hypothalamus. However, we cannot exclude the possibility of BDNF protein transport into the hypothalamus from other brain regions projecting to it (Saper, 2000). Similarly, we observe relatively strong Bdnf mRNA expression in the cerebellum, although the BDNF protein levels in this brain region are among the lowest in the brain. This difference might be due to the very low proportion of the well-translated Bdnf exon I transcripts, high proportion of the poorly translated exon II-containing transcripts (Lekk et al., 2023), and a relatively high proportion of transcripts with long 3’ UTR, possibly further impairing BDNF translation. Furthermore, total Bdnf mRNA levels in the lung and brain are comparable, but BDNF protein levels are significantly lower in the lung. Based on our data, we hypothesize that BDNF protein levels are a subject to complex regulation involving 5′ and 3’ UTRs as well as interregional transportation.
Collectively, our results provide and extensive description of BDNF, TRKB, and P75NTR mRNA expression and BDNF protein levels. This comprehensive analysis not only confirms but also broadens the existing knowledge, serving as a valuable input for future research avenues.
Data availability statement
The original contributions presented in the study are included in the Supplementary material. The datasets presented in this study can be found in online repositories. The names of the repositories and accession number(s) can be found in the Supplementary material. Further inquiries can be directed to the corresponding author.
Ethics statement
The animal study was reviewed and approved by Ministry of Agriculture of Estonia (Permit Number: 45).
Author contributions
E-EE designed research, performed Western blot, wrote the first draft, and edited the manuscript. JT designed research, performed bioinformatical analysis, analyzed MVA experiment, and wrote and edited the manuscript. CK designed research, performed bioinformatical analysis and Western blot and edited the manuscript. AA, FC-C, LT, and IK performed Western blot and edited the manuscript. ASi, ASh, and LT provided tissue lysates and edited the manuscript. AP designed and analyzed MVA experiment. KP designed the MVA experiment, provided funding, and reviewed the manuscript. TT conceived the idea, supervised the study, provided funding, and reviewed the manuscript. All authors contributed to the article and approved the submitted version.
Funding
This study was supported by the Estonian Research Council (grants PRG805 to TT, PRG573 and PRG1953 to KP), European Union through the European Regional Development Fund (project no. 2014–2020.4.01.15–0012 to TT), H2020-MSCA-RISE-2016 (grant EU734791 to KP and TT) and European Commission and Estonian Research Council (ERA-NET NEURON Cofund2 programme grant GDNF UpReg to TT and KP). JT was partially funded by the Estonian Ministry of Education and Research grant 2014–2020.4.01.21–0315.
Acknowledgments
The authors would like to thank ENCODE consortia, GTEx, BrainSpan, Human Protein Atlas, Tabula Muris consortia, CellxGene, and all the scientific groups for producing the publicly available data that underlie our study. We also thank Epp Väli and Protobios team for technical assistance and Olga Jasnovidova for critical reading of the manuscript and creating the illustration of BDNF protein structure.
Conflict of interest
E-EE, JT, AP, KP, and TT were employed by Protobios LLC. JT was employed by dxlabs LLC.
The remaining authors declare that the research was conducted in the absence of any commercial or financial relationships that could be construed as a potential conflict of interest.
Publisher’s note
All claims expressed in this article are solely those of the authors and do not necessarily represent those of their affiliated organizations, or those of the publisher, the editors and the reviewers. Any product that may be evaluated in this article, or claim that may be made by its manufacturer, is not guaranteed or endorsed by the publisher.
Supplementary material
The Supplementary material for this article can be found online at: https://www.frontiersin.org/articles/10.3389/fnmol.2023.1182499/full#supplementary-material
Footnotes
References
Abdollahi, M., and Fahnestock, M. (2022). Nurr1 is not an essential regulator of BDNF in mouse cortical neurons. Int. J. Mol. Sci. 23:6853. doi: 10.3390/ijms23126853
Afsar, B., and Afsar, R. E. (2022). Brain-derived neurotrophic factor (BDNF): a multifaceted marker in chronic kidney disease. Clin. Exp. Nephrol. 26, 1149–1159. doi: 10.1007/s10157-022-02268-z
Ahuja, P., Ng, C. F., Pang, B. P. S., Chan, W. S., Tse, M. C. L., Bi, X., et al. (2021). Muscle-generated BDNF (brain derived neurotrophic factor) maintains mitochondrial quality control in female mice. Autophagy 18, 1367–1384. doi: 10.1080/15548627.2021.1985257
Aid, T., Kazantseva, A., Piirsoo, M., Palm, K., and Timmusk, T. (2007). Mouse and rat BDNF gene structure and expression revisited. J. Neurosci. Res. 85, 525–535. doi: 10.1002/jnr.21139
Altar, C. A., Cai, N., Bliven, T., Juhasz, M., Conner, J. M., Acheson, A. L., et al. (1997). Anterograde transport of brain-derived neurotrophic factor and its role in the brain. Nature 389, 856–860. doi: 10.1038/39885
An, J. J., Liao, G.-Y., Kinney, C. E., Sahibzada, N., and Xu, B. (2015). Discrete BDNF neurons in the Paraventricular hypothalamus control feeding and energy expenditure. Cell Metab. 22, 175–188. doi: 10.1016/j.cmet.2015.05.008
Andreska, T., Rauskolb, S., Schukraft, N., Lüningschrör, P., Sasi, M., Signoret-Genest, J., et al. (2020). Induction of BDNF expression in layer II/III and layer V neurons of the motor cortex is essential for motor learning. J. Neurosci. 40, 6289–6308. doi: 10.1523/JNEUROSCI.0288-20.2020
Autry, A. E., and Monteggia, L. M. (2012). Brain-derived Neurotrophic factor and neuropsychiatric disorders. Pharmacol. Rev. 64, 238–258. doi: 10.1124/pr.111.005108
Baj, G., Del Turco, D., Schlaudraff, J., Torelli, L., Deller, T., and Tongiorgi, E. (2013). Regulation of the spatial code for BDNF mRNA isoforms in the rat hippocampus following pilocarpine-treatment: a systematic analysis using laser microdissection and quantitative real-time PCR. Hippocampus 23, 413–423. doi: 10.1002/hipo.22100
Baj, G., Pinhero, V., Vaghi, V., and Tongiorgi, E. (2016). Signaling pathways controlling activity-dependent local translation of BDNF and their localization in dendritic arbors. J. Cell Sci. 129, 2852–2864. doi: 10.1242/jcs.177626
Baquet, Z. C., Gorski, J. A., and Jones, K. R. (2004). Early striatal dendrite deficits followed by neuron loss with advanced age in the absence of anterograde cortical brain-derived Neurotrophic factor. J. Neurosci. 24, 4250–4258. doi: 10.1523/JNEUROSCI.3920-03.2004
Barde, Y.-A., Edgar, D., and Thoenen, H. (1980). Sensory neurons in culture: changing requirements for survival factors during embryonic development. Proc. Natl. Acad. Sci. U. S. A. 77, 1199–1203. doi: 10.1073/pnas.77.2.1199
Barde, Y. A., Edgar, D., and Thoenen, H. (1982). Purification of a new neurotrophic factor from mammalian brain. EMBO J. 1, 549–553. doi: 10.1002/j.1460-2075.1982.tb01207.x
Barde, Y. A., Lindsay, R. M., Monard, D., and Thoenen, H. (1978). New factor released by cultured glioma cells supporting survival and growth of sensory neurones. Nature 274:818. doi: 10.1038/274818a0
Barneda-Zahonero, B., Servitja, J.-M., Badiola, N., Miñano-Molina, A. J., Fadó, R., Saura, C. A., et al. (2012). Nurr1 protein is required for N-methyl-d-aspartic acid (NMDA) receptor-mediated neuronal survival. J. Biol. Chem. 287, 11351–11362. doi: 10.1074/jbc.M111.272427
Boukhatem, I., Fleury, S., Welman, M., Le Blanc, J., Thys, C., Freson, K., et al. (2021). The brain-derived neurotrophic factor prompts platelet aggregation and secretion. Blood Adv. 5, 3568–3580. doi: 10.1182/bloodadvances.2020004098
Burns, B., Schmidt, K., Williams, S. R., Kim, S., Girirajan, S., and Elsea, S. H. (2010). Rai1 haploinsufficiency causes reduced Bdnf expression resulting in hyperphagia, obesity and altered fat distribution in mice and humans with no evidence of metabolic syndrome. Hum. Mol. Genet. 19, 4026–4042. doi: 10.1093/hmg/ddq317
Cardoso-Moreira, M., Halbert, J., Valloton, D., Velten, B., Chen, C., Shao, Y., et al. (2019). Gene expression across mammalian organ development. Nature 571, 505–509. doi: 10.1038/s41586-019-1338-5
Castrén, E., Berninger, B., Leingärtner, A., and Lindholm, D. (1998). Regulation of brain-derived neurotrophic factor mRNA levels in hippocampus by neuronal activity. Prog. Brain Res. 117, 57–64.
Català-Solsona, J., Lituma, P. J., Lutzu, S., Siedlecki-Wullich, D., Fábregas-Ordoñez, C., Miñano-Molina, A. J., et al. (2023). Activity-dependent Nr4a2 induction modulates synaptic expression of AMPA receptors and plasticity via a Ca2+/CRTC1/CREB pathway. J. Neurosci. 43, 3028–3041. doi: 10.1523/JNEUROSCI.1341-22.2023
Chacón-Fernández, P., Säuberli, K., Colzani, M., Moreau, T., Ghevaert, C., and Barde, Y.-A. (2016). Brain-derived Neurotrophic factor in megakaryocytes. J. Biol. Chem. 291, 9872–9881. doi: 10.1074/jbc.M116.720029
Champlin, A. K., Dorr, D. L., and Gates, A. H. (1973). Determining the stage of the estrous cycle in the mouse by the appearance of the vagina. Biol. Reprod. 8, 491–494. doi: 10.1093/biolreprod/8.4.491
Chan Zuckerberg Initiative (n.d.). CZ CELLxGENE Discover. Available at: https://cellxgene.cziscience.com/ (accessed December 18, 2022).
Chiaruttini, C., Sonego, M., Baj, G., Simonato, M., and Tongiorgi, E. (2008). BDNF mRNA splice variants display activity-dependent targeting to distinct hippocampal laminae. Mol. Cell. Neurosci. 37, 11–19. doi: 10.1016/j.mcn.2007.08.011
Chiaruttini, C., Vicario, A., Li, Z., Baj, G., Braiuca, P., Wu, Y., et al. (2009). Dendritic trafficking of BDNF mRNA is mediated by translin and blocked by the G196A (Val66Met) mutation. Proc. Natl. Acad. Sci. 106, 16481–16486. doi: 10.1073/pnas.0902833106
Colliva, A., and Tongiorgi, E. (2021). Distinct role of 5′UTR sequences in dendritic trafficking of BDNF mRNA: additional mechanisms for the BDNF splice variants spatial code. Mol. Brain 14:10. doi: 10.1186/s13041-020-00680-8
Conner, J. M., Lauterborn, J. C., Yan, Q., Gall, C. M., and Varon, S. (1997). Distribution of brain-derived Neurotrophic factor (BDNF) protein and mRNA in the Normal adult rat CNS: evidence for anterograde axonal transport. J. Neurosci. 17, 2295–2313. doi: 10.1523/JNEUROSCI.17-07-02295.1997
Croll, S. D., Ip, N. Y., Lindsay, R. M., and Wiegand, S. J. (1998). Expression of BDNF and trkB as a function of age and cognitive performance. Brain Res. 812, 200–208. doi: 10.1016/S0006-8993(98)00993-7
Das, K. P., Chao, S. L., White, L. D., Haines, W. T., Harry, G. J., Tilson, H. A., et al. (2001). Differential patterns of nerve growth factor, brain-derived neurotrophic factor and neurotrophin-3 mRNA and protein levels in developing regions of rat brain. Neuroscience 103, 739–761. doi: 10.1016/S0306-4522(01)00011-2
Delezie, J., Weihrauch, M., Maier, G., Tejero, R., Ham, D. J., Gill, J. F., et al. (2019). BDNF is a mediator of glycolytic fiber-type specification in mouse skeletal muscle. PNAS 116, 16111–16120. doi: 10.1073/pnas.1900544116
Donovan, M. J., Lin, M. I., Wiegn, P., Ringstedt, T., Kraemer, R., Hahn, R., et al. (2000). Brain derived neurotrophic factor is an endothelial cell survival factor required for intramyocardial vessel stabilization. Development 127, 4531–4540. doi: 10.1242/dev.127.21.4531
ENCODE Project Consortium (2012). An integrated encyclopedia of DNA elements in the human genome. Nature 489, 57–74. doi: 10.1038/nature11247
Endlich, N., Lange, T., Kuhn, J., Klemm, P., Kotb, A. M., Siegerist, F., et al. (2018). BDNF: mRNA expression in urine cells of patients with chronic kidney disease and its role in kidney function. J. Cell. Mol. Med. 22, 5265–5277. doi: 10.1111/jcmm.13762
Ernfors, P., Lee, K. F., and Jaenisch, R. (1994). Mice lacking brain-derived neurotrophic factor develop with sensory deficits. Nature 368, 147–150. doi: 10.1038/368147a0
Esvald, E.-E., Tuvikene, J., Moistus, A., Rannaste, K., Kõomägi, S., and Timmusk, T. (2022). Differential regulation of the BDNF gene in cortical and hippocampal neurons. J. Neurosci. 42, 9110–9128. doi: 10.1523/JNEUROSCI.2535-21.2022
Esvald, E.-E., Tuvikene, J., Sirp, A., Patil, S., Bramham, C. R., and Timmusk, T. (2020). CREB family transcription factors are major mediators of BDNF transcriptional autoregulation in cortical neurons. J. Neurosci. 40, 1405–1426. doi: 10.1523/JNEUROSCI.0367-19.2019
Fagerberg, L., Hallström, B. M., Oksvold, P., Kampf, C., Djureinovic, D., Odeberg, J., et al. (2014). Analysis of the human tissue-specific expression by genome-wide integration of Transcriptomics and antibody-based proteomics*. Mol. Cell. Proteomics 13, 397–406. doi: 10.1074/mcp.M113.035600
Flavell, S. W., Kim, T.-K., Gray, J. M., Harmin, D. A., Hemberg, M., Hong, E. J., et al. (2008). Genome-wide analysis of MEF2 transcriptional program reveals synaptic target genes and neuronal activity-dependent Polyadenylation site selection. Neuron 60, 1022–1038. doi: 10.1016/j.neuron.2008.11.029
Fukuchi, M., and Tsuda, M. (2010). Involvement of the 3′-untranslated region of the brain-derived neurotrophic factor gene in activity-dependent mRNA stabilization. J. Neurochem. 115, 1222–1233. doi: 10.1111/j.1471-4159.2010.07016.x
Fulgenzi, G., Hong, Z., Tomassoni-Ardori, F., Barella, L. F., Becker, J., Barrick, C., et al. (2020). Novel metabolic role for BDNF in pancreatic β-cell insulin secretion. Nat. Commun. 11, 1950–1918. doi: 10.1038/s41467-020-15833-5
Fulgenzi, G., Tomassoni-Ardori, F., Babini, L., Becker, J., Barrick, C., Puverel, S., et al. (2015). BDNF modulates heart contraction force and long-term homeostasis through truncated TrkB.T1 receptor activation. J. Cell Biol. 210, 1003–1012. doi: 10.1083/jcb.201502100
García-Suárez, O., González-Martínez, T., Germana, A., Monjil, D. F., Torrecilla, J. R., Laurà, R., et al. (2006). Expression of TrkB in the murine kidney. Microsc. Res. Tech. 69, 1014–1020. doi: 10.1002/jemt.20367
Haapasalo, A., Sipola, I., Larsson, K., Åkerman, K. E. O., Stoilov, P., Stamm, S., et al. (2002). Regulation of TRKB surface expression by brain-derived Neurotrophic factor and truncated TRKB isoforms. J. Biol. Chem. 277, 43160–43167. doi: 10.1074/jbc.M205202200
Hallböök, F. (1999). Evolution of the vertebrate neurotrophin and Trk receptor gene families. Curr. Opin. Neurobiol. 9, 616–621. doi: 10.1016/S0959-4388(99)00011-2
Hallböök, F., Ibáñez, C. F., and Persson, H. (1991). Evolutionary studies of the nerve growth factor family reveal a novel member abundantly expressed in Xenopus ovary. Neuron 6, 845–858. doi: 10.1016/0896-6273(91)90180-8
Hill, J. L., Hardy, N. F., Jimenez, D. V., Maynard, K. R., Kardian, A. S., Pollock, C. J., et al. (2016). Loss of promoter IV-driven BDNF expression impacts oscillatory activity during sleep, sensory information processing and fear regulation. Transl. Psychiatry 6:e873. doi: 10.1038/tp.2016.153
Hofer, M., Pagliusi, S. R., Hohn, A., Leibrock, J., and Barde, Y. A. (1990). Regional distribution of brain-derived neurotrophic factor mRNA in the adult mouse brain. EMBO J. 9, 2459–2464. doi: 10.1002/j.1460-2075.1990.tb07423.x
Hong, E. J., McCord, A. E., and Greenberg, M. E. (2008). A biological function for the neuronal activity-dependent component of Bdnf transcription in the development of cortical inhibition. Neuron 60, 610–624. doi: 10.1016/j.neuron.2008.09.024
Huang, W.-H., Guenthner, C. J., Xu, J., Nguyen, T., Schwarz, L. A., Wilkinson, A. W., et al. (2016). Molecular and neural functions of Rai1, the causal gene for smith-Magenis syndrome. Neuron 92, 392–406. doi: 10.1016/j.neuron.2016.09.019
Javed, S., Lee, Y.-J., Xu, J., and Huang, W.-H. (2021). Temporal dissection of Rai1 function reveals brain-derived neurotrophic factor as a potential therapeutic target for smith-Magenis syndrome. Hum. Mol. Genet. 31, 275–288. doi: 10.1093/hmg/ddab245
Jones, K. R., Fariñas, I., Backus, C., and Reichardt, L. F. (1994). Targeted disruption of the BDNF gene perturbs brain and sensory neuron development but not motor neuron development. Cells 76, 989–999. doi: 10.1016/0092-8674(94)90377-8
Kasak, L., Kivil, A., Lend, A. K., Neuman, T., Palm, K., Pihlak, A., et al. (2017). Peptide profiling and monitoring humoral immunity. Available at: https://patents.google.com/patent/US9672324B1/en. (November 8, 2022).
Keane, T. M., Goodstadt, L., Danecek, P., White, M. A., Wong, K., Yalcin, B., et al. (2011). Mouse genomic variation and its effect on phenotypes and gene regulation. Nature 477, 289–294. doi: 10.1038/nature10413
Koppel, I., Jaanson, K., Klasche, A., Tuvikene, J., Tiirik, T., Pärn, A., et al. (2018). Dopamine cross-reacts with adrenoreceptors in cortical astrocytes to induce BDNF expression, CREB signaling and morphological transformation. Glia 66, 206–216. doi: 10.1002/glia.23238
Koppel, I., Tuvikene, J., Lekk, I., and Timmusk, T. (2015). Efficient use of a translation start codon in BDNF exon I. J. Neurochem. 134, 1015–1025. doi: 10.1111/jnc.13124
Kraemer, B. R., Yoon, S. O., and Carter, B. D. (2014). The biological functions and signaling mechanisms of the p75 neurotrophin receptor. Handb. Exp. Pharmacol. 220, 121–164. doi: 10.1007/978-3-642-45106-5_6
Kumanogoh, H., Asami, J., Nakamura, S., and Inoue, T. (2008). Balanced expression of various TrkB receptor isoforms from the Ntrk2 gene locus in the mouse nervous system. Mol. Cell. Neurosci. 39, 465–477. doi: 10.1016/j.mcn.2008.07.024
Lee, R., Kermani, P., Teng, K. K., and Hempstead, B. L. (2001). Regulation of cell survival by secreted proneurotrophins. Science 294, 1945–1948. doi: 10.1126/science.1065057
Lekk, I., Cabrera-Cabrera, F., Turconi, G., Tuvikene, J., Esvald, E.-E., Rähni, A., et al. (2023). Untranslated regions of brain-derived neurotrophic factor (Bdnf) mRNA control its translatability and subcellular localization. J. Biol. Chem. 299:102897. doi: 10.1016/j.jbc.2023.102897
Li, L., Guo, H., Lai, B., Liang, C., Chen, H., Chen, Y., et al. (2022). Ablation of cardiomyocyte-derived BDNF during development causes myocardial degeneration and heart failure in the adult mouse heart. Front. Cardiovasc. Med. 299:102897. doi: 10.3389/fcvm.2022.967463
Li, B., Qing, T., Zhu, J., Wen, Z., Yu, Y., Fukumura, R., et al. (2017). A comprehensive mouse Transcriptomic BodyMap across 17 tissues by RNA-seq. Sci. Rep. 7:4200. doi: 10.1038/s41598-017-04520-z
Liu, Y., Rutlin, M., Huang, S., Barrick, C. A., Wang, F., Jones, K. R., et al. (2012). Sexually dimorphic BDNF signaling directs sensory innervation of the mammary gland. Science 338, 1357–1360. doi: 10.1126/science.1228258
Lu, B., Pang, P. T., and Woo, N. H. (2005). The yin and yang of neurotrophin action. Nat. Rev. Neurosci. 6, 603–614. doi: 10.1038/nrn1726
Luberg, K., Wong, J., Weickert, C. S., and Timmusk, T. (2010). Human TrkB gene: novel alternative transcripts, protein isoforms and expression pattern in the prefrontal cerebral cortex during postnatal development. J. Neurochem. 113, 952–964. doi: 10.1111/j.1471-4159.2010.06662.x
Lucaci, A. G., Notaras, M. J., Kosakovsky Pond, S. L., and Colak, D. (2022). The evolution of BDNF is defined by strict purifying selection and prodomain spatial coevolution, but what does it mean for human brain disease? Transl. Psychiatry 12, 258–217. doi: 10.1038/s41398-022-02021-w
Luo, Y., Hitz, B. C., Gabdank, I., Hilton, J. A., Kagda, M. S., Lam, B., et al. (2020). New developments on the encyclopedia of DNA elements (ENCODE) data portal. Nucleic Acids Res. 48, D882–D889. doi: 10.1093/nar/gkz1062
Lyons, M. R., Schwarz, C. M., and West, A. E. (2012). Members of the Myocyte enhancer factor 2 transcription factor family differentially regulate Bdnf transcription in response to neuronal depolarization. J. Neurosci. 32, 12780–12785. doi: 10.1523/JNEUROSCI.0534-12.2012
Maynard, K. R., Hill, J. L., Calcaterra, N. E., Palko, M. E., Kardian, A., Paredes, D., et al. (2016). Functional role of BDNF production from unique promoters in aggression and serotonin signaling. Neuropsychopharmacology 41, 1943–1955. doi: 10.1038/npp.2015.349
Maynard, K. R., Hobbs, J. W., Phan, B. N., Gupta, A., Rajpurohit, S., Williams, C., et al. (2018). BDNF-TrkB signaling in oxytocin neurons contributes to maternal behavior. eLife 7:e33676. doi: 10.7554/eLife.33676
Maynard, K. R., Hobbs, J. W., Sukumar, M., Kardian, A. S., Jimenez, D. V., Schloesser, R. J., et al. (2017). Bdnf mRNA splice variants differentially impact CA1 and CA3 dendrite complexity and spine morphology in the hippocampus. Brain Struct. Funct. 222, 3295–3307. doi: 10.1007/s00429-017-1405-3
McDowell, K. A., Hutchinson, A. N., Wong-Goodrich, S. J. E., Presby, M. M., Su, D., Rodriguiz, R. M., et al. (2010). Reduced cortical BDNF expression and aberrant memory in Carf Knock-out mice. J. Neurosci. 30, 7453–7465. doi: 10.1523/JNEUROSCI.3997-09.2010
Merkin, J., Russell, C., Chen, P., and Burge, C. B. (2012). Evolutionary dynamics of gene and Isoform regulation in mammalian tissues. Science, 43, 3028–3041. doi: 10.1126/science.1228186
Mowla, S. J., Farhadi, H. F., Pareek, S., Atwal, J. K., Morris, S. J., Seidah, N. G., et al. (2001). Biosynthesis and post-translational processing of the precursor to brain-derived neurotrophic factor. J. Biol. Chem. 276, 12660–12666. doi: 10.1074/jbc.M008104200
Mowla, S. J., Pareek, S., Farhadi, H. F., Petrecca, K., Fawcett, J. P., Seidah, N. G., et al. (1999). Differential sorting of nerve growth factor and brain-derived neurotrophic factor in hippocampal neurons. J. Neurosci. 19, 2069–2080. doi: 10.1523/JNEUROSCI.19-06-02069.1999
Paris, A. J., Hayer, K. E., Oved, J. H., Avgousti, D. C., Toulmin, S. A., Zepp, J. A., et al. (2020). STAT3–BDNF–TrkB signalling promotes alveolar epithelial regeneration after lung injury. Nat. Cell Biol. 22, 1197–1210. doi: 10.1038/s41556-020-0569-x
Park, H., and Poo, M. (2013). Neurotrophin regulation of neural circuit development and function. Nat. Rev. Neurosci. 14, 7–23. doi: 10.1038/nrn3379
Pattabiraman, P. P., Tropea, D., Chiaruttini, C., Tongiorgi, E., Cattaneo, A., and Domenici, L. (2005). Neuronal activity regulates the developmental expression and subcellular localization of cortical BDNF mRNA isoforms in vivo. Mol. Cell. Neurosci. 28, 556–570. doi: 10.1016/j.mcn.2004.11.010
Pattwell, S. S., Arora, S., Nuechterlein, N., Zager, M., Loeb, K. R., Cimino, P. J., et al. (2022). Oncogenic role of a developmentally regulated NTRK2 splice variant. Science. Advances 8:eabo6789. doi: 10.1126/sciadv.abo6789
Pruunsild, P., Kazantseva, A., Aid, T., Palm, K., and Timmusk, T. (2007). Dissecting the human BDNF locus: bidirectional transcription, complex splicing, and multiple promoters. Genomics 90, 397–406. doi: 10.1016/j.ygeno.2007.05.004
Radka, S. F., Hoist, P. A., Fritsche, M., and Altar, C. A. (1996). Presence of brain-derived neurotrophic factor in brain and human and rat but not mouse serum detected by a sensitive and specific immunoassay. Brain Res. 709, 122–130. doi: 10.1016/0006-8993(95)01321-0
Rayan, N. A., Kumar, V., Aow, J., Rastegar, N., Lim, M. G. L., O’Toole, N., et al. (2022). Integrative multi-omics landscape of fluoxetine action across 27 brain regions reveals global increase in energy metabolism and region-specific chromatin remodelling. Mol. Psychiatry 27, 4510–4525. doi: 10.1038/s41380-022-01725-1
Reichardt, L. F. (2006). Neurotrophin-regulated signalling pathways. Philos. Trans. R. Soc. Lond. Biol. Sci. 361, 1545–1564. doi: 10.1098/rstb.2006.1894
Rodriguez-Tebar, A., Dechant, G., and Barde, Y.-A. (1990). Binding of brain-derived neurotrophic factor to the nerve growth factor receptor. Neuron 4, 487–492. doi: 10.1016/0896-6273(90)90107-Q
Rodríguez-Tébar, A., Dechant, G., Götz, R., and Barde, Y. A. (1992). Binding of neurotrophin-3 to its neuronal receptors and interactions with nerve growth factor and brain-derived neurotrophic factor. EMBO J. 11, 917–922. doi: 10.1002/j.1460-2075.1992.tb05130.x
Romero, I. G., Ruvinsky, I., and Gilad, Y. (2012). Comparative studies of gene expression and the evolution of gene regulation. Nat. Rev. Genet. 13, 505–516. doi: 10.1038/nrg3229
Rutlin, M., Ho, C.-Y., Abraira, V. E., Cassidy, C., Bai, L., Woodbury, C. J., et al. (2014). The cellular and molecular basis of direction selectivity of Aδ-LTMRs. Cells 159, 1640–1651. doi: 10.1016/j.cell.2014.11.038
Rydén, M., Murray-Rust, J., Glass, D., Ilag, L. L., Trupp, M., Yancopoulos, G. D., et al. (1995). Functional analysis of mutant neurotrophins deficient in low-affinity binding reveals a role for p75LNGFR in NT-4 signalling. EMBO J. 14, 1979–1990.
Sadam, H., Pihlak, A., Jaago, M., Pupina, N., Rähni, A., Toots, M., et al. (2021). Identification of two highly antigenic epitope markers predicting multiple sclerosis in optic neuritis patients. EBioMedicine 64:103211. doi: 10.1016/j.ebiom.2021.103211
Sadam, H., Pihlak, A., Kivil, A., Pihelgas, S., Jaago, M., Adler, P., et al. (2018). Prostaglandin D2 receptor DP1 antibodies predict vaccine-induced and spontaneous narcolepsy type 1: large-scale study of antibody profiling. EBioMedicine 29, 47–59. doi: 10.1016/j.ebiom.2018.01.043
Sakata, K., Woo, N. H., Martinowich, K., Greene, J. S., Schloesser, R. J., Shen, L., et al. (2009). Critical role of promoter IV-driven BDNF transcription in GABAergic transmission and synaptic plasticity in the prefrontal cortex. PNAS 106, 5942–5947. doi: 10.1073/pnas.0811431106
Saper, C. B. (2000). “Hypothalamic connections with the cerebral cortex” in Progress in Brain Research Cognition, emotion and autonomic responses: the integrative role of the prefrontal cortex and limbic structures, eds. H. B. M. Uylings, G.G. van Eden, J. P. C. de Bruin, M. G. P. Feenstra, and C. M. A. Pennartz. (Amsterdam: Elsevier).
Sar Shalom, H., Goldner, R., Golan-Vaishenker, Y., and Yaron, A. (2019). Balance between BDNF and Semaphorins gates the innervation of the mammary gland. eLife 8:e41162. doi: 10.7554/eLife.41162
Schoenherr, C. J., and Anderson, D. J. (1995). The neuron-restrictive silencer factor (NRSF): a coordinate repressor of multiple neuron-specific genes. Science 267, 1360–1363. doi: 10.1126/science.7871435
Shafik, A. M., Zhang, F., Guo, Z., Dai, Q., Pajdzik, K., Li, Y., et al. (2021). N6-methyladenosine dynamics in neurodevelopment and aging, and its potential role in Alzheimer’s disease. Genome Biol. 22:17. doi: 10.1186/s13059-020-02249-z
Silhol, M., Bonnichon, V., Rage, F., and Tapia-Arancibia, L. (2005). Age-related changes in brain-derived neurotrophic factor and tyrosine kinase receptor isoforms in the hippocampus and hypothalamus in male rats. Neuroscience 132, 613–624. doi: 10.1016/j.neuroscience.2005.01.008
Singer, W., Manthey, M., Panford-Walsh, R., Matt, L., Geisler, H.-S., Passeri, E., et al. (2018). BDNF-live-exon-visualization (BLEV) allows differential detection of BDNF transcripts in vitro and in vivo. Front. Mol. Neurosci. 11:325. doi: 10.3389/fnmol.2018.00325
Sirp, A., Shubina, A., Tuvikene, J., Tamberg, L., Kiir, C. S., Kranich, L., et al. (2022). Expression of alternative transcription factor 4 mRNAs and protein isoforms in the developing and adult rodent and human tissues. Front. Mol. Neurosci. 15:1033224. doi: 10.3389/fnmol.2022.1033224
Söllner, J. F., Leparc, G., Hildebrandt, T., Klein, H., Thomas, L., Stupka, E., et al. (2017). An RNA-Seq atlas of gene expression in mouse and rat normal tissues. Sci. Data 4:170185. doi: 10.1038/sdata.2017.185
Stoilov, P., Castren, E., and Stamm, S. (2002). Analysis of the human TrkB gene genomic organization reveals novel TrkB isoforms, unusual gene length, and splicing mechanism. Biochem. Biophys. Res. Commun. 290, 1054–1065. doi: 10.1006/bbrc.2001.6301
Sutter, A., Riopelle, R. J., Harris-Warrick, R. M., and Shooter, E. M. (1979). Nerve growth factor receptors. Characterization of two distinct classes of binding sites on chick embryo sensory ganglia cells. J. Biol. Chem. 254, 5972–5982. doi: 10.1016/S0021-9258(18)50507-X
Tabula Muris Consortium, Overall coordination, Logistical coordination, Organ collection and processing, Library preparation and sequencing, Computational data analysis (2018). Single-cell transcriptomics of 20 mouse organs creates a tabula Muris. Nature 562, 367–372. doi: 10.1038/s41586-018-0590-4
Tessarollo, L., and Yanpallewar, S. (2022). TrkB truncated isoform receptors as transducers and determinants of BDNF functions. Front. Neurosci. 16:847572. doi: 10.3389/fnins.2022.847572
Timmusk, T., Belluardo, N., Metsis, M., and Persson, H. (1993a). Widespread and developmentally regulated expression of Neurotrophin-4 mRNA in rat brain and peripheral tissues. Eur. J. Neurosci. 5, 605–613. doi: 10.1111/j.1460-9568.1993.tb00526.x
Timmusk, T., Belluardo, N., Persson, H., and Metsis, M. (1994a). Developmental regulation of brain-derived neurotrophic factor messenger RNAs transcribed from different promoters in the rat brain. Neuroscience 60, 287–291. doi: 10.1016/0306-4522(94)90242-9
Timmusk, T., Palm, K., Lendahl, U., and Metsis, M. (1999). Brain-derived Neurotrophic factor expression in VivoIs under the control of neuron-restrictive silencer element *. J. Biol. Chem. 274, 1078–1084. doi: 10.1016/S0021-9258(19)88378-3
Timmusk, T., Palm, K., Metsis, M., Reintam, T., Paalme, V., Saarma, M., et al. (1993b). Multiple promoters direct tissue-specific expression of the rat BDNF gene. Neuron 10, 475–489. doi: 10.1016/0896-6273(93)90335-o
Timmusk, T., Persson, H., and Metsis, M. (1994b). Analysis of transcriptional initiation and translatability of brain-derived neurotrophic factor mRNAs in the rat brain. Neurosci. Lett. 177, 27–31.
Tongiorgi, E., Righi, M., and Cattaneo, A. (1997). Activity-dependent dendritic targeting of BDNF and TrkB mRNAs in hippocampal neurons. J. Neurosci. 17, 9492–9505.
Tuvikene, J., Esvald, E.-E., Rähni, A., Uustalu, K., Zhuravskaya, A., Avarlaid, A., et al. (2021). Intronic enhancer region governs transcript-specific Bdnf expression in rodent neurons. eLife 10:e65161. doi: 10.7554/eLife.65161
Unger, T. J., Calderon, G. A., Bradley, L. C., Sena-Esteves, M., and Rios, M. (2007). Selective deletion of Bdnf in the ventromedial and dorsomedial hypothalamus of adult mice results in hyperphagic behavior and obesity. J. Neurosci. 27, 14265–14274. doi: 10.1523/JNEUROSCI.3308-07.2007
Vied, C., Ray, S., Badger, C.-D., Bundy, J. L., Arbeitman, M. N., and Nowakowski, R. S. (2016). Transcriptomic analysis of the hippocampus from six inbred strains of mice suggests a basis for sex-specific susceptibility and severity of neurological disorders. J. Comp. Neurol. 524, 2696–2710. doi: 10.1002/cne.23989
Volpicelli, F., Caiazzo, M., Greco, D., Consales, C., Leone, L., Perrone-Capano, C., et al. (2007). Bdnf gene is a downstream target of Nurr1 transcription factor in rat midbrain neurons in vitro. J. Neurochem. 102, 441–453. doi: 10.1111/j.1471-4159.2007.04494.x
Wang, C. S., Kavalali, E. T., and Monteggia, L. M. (2022). BDNF signaling in context: from synaptic regulation to psychiatric disorders. Cells 185, 62–76. doi: 10.1016/j.cell.2021.12.003
West, A. E., Pruunsild, P., and Timmusk, T. (2014). Neurotrophins: transcription and translation. Handb. Exp. Pharmacol. 220, 67–100. doi: 10.1007/978-3-642-45106-5_4
Wilson, M. D., and Odom, D. T. (2009). Evolution of transcriptional control in mammals. Curr. Opin. Genet. Dev. 19, 579–585. doi: 10.1016/j.gde.2009.10.003
Wosnitzka, E., Nan, X., Nan, J., Chacón-Fernández, P., Kussmaul, L., Schuler, M., et al. (2020). A new mouse line reporting the translation of brain-derived neurotrophic factor using green fluorescent protein. eNeuro 7:7. doi: 10.1523/ENEURO.0462-19.2019
Yan, Q., Rosenfeld, R. D., Matheson, C. R., Hawkins, N., Lopez, O. T., Bennett, L., et al. (1997). Expression of brain-derived neurotrophic factor protein in the adult rat central nervous system. Neuroscience 78, 431–448. doi: 10.1016/S0306-4522(96)00613-6
Yang, X., Brobst, D., Chan, W. S., Tse, M. C. L., Herlea-Pana, O., Ahuja, P., et al. (2019). Muscle-generated BDNF is a sexually dimorphic myokine that controls metabolic flexibility. Sci. Signal. 12:eaau1468. doi: 10.1126/scisignal.aau1468
Yang, X., Zhang, M., Xie, B., Peng, Z., Manning, J. R., Zimmerman, R., et al. (2022). Myocardial brain-derived neurotrophic factor regulates cardiac bioenergetics through the transcription factor yin Yang 1. Cardiovasc. Res. 119, 571–586. doi: 10.1093/cvr/cvac096
You, H., Chu, P., Guo, W., and Lu, B. (2020). A subpopulation of Bdnf-e1–expressing glutamatergic neurons in the lateral hypothalamus critical for thermogenesis control. Mol. Metab. 31, 109–123. doi: 10.1016/j.molmet.2019.11.013
Yu, Y., Fuscoe, J. C., Zhao, C., Guo, C., Jia, M., Qing, T., et al. (2014). A rat RNA-Seq transcriptomic BodyMap across 11 organs and 4 developmental stages. Nat. Commun. 5, 3230–3211. doi: 10.1038/ncomms4230
Zeisel, A., Hochgerner, H., Lönnerberg, P., Johnsson, A., Memic, F., van der Zwan, J., et al. (2018). Molecular architecture of the mouse nervous system. Cells 174, 999–1014.e22. doi: 10.1016/j.cell.2018.06.021
Keywords: BDNF, TrkB , p75NTR, development, evolution, RNA-Seq, Western blot
Citation: Esvald E-E, Tuvikene J, Kiir CS, Avarlaid A, Tamberg L, Sirp A, Shubina A, Cabrera-Cabrera F, Pihlak A, Koppel I, Palm K and Timmusk T (2023) Revisiting the expression of BDNF and its receptors in mammalian development. Front. Mol. Neurosci. 16:1182499. doi: 10.3389/fnmol.2023.1182499
Edited by:
Carlos B. Duarte, University of Coimbra, PortugalReviewed by:
Masami Kojima, Kanazawa Institute of Technology, JapanYves Barde, Cardiff University, United Kingdom
Copyright © 2023 Esvald, Tuvikene, Kiir, Avarlaid, Tamberg, Sirp, Shubina, Cabrera-Cabrera, Pihlak, Koppel, Palm and Timmusk. This is an open-access article distributed under the terms of the Creative Commons Attribution License (CC BY). The use, distribution or reproduction in other forums is permitted, provided the original author(s) and the copyright owner(s) are credited and that the original publication in this journal is cited, in accordance with accepted academic practice. No use, distribution or reproduction is permitted which does not comply with these terms.
*Correspondence: Tõnis Timmusk, dG9uaXMudGltbXVza0B0YWx0ZWNoLmVl
†These authors have contributed equally to this work