 Guenson Chevalier1*
 Lucas Udovin1
 Matilde Otero-Losada1†
 Sofia Bordet1,2
 Santiago Perez-Lloret3,4†
 Francisco Capani1,5
- 1Centro de Altos Estudios en Ciencias Humanas y de la Salud, Universidad Abierta Interamericana, Consejo Nacional de Investigaciones Científicas y Técnicas, Buenos Aires, Argentina
- 2Centro de Investigaciones en Psicología y Psicopedagogía, Facultad de Psicología y Psicopedagogía, Pontificia Universidad Católica Argentina, Buenos Aires, Argentina
- 3Laboratorio de Investigación en Ciencia de Datos, Vicerrectorado de Investigación e Innovación Académica, Pontificia Universidad Católica Argentina, Consejo Nacional de Investigaciones Científicas y Técnicas, Buenos Aires, Argentina
- 4Facultad de Medicina, Departamento de Fisiología, Universidad de Buenos Aires, Buenos Aires, Argentina
- 5Instituto de Ciencias Biomédicas, Facultad de Ciencias de la Salud, Universidad Autónoma de Chile, Santiago, Chile
Introduction: Metabolic syndrome (MetS) and Parkinson’s disease (PD) share common pathophysiological and molecular impairments related to high PD incidence in MetS patients. In this study, we searched for independently MetS-associated single-nucleotide polymorphism variants (SNVs) in PD patients and aimed to explain the molecular mechanism involved.
Methods: We included 423 PD patients diagnosed by positron emission tomography (PET). A logistic regression model, the chi-squared analysis, and Fisher’s exact test were applied to additive, dominant, and recessive genetic models of data obtained from the Parkinson’s Progression Marker Initiative (PPMI) database. MicroRNA Quantitative trait Loci (MirQTL) analysis and microRNA binding to 5′/3′- untranslated regions (UTR) and conding sequence (CDS) region gene prediction analysis were performed. Expression quantitative trait loci mapping (eQTL) and gene prioritization using weighted co-expression network analysis were used to evaluate the molecular mechanisms. Chromosomal loci that explain variance in expression traits are referred to as eQTLs.
Results: The SNV variant rs1803274 was associated with MetS, increased cardiovascular risk, and altered butyrylcholinesterase levels. Eleven microRNAs binding to the BuChe 3′/‘5-UTR and CDS region downregulated its expression. The rs1803274 variant was significantly enriched for neurotransmitter clearance, ghrelin secretion and deacylation, phosphatidylcholine synthesis, glycerophospholipid and lipid metabolism, and synaptic transmission. Forty-six eQTL proteins were associated with the SNV rs1803274. Thirteen of these were prioritized as potential therapeutic targets in a principal component analysis based on node degree parameters, betweenness centrality, and closeness centrality.
Conclusion and interpretation: The SNV variant rs1803274 was associated with both MetS and PD and downregulated the expression of BuChe, which is involved in ghrelin hydrolysis. This variant was associated with several MetS-related eQTLs proteins or their components.
1 Introduction
Metabolic syndrome (MetS) is characterized by the concurrence of clinical and biochemical conditions, such as high blood pressure (BP); diabetes mellitus (DM); and/or hyperglycemia, hyperinsulinemia, and insulin resistance; central obesity; and dyslipidemia (Zhang and Tian, 2014). In 2001, the National Cholesterol Education Program (NCEP) Adult Treatment Panel III (ATP III) defined MetS as the cluster of at least three of the following: abdominal circumference over 40 in in men or 35 inches in women, BP over 130/85 mm Hg, triglyceridemia over 150 mg/dL, and fasting high-density lipoprotein cholesterol level in blood (HDL-C) under 40 mg/dL in men or 50 mg/dL in women. The International Diabetes Foundation adds insulin resistance and central obesity to satisfy a positive MetS diagnosis (Grundy et al., 2005). MetS increases cardio-cerebrovascular risk, including acute myocardial infarction and stroke, and, hence, global mortality (Malik et al., 2004; Otero-Losada et al., 2023; Etchegoyen et al., 2018).
Parkinson’s disease (PD) is a neurodegenerative disorder defined by the progressive loss of dopaminergic substantia nigra pars compacta cells, neuronal alpha-synuclein deposition, oxidative stress, and mitochondrial dysfunction. Several authors have noted associations between PD and MetS from a clinical perspective. Nam et al. studied 17,163,560 individuals and found that MetS patients were at a higher risk for PD compared to those without MetS (Malik et al., 2004; Nam et al., 2018). Age also increased PD risk further in MetS patients, as among these patients, those aged over 65 years had a higher risk of PD compared to those under 65 years (Nam et al., 2018). In a 7-year follow-up study of 85,530 participants, individuals with MetS had a 1.23-fold higher PD incidence than those without MetS (Peng et al., 2021; Roh et al., 2021). A systematic review of 11 articles involving 23,586,349 individuals found that MetS increased PD risk (Nam et al., 2018; Roh et al., 2021; Souza et al., 2021). MetS was associated with the progression of bradykinesia, rigidity, and tremor by twofold (Peng et al., 2021). MetS and PD have been reported to share mitochondrial dysfunction, oxidative stress, inflammation, and hypoxia (Jha et al., 2017). In this study, we screened single-nucleotide polymorphism variants’ (SNPVs’) loci to identify those shared by MetS and PD. Transcriptomic, microRNA binding prediction, and co-expression network analysis allowed us to determine the molecular mechanisms involved.
After identifying associations between genetic variants and MetS in PD patients, we investigated the mechanisms explaining how these variants may influence molecular process dysfunction. Genetic variants alter the expression of genetic products, such as mRNA and miRNA. Expression quantitative trait locus mapping (eQTL) identified genes specifically affected by the risk allele, enabling us to study pathways and processes associated with this variant through network analysis, hub gene enrichment, and related approaches. EQTL mapping reveals how a genetic variant affects the expression of individual genes or groups of genes. Complementary enrichment analyses of these genes highlight disrupted signaling or metabolic pathways. MiR-QTL analysis also helps determine how genetic variants influence the microRNA expression. MicroRNAs exert several functions, notably post-transcriptional mRNA degradation.
2 Materials and methods
2.1 Participants
The Parkinson’s Progression Marker Initiative (PPMI) is an ongoing multi-center observational study focused on identifying biomarkers in PD patients attending 33 clinical centers around the world (Parkinson Progression Marker Initiative, 2011). The protocol received approval from the review board at each center, and all participants provided their written informed consent. The information was shared blindly with involved and uninvolved investigators. Only data from each participant’s initial visit (baseline data) was retrieved from the PPMI database. We selected 423 participants over 30 years old diagnosed with PD based on dopamine receptor deficiency by positron emission tomography (PET) analysis.
We selected 423 subjects for the study, comprising 92 cases with MetS (21.75%) and 331 controls without MetS (78.25%), according to the MetS classification criteria established by the National Cholesterol Education Program (NCEP) Adult Treatment Panel III (ATP III) and the International Diabetes Foundation. All individuals presenting at least three of the following criteria were categorized as having MetS: abdominal circumference > 40 in in men and 35 in in women, blood pressure > 130/85 mm Hg, triglyceridemia > 150 mg/dL, fasting high-density lipoprotein cholesterolemia (HDL-c) < 40 mg/dL in men and < 50 mg/dL in women, insulin resistance, and central obesity.
2.2 The PPMI (Parkinson’s Progression Markers Initiative)
The Parkinson’s Progression Marker Initiative (PPMI) is a landmark observational study aimed at identifying biomarkers of PD onset and progression to facilitate the development of new diagnostic and therapeutic approaches for PD patients. It started in 2010 as an international, longitudinal study designed to establish biomarker-defined cohorts and identify clinical, imaging, genetic, and biospecimen markers of PD progression to improve disease-modifying therapeutic trials.
At PPMI’s clinical sites across 12 countries, over 2,000 participants have contributed data and biospecimens. To date, over 4,000 volunteers, including 2,000 prodromal participants from nearly 50 international sites, have entered the study. At the baseline initial visit, all participants undergo comprehensive data collection, which includes blood extractions and other biosamples for biochemical, genomic, and transcriptomic analyses, with clinical and cognitive evaluations and imaging studies. The PPMI dataset encompasses more than a decade’s worth of longitudinal and multi-modal data from patients, healthy controls, and at-risk individuals, including imaging, clinical, cognitive, and “omics” biospecimens. For all PPMI studies, each participating center receives approval from institutional ethics committees and informed consent from all participants before study participation. Our MetS-specific research focuses on baseline (first visit) data and biospecimens.
The Foundational Data Initiative for PD (FOUNDIN-PD) and Parkinson’s Progression Markers Initiative (PPMI) have a direct and complementary relationship. FOUNDIN-PD generated a multi-layered molecular dataset in a cohort of induced pluripotent stem cell (iPSC) lines from the PPMI study differentiated into dopaminergic (DA) neurons, a major affected cell type in PD. FOUNDIN-PD used 98 induced pluripotent stem cell (iPSC) lines derived from PPMI study participants, including both people with PD and unaffected individuals. PPMI provides the clinical and demographic foundation, while FOUNDIN-PD adds the cellular and molecular mechanistic layer, creating a more complete picture for researchers studying PD progression and potential therapeutic targets.
2.3 Genomics data analysis
Blood was drawn, and whole-genome sequencing was performed using a Macrogen Inc. sequencer on whole blood-extracted DNA samples (Parkinson Progression Marker Initiative, 2011). Each DNA sample (1 μg) was fragmented with the Covaris System and prepared following the Illumina TruSeq DNA Sample preparation guide to obtain a final library of 300–400 bp (base pair) average insert size. Alleles of the 72 variants available in the PPMI database associated with an increased risk of PD were considered. (Chevalier et al., 2023; Nalls et al., 2019) We focused on SNPs with a minimum call rate of 95%, a minor allele frequency (MAF) > 1%, and Hardy–Weinberg equilibrium p-values of > 0.05.
2.4 Transcriptomics data analysis
Ninety-eight dopaminergic cell lines derived from iPSCs of subjects enrolled in the study were obtained from the PPMI database. The FOUND-PD project used them for transcriptomic analyses, including microRNA profiling. In our study, we used normalized expression data from mRNA and microRNA transcripts already available in the PPMI database.
Whole transcriptome bulk RNA sequence was extracted from iPSCs-derived dopaminergic cells from the FOUNDIN_PD project (Bressan et al., 2023). Library preparation was performed using the SMARTer stranded total RNA sample prep kit, which has the first strand as the sense strand. Libraries—100 (base pair) bp x 100 bp—were sequenced on a NovaSeq 6,000. Fastq datasets were used to quantify coding and non-coding RNA at the gene and transcript levels. GENCODE 29 (Harrow et al., 2012) was used for transcriptomic annotation and analysis. We obtained normalized mRNA counts from the PPMI database. Out of 45,755 genes obtained—messenger ribonucleic acid (mRNA) and small non-coding RNA (SncRNA)—3,749 mRNAs were selected after data transformation and a principal component analysis (PCA)-based dimensionality reduction using the PCA node on Knime V 4.7.1.
2.5 MicroRNAomics data analysis
MicroRNA pools were extracted from peripheral blood. The microRNAs were sequenced in Hudson Alpha’s genomic Lab on an Illumina NovaSeq6000. Samples were prepared for library construction using a Bioo single-molecule RNA (smRNA) library prep kit. The adapters and the four random nucleotides in the 5′ ends were removed using MiRMaster (Fehlmann et al., 2021; Fehlmann et al., 2017).
The reads were mapped against the GRCh38 reference genome using Bowtie v 1.1.12. To quantify the expression of the microRNAs, reads were mapped to MirBasev22 (Griffiths-Jones, 2006; Kozomara et al., 2019; Griffiths-Jones, 2006; Kozomara et al., 2019) precursors with Bowtie and processed with MirMaster (Fehlmann et al., 2021) to allow up to one mismatch and two nucleotide overlaps at the 5′ end and five nucleotide overlap at the 3′ end of the miRNA annotation. Data were retrieved from the PPMI platform and expressed as normalized reads per million (nRPM) for the present study.
2.6 Statistical analysis
Quantitative data were expressed as the mean ± standard deviation, while categorical data were expressed as percentage. The chi-squared and t-tests were used to assess differences in clinical and biochemical variables between patients with MetS and those without MetS. To evaluate SNPs–MetS associations, we performed the chi-squared and the Fisher Exact tests using the KNIME platform V 4.7.1. A p-value of < 0.05 was considered significant. Hardy–Weinberg equilibrium in controls and cases was evaluated using R V4-3-0. The study included 92 cases with MetS (21.75%), 331 controls without MetS (78.25%), with α = 0.05, expected OR ≥ 2, and an MAF of 0.10, rendering statistical power > 85%.
2.7 Annotation and enrichment analysis
The SNP Nexus (Oscanoa et al., 2020) application was used to perform annotations of the SNPs–MetS associations. The GRCh37/hg19 genome was considered as the reference genome. Molecular and cellular processes-based enrichment analyses were performed using the reactome from within the SNP Nexus platform. (Oscanoa et al., 2020) This analysis allowed us to spot metabolic or signaling pathways coded by genes containing SNPs–MetS associations. We considered paths as enriched when the p-value was < 0.05.
2.8 MicroRNA binding gene prediction and MirQTL analysis
We performed a prediction analysis of microRNAs bound to MetS-associated SNP-located genes using the MirWalk platform. (Sticht et al., 2018) To evaluate microRNAs’ binding capacity to mRNA genes, we chose the following MirWalk platform parameters: folding energy, seed match, accessibility, binding probability, number of pairings, binding region length, and length of the largest consecutive pairs, allowing two mismatches. To validate the prediction, we performed a mirQTL analysis using the KNIME V4.7.1 and R v 4.3.0. MirQTL allows us to evaluate the association between MetS-associated SNPs and microRNAs using a generalized linear model and an analysis of variance (ANOVA) test. Fold2Change of microRNA expression in heterozygous and homozygous genotypes for the risk allele was computed compared with homozygous for the major allele. The Benjamini and Hochberg step-up procedure was used to control for the False Discovery Rate (FDR) and adjust p-values. MirQTLs with a p-value of less than 0.05 were considered significant. Significant mirQTLs predicted as binding targets in the MirWalk platform analysis were considered microRNAs associated with MetS-related SNPs.
2.9 Expression quantitative trait loci analysis
Trans-expression quantitative trait loci (t-eQTLs) analysis using a generalized linear model and the ANOVA test were performed to evaluate the genes whose expression was associated with MetS-related SNPs. Fold2Change for gene expression in the risk allele heterozygous and homozygous genotypes was computed compared with non-risk allele homozygous genotypes. The Benjamini and Hochberg step-up procedure was used to control for FDR and adjust p-values. Trans-eQTLs with a p-value of less than 0.05 were considered significant. Only eQTLs with between-genotype expression differences were selected for further analysis (ANOVA p-values < 0.05).
2.10 EQTLs enrichment, network analysis, and prioritization
Significant eQTLs differentially expressed between genotypes (ANOVA p-value < 0.05) were used for discovering enriched functionally related gene groups and analyzing cluster redundant annotation terms in the DAVID platform (Sherman et al., 2022; Huang et al., 2009). The co-expression matrix of significant eQTL genes was used to perform a network analysis based on weighted correlation coefficients using Cytoscape. Correlation coefficients > 0.5 and < −0.5 and with an FDR of < 0.05 were considered in the network analysis. Clustering analysis was used using several clustering algorithms offered by the Cytoscape Autoannotate Plugin, such as the Markov clustering algorithm (MCL) based on stochastic flow simulation in graphs (Van Dongen, 2008) and Affinity propagation clustering (Frey and Dueck, 2007). The eQTLs were prioritized using node degrees, closeness centrality, and betweenness centrality parameters in a principal component analysis (PCA).
3 Results
3.1 Clinical characteristics of PD patients with and without MetS
MetS was associated with hypertension (p < 0.00015), hypercholesterolemia (1.41 × 10⁻⁸), and Type II Diabetes Mellitus (DM2) (p < 5.45 × 10⁻¹⁰) (Table 1). In addition, BMI (p < 1.42 × 10⁻⁹), systolic BP (p < 0.002), and triglyceridemia (p < 0.00028) values were higher in PD patients with MetS than those without MetS. Total cholesterolemia and LDL values showed no between-group differences. Regardless of sex, HDL values were lower in PD patients with MetS compared to those without MetS (p < 0.0002) (Table 1). Age at PD onset was higher in patients with MetS than those without MetS (p < 0.023) (Table 1).
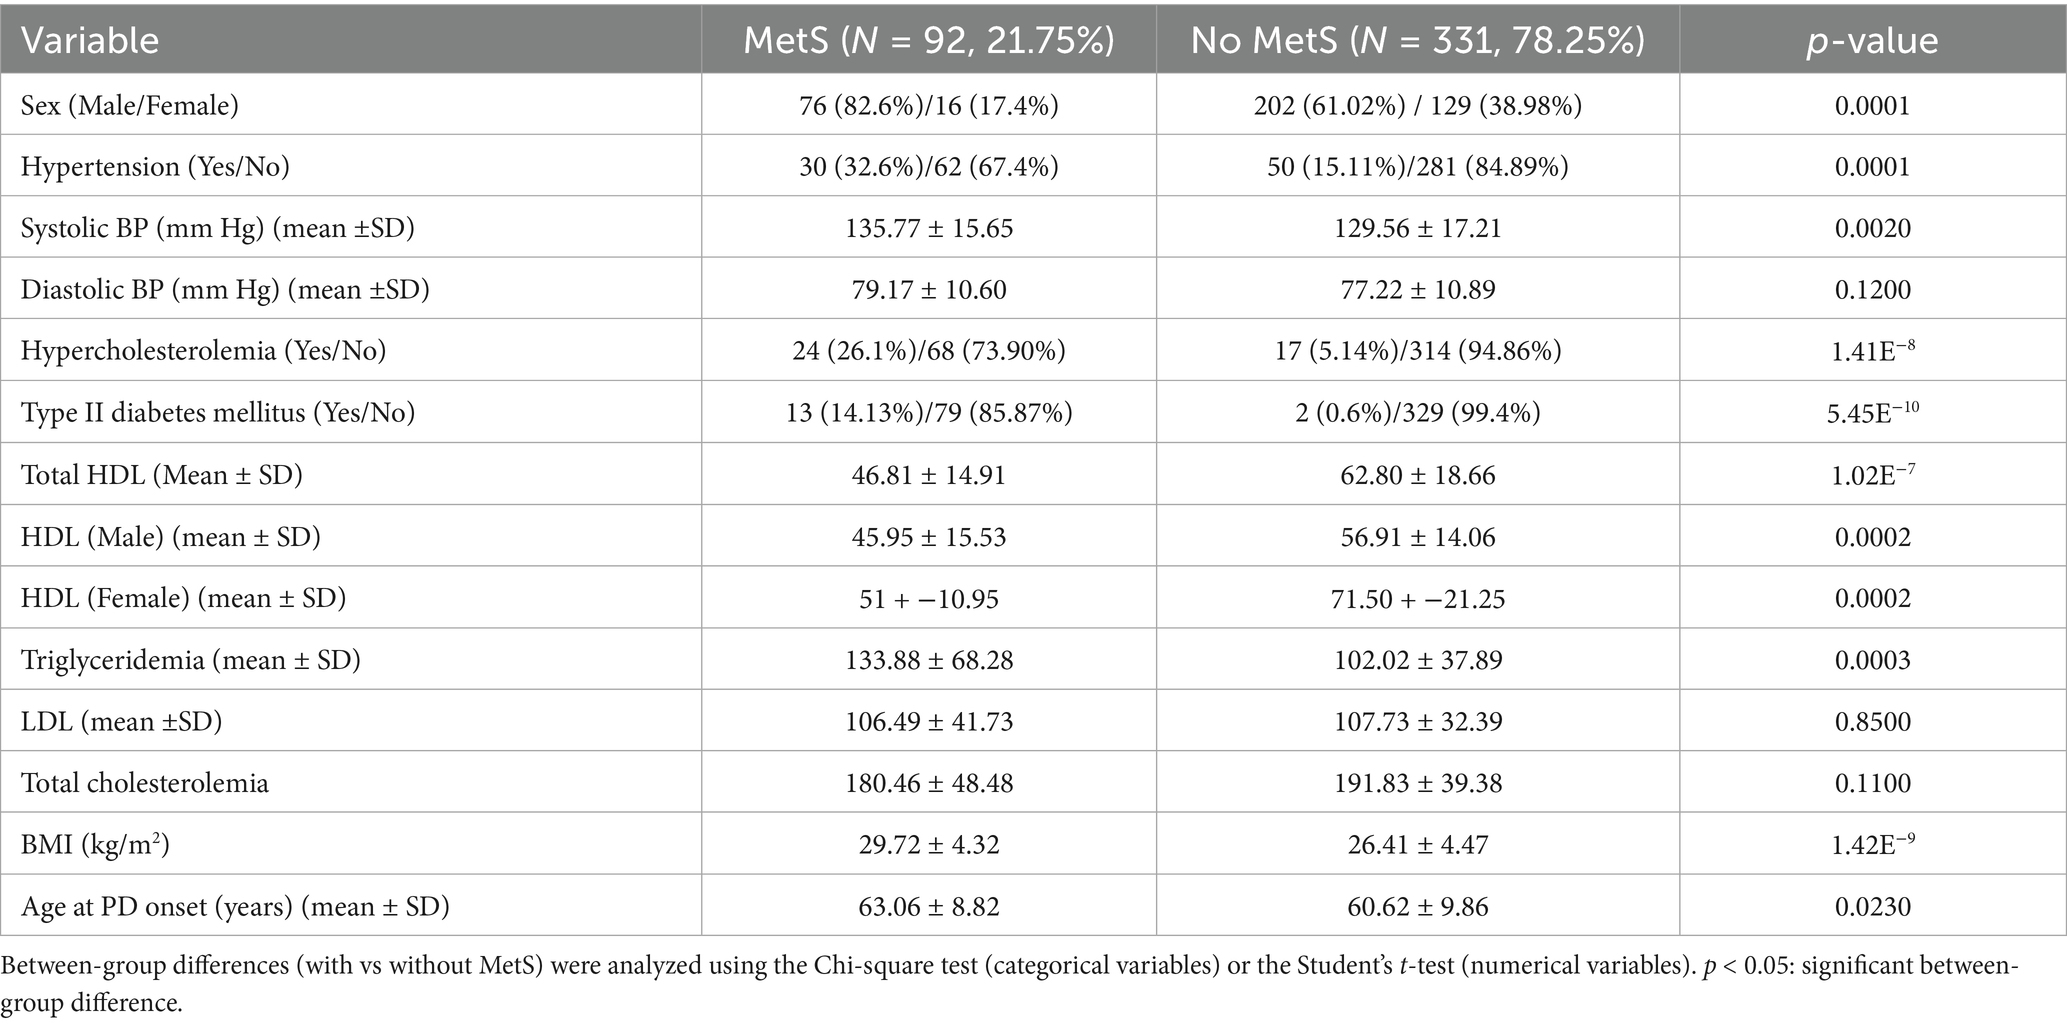
Table 1. Clinical characteristics of PD patients with and without MetS.
3.2 SNP rs1803274-MetS association revealed by genetic additive and dominant model
Only the SNP rs1803274 located in the BuCHe gene was associated with MetS (Table 2).
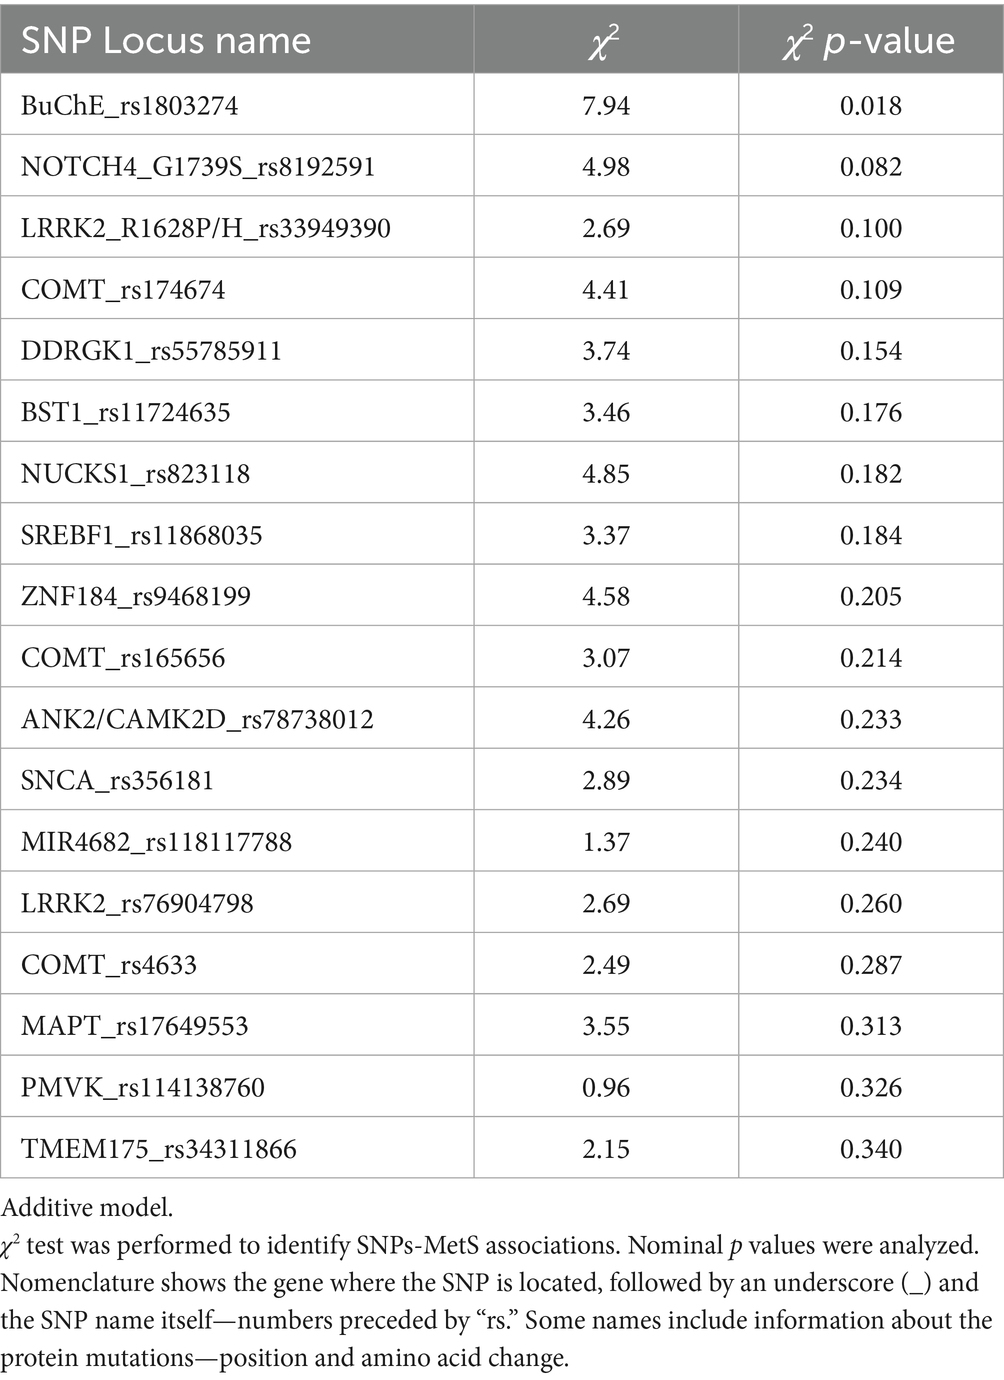
Table 2. SNPs associated with MetS by χ2 (Chi square) test analysis.
We found a significant association between MetS and SNP rs1803274 1 using the dominant genetic model (Table 3). The SNP rs1803274 BuChe was associated with MetS (p = 0.018, Chi-Square Test, additive genetic model) (Supplementary Figure 1, Table 2). SNP rs1803274-MetS association was significant using the dominant model (Table 3). Hence, the single appearance of the risk allele (minor allele) SNP rs1803274 was associated with MetS. Using the SNP nexus application, we identified significant enrichment of SNP rs1803274 for processes involved in neurotransmitter clearance, ghrelin synthesis, secretion and deacetylation, phosphatidylcholine synthesis, glycerophospholipid and lipid metabolism, and synaptic transmission (Table 4).
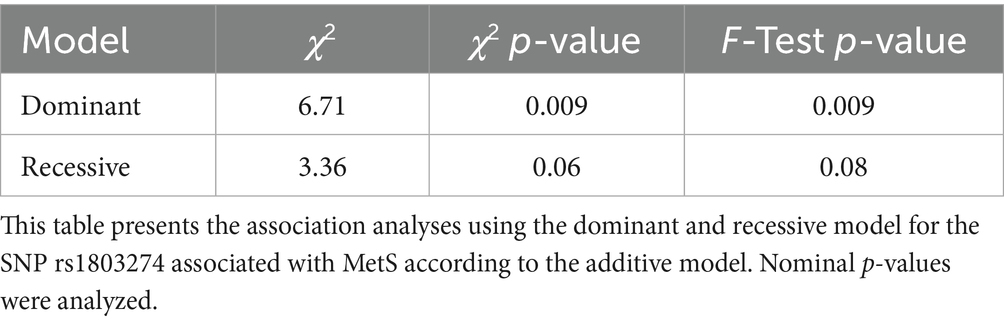
Table 3. SNPs-MetS association as by dominant and recessive model and χ2 (Chi-square) test analysis.
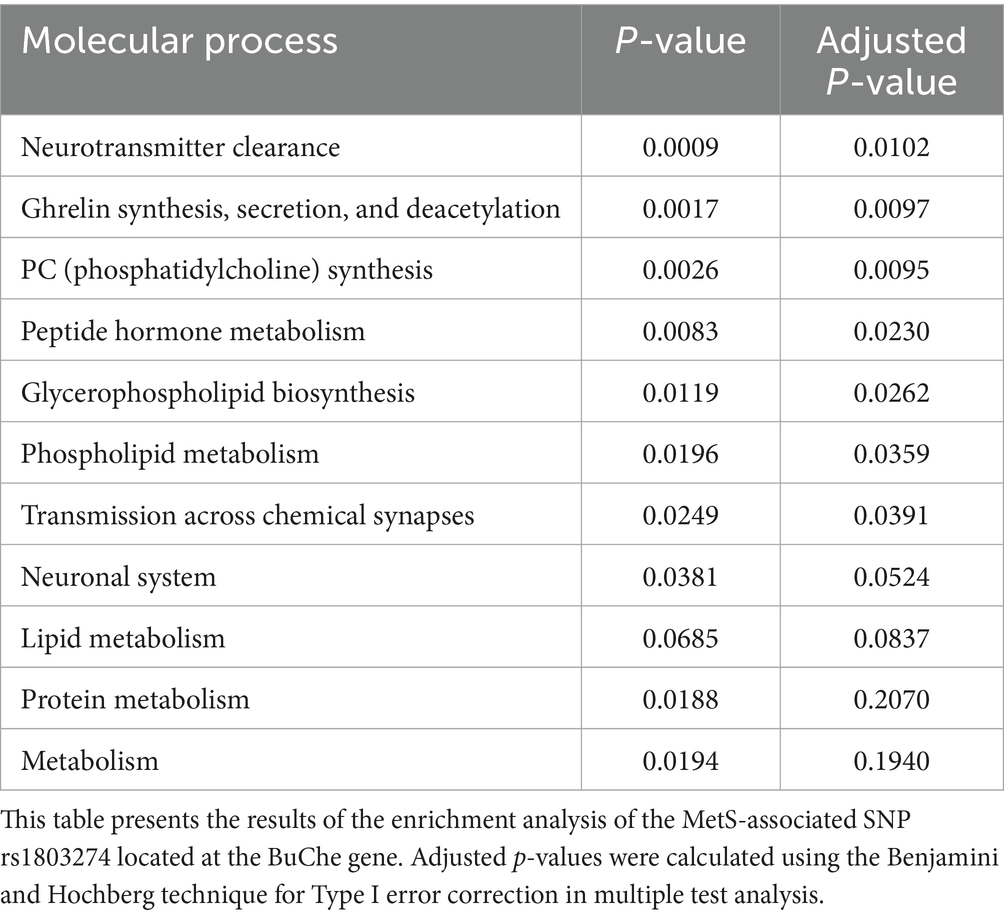
Table 4. Molecular and cellular process enrichment for MetS-associated SNP rs1803274.
3.3 Annotation and protein prediction effect of the MetS-associated SNPs rs1803274
SNP rs1803274 located on chromosome 3q26.1 had an overall MAF of 0.16 using the SNPnexus online platform. (Oscanoa et al., 2020) It is a non-synonymous SNP located in the CDS region at position 1,699 of the BuChe gene (results found in SNP nexus on 13/3/2023). There was a change of the non-polar Ala (A, alanine) to the polar Thr (T, threonine) in position 567 according to Ensembl, RefSeq, UCSC, and CCDS data (Oscanoa et al., 2020; Cunningham et al., 2022; Howe et al., 2021; O’Leary et al., 2016; Nassar et al., 2023; Lee et al., 2022; Pujar et al., 2018; Farrell et al., 2014). The pathogenicity of rs1803274 SNP was predicted by the SIFT (Ng and Henikoff, 2001; Ng and Shift, 2003; Sim et al., 2012) and Polyphen (Adzhubei et al., 2010) applications as benign and tolerable. In both the control group and the cases, the SNP rs1803274 was in Hardy–Weinberg equilibrium (χ2 p values 0.62 and 0.17, respectively).
3.4 MirQTL analysis on the association between microRNAs and the BuChe gene expression in iPSCs-derived dopaminergic cells
We performed a generalized linear model-based MirQTL analysis to study the association between normalized BuChe gene counts obtained from dopaminergic cell-derived iPSCs and normalized microRNA counts from blood cells. Data of normalized BuChe gene counts from iPSC-derived dopaminergic cells and normalized counts of microRNAs from patients’ peripheral blood cells were obtained from the PPMI database. In a workflow on the KNIME platform, we ran iterative loops on the data. In each loop, microRNA data were entered, and the workflow proceeded, merging them into a table with the BuChe gene data to be normalized using the same scale. After connecting to an R server within the KNIME platform, the generalized linear model was used. Every microRNA underwent the same procedure. Out of 43 microRNAs identified as significantly associated with the BuChe gene, 11 microRNAs showed a negative effect size (downregulation) on BuChe gene expression (Supplementary Table 5).
3.5 Prediction of microRNAs binding to BuChe-mRNA
To address whether some microRNAs might bind the 3′/5’-UTR and CDS region of the BuChe mRNA transcript for destruction and/or translation inhibition—thus contributing to BuChe expression deficit in patients bearing the SNP rs1803274-BuChe risk allele—we performed an in-silico binding prediction analysis between the microRNAs and the BuChe gene. We used the online miRWalk platform (www.mirwalk.umm.uni.heidelberg.de) that searches for microRNA binding within the entire mRNA sequence (5’-UTR, 3’-UTR, CDS) using data from TarPmiR, a microRNA target site prediction tool. (Ding et al., 2016) Out of 1,617 microRNAs interacting with the BuChe gene, 28 microRNAs matched those identified using the generalized linear model. Twenty-four of them were bound to the CDS region of the gene, 3 to the 5’-UTR, and 1 to the 3’-UTR region (Supplementary Table 6).
3.6 EQTL analysis identified 70 genes whose expression was influenced by MetS-related SNP rs1803274 genotypes
Dimensionality reduction analysis resulted in 3,749 mRNAs. In the generalized linear model, including SNPs genotype and normalized count BuChe gene data, we found 116 eQTLs associated with the SNPs rs1803274 (p < 0.05), but none were found after α correction due to multiple test effects. The BuChe gene was not associated with the SNP variant rs1803274 in the regression model (β = −0.12, p = 0.49). No difference in the BuChe gene expression was found between SNP rs1803274 genotypes (ANOVA, p = 0.76). The 116 eQTLs were used in an ANOVA analysis to study their expression according to the genotypes of the rs1803274-buChe SNP variant. We identified 70 eQTLs with significantly altered expression according to the risk heterozygous and homozygous genotype alleles compared with the non-risk homozygous genotype alleles (See Figure 1).
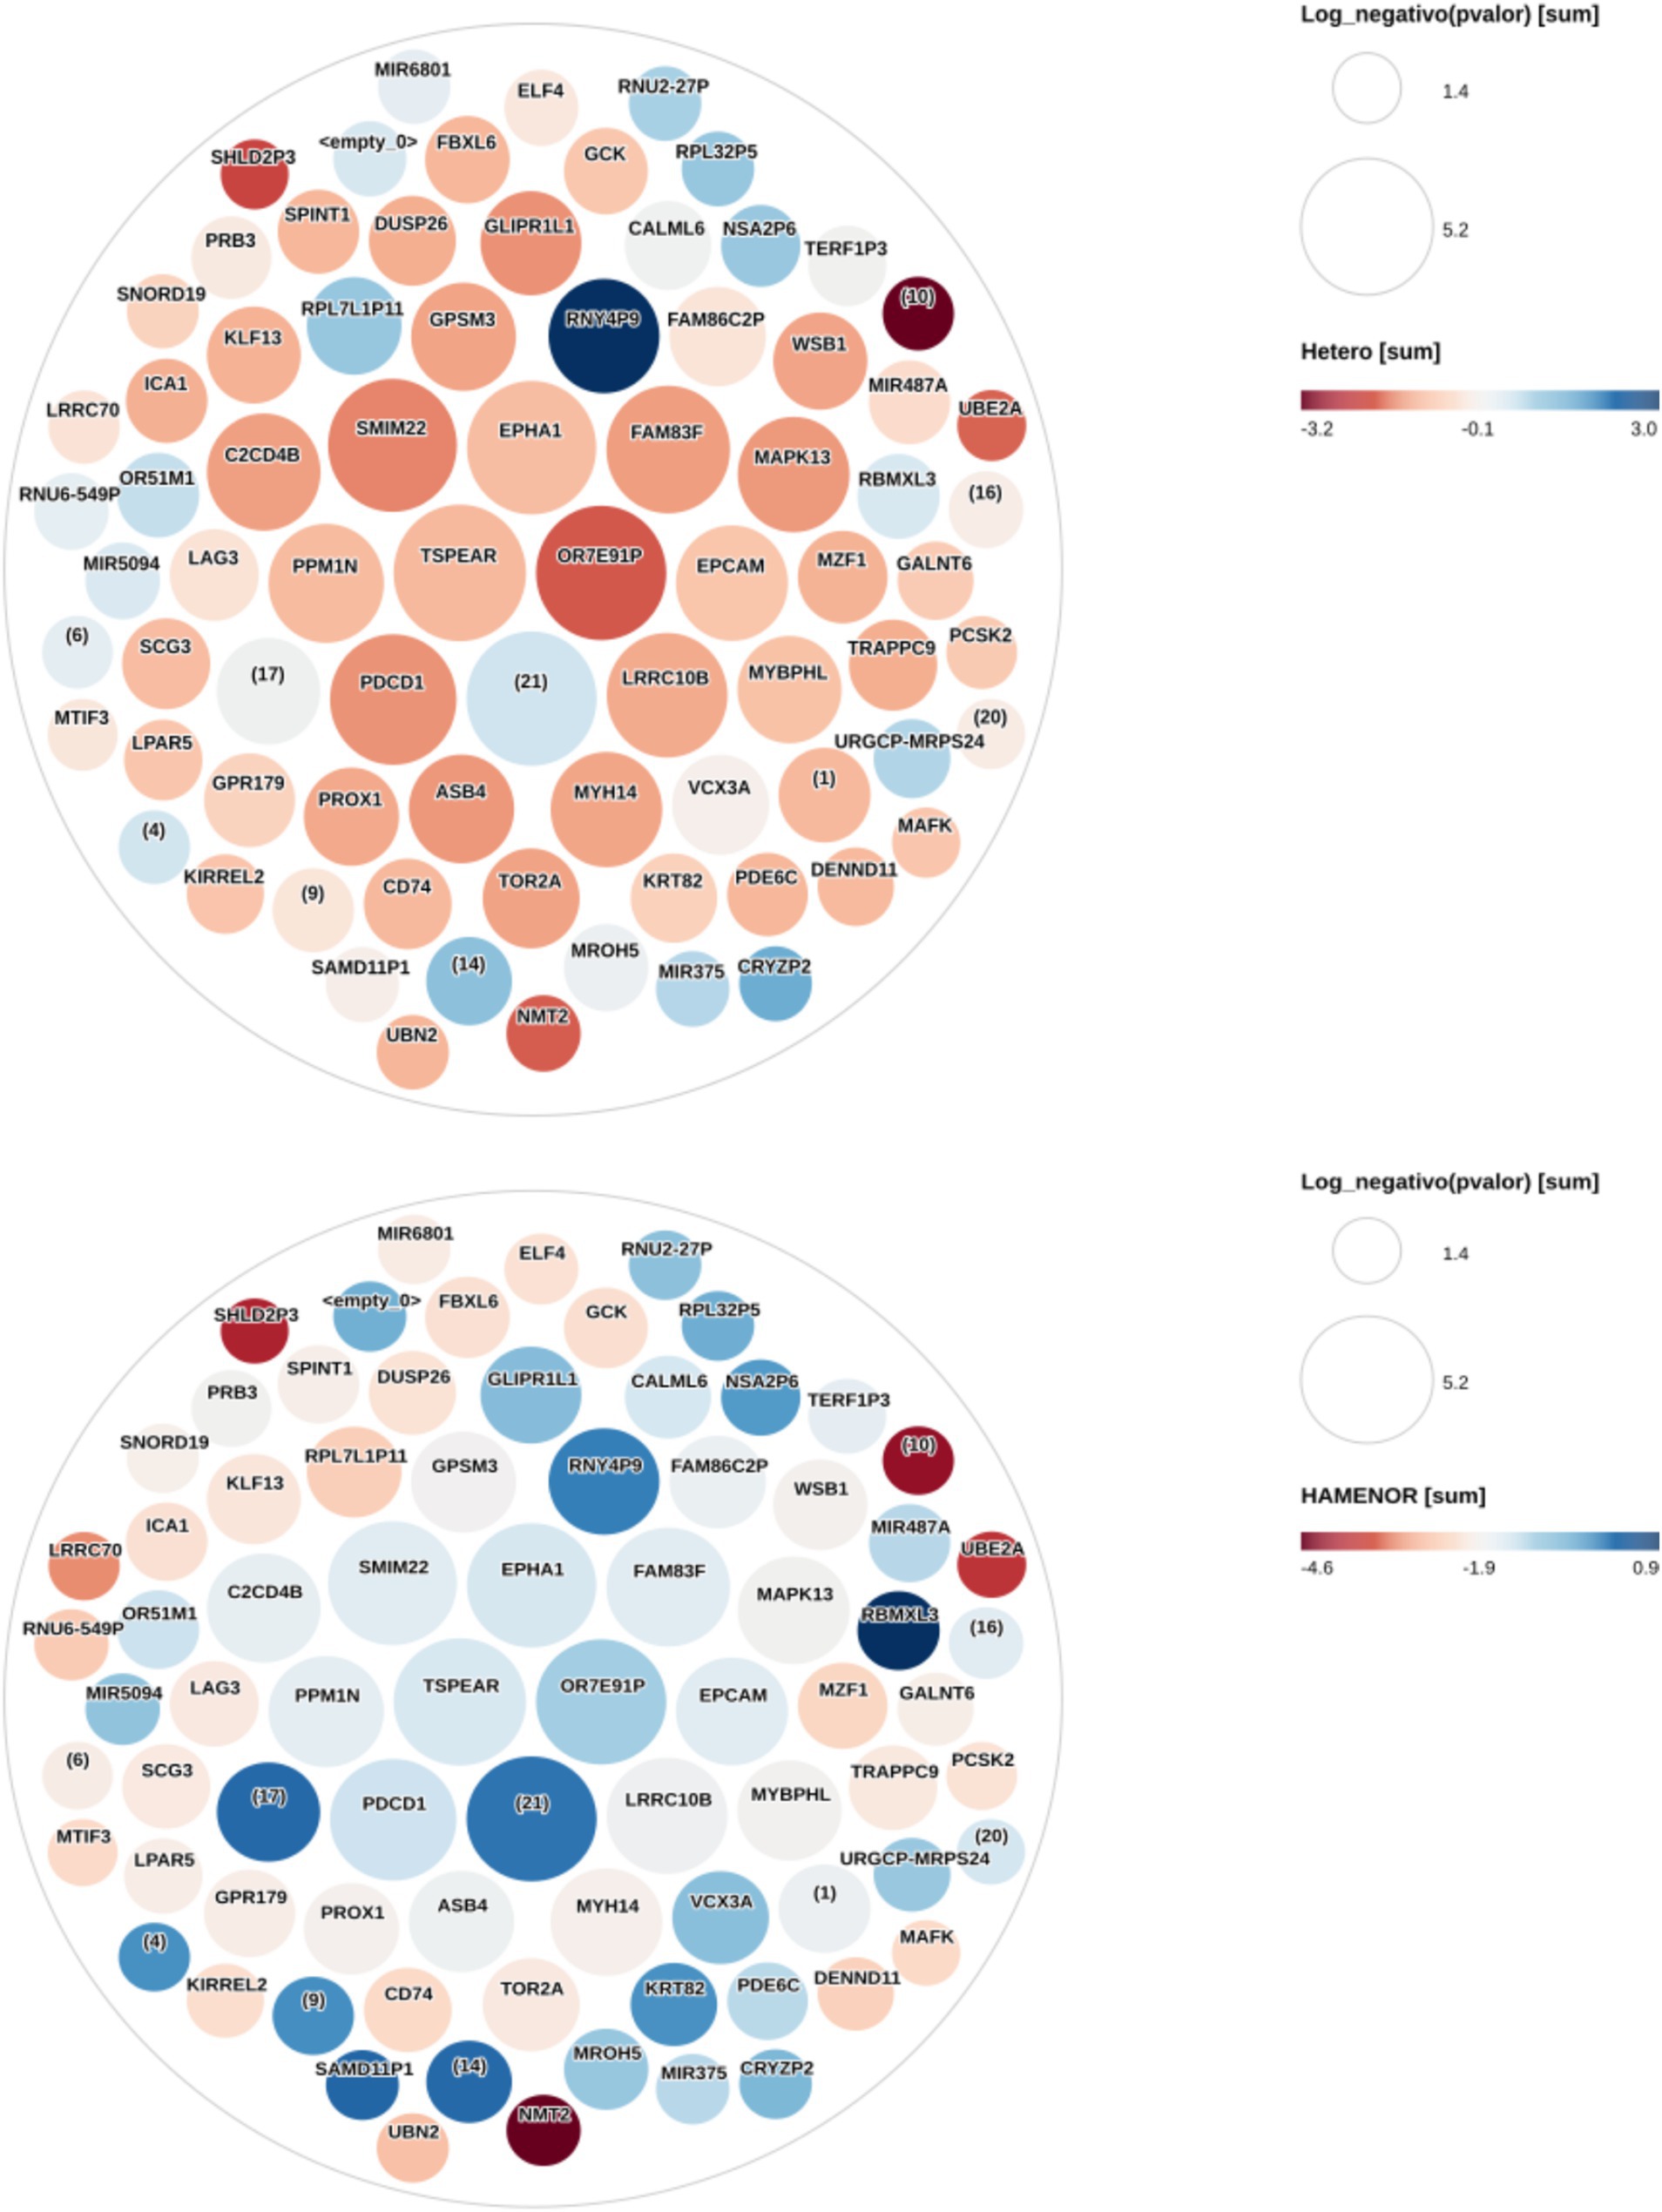
Figure 1. Heterozygous and homozygous risk allele effect on the eQTLs expression changes. This figure shows eQTLs expression changes (Log2 fold change) in heterozygous and homozygous forms for the risk allele compared with the non-risk homozygous allele. The circles represent the eQTLs. Circle size is proportional to the negative Log10 p-values. The larger the circle, the lower its p-value (<0.05), and the higher the signal. All eQTLs presented in this figure have a p value < 0.05 and an FDR ≤ 0.061. The colors represent the Log2 fold change in gene expression in the heterozygous and homozygous risk allele compared with the non-risk homozygous allele. The Log2 fold change ranges from red to blue with shades in between. Dark red represents decreased eQTL expression in the heterozygous risk allele, and dark blue represents increased eQTL expression in the homozygous risk allele. The HGNC gene symbol is shown in each circle (eQTL) center. Some circles identified by numbers in parentheses have not been mapped to any genes during the annotation analysis and are new genes yet not studied. Genes in the center of the heterozygous figure with higher signal—larger circles—are in intense red, while they are bluish or dark blue in the homozygous figure. eQTLs OR7E91P, TSPEAR, FAM83F, EPHA1, GPSM3, SMIM22, C2CD4B, PPM1N, GLIPR1L1, FAM82C2P, WSB1, MIR487A, MAPK13, EPCAM, PDCD1, LRRC10B, MYBPHL, PROX1, ASB4, PDE6C, KRT82, and SAMD11P1 have lower Log2 fold change in heterozygous (lower expression) than homozygous risk allele. MIR6801, RPL7L1P11, and RNUG-549P have lower expression in heterozygotes. No major differences were noted in RNU2-27P, RPL32P5, NSA2P6, TERF1P3, UBE2A, OR51M1, URGCP-MRPS24, CRYZP2, NIR375, MROH5 genes expression between heterozygous and homozygous risk alleles.
3.7 Enrichment analysis by the DAVID platform revealed 27 eQTLs known associated with MetS
The 70 identified eQTLs (see above) were entered into the DAVID database for functional annotation and enrichment analysis, out of which 68 were mapped. There were 11 genes with missing information for annotation in the Ensembl platform. A 47-eQTLs cluster with an enrichment score of 15.71 (p = 3.5 × 10⁻²⁴, FDR = 1.3 × 10⁻²⁰) was computed. Twenty-one (44.68%) eQTLs from the cluster have already been identified in other studies (Supplementary Table 7) as associated with MetS or its components—DM, hypertension, obesity, and insulin resistance—(Supplementary Table 7). The other 26 eQTLs from the cluster—DENND11, FBXL6, GLIPR1L1, EPCAM, FAM83F, FAM86C2P, LRRC70, LPAR5, MROH5, MYBPHL, OR51M1, OR7E91P, GALNT6, PPM1N, SPINT1, SMIM22, TSPEAR, UBN2, UBE2A, VCX3A, PRB3, ELF4, MAFK, TORA2, CALML6, and MZF1—would be novel eQTLs associated with MetS in PD patients. Figure 2 shows how eQTL expression changes in both heterozygous and homozygous risk alleles taking as reference the non-risk homozygous allele.
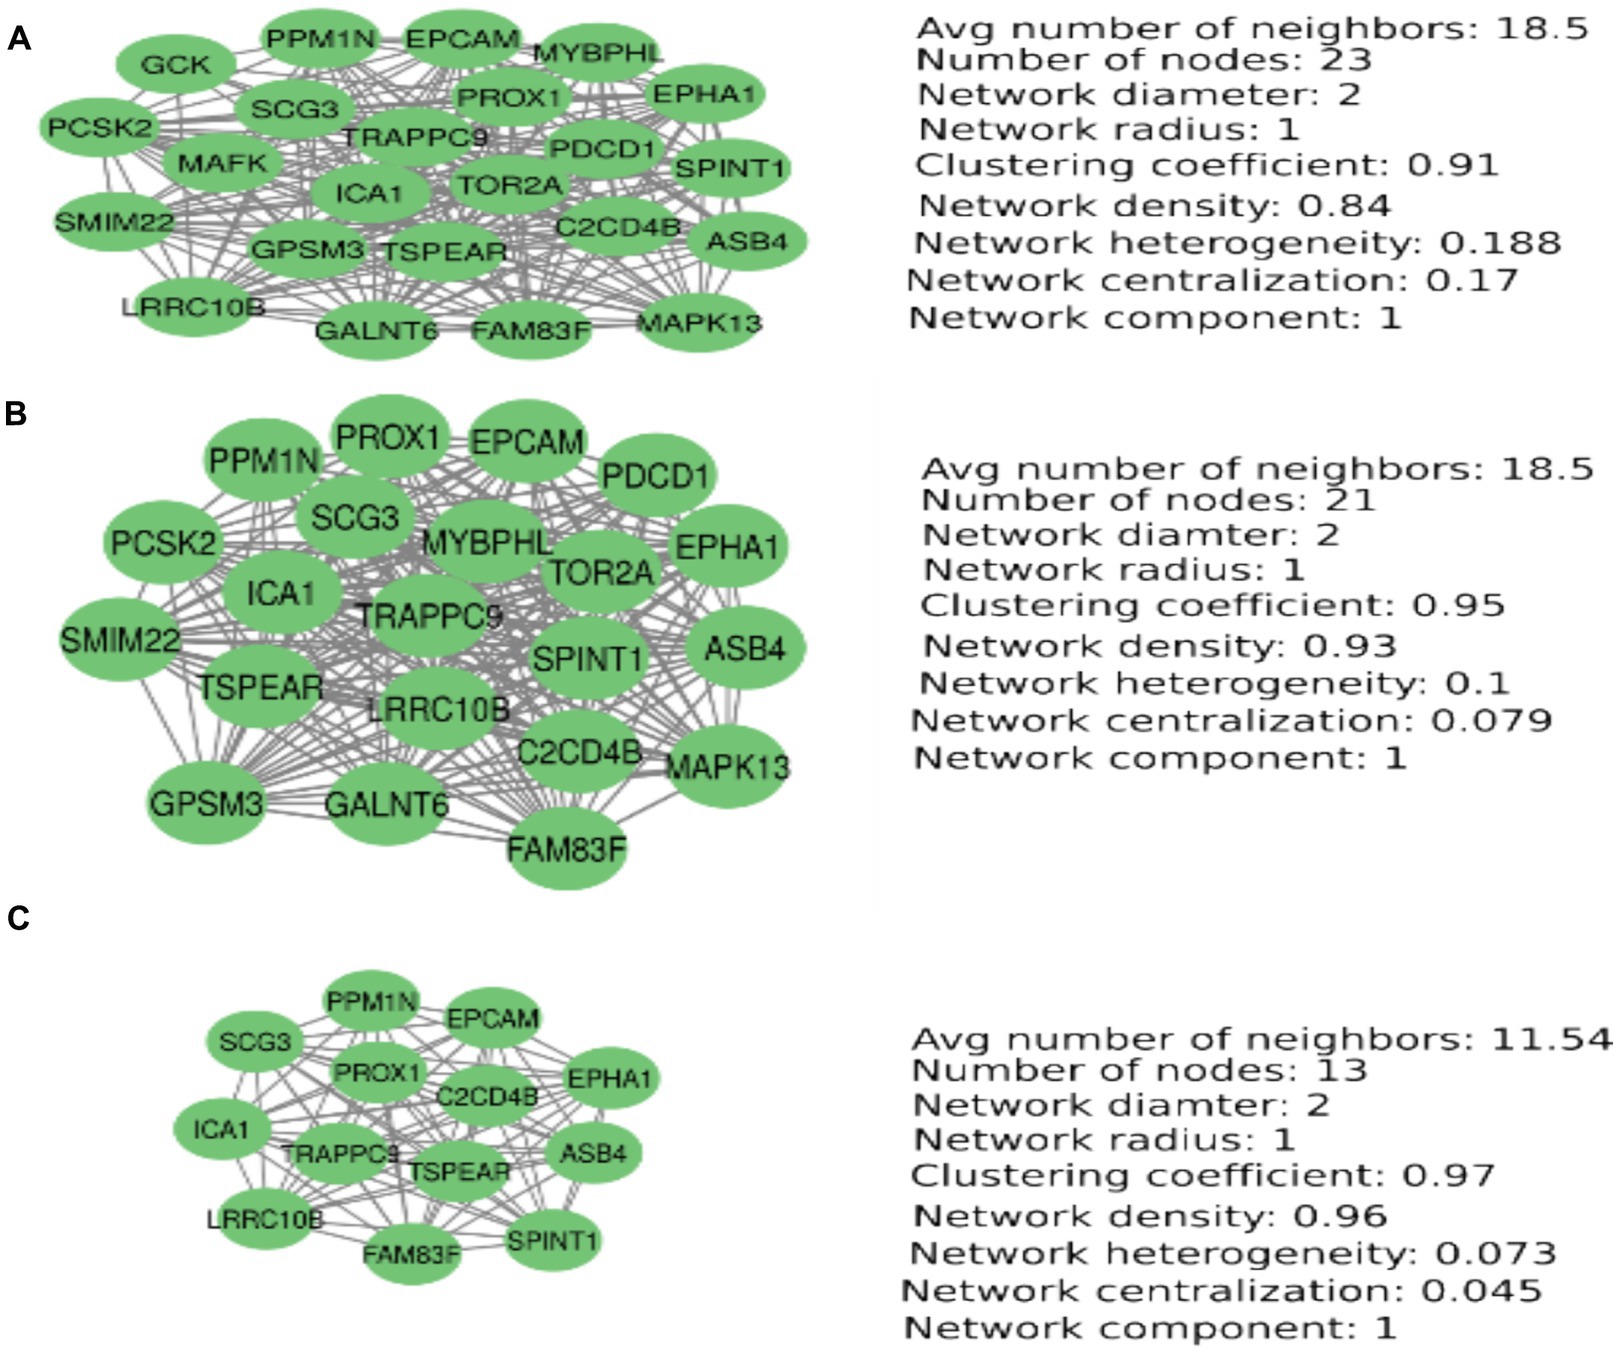
Figure 2. PCA-based MetS-associated eQTLs prioritization. Node degrees, betweenness, and closeness centrality to prioritize the most important eQTLs associated with MetS-related SNP rs1803274. This figure shows the prioritization of the most important nodes according to the parameters nodesdegrees, betweenness centrality, and closeness centrality. A principal component analysis was computed using these parameters in each case. (A) Nodes degree-based PCA. (B) Closeness centrality-based PCA. (C) Betweenness centrality-based PCA.
3.8 Weighted correlation-based eQTLs related to MetS network analysis
The 116 eQTLs were used to perform a weighted-correlation network analysis with 46 significant nodes (FDR < 0.05, correlation coefficient > 0.5, and <−0.5). The network had 46 nodes, 308 interactions (edges), network diameter 5, clustering coefficient = 0.66, network density = 0.33, network heterogeneity = 0.65, and two connected components. We found four eQTLs (genes) with the highest importance: SCG3 (Hub scores = 1, authority score = 1, node degree = 29), ICA1 (Hub score = 0.98, authority score = 0.98, node degree = 27), EPHA1 (Hub score = 0.97, authority = 0.97, node degree = 27), and MAPK13 (Hub Score = 0.96, authority score = 0.96, node degree = 26). We obtained three clusters using the community cluster algorithm (CCA) of the Cytoscape Autoannotate plugin (Supplementary Figure 2). Signaling pathways and molecular processes for which these clusters were enriched are shown in Supplementary Tables 8–10. Supplementary Tables 11–13 show eQTLs expression according to SNP rs1803274 genotype.
3.9 Prioritization of the most important eQTLs
We have used node degree, closeness centrality, and betweenness centrality metrics to find the most important nodes in the network. The set of most important nodes was obtained from a principal component analysis for each metric (Figure 1). The principal component containing the most important nodes for the case in which the betweenness centrality metric was used contains 13 nodes. These nodes are also found when using the nodes’ degree and closeness centrality parameters. These 13 nodes are important because of their capacity to establish fast communications with other nodes in the network and the high number of connections they establish with other nodes. These nodes are strongly interconnected with high network coefficients ranging from 0.91 to 0.97(Figure 1).
4 Discussion
4.1 Several MicroRNAs bind to the BuChe gene and downregulate its expression
We found an association between SNP rs1803274-BuChe—located in the CDS region of the BuChe gene at position 1,699—and MetS in PD patients, evidenced by both additive and dominant genetic models. SNP rs1803274 risk allele was associated with decreased BuChe gene expression. MetS and obesity have been found to be associated with decreased BuChe gene expression in other studies (Li et al., 2008). EQTL analysis did not show a significant decrease in BuChE gene expression. Yet, prior studies suggested this variant reduced BuChE protein levels. MiRNA-mediated regulation may explain this discrepancy. Certain microRNAs may target and degrade BuChE transcripts, lowering protein expression. To test this hypothesis, we performed a miR-QTL analysis to identify microRNAs associated with the variant, followed by binding prediction analyses to assess whether these microRNAs could interact with the BuChE gene.
Our findings suggest that BuChe gene downregulation might result from some microRNAs binding to BuChe transcript mRNA to inhibit its translation or promote its degradation. This idea is supported by the present identification of 11 microRNAs—related to BuChe gene downregulation—that bind to the 3′/5’-UTR and CDS BuChe gene based on an in silico prediction analysis.
4.2 Downregulated BuChe is associated with upregulated acyl-ghrelin and MetS in PD patients
We identified the SNP rs1803274 variant enriches for chemical synaptic transmission, neurotransmitter clearance processes, phosphatidylcholine synthesis, glycerophospholipids, and phospholipid synthesis. BuChe expression alteration is linked to impairment in these molecular processes. The SNP rs1803274 variant also enriches for ghrelin synthesis, secretion, and deacylation. As ghrelin is a substrate for BuChe activity, rendering unacylated ghrelin, BuChe gene downregulation would lead to an increase in the acyl-to-unacylated ghrelin ratio. Ghrelin hormone is involved in hunger and satiety regulation (Nakazato et al., 2001). In rats, acyl-ghrelin IV injection increased hunger and body weight, while anti-ghrelin G antibodies produced the opposite effects (Nakazato et al., 2001). Acylated and unacylated ghrelin are associated with increased or decreased neurogenesis in the hippocampus, respectively (Hornsby et al., 2020). Acyl-ghrelin upregulated the neurogenic brain-derived neurotrophic factor (BDNF) in a promoter, age-dependent manner (Bayliss et al., 2016; Sassi et al., 2022).
4.3 Rs1803274-BuChe-based EQTLs and weighted co-expression network-based clustering analysis revealed gene clusters associated with metabolic syndrome and its components
We performed an eQTL analysis of the genes of iPSC-derived dopaminergic cells from PD patients. Out of 116 genes associated with SNP rs1803274, 70 eQTL were expressed depending on genotype. Only PD patients with heterozygous and homozygous genotypes for SNP rs1803274 minor allele were found at MetS risk. The DAVID enrichment analysis application computed a cluster of 47 genes—70 eQTLs entered—44.68% of which were already recognized as associated with MetS components.
A cluster analysis of a weighted co-expression network resulted in three clusters: the first enriched for processes associated with growth cone collapse and neurite outgrowth, and the second enriched for antigen degradation and presentation to T lymphocytes. CD74 presence in our data might cause cross-presentation of antigens by MHC I and participate in autoimmune DM in these patients, given the presence of autoantigen ICA1—linked to autoimmune DM—in our data.
SCG3 protein is involved in granular regulation and biogenesis in neurons and pancreatic cells. The alteration in the SCG3 gene activity or expression might affect proinsulin sorting and proteolytic processing of prohormones in pancreatic beta cells, decreasing insulinemia, and increasing DM risk. The intracellular increase in protein content might trigger cell survival or apoptotic mechanisms involving the p38/MAPK pathway, signaling to MST1, RAS, ERKs, or NOD 1/2 pathways, as found in the enrichment analysis of the third cluster.
The eQTL ubiquitin-conjugating enzyme 2A (UBE2A) was downregulated by SNP rs1803274-BuChe in the previous analysis of this study (Supplementary Table 13). This protein accepts polyubiquitin from the E1 complex at position lysine 48 and catalyzes its covalent attachment to other proteins for subsequent degradation (David et al., 2010) by the 26S proteasome complex.
There are other forms of mono-ubiquitination of different lysine residues of the target protein involving UBE2A and the 26S proteasome complex for the cellular processes of endocytosis and sorting of proteins to different cellular compartments (Hicke and Dunn, 2003).
Downregulation of UBE2A expression could affect protein degradation processes and subsequent cellular processes, such as endocytosis and sorting proteins. Downregulation of UBE2A has been associated with brain amyloid plaque accumulation in Alzheimer’s disease patients (Zhao et al., 2016). Several proteins of the proteasome system, including PARK2, ubiquitin-conjugating enzyme HIP2, and UBE2L3, are associated with PD (Su et al., 2018; Shimura et al., 2000; Zhang et al., 2022).
A mutation in the UBE2A gene was found to impair neuronal function and alter parkin gene-dependent mitophagy (Zhang et al., 2022; Haddad et al., 2013). In addition, the ubiquitin-conjugating enzyme UB2O, related to UBE2A, promotes insulin resistance and obesity in MetS animal models (Vila et al., 2019). We suggest that an SNP rs1803274-BuChe-dependent decrease in UBE2A gene expression might increase the risk of both MetS and PD.
Presently, eQTL VPS26A was downregulated by SNP rs1803274 in a regression model. VPS26A is a component of the retromer cargo-selective complex (CSC) (Priya et al., 2015).
The CSC is believed to prevent the mis-sorting of selective transmembrane cargo proteins into the lysosomal degradation pathway. Three mutations in the VPS26A protein (p. K93E, p. M112V, and p. K297X) were associated with atypical Parkinsonism (Vila et al., 2019; McMillan et al., 2016) by affecting the interaction between VPS26A and the SNX27 cargo adaptor (Gustavsson et al., 2015). Variants in the VPS26A(rs1802295) gene are associated with DM2 (Shabana et al., 2016).
In this study, DENND10—another eQTL—was downregulated by the SNP rs1803274. It is a guanine nucleotide exchange factor (GEF) that regulates the homeostasis of the endocytic pathway, including endosomal positioning, maturation, and secretion, likely activating Rab proteins like RAB27A and RAB27B. It promotes guanosine diphosphate (GDP) to guanosine triphosphate (GTP) change, converting inactive GDP-bound RAB27A and RAB27B into their active GTP-bound form. (Priya et al., 2015; Zhang et al., 2019)
5 Conclusion
This study found BuChe-located SNP rs1803274’s association with MetS. The BuChe gene was reported to be downregulated by the SNP rs1803274 by other authors. We have identified 28 microRNAs that bind to the BuChe mRNA in both 3′, 5’-UTR and CDS gene regions. Of these, 11 downregulated the BuChe gene expression. BuChe gene downregulation is associated with increased acyl-ghrelin expression. Ghrelin increases hunger and MetS risk and promotes neurogenesis depending on the BDNF level. We identified 116 eQTLs associated with SNP rs1803274, of which 70 have expressions influenced by SNP genotypes. The DAVID application computed a cluster of 47 eQTLs, 21 of which were already known as associated with MetS or its components. The major eQTLs prioritized in our analysis were ICA1, SCG3, EPHA1, PPM1N, EPCAM, ASB4, SPINT1, FAM83F, LRRC10B, PROX1, TRAPPC9, TSPEAR, and C2CD4B. These eQTLs were found as the best node degrees, the best betweenness centrality, and the best closeness centrality, forming a network cluster in a PCA analysis. Of them, SCG3, ICA1, and EPHA1 were the Hub eQTLs selected.
Data availability statement
Publicly available datasets were analyzed in this study. This data can be found at: https://www.ppmi-info.org/access-data-specimens/download-data.
Ethics statement
The studies involving humans were approved by the Dra Adelina Loiano, presidenta del comite de etica. Universidad Abierta Interamericana (UAI). The studies were conducted in accordance with the local legislation and institutional requirements. The participants provided their written informed consent to participate in this study.
Author contributions
GC: Validation, Resources, Conceptualization, Writing – review & editing, Project administration, Formal analysis, Writing – original draft, Software, Methodology, Data curation, Investigation, Visualization. LU: Software, Visualization, Formal analysis, Data curation, Writing – original draft, Methodology, Conceptualization, Investigation, Writing – review & editing. MO-L: Methodology, Supervision, Writing – review & editing, Conceptualization, Resources, Project administration, Visualization, Validation, Formal analysis. SB: Methodology, Writing – original draft, Formal analysis, Software, Data curation, Writing – review & editing, Conceptualization, Investigation. SP-L: Funding acquisition, Resources, Project administration, Supervision, Methodology, Data curation, Writing – review & editing, Validation, Conceptualization. FC: Conceptualization, Funding acquisition, Resources, Project administration, Supervision, Methodology, Data curation, Writing - review & editing, Validation.
Funding
The author(s) declare that financial support was received for the research and/or publication of this article. Funding was received from the Universidad Abierta Interamericana (UAI) for the publication of this article.
Acknowledgments
PPMI—a public-private partnership—is funded by Michael J. Fox Foundation for Parkinson’s Research funding partners 4D Pharma, Abbvie, Acurex Therapeutics, Allergan, Amathus Therapeutics, ASAP, Avid Radiopharmaceuticals, Bial Biotech, Biogen, BioLegend, Bristol-Myers Squibb, Calico, Celgene, Dacapo Brain Science, Denali, The Edmond J. Safra Foundation, GE Healthcare, Genentech, GlaxoSmithKline, Golub Capital, Handl Therapeutics, Insitro, Janssen Neuroscience, Lilly, Lundbeck, Merck, Meso Scale Discovery, Neurocrine Biosciences, Pfizer, Piramal, Prevail, Roche, Sanofi Genzyme, Servier, Takeda, Teva, UCB, Verily, and Voyager Therapeutics.
Conflict of interest
The authors declare that the research was conducted in the absence of any commercial or financial relationships that could be construed as a potential conflict of interest.
The author(s) declared that they were an editorial board member of Frontiers, at the time of submission. This had no impact on the peer review process and the final decision.
Generative AI statement
The authors declare that no Gen AI was used in the creation of this manuscript.
Any alternative text (alt text) provided alongside figures in this article has been generated by Frontiers with the support of artificial intelligence and reasonable efforts have been made to ensure accuracy, including review by the authors wherever possible. If you identify any issues, please contact us.
Publisher’s note
All claims expressed in this article are solely those of the authors and do not necessarily represent those of their affiliated organizations, or those of the publisher, the editors and the reviewers. Any product that may be evaluated in this article, or claim that may be made by its manufacturer, is not guaranteed or endorsed by the publisher.
Supplementary material
The Supplementary material for this article can be found online at: https://www.frontiersin.org/articles/10.3389/fnmol.2025.1635201/full#supplementary-material
Footnotes
1. ^SNP rs1803274 is associated with the butyrylcholinesterase (BuChE, Human Gene Nomenclature Committee, HGNC, symbol BCHE; EC 3.1.1.8) gene. The rs1803274(A) allele (CHE*539 T or BCHE*539 T) encodes the K variant of BuChE, reduces serum BuChE activity by 30–60%, and is often co-inherited with the SNP encoding the so-called “atypical” butyrylcholinesterase.
References
Adzhubei, I. A., Schmidt, S., Peshkin, L., Ramensky, V. E., Gerasimova, A., Bork, P., et al. (2010). A method and server for predicting damaging missense mutations. Nat. Methods 7, 248–249. doi: 10.1038/nmeth0410-248
Alsabbagh, M. M., Bakhiet, M., and Taha, S. (2023). Upregulation of REL and WSB1 in patients with psoriasis and metabolic syndrome. Int J Dermatol Venereol.
Barkalifa, R., Yagil, Y., and Yagil, C. (2010). Sex-specific genetic dissection of diabetes in a rodent model identifies Ica1 and Ndufa4 as major candidate genes. Physiol. Genomics 42, 445–455. doi: 10.1152/physiolgenomics.00042.2010
Bayliss, J. A., Lemus, M. B., Stark, R., Santos, V. V., Thompson, A., Rees, D. J., et al. (2016). Ghrelin-AMPK Signaling mediates the neuroprotective effects of calorie restriction in Parkinson’s disease. J. Neurosci. 36, 3049–3063. doi: 10.1523/JNEUROSCI.4373-15.2016
Bressan, E., Reed, X., Bansal, V., Hutchins, E., Cobb, M. M., Webb, M. G., et al. (2023). The foundational data initiative for Parkinson disease: enabling efficient translation from genetic maps to mechanism. Cell Genom. 3:100261. doi: 10.1016/j.xgen.2023.100261
Butt, A., Ahmad, M. S., Powrie, J., and Swaminathan, R. (2012). Assessment of diabetic retinopathy by measuring retina-specific mRNA in blood. Expert. Opin. Biol. Ther. 12, S79–S84. doi: 10.1517/14712598.2012.688947
Chang, T. J., Chiu, Y. F., Sheu, W. H. H., Shih, K. C., Hwu, C. M., Quertermous, T., et al. (2015). Genetic polymorphisms of PCSK2 are associated with glucose homeostasis and progression to type 2 diabetes in a Chinese population. Sci. Rep. 5:14380. doi: 10.1038/srep14380
Chen, L., Yin, Z., Qin, X., Zhu, X., Chen, X., Ding, G., et al. (2022). CD74 ablation rescues type 2 diabetes mellitus-induced cardiac remodeling and contractile dysfunction through pyroptosis-evoked regulation of ferroptosis. Pharmacol. Res. 176:106086. doi: 10.1016/j.phrs.2022.106086
Chevalier, G., Udovin, L., Otero-Losada, M., Bordet, S., Capani, F., Luo, S., et al. (2023). Genetics of neurogenic orthostatic hypotension in Parkinson’s disease, results from a cross-sectional in silico study. Brain Sci. 13:506. doi: 10.3390/brainsci13030506
Cuenda, A., and Nebreda, A. R. (2009). p38delta and PKD1: kinase switches for insulin secretion. Cell 136, 209–210. doi: 10.1016/j.cell.2009.01.005
Cunningham, F., Allen, J. E., Allen, J., Alvarez-Jarreta, J., Amode, M. R., Armean, I. M., et al. (2022). Ensembl 2022. Nucleic Acids Res. 50, D988–D995. doi: 10.1093/nar/gkab1049
David, Y., Ziv, T., Admon, A., and Navon, A. (2010). The E2 ubiquitin-conjugating enzymes direct polyubiquitination to preferred lysines. J. Biol. Chem. 285, 8595–8604. doi: 10.1074/jbc.M109.089003
Delpero, M., Arends, D., Freiberg, A., Brockmann, G. A., and Hesse, D. (2022). QTL-mapping in the obese Berlin fat mouse identifies additional candidate genes for obesity and fatty liver disease. Sci. Rep. 12:10471. doi: 10.1038/s41598-022-14316-5
Ding, J., Li, X., and Hu, H. (2016). TarPmiR: a new approach for microRNA target site prediction. Bioinformatics 32, 2768–2775. doi: 10.1093/bioinformatics/btw318
Dong, Z., Lei, X., Kujawa, S. A., Bolu, N., Zhao, H., and Wang, C. (2021). Identification of core gene in obese type 2 diabetes patients using bioinformatics analysis. Adipocytes 10, 310–321. doi: 10.1080/21623945.2021.1933297
Etchegoyen, M., Nobile, M. H., Baez, F., Posesorski, B., González, J., Lago, N., et al. (2018). Metabolic syndrome and neuroprotection. Front. Neurosci. 12:196.
Farrell, C. M., O’Leary, N. A., Harte, R. A., Loveland, J. E., Wilming, L. G., Wallin, C., et al. (2014). Current status and new features of the consensus coding sequence database. Nucleic Acids Res. 42, D865–D872. doi: 10.1093/nar/gkt1059
Fehlmann, T., Backes, C., Kahraman, M., Haas, J., Ludwig, N., Posch, A. E., et al. (2017). Web-based NGS data analysis using miRMaster: a large-scale meta-analysis of human miRNAs. Nucleic Acids Res. 45, 8731–8744. doi: 10.1093/nar/gkx595
Fehlmann, T., Kern, F., Laham, O., Backes, C., Solomon, J., Hirsch, P., et al. (2021). miRMaster 2.0: multi-species non-coding RNA sequencing analyses at scale. Nucleic Acids Res. 49, W397–W408. doi: 10.1093/nar/gkab268
Fendler, W., Borowiec, M., Baranowska-Jazwiecka, A., Szadkowska, A., Skala-Zamorowska, E., Deja, G., et al. (2012). Prevalence of monogenic diabetes amongst polish children after a nationwide genetic screening campaign. Diabetologia 55, 2631–2635. doi: 10.1007/s00125-012-2621-2
Frey, B. J., and Dueck, D. (2007). Clustering by passing messages between data points. Science 315, 972–976. doi: 10.1126/science.1136800
Griffiths-Jones, S. (2006). miRBase: the microRNA sequence database. Methods Mol. Biol. 342, 129–138.
Grundy, S. M., Cleeman, J. I., Daniels, S. R., Donato, K. A., Eckel, R. H., Franklin, B. A., et al. (2005). Diagnosis and management of the metabolic syndrome: an American Heart Association/National Heart, Lung, and Blood Institute scientific statement. Circulation 112, 2735–2752. doi: 10.1161/CIRCULATIONAHA.105.169404
Gu, Y., Xiao, L., Gu, W., Chen, S., Feng, Y., Wang, J., et al. (2018). Rs2227982 and rs2227981 in PDCD1 gene are functional SNPs associated with T1D risk in east Asian. Acta Diabetol. 55, 813–819. doi: 10.1007/s00592-018-1152-9
Gustavsson, E. K., Guella, I., Trinh, J., Szu-Tu, C., Rajput, A., Rajput, A. H., et al. (2015). Genetic variability of the retromer cargo recognition complex in parkinsonism. Mov. Disord. 30, 580–584. doi: 10.1002/mds.26104
Haddad, D. M., Vilain, S., Vos, M., Esposito, G., Matta, S., Kalscheuer, V. M., et al. (2013). Mutations in the intellectual disability gene Ube2a cause neuronal dysfunction and impair parkin-dependent mitophagy. Mol. Cell 50, 831–843. doi: 10.1016/j.molcel.2013.04.012
Harrow, J., Frankish, A., Gonzalez, J. M., Tapanari, E., Diekhans, M., Kokocinski, F., et al. (2012). GENCODE: the reference human genome annotation for the ENCODE project. Genome Res. 22, 1760–1774. doi: 10.1101/gr.135350.111
Hicke, L., and Dunn, R. (2003). Regulation of membrane protein transport by ubiquitin and ubiquitin-binding proteins. Annu. Rev. Cell Dev. Biol. 19, 141–172. doi: 10.1146/annurev.cellbio.19.110701.154617
Hornsby, A. K. E., Buntwal, L., Carisi, M. C., Santos, V. V., Johnston, F., Roberts, L. D., et al. (2020). Unacylated-ghrelin impairs hippocampal neurogenesis and memory in mice and is altered in Parkinson’s dementia in humans. Cell Rep Med. 1:100120. doi: 10.1016/j.xcrm.2020.100120
Howe, K. L., Achuthan, P., Allen, J., Allen, J., Alvarez-Jarreta, J., Amode, M. R., et al. (2021). Ensembl 2021. Nucleic Acids Res. 49, D884–D891. doi: 10.1093/nar/gkaa942
Huang, M., Coral, D., Ardalani, H., Spegel, P., Saadat, A., Claussnitzer, M., et al. (2023). Identification of a weight loss-associated causal eQTL in and the effects of ZNF649 deficiency on human adipocyte function. eLife 12:4168. doi: 10.7554/eLife.84168
Huang, D. W., Sherman, B. T., and Lempicki, R. A. (2009). Systematic and integrative analysis of large gene lists using DAVID bioinformatics resources. Nat. Protoc. 4, 44–57. doi: 10.1038/nprot.2008.211
Jacques, S., Arjomand, A., Perée, H., Collins, P., Mayer, A., Lavergne, A., et al. (2021). Dual-specificity phosphatase 3 deletion promotes obesity, non-alcoholic steatohepatitis and hepatocellular carcinoma. Sci. Rep. 11:5817. doi: 10.1038/s41598-021-85089-6
Jha, S. K., Jha, N. K., Kumar, D., Ambasta, R. K., and Kumar, P. (2017). Linking mitochondrial dysfunction, metabolic syndrome and stress signaling in neurodegeneration. Biochim. Biophys. Acta Mol. basis Dis. 1863, 1132–1146. doi: 10.1016/j.bbadis.2016.06.015
Koh, I. U., Lee, H. J., Hwang, J. Y., Choi, N. H., and Lee, S. (2017). Obesity-related CpG methylation (cg07814318) of Kruppel-like Factor-13 (KLF13) gene with childhood obesity and its cis-methylation quantitative loci. Sci. Rep. 7:45368. doi: 10.1038/srep45368
Korf, H., Breser, L., Van Hoeck, J., Godoy, J., Cook, D. P., Stijlemans, B., et al. (2017). MIF inhibition interferes with the inflammatory and T cell-stimulatory capacity of NOD macrophages and delays autoimmune diabetes onset. PLoS One 12:e0187455. doi: 10.1371/journal.pone.0187455
Kozomara, A., Birgaoanu, M., and Griffiths-Jones, S. (2019). miRBase: from microRNA sequences to function. Nucleic Acids Res. 47, D155–D162. doi: 10.1093/nar/gky1141
Kretowski, A., Adamska, E., Maliszewska, K., Wawrusiewicz-Kurylonek, N., Citko, A., Goscik, J., et al. (2015). The rs340874 PROX1 type 2 diabetes mellitus risk variant is associated with visceral fat accumulation and alterations in postprandial glucose and lipid metabolism. Genes Nutr. 10:4. doi: 10.1007/s12263-015-0454-6
Kriebs, A. (2022). Obesity-associated ASB4 controls satiety. Nat. Rev. Endocrinol. 18:456. doi: 10.1038/s41574-022-00704-4
Lee, B. T., Barber, G. P., Benet-Pagès, A., Casper, J., Clawson, H., Diekhans, M., et al. (2022). The UCSC genome browser database: 2022 update. Nucleic Acids Res. 50, D1115–D1122. doi: 10.1093/nar/gkab959
Li, B., Duysen, E. G., and Lockridge, O. (2008). The butyrylcholinesterase knockout mouse is obese on a high-fat diet. Chem. Biol. Interact. 175, 88–91. doi: 10.1016/j.cbi.2008.03.009
Li, Y. L., Li, L., Liu, Y. H., Hu, L. K., and Yan, Y. X. (2023). Identification of metabolism-related proteins as biomarkers of insulin resistance and potential mechanisms of mA modification. Nutrients 15:1839. doi: 10.3390/nu15081839
Li, Y., Yan, H., Wang, F., Huang, S., Zhang, Y., Wang, Z., et al. (2017). Activation of Eph A1-epha receptor axis attenuates diabetic nephropathy in mice. Biochem. Biophys. Res. Commun. 486, 693–699. doi: 10.1016/j.bbrc.2017.03.100
Lin, C. C., Cheng, K. P., Hung, H. C., Li, C. H., Lin, C. H., Chang, C. J., et al. (2019). Serum Secretogranin III concentrations were increased in subjects with metabolic syndrome and independently associated with fasting plasma glucose levels. J. Clin. Med. Res. 8:1436. doi: 10.3390/jcm8091436
Liu, J., Liu, S., Yu, Z., Qiu, X., Jiang, R., and Li, W. (2022). Uncovering the gene regulatory network of type 2 diabetes through multi-omic data integration. J. Transl. Med. 20:604. doi: 10.1186/s12967-022-03826-5
Louis, J. M., Agarwal, A., Mondal, S., and Talukdar, I. (2022). A global analysis on the differential regulation of RNA binding proteins (RBPs) by TNF-α as potential modulators of metabolic syndromes. BBA Adv. 2:100037. doi: 10.1016/j.bbadva.2021.100037
Malik, S., Wong, N. D., Franklin, S. S., Kamath, T. V., L’Italien, G. J., Pio, J. R., et al. (2004). Impact of the metabolic syndrome on mortality from coronary heart disease, cardiovascular disease, and all causes in United States adults. Circulation 110, 1245–1250. doi: 10.1161/01.CIR.0000140677.20606.0E
Martin, C. L., Jima, D., Sharp, G. C., McCullough, L. E., Park, S. S., Gowdy, K. M., et al. (2019). Maternal pre-pregnancy obesity, offspring cord blood DNA methylation, and offspring cardiometabolic health in early childhood: an epigenome-wide association study. Epigenetics 14, 325–340. doi: 10.1080/15592294.2019.1581594
McMillan, K. J., Gallon, M., Jellett, A. P., Clairfeuille, T., Tilley, F. C., McGough, I., et al. (2016). Atypical parkinsonism-associated retromer mutant alters endosomal sorting of specific cargo proteins. J. Cell Biol. 214, 389–399. doi: 10.1083/jcb.201604057
Nakazato, M., Murakami, N., Date, Y., Kojima, M., Matsuo, H., Kangawa, K., et al. (2001). A role for ghrelin in the central regulation of feeding. Nature 409, 194–198. doi: 10.1038/35051587
Nalls, M. A., Blauwendraat, C., Vallerga, C. L., Heilbron, K., Bandres-Ciga, S., Chang, D., et al. (2019). Identification of novel risk loci, causal insights, and heritable risk for Parkinson’s disease: a meta-analysis of genome-wide association studies. Lancet Neurol. 18, 1091–1102. doi: 10.1016/S1474-4422(19)30320-5
Nam, G. E., Kim, S. M., Han, K., Kim, N. H., Chung, H. S., Kim, J. W., et al. (2018). Metabolic syndrome and risk of Parkinson disease: a nationwide cohort study. PLoS Med. 15:e1002640. doi: 10.1371/journal.pmed.1002640
Nassar, L. R., Barber, G. P., Benet-Pagès, A., Casper, J., Clawson, H., Diekhans, M., et al. (2023). The UCSC genome browser database: 2023 update. Nucleic Acids Res. 51, D1188–D1195. doi: 10.1093/nar/gkac1072
Ng, P. C., and Henikoff, S. (2001). Predicting deleterious amino acid substitutions. Genome Res. 11, 863–874. doi: 10.1101/gr.176601
Ng, P. C., and Shift, S. H. (2003). Predicting amino acid changes that affect protein function. Nucleic Acids Res. 31, 3812–3814.
Nyambuya, T. M., Dludla, P. V., Mxinwa, V., and Nkambule, B. B. (2021). A systematic review and meta-analysis on the regulation of programmed cell death-1 on T-cells in type 2 diabetes. Medicine 100:e25488. doi: 10.1097/MD.0000000000025488
O’Leary, N. A., Wright, M. W., Brister, J. R., Ciufo, S., Haddad, D., McVeigh, R., et al. (2016). Reference sequence (RefSeq) database at NCBI: current status, taxonomic expansion, and functional annotation. Nucleic Acids Res. 44, D733–D745.
Oscanoa, J., Sivapalan, L., Gadaleta, E., Dayem Ullah, A. Z., Lemoine, N. R., and Chelala, C. (2020). SNPnexus: a web server for functional annotation of human genome sequence variation (2020 update). Nucleic Acids Res. 48, W185–W192. doi: 10.1093/nar/gkaa420
Otero-Losada, M., Marseglia, A., Blanco Calvo, E., and Capani, F. (2023). Editorial: neurological comorbidity in metabolic syndrome. Front. Neurosci. 17:1263570. doi: 10.3389/fnins.2023.1263570
Parkinson Progression Marker Initiative (2011). The Parkinson progression marker initiative (PPMI). Prog. Neurobiol. 95, 629–635. doi: 10.1016/j.pneurobio.2011.09.005
Peng, Z., Zhou, R., Liu, D., Cui, M., Yu, K., Yang, H., et al. (2021). Association between metabolic syndrome and mild parkinsonian signs progression in the elderly. Front. Aging Neurosci. 13:722836. doi: 10.3389/fnagi.2021.722836
Priya, A., Kalaidzidis, I. V., Kalaidzidis, Y., Lambright, D., and Datta, S. (2015). Molecular insights into Rab7-mediated endosomal recruitment of core retromer: deciphering the role of Vps26 and Vps35. Traffic 16, 68–84. doi: 10.1111/tra.12237
Pujar, S., O’Leary, N. A., Farrell, C. M., Loveland, J. E., Mudge, J. M., Wallin, C., et al. (2018). Consensus coding sequence (CCDS) database: a standardized set of human and mouse protein-coding regions supported by expert curation. Nucleic Acids Res. 46, D221–D228. doi: 10.1093/nar/gkx1031
Roh, J. H., Lee, S., and Yoon, J. H. (2021). Metabolic syndrome and Parkinson’s disease incidence: a Nationwide study using propensity score matching. Metab. Syndr. Relat. Disord. 19, 1–7. doi: 10.1089/met.2020.0060
Rönn, T., Perfilyev, A., Jönsson, J., Eriksson, K. F., Jørgensen, S. W., Brøns, C., et al. (2023). Circulating triglycerides are associated with human adipose tissue DNA methylation of genes linked to metabolic disease. Hum. Mol. Genet. 32, 1875–1887. doi: 10.1093/hmg/ddad024
Sassi, M., Morgan, A. H., and Davies, J. S. (2022). Ghrelin acylation-a post-translational tuning mechanism regulating adult hippocampal neurogenesis. Cells 11:765. doi: 10.3390/cells11050765
Shabana, U. S. S., Wah, L. K., Acharya, J., Cooper, J. A., Hasnain, S., et al. (2016). Effect of six type II diabetes susceptibility loci and an FTO variant on obesity in Pakistani subjects. Eur. J. Hum. Genet. 24, 903–910.
Sherman, B. T., Hao, M., Qiu, J., Jiao, X., Baseler, M. W., Lane, H. C., et al. (2022). DAVID: a web server for functional enrichment analysis and functional annotation of gene lists (2021 update). Nucleic Acids Res. 50, W216–W221. doi: 10.1093/nar/gkac194
Shimura, H., Hattori, N., Kubo, S. I., Mizuno, Y., Asakawa, S., Minoshima, S., et al. (2000). Familial Parkinson disease gene product, parkin, is a ubiquitin-protein ligase. Nat. Genet. 25, 302–305. doi: 10.1038/77060
Sim, N. L., Kumar, P., Hu, J., Henikoff, S., Schneider, G., and Ng, P. C. (2012). SIFT web server: predicting effects of amino acid substitutions on proteins. Nucleic Acids Res. 40, W452–W457. doi: 10.1093/nar/gks539
Souza, A. P. d. S., Barros, W. M. A., Silva, J. M. L., Silva, M. R. M., Silva, A. B. J., Fernandes, M. S. d. S., et al. (2021). Effect of metabolic syndrome on Parkinson’s disease: a systematic review. Clinics 76:e3379.
Sticht, C., De La Torre, C., Parveen, A., and Gretz, N. (2018). miRWalk: an online resource for prediction of microRNA binding sites. PLoS One 13:e0206239. doi: 10.1371/journal.pone.0206239
Su, J., Huang, P., Qin, M., Lu, Q., Sang, X., Cai, Y., et al. (2018). Reduction of HIP2 expression causes motor function impairment and increased vulnerability to dopaminergic degeneration in Parkinson’s disease models. Cell Death Dis. 9:1020. doi: 10.1038/s41419-018-1066-z
Van Dongen, S. (2008). Graph clustering via a discrete uncoupling process. SIAM J. Matrix Anal. Appl. 30, 121–141. doi: 10.1137/040608635
Vila, I. K., Park, M. K., Setijono, S. R., Yao, Y., Kim, H., Badin, P. M., et al. (2019). A muscle-specific UBE2O/AMPKα2 axis promotes insulin resistance and metabolic syndrome in obesity. JCI Insight 4:269. doi: 10.1172/jci.insight.128269
Voskarides, K., Stefanou, C., Pieri, M., Demosthenous, P., Felekkis, K., Arsali, M., et al. (2017). A functional variant in NEPH3 gene confers high risk of renal failure in primary hematuric glomerulopathies. Evidence for predisposition to microalbuminuria in the general population. PLoS One 12:e0174274. doi: 10.1371/journal.pone.0174274
Zhang, Q., Chikina, M., Szymczak-Workman, A. L., Horne, W., Kolls, J. K., Vignali, K. M., et al. (2017). Lag3 limits regulatory T cell proliferation and function in autoimmune diabetes. Sci. Immunol. 2:4569. doi: 10.1126/sciimmunol.aah4569
Zhang, X., Huo, C., Liu, Y., Su, R., Zhao, Y., and Li, Y. (2022). Mechanism and disease association with a ubiquitin conjugating E2 enzyme: UBE2L3. Front. Immunol. 13:793610. doi: 10.3389/fimmu.2022.793610
Zhang, P., and Tian, B. (2014). Metabolic syndrome: an important risk factor for Parkinson’s disease. Oxidative Med. Cell. Longev. 2014:729194. doi: 10.1155/2014/729194
Zhang, J., Zhang, K., Qi, L., Hu, Q., Shen, Z., Liu, B., et al. (2019). DENN domain-containing protein FAM45A regulates the homeostasis of late/multivesicular endosomes. Biochim. Biophys. Acta, Mol. Cell Res. 1866, 916–929. doi: 10.1016/j.bbamcr.2019.02.006
Keywords: single-nucleotide polymorphism, Parkinson’s disease, metabolic syndrome, microARN regulation, expression quantitative trait loci, microRNA quantitative trait loci
Citation: Chevalier G, Udovin L, Otero-Losada M, Bordet S, Perez-Lloret S and Capani F (2025) MicroRNAs and rs1803274 SNP-based BuChe downregulation are associated with metabolic syndrome through ghrelin hydrolysis and expression quantitative trait loci regulation in PD patients. Front. Mol. Neurosci. 18:1635201. doi: 10.3389/fnmol.2025.1635201
Edited by:
Bo-Wei Zhao, Zhejiang University, ChinaReviewed by:
Yanbin Wang, Zhejiang University, ChinaSridhar R. Gumpeny, Endocrine and Diabetes Centre, India
Copyright © 2025 Chevalier, Udovin, Otero-Losada, Bordet, Perez-Lloret and Capani. This is an open-access article distributed under the terms of the Creative Commons Attribution License (CC BY). The use, distribution or reproduction in other forums is permitted, provided the original author(s) and the copyright owner(s) are credited and that the original publication in this journal is cited, in accordance with accepted academic practice. No use, distribution or reproduction is permitted which does not comply with these terms.
*Correspondence: Guenson Chevalier, Z3VlbnNvbmNoZXZhbGllckB5YWhvby5jb20=
†ORCID: Matilde Otero-Losada, orcid.org/0000-0001-6650-1033
Santiago Perez-Lloret, orcid.org/0000-0001-9069-6512