 Ashish Kumar Jha1,2*
 Umeshkumar Baburao Sherkhane1,3Nilendu C. Purandare1,2
 Leonard Wee1
 Andre Dekker1
 Venkatesh Rangarajan1,2
- 1Department of Nuclear Medicine and Molecular Imaging, Tata Memorial Hospital, Mumbai, Maharashtra, India
- 2Homi Bhabha National Institute, BARC Training School Complex, Mumbai, Maharashtra, India
- 3Department of Radiation Oncology (Maastro), University Maastricht School of Oncology and Maastricht University Medical Centre+, Maastricht, Netherlands
Background: The characterization of solitary pulmonary nodules (SPNs) as malignant or benign remains a diagnostic challenge using conventional imaging parameters. The literature suggests using combined Positron Emission Tomography (PET) and Computed Tomography (CT) to characterise a SPN. Radiomics and machine learning are other promising technologies which can be utilised to characterise the SPN.
Purpose: This study explores the potential of PET radiomics signatures and machine learning algorithms to characterise the SPN.
Methods: This retrospective study aimed to characterize solitary pulmonary nodules (SPNs) using PET radiomics. A total of 163 patients who underwent PET/CT imaging were included in this study. A total of 1,098 features were extracted from PET images using PyRadiomics. To optimize model performance two strategies i.e., (a) feature selection and (b) feature reduction techniques were employed, including hierarchical clustering, RFE in feature selection, and PCA in feature reduction. To address outcome class imbalance, the dataset was statistically resampled (SMOTE). A random forest models was developed using original training set (RF-Model-O & RF-PCA-Model-O) and balanced training dataset (RF-Model-B & RF-PCA-Model-B) and validated on the test datasets. Additionally, 5-fold cross-validation and bootstrap validation was also performed. The model's performance was assessed using various metrics, such as accuracy, AUC, precision, recall, and F1-score.
Results: Of the 163 patients (aged 36–76 years, mean age 58 ± 7), 117 had malignant disease and 46 had granulomatous or benign conditions. In Strategy (a), five radiomic features were identified as optimal using hierarchical clustering and RFE. In Strategy (b), five principal components were deemed optimal using PCA. The model accuracy of RF-Model-O and RF-Model-B in the train-test validation, 5-fold cross-validation and bootstrap validation were found to be 0.8, 0.80 ± 0.07, 0.84 ± 1.11 and 0.8, 0.83 ± 0.10, 0.80 ± 0.07 in Strategy (a). Similarly, the model accuracy of RF-PCA-Model-O and RF-PCA-Model-B in the train-test validation, 5-fold cross-validation and bootstrap validation were found to be 0.84, 0.80 ± 0.07, 0.84 ± 07 and 0.74, 0.80 ± 0.08, 0.75 ± 0.08 in Strategy (b).
Conclusion: The PET radiomics demonstrated excellent performance in characterizing SPNs as benign or malignant.
1 Introduction
The detection and malignancy characterization of solitary pulmonary nodules (SPNs) represent a significant challenge in the realm of modern healthcare, particularly within the field of radiology (1). An SPN is defined as a rounded or oval lesion that measures up to 3 cm in diameter, entirely surrounded by lung parenchyma, and lacks any associated lymphadenopathy or atelectasis (1). SPNs can be either benign or malignant, and distinguishing between these two categories is critical for appropriate patient management (2, 3). With lung cancer being one of the leading causes of cancer-related deaths worldwide, early and accurate identification of SPNs becomes paramount in improving patient outcomes and reducing mortality rates (4, 5).
In earlier days chest radiographs were used to detect SPN (6–8). In recent years, the landscape of SPN detection has undergone a transformative shift, largely attributed to the advancements in radiological imaging techniques. Imaging modalities such as chest radiography, computed tomography (CT), positron emission tomography (PET), and magnetic resonance imaging (MRI) have demonstrated remarkable capabilities in enhancing the accuracy and efficiency of SPN detection (9–17). The integration of these imaging technologies has revolutionized the approach to identifying SPNs, enabling clinicians to make well-informed decisions about patient management and treatment strategies (9–17).
Traditional chest radiography serves as the initial screening tool for detecting SPNs (6, 7). However, its limited sensitivity often results in a substantial number of SPNs remaining undetected (6, 7). While chest radiography may identify larger nodules, its efficacy diminishes with smaller lesions, emphasizing the need for more advanced imaging techniques (6, 7).
Computed Tomography (CT) has emerged as a cornerstone in SPN detection and characterization due to its exceptional spatial resolution. High-resolution CT (HRCT) plays a pivotal role in distinguishing between benign and malignant SPNs, allowing radiologists to analyze nodule morphology, texture, and enhancement patterns (9–13). The introduction of multidetector-row CT (MDCT) further enhances image quality and facilitates three-dimensional reconstructions, enabling precise measurements of nodule size and volume. CT is particularly advantageous for assessing nodules in difficult-to-reach anatomical locations or those obscured by surrounding structures (9–14).
Positron Emission Tomography (PET) imaging, often combined with CT (PET/CT), offers metabolic and anatomical information simultaneously (15–19). By using radiopharmaceuticals labelled with positron-emitting isotopes, such as Fluorine-18 fluorodeoxyglucose (F-18 FDG), PET detects areas of increased glucose metabolism, which is characteristic of many malignant tumours. PET/CT can aid in differentiating benign from malignant SPNs by assessing their metabolic activity (15–19). For instance, increased FDG uptake suggests malignancy, whereas reduced uptake is indicative of benignity. This modality contributes significantly to staging, guiding biopsy, and monitoring treatment response.
Magnetic Resonance Imaging (MRI) although less frequently employed for SPN detection due to its relatively lower resolution and longer acquisition times, MRI offers unique advantages, especially in assessing nodules in specific clinical scenarios (20–22). MRI provides excellent soft tissue contrast, which can aid in differentiating between various tissue types. Diffusion-weighted imaging (DWI) is particularly promising, as it captures variations in the diffusion of water molecules, highlighting differences in tissue cellularity and microstructure (20–22).
The integration of these radiological imaging modalities into clinical practice has considerably enhanced the accuracy of SPN detection and characterization. However, challenges persist in distinguishing between benign and malignant SPNs, particularly in cases where imaging features are inconclusive (23–25). To address this, various quantitative imaging techniques and computer-aided diagnostic (CAD) systems have been developed, aiming to provide more objective and reproducible assessments of SPNs. These approaches involve the extraction of quantitative features from imaging data, such as nodule size, shape, texture, and enhancement patterns, which are then used to develop predictive models to aid radiologists in their decision-making process (26–31).
The detection and characterization of solitary pulmonary nodules have seen remarkable advancements through the integration of various radiological imaging modalities and artificial intelligence (27–31). From the initial screening with chest radiography to the high-resolution capabilities of CT, the metabolic insights of PET/CT, and the unique tissue contrast of MRI, radiology-based radiomics and artificial intelligence may have an indispensable role in improving the accuracy and efficacy of SPN diagnosis (27–32). These technologies have transformed the clinical landscape, facilitating early detection, accurate characterization, and appropriate management of SPNs. Continued research and innovation in this field hold the promise of further refining our understanding and approach to SPN detection, ultimately leading to improved patient outcomes and reduced mortality rates (24, 25). In this study, we utilized AI and PET radiomics to differentiate between malignant and benign etiologies of solitary pulmonary nodules (SPNs).
2 Material and methods
This retrospective study was approved by the Institutional Ethics Committee (IEC), with a waiver of informed consent granted in accordance with the Declaration of Helsinki. This study adheres TRIPOD Checklist for prediction model development (Supplementary TRIPOD Checklist). The study included 196 patients who underwent PET/CT imaging for characterization of solitary pulmonary nodules (SPNs) between 2016 and 2020. Patients in this study were selected based on the following inclusion and exclusion criteria:
Inclusion criteria:
Patients enrolled between 2000 and 2016.
Patients who underwent PET/CT scans.
Patients with a histopathology-proven diagnosis.
Exclusion criteria:
PET/CT scans of suboptimal quality.
Non-conclusive histopathology reports.
Finally, 163 patients were found suitable to include in this study (Figure 1). PET/CT scans of these patients were downloaded from the Picture Archive and Communication System (PACS) to EBW workstation, Phillips Medical system, Eindhoven, Netherlands and the nodules were delineated by an expert radiologist using the SUV threshold method (threshold = 42%) followed by manual corrections if required. Manual corrections were required for tumor with an SUVmax less than 3 g/ml. such correction was performed by an expert radiologist with more than 20 years of experience. The delineation was stored as RTSTRUCT by the name of GTV in Digital Image Communication in Medicine (DICOM) format. The maximum Standardized Uptake Value (SUVmax) in the delineation was also captured and stored in the datasheet. Subsequently, PET scan images and GTV were transferred to the AI workstation for further processing.
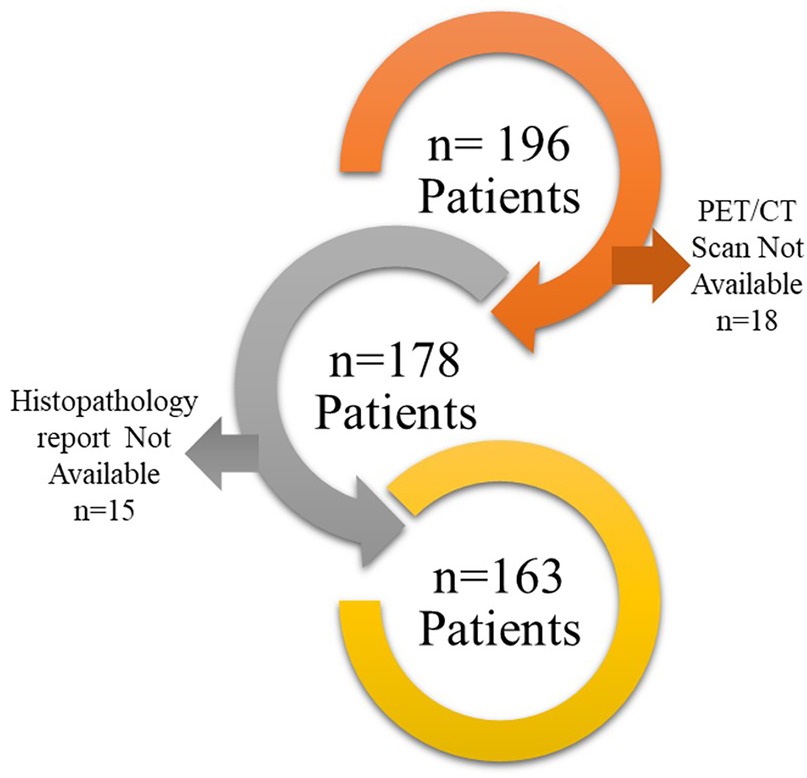
Figure 1. Patient selection flowchart is shown in the figure.
All the patients having malignant SPN were treated with surgery as first-line treatment. Patients diagnosed with granulomatous disease were referred to the general hospital for further treatment.
2.1 PET/CT acquisition
The contrast-enhanced CT scan followed by PET scans were performed one hour after the intravenous administration of 18F-FDG (5 MBq/kg body weight) on Gemini TF16 or Gemini TF 64 PET/CT scanner, Phillips Medical system, Eindhoven, Netherlands. The details of imaging parameters are shown in Table 1.
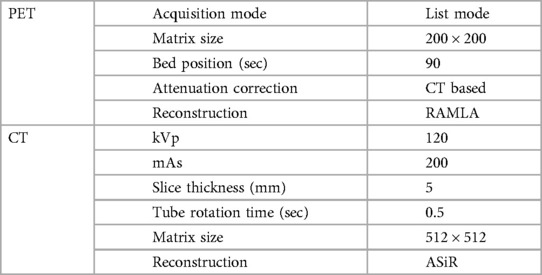
Table 1. Imaging protocols used to perform PET/CT scan.
2.2 Prediction model development
The complete prediction modelling strategy is pictorially depicted in Figure 2. As the first step of the radiomics-based prediction model development, 1,098 features were extracted from the PET images and GTV by using the in-house developed radiomic workflow software PyRadGUI (33). A description of the extracted radiomic feature types is presented in this table (Table 2). To improve the model's predictive performance, we implemented two feature engineering strategies: (a) feature selection and (b) feature reduction.
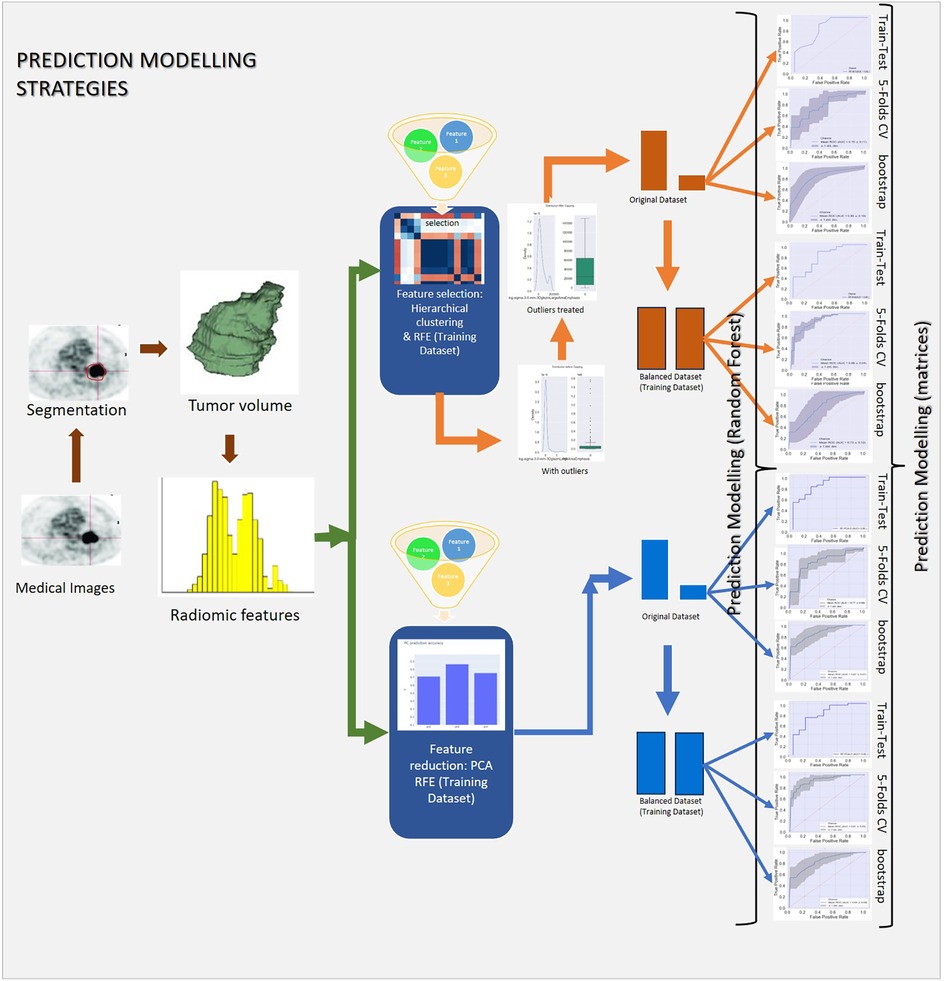
Figure 2. Schematic representation of the study's methodology, outlining data preprocessing, hyperparameter tuning, model development, and validation.
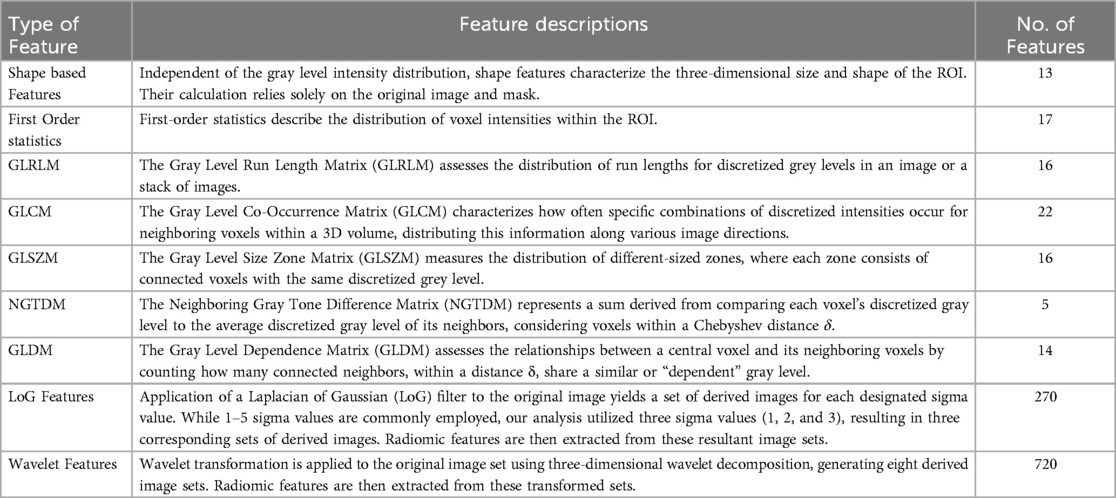
Table 2. The table outlines the various types of radiomic features extracted from the images.
2.2.1 Feature selection
A two-step feature selection process was adopted to select the most relevant features for the prediction model development.
2.2.1.1 Unsupervised learning technique
K-means Clustering was performed to reduce the redundancy in features based on their similarity. By identifying clusters of correlated features, we could potentially mitigate redundancy and select representative features from each cluster.
2.2.1.2 Recursive feature elimination (RFE)
RFE is a backward feature elimination method that iteratively removes features that have the least impact on the model's performance. This helps to identify the most informative features for the prediction task. Using the Random forest algorithm in the RFE algorithm the most significant features were selected to develop a prediction model.
2.2.2 Feature reduction
2.2.2.1 Principal component analysis (PCA)
The PCA is a dimensionality reduction technique which, transforms the original features into a new set of uncorrelated features, known as principal components. By retaining only the most important principal components, we can significantly reduce the dimensionality of the data while preserving the most relevant information. The PCA was performed to select the most significant principal components for the prediction model development.
The outliers in the radiomics features may influence the performance of radiomic-based prediction model.
2.2.3 Outlier treatment
The interquartile range method was employed to identify and treat the outliers in the selected features. The values falling outside the 1.5 times the interquartile range were considered outliers. The outliers were replaced with the median or mean value randomly to prevent them from unduly influencing the model's performance. Outliers treatment was performed accordingly for 10 radiomic feature selected by using k-mean clustering and SUV max value (Supplementary Figures S1–S10).
2.2.4 Train-test data split
The stratified train-test dataset split was performed in a 7:3 ratio. 70% of data were used to train the model and 30% were used to validate the model subsequently. The training dataset underwent feature selection via recursive feature elimination (RFE), data balancing, and hyperparameter tuning. In contrast, the test dataset was reserved solely for model validation in train-test validation and bootstrap validation, ensuring an unbiased evaluation of the model's performance and data leakage.
2.2.5 Data balancing
Given the class imbalance in the dataset, with a higher prevalence of malignancies compared to benign SPNs, we implemented data balancing techniques. The SMOTE (Synthetic Minority Oversampling Technique) technique was used to address the class imbalance by generating synthetic data points for the minority class in the training dataset (33). By creating new samples similar to existing minority classes, SMOTE helps to balance the representation of different classes in the training dataset.
2.2.6 Prediction algorithm
Random Forest Algorithm: The random forest (RF) algorithm was employed to develop the prediction model. RF is a popular ensemble machine learning algorithm that combines multiple decision trees to make predictions. Random forests are known for their robustness and ability to handle complex relationships in data.
2.2.7 Hyperparameter tuning
A grid search method was employed for exhaustively searching through a predefined grid of hyperparameter values to find the optimal combination of these hyperparameters by fine-tuning them, which maximizes the prediction model performance of the prediction model by in the model. By systematically evaluating different parameter settings, grid search helps to fine-tune the model's behaviour and improve its predictive accuracy (Supplementary Table S3).
In strategy one two random forest prediction models i.e., RF-Model-O and RF-Model-B were developed using original and balanced train datasets. In strategy two, two models i.e., RF-PCA-Model-O and RF-PCA-Model-B were developed using original and balanced train datasets. These models were validated using the test dataset. To assess the prediction model's performance and generalization capabilities, we employed five-fold cross-validation and bootstrap validation in addition to the standard train-test split.
2.3 Prediction metrics
The performance of the prediction models was evaluated using various metrics, including accuracy, AU-ROC (Area Under the Receiver Operating Characteristic Curve), precision, recall, and F1-score. These metrics provide insights into the model's ability to correctly classify instances, avoid false positives and negatives, and achieve a balance between precision and recall.
2.4 Software used
All statistical analyses and prediction model development were performed using various packages of Python version 3.10. For feature selection and prediction model development scikit-learn 1.6.0 package of python was used.
3 Results
A total of 163 patients had a mean age of 59.5 ± 12.5 (Range: 36–76) years were included in this study. Of 163 patients, 117 had malignancy and 46 had granulomatous or benign disease. The mean lesion size was 3 ± 1.6 cubic centimetres. The mean SUVmax was found to be 10.2 ± 6.1 g/ml. the details of the demography data are provided in Table 3.
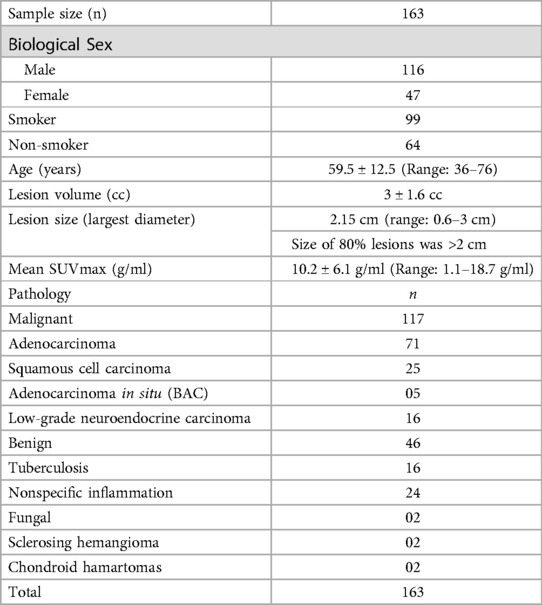
Table 3. Demographic and clinical characteristics of study participants.
In strategy (a), Spearman correlation-based K-mean Clustering yielded 10 features (Figure 3) (Supplementary Tables S1, S2). The heatmap of the Spearman correlation plot of 10 features is shown in Figure 4. Finally, 5 optimal features were selected using recursive feature elimination which was used for the prediction model development using a random forest algorithm (Supplementary Table S3). In strategy (b), 5 principal components were found to be optimal for prediction model development using random forest algorithm (Figure 5 & Supplementary Table S4).
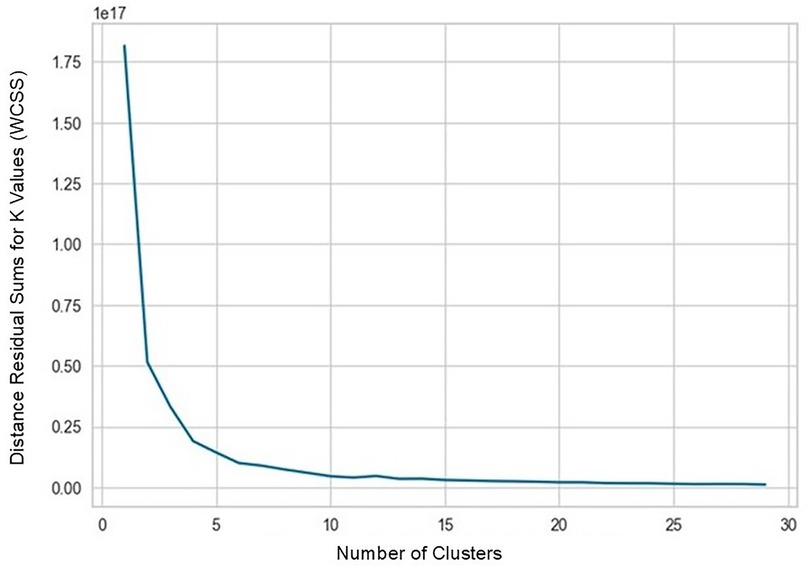
Figure 3. K-Means clustering elbow curve, indicating 10 optimal clusters.
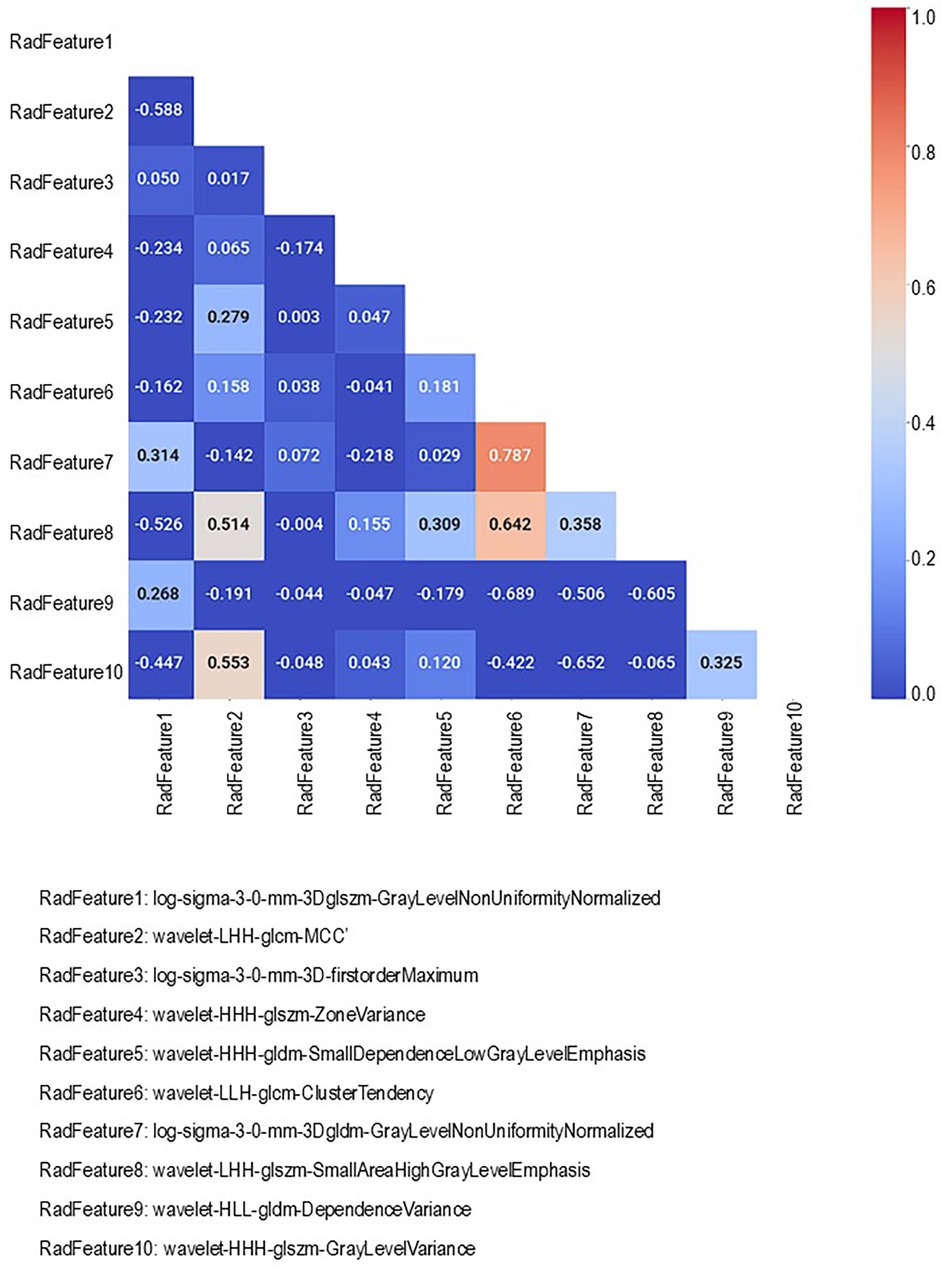
Figure 4. Spearman correlation heatmap of 10 radiomic features identified via K-means clustering.
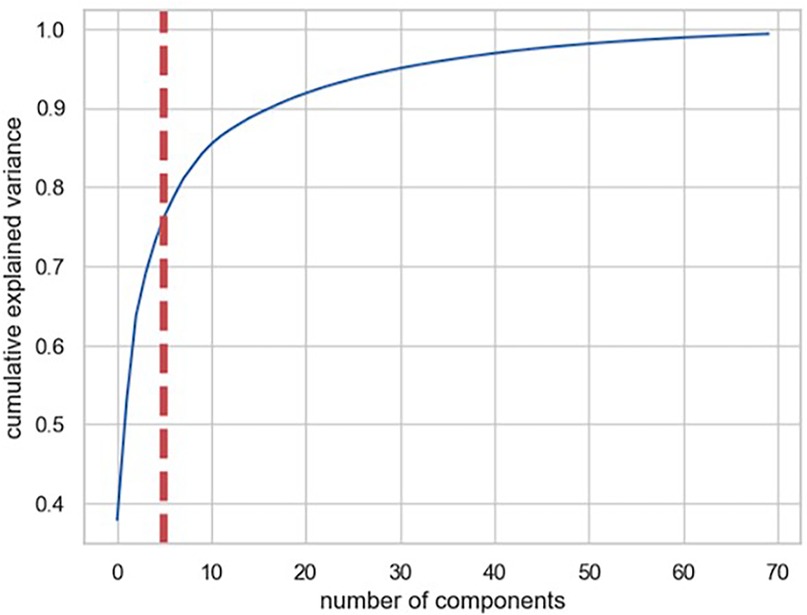
Figure 5. Figure shows the commutative variance ration of principal components.
In strategy a), the accuracy of the RF-Model-O (random forest model) was found to be 0.8, 0.80 ± 0.07, and 0.84 ± 1.11 on the test set, 5-fold cross-validation and bootstrap validation respectively on the original dataset. Similarly, the RF-Model-B model accuracy was found to be 0.8, 0.83 ± 1.10, and 0.80 ± 0.07 on the test set, 5-fold cross-validation and bootstrap validation respectively on balancing the test dataset. The RF-PCA-Model-O model accuracy using the PCA feature selection method was found to be 0.84, 0.80 ± 0.07 and 0.84 ± 0.07 on the test set, cross-validation and bootstrap validation on test set. Similarly, the RF-PCA-Model-B model accuracy using the PCA feature selection method was found to be 0.74, 0.80 ± 0.00 and 0.75 ± 0.08 on the test set, cross-validation and bootstrap validation on test set. The detailed prediction matrices of the random forest model are shown in Table 4 (Supplementary Figures S11, 12 and Supplementary Tables S5, S6). The AUC of ROC curves of all the prediction models in validation are shown in Figure 6.
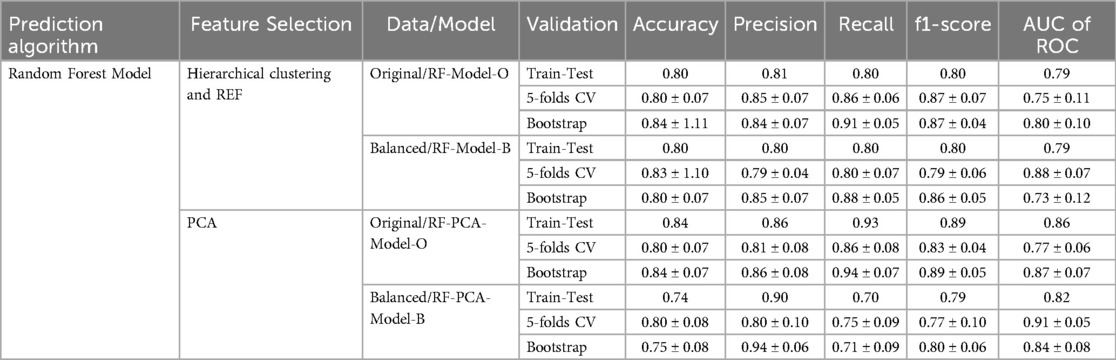
Table 4. Prediction matrices show the performance of various models in train-test, 5-fold cross-validation and bootstrap validation.
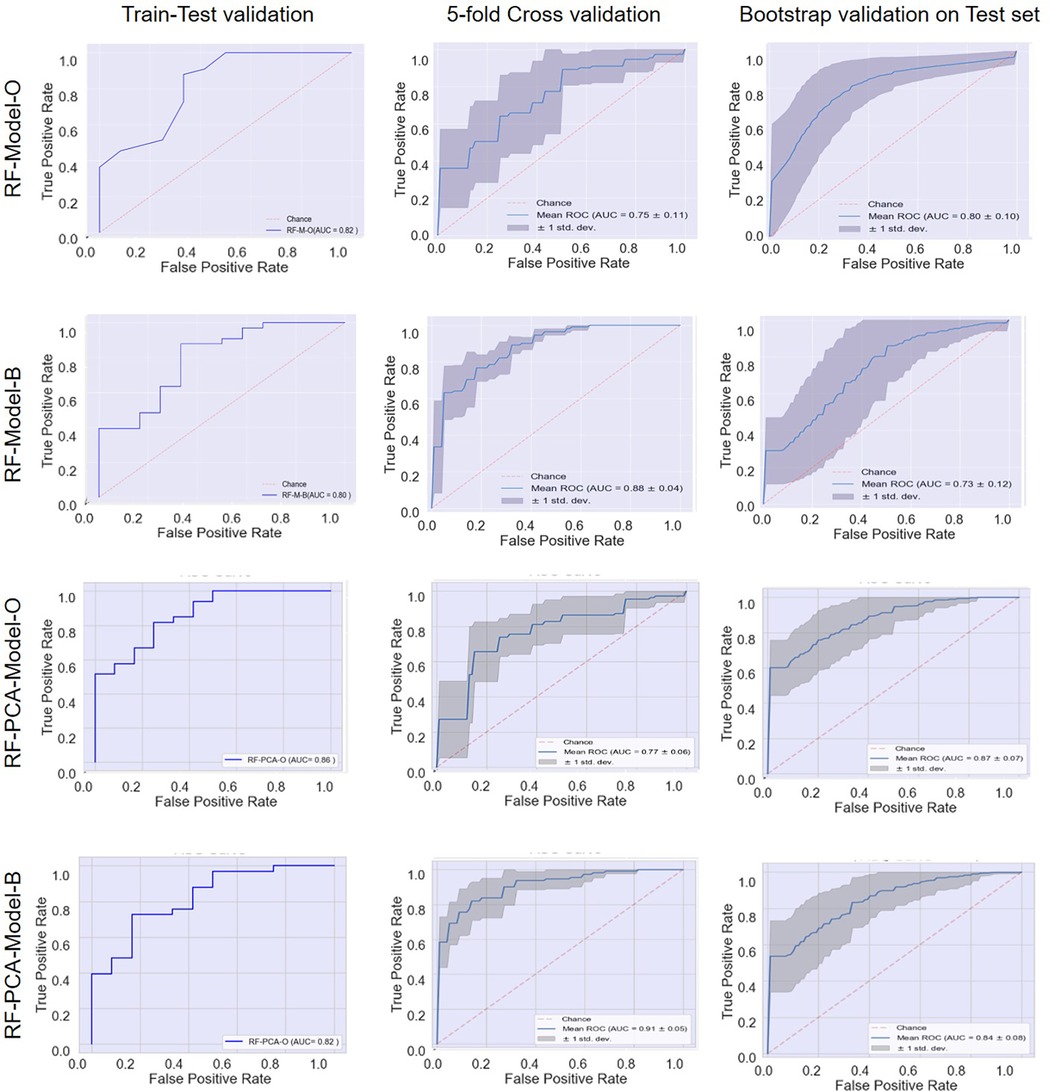
Figure 6. Receiver operating characteristic (ROC) curves: model performance comparison using train-test, 5-fold cross-validation, and bootstrap validation.
4 Discussion
Lung cancer remains one of the most prevalent and deadliest malignancies worldwide, posing significant challenges for healthcare providers. The timely and accurate detection of lung cancer is paramount to improving patient outcomes, particularly in the case of solitary pulmonary nodules (SPNs) (34). A solitary pulmonary nodule is defined as a discrete, well-circumscribed lesion in the lung parenchyma, often detected incidentally in imaging studies, which raises concerns about potential malignancy (34). While SPNs can be benign, they also represent an important clinical dilemma due to the potential for malignancy (34). Therefore, distinguishing between benign and malignant SPNs is a critical challenge that necessitates precise and efficient diagnostic tools.
This study retrospectively analysed 163 patients with solitary pulmonary nodules (SPN) upon presentation, 117 of whom had histologically proven malignant disease. We employed PET radiomics-based prediction modelling using the well-established Random Forest algorithm. Our model demonstrated excellent discriminatory capabilities in identifying malignant and benign lesions, achieving a validation accuracy of 0.8 and an AUC of 0.9.
The advent of advanced imaging modalities, such as computed tomography (CT), has revolutionized the early detection and diagnosis of lung nodules. However, the sheer volume of medical images generated has made manual interpretation impractical, leading to the emergence of computer-aided detection (CAD) and diagnosis (CADx) systems (35–37). These systems integrate machine learning, deep learning, and artificial intelligence (AI) algorithms to enhance the diagnostic accuracy and efficiency of radiologists. By analyzing vast amounts of image data and identifying subtle patterns indicative of malignancy, these systems hold the potential to significantly improve SPN detection rates (37).
Despite the promising potential of CAD and CADx systems, several challenges persist in the accurate detection of SPNs. One key challenge is the variability in SPN appearances, encompassing diverse morphologies, sizes, and locations within the lung. The complexity of distinguishing malignant nodules from benign ones requires a high level of precision in algorithm design and training (37–39). Moreover, in the last few years, it has been reported that the role of functional imaging like PET/CT is increasing in SPN detection. The function imaging-based glucose metabolic markers like SUV characterize the SPN better than morphological parameters on CT or MRI scans (31). A study performed by Purandere et al. demonstrated the improved accuracy of SPN detection based on SUVmax obtained from metabolic imaging of 18F-FDG (17). Another study by Garcia-Velloso MJ et al. has shown that integrating the metabolic information from 18F-FDG with the morphological information from CT improves the accuracy of lung cancer diagnosis (19). The study by Herder et al. aimed to validate the Swensen clinical prediction model for indeterminate pulmonary nodules and assess the added value of FDG-PET scanning (40). Several studies have suggested that proliferation markers like 18F-FLT can characterize lung cancer better than those of metabolic markers like 18F-FDG (20). A study, by Jha AK et al., was able to predict 2-year overall survival (OS) using the radiomic features extracted from the CT images (41). Several studies have been performed on radiomics to predict various outcomes in lung cancer (33–37, 41, 42). These studies have demonstrated that the heterogeneity in 18F-FDG uptake in tumours carries vital information to predict various outcomes in lung cancer (33–45). In the last few years, many researchers have explored AI-assisted radiomic features to characterize the SPN (37–40, 43–45). Unlike our study, which focuses on radiomics based prediction modelling, Beyer et al. (2007) investigated the practical application of Computer-Aided Detection (CAD) in improving pulmonary nodule detection efficiency (43). Similar to our work, Zhao et al. (2022) described the development of a diagnostic model for malignant solitary pulmonary nodules, though their model utilized CT radiomics features (44). In contrast, our study developed a PET radiomics model, which is more directly based on the physiological manifestation of tumors. In a literature reviews, Thawani et al. provided a broad overview of radiomics and radiogenomics applications in lung cancer (45). However, Wilson et al. focused specifically on the role of radiomics in characterizing pulmonary nodules and lung cancer, discussing how quantitative features from medical images offer insights into tumor biology and aid clinical decision-making (46, 47). These studies have suggested the great role of PET-based radiomics in characterizing the SPN. In this study, we have attempted to characterize SPN using AI-assisted PET radiomic features. We adopted two methods for feature dimensionality reduction i.e., feature selection and feature reduction. In both the methods we found a good accuracy of the model in the characterization of the SPN. We adopted the robust multi-step method of the feature selection that yielded the most significant optimal features for the prediction model development. We employed the regular grid search to tune the hyperparameters of the random forest model. The balancing of the data using SMOTE did not improve the model performance significantly. The accuracy and other prediction matrices of the prediction model developed using feature selection method employing filter method followed by multivariate feature selection using RFE and feature reduction method using PCA method were comparable that shows the robustness of the radiomic feature in characterization of SPNs. The robustness of radiomic-based prediction model is also demonstrated by the 5-fold cross-validation and bootstrap validation as the prediction accuracy and other prediction matrices remain comparable in these methods with that of the train-test method.
These systems can be trained on large datasets of labelled images to learn intricate patterns that are often imperceptible to the human eye. The AI-enhanced detection of SPNs holds great promise not only for improving diagnostic accuracy but also for reducing radiologist fatigue and enhancing workflow efficiency.
To ensure the practicality and clinical applicability of these AI-driven solutions, rigorous validation and testing are imperative. The ability of AI algorithms to generalize across diverse patient populations and imaging devices needs to be thoroughly assessed. Furthermore, these systems should be seamlessly integrated into clinical workflows, taking into consideration regulatory approvals, data privacy, and the need for radiologist oversight. extracting and analyzing quantitative imaging features, radiomics enhances the ability to differentiate between benign and malignant SPNs with greater accuracy than traditional imaging techniques. This non-invasive method allows for more precise risk stratification, guiding clinical decisions regarding biopsy, surveillance, or intervention. Consequently, PET radiomics can improve patient outcomes by reducing unnecessary invasive procedures, optimizing treatment plans, and ultimately facilitating early and accurate diagnosis of lung cancer, thus contributing to better survival rates and quality of life for patients.
This study has several limitations. The first limitation is that the study is a single-centre study. The single-centre study is known to have reduced accuracy in predicting the outcome when tested on external conditions. The second major limitation is the sample size. The robustness of the prediction model increases with an increased sample size. The third major limitation is the imbalanced nature of the dataset. In our study, the malignant SPNs were three times that of benign SPNs. As our hospital is a tertiary cancer care centre so in our dataset, we have a large number of malignant SPN.
Future studies on PET radiomics-based characterization of SPNs could focus on several key areas to further enhance clinical applications and patient outcomes. to conduct multi-center studies to develop and validate the robust radiomic signature. To include CT radiomic features along with PET radiomic features. Prospective validation of radiomic signature in clinical trials. Our future research will involve a multicentric study to validate this prediction model using both retrospective and prospective cohorts.
5 Conclusion
The challenges posed by solitary pulmonary nodules are complex and multifaceted and difficult the differentiate between malignant and benign SPNs. The challenge further increased in India due to the prevalence of tuberculosis. This study demonstrates the utility of PET radiomics in the characterization of SPNs. Applying the data balancing technique to the training dataset did not improve the prediction accuracy in this study. By harnessing the power of machine learning algorithms and PET radiomics can bring a transformative shift towards the detection and characterization of SPN. Accurate and efficient SPN detection is vital for timely diagnosis and optimal patient outcomes, particularly in the context of lung cancer.
Data availability statement
The raw data supporting the conclusions of this article will be made available by the authors, without undue reservation.
Ethics statement
The studies involving humans were approved by Institutional ethics committee (IEC), Tata Memorial Centre. The studies were conducted in accordance with the local legislation and institutional requirements. The ethics committee/institutional review board waived the requirement of written informed consent for participation from the participants or the participants' legal guardians/next of kin because It was a retrospective study, perormed on retrospective data collected from the EMR and qualified for the waiver.
Author contributions
AJ: Conceptualization, Data curation, Formal analysis, Investigation, Methodology, Validation, Writing – original draft, Writing – review & editing, Project administration. US: Data curation, Investigation, Software, Validation, Writing – review & editing. NP: Conceptualization, Methodology, Supervision, Validation, Writing – review & editing. LW: Methodology, Supervision, Validation, Writing – review & editing. AD: Methodology, Software, Supervision, Writing – review & editing. VR: Investigation, Methodology, Project administration, Supervision, Validation, Writing – review & editing, Funding acquisition.
Funding
The author(s) declare that no financial support was received for the research and/or publication of this article.
Conflict of interest
The authors declare that the research was conducted in the absence of any commercial or financial relationships that could be construed as a potential conflict of interest.
Generative AI statement
The author(s) declare that no Generative AI was used in the creation of this manuscript.
Publisher's note
All claims expressed in this article are solely those of the authors and do not necessarily represent those of their affiliated organizations, or those of the publisher, the editors and the reviewers. Any product that may be evaluated in this article, or claim that may be made by its manufacturer, is not guaranteed or endorsed by the publisher.
Supplementary material
The Supplementary Material for this article can be found online at: https://www.frontiersin.org/articles/10.3389/fnume.2025.1611823/full#supplementary-material
References
1. MacMahon H, Austin JHM, Gamsu G, Herold CJ. Guidelines for management of small pulmonary nodules detected on CT scans: a statement from the Fleischner society. Radiology. (2005) 237(2):395–400. doi: 10.1148/radiol.2372041887
2. Tamura M, Shimizu Y, Yamamoto T, Yoshikawa J, Hashizume Y. Predictive value of one-dimensional mean computed tomography value of ground-glass opacity on high-resolution images for the possibility of future change. J Thorac Oncol. (2014) 9(4):469–72. doi: 10.1097/JTO.0000000000000117
3. Mery CM, Pappas AN, Bueno R, Mentzer SJ, Lukanich JM, Sugarbaker DJ, et al. Relationship between a history of antecedent cancer and the probability of malignancy for a solitary pulmonary nodule. Chest. (2004) 125(6):2175–81. doi: 10.1378/chest.125.6.2175
4. Bray F, Laversanne M, Sung H, Ferlay J, Siegel RL, Soerjomataram I, et al. Global cancer statistics 2022: GLOBOCAN estimates of incidence and mortality worldwide for 36 cancers in 185 countries. CA Cancer J Clin. (2024) 74(3):229–63. doi: 10.3322/caac.21834
5. Siegel RL, Miller KD, Jemal A. Cancer statistics, 2020. CA Cancer J Clin. (2020) 70(1):7–30. doi: 10.3322/caac.21590
6. Khan AN, Al-Jahdali HH, Irion KL, Arabi M, Koteyar SS. Solitary pulmonary nodule: a diagnostic algorithm in the light of current imaging technique. Avicenna J Med. (2011) 1(2):39–51. doi: 10.4103/2231-0770.90915
7. Holin SN, Dwork RE, Glaser S, Rikli AE, Stocklen JB. Solitary pulmonary nodules found in a community-wide chest roentgenographic survey; a five-year follow-up study. Am Rev Tuberc. (1959) 79:427–39. doi: 10.1164/artpd.1959.79.4.427
8. Gohagan J, Marcus P, Fagerstrom R, Pinsky P, Kramer B, Prorok P, Writing Committee, Lung Screening Study Research Group. Baseline findings of a randomized feasibility trial of lung cancer screening with spiral CT scan vs chest radiograph: the lung screening study of the national cancer institute. Chest. (2004) 12:114–21. doi: 10.1378/chest.126.1.114
9. Swensen SJ, Jett JR, Hartman TE, Midthun DE, Sloan JA, Sykes AM, et al. Lung cancer screening with CT: mayo clinic experience. Radiology. (2003) 226:756–61. doi: 10.1148/radiol.2263020036
10. Revel MP, Bissery A, Bienvenu M, Aycard L, Lefort C, Frija G. Are two-dimensional CT measurements of small noncalcified pulmonary nodules reliable? Radiology. (2004) 231:453–8. doi: 10.1148/radiol.2312030167
11. Yankelevitz DF, Gupta R, Zhao B, Henschke CI. Small pulmonary nodules: evaluation with repeat CT—preliminary experience. Radiology. (1999) 212:561–6. doi: 10.1148/radiology.212.2.r99au33561
12. Henschke CI, Yankelevitz DF, Naidich DP, McCauley DI, McGuinness G, Libby DM, et al. CT screening for lung cancer: suspiciousness of nodules according to size on baseline scans. Radiology. (2004) 231:164–8. doi: 10.1148/radiol.2311030634
13. Siegelman SS, Khouri NF, Scott WW Jr, Leo FP, Hamper UM, Fishman EK, et al. Pulmonary hamartoma: CT findings. Radiology. (1986) 160:313–7. doi: 10.1148/radiology.160.2.3726106
14. Kobayashi Y, Sakao Y, Deshpande GA, Fukui T, Mizuno T, Kuroda H, et al. The association between baseline clinical-radiological characteristics and growth of pulmonary nodules with ground-glass opacity. Lung Cancer. (2014) 83(1):61–6. doi: 10.1016/j.lungcan.2013.10.017
15. Sim YT, Goh YG, Dempsey MF, Han S, Poon FW. PET-CT evaluation of solitary pulmonary nodules: correlation with maximum standardized uptake value and pathology. Lung. (2013) 191(6):625–32. doi: 10.1007/s00408-013-9500-6
16. Bar-Shalom R, Kagna O, Israel O, Guralnik L. Noninvasive diagnosis of solitary pulmonary lesions in cancer patients based on 2-fluoro-2-deoxy-D-glucose avidity on positron emission tomography/computed tomography. Cancer. (2008) 113(11):3213–21. doi: 10.1002/cncr.23928
17. Purandare NC, Pramesh CS, Agarwal JP, Agrawal A, Shah S, Prabhash K, et al. Solitary pulmonary nodule evaluation in regions endemic for infectious diseases: do regional variations impact the effectiveness of fluorodeoxyglucose positron emission tomography/computed tomography. Indian J Cancer. (2017) 54(1):271–5. doi: 10.4103/0019-509X.219563
18. Taralli S, Scolozzi V, Foti M, Ricciardi S, Forcione AR, Cardillo G, et al. 18F-FDG PET/CT diagnostic performance in solitary and multiple pulmonary nodules detected in patients with previous cancer history: reports of 182 nodules. Eur J Nucl Med Mol Imaging. (2019) 46(2):429–36. doi: 10.1007/s00259-018-4226-6
19. Garcia-Velloso MJ, Bastarrika G, de-Torres JP, Lozano MD, Sanchez-Salcedo P, Sancho L, et al. Assessment of indeterminate pulmonary nodules detected in lung cancer screening: diagnostic accuracy of FDG PET/CT. Lung Cancer. (2016) 97:81–6. doi: 10.1016/j.lungcan.2016.04.025
20. Vesselle H, Grierson J, Muzi M, Pugsley JM, Schmidt RA, Rabinowitz P, et al. In vivo validation of 3’deoxy-3’-[(18)F]fluorothymidine ([(18)F]FLT) as a proliferation imaging tracer in humans: correlation of [(18)F]FLT uptake by positron emission tomography with ki-67 immunohistochemistry and flow cytometry in human lung tumors. Clin Cancer Res. (2002) 8:3315–23.12429617
21. Fatihoğlu E, Biri S, Aydın S, Ergün E, Koşar PN. MRI in evaluation of solitary pulmonary nodules. Turk Thorac J. (2019) 20(2):90–6. doi: 10.5152/TurkThoracJ.2018.18049
22. Fujimoto K. Usefulness of contrast-enhanced magnetic resonance imaging for evaluating solitary pulmonary nodules. Cancer Imaging. (2008) 8(1):36–44. doi: 10.1102/1470-7330.2008.0009
23. Yi CA, Jeon TY, Lee KS, Lee JH, Seo JB, Kim YK, et al. 3-T MRI: usefulness for evaluating primary lung cancer and small nodules in lobes not containing primary tumors. AJR Am J Roentgenol. (2007) 189:386–92. doi: 10.2214/AJR.07.2082
24. Wahidi MM, Govert JA, Goudar RK, Gould MK, McCrory DC. Evidence for the treatment of patients with pulmonary nodules: when is it lung cancer?: ACCP evidence-based clinical practice guidelines (2nd edition). Chest. (2007) 132(3 Suppl):94S–107. doi: 10.1378/chest.07-1352
25. Ginsberg MS, Griff SK, Go BD, Yoo HH, Schwartz LH, Panicek DM. Pulmonary nodules resected at video-assisted thoracoscopic surgery: etiology in 426 patients. Radiology. (1999) 213(1):277–82. doi: 10.1148/radiology.213.1.r99oc08277
26. Henschke CI, Yankelevitz DF, Libby DM, Pasmantier MW, Smith JP. Survival of patients with stage I lung cancer detected on CT screening. N Engl J Med. (2006) 355(17):1763–71. doi: 10.1056/NEJMoa060476
27. Travis WD, Brambilla E, Noguchi M, Nicholson AG, Geisinger KR, Yatabe Y, et al. International association for the study of lung cancer/American thoracic society/European respiratory society international multidisciplinary classification of lung adenocarcinoma. J Thorac Oncol. (2011) 6(2):244–85. doi: 10.1097/JTO.0b013e318206a221
28. Ye W, Gu W, Guo X, Yi P, Meng Y, Han F, et al. Detection of pulmonary ground-glass opacity based on deep learning computer artificial intelligence. Biomed Eng Online. (2019) 18(1):6. doi: 10.1186/s12938-019-0627-4
29. The National Lung Screening Trial Research Team. Reduced lung-cancer mortality with low-dose computed tomographic screening. N Engl J Med. (2011) 365(5):395–409. doi: 10.1056/NEJMoa1102873
30. Ardila D, Kiraly AP, Bharadwaj S, Choi B, Reicher JJ, Peng L, Tse D, Etemadi M, Ye W, Corrado G, Naidich DP End-to-end lung cancer screening with three-dimensional deep learning on low-dose chest computed tomography. Nat Med. (2019) 25(6):954–61. doi: 10.1038/s41591-019-0447-x
31. Jha AK, Mithun S, Rangarajan V, Wee L, Dekker A. Emerging role of artificial intelligence in nuclear medicine. Nucl Med Commun. (2021) 42(6):592–601. doi: 10.1097/MNM.0000000000001381
32. Hwang EJ, Nam JG, Lim WH, Park SJ, Jeong YS, Kang JH, et al. Deep learning for chest radiograph diagnosis in the emergency department. Radiology. (2021) 298(1):149–56. doi: 10.1148/radiol.2019191225
33. Sherkhane UB, Jha AK, Mithun S, Jaiswar V, Traverso A, Wee L, et al. PyRadGUI: a GUI based radiomics extractor software [version 1; peer review: 3 approved with reservations]. F1000Res. (2023) 12:259. doi: 10.12688/f1000research.129826.1
34. Jha AK, Mithun S, Purandare NC, Kumar R, Rangarajan V, Wee L, et al. Radiomics: a quantitative imaging biomarker in precision oncology. Nucl Med Commun. (2022) 43(5):483–93. doi: 10.1097/MNM.0000000000001543
35. Girvin F, Ko JP. Pulmonary nodules: detection, assessment, and CAD. AJR Am J Roentgenol. (2008) 191:1057–69. doi: 10.2214/AJR.07.3472
36. Roos JE, Paik D, Olsen D, Liu EG, Chow LC, Leung AN, et al. Computer-aided detection (CAD) of lung nodules in CT scans: radiologist performance and Reading time with incremental CAD assistance. Eur Radiol. (2010) 20:549–57. doi: 10.1007/s00330-009-1596-y
37. Jha AK, Mithun S, Sherkhane UB, Dwivedi P, Puts S, Osong B, et al. Emerging role of quantitative imaging (radiomics) and artificial intelligence in precision oncology. Explor Target Antitumor Ther. (2023) 4(4):569–82. doi: 10.37349/etat.2023.00153
38. Goo JM. A computer-aided diagnosis for evaluating lung nodules on chest CT: the current status and perspective. Korean J Radiol. (2011) 12:145–55. doi: 10.3348/kjr.2011.12.2.145
39. Jha AK, Mithun S, Sherkhane UB, Jaiswar V, Osong B, Purandare N, et al. Systematic review and meta-analysis of prediction models used in cervical cancer. Artif Intell Med. (2023) 139:102549. doi: 10.1016/j.artmed.2023.102549
40. Herder GJ, Van Tinteren H, Golding RP, Kostense PJ, Comans EF, Smit EF, et al. Clinical prediction model to characterize pulmonary nodules: validation and added value of 18F-fluorodeoxyglucose positron emission tomography. Chest. (2005) 128(4):2490–6. doi: 10.1378/chest.128.4.2490
41. Jha AK, Sherkhane UB, Mthun S, Jaiswar V, Purandare N, Prabhash K, et al. External validation of robust radiomic signature to predict 2-year overall survival in non-small-cell lung cancer. J Digit Imaging. (2023) 36(6):2519–31. doi: 10.1007/s10278-023-00835-8
42. Gong L, Jiang S, Yang Z, Zhang G, Wang L. Automated pulmonary nodule detection in CT images using 3D deep squeeze-and-excitation networks. Int J Comput Assist Radiol Surg. (2019) 14(11):1969–79. doi: 10.1007/s11548-019-01979-1
43. Beyer F, Zierott L, Fallenberg EM, Juergens KU, Stoeckel J, Heindel W, et al. Comparison of sensitivity and Reading time for the use of computer-aided detection (CAD) of pulmonary nodules at MDCT as concurrent or second reader. Eur Radiol. (2007) 17:2941–7. doi: 10.1007/s00330-007-0667-1
44. Zhao W, Zou C, Li C, Li J, Wang Z, Chen L. Development of a diagnostic model for malignant solitary pulmonary nodules based on radiomics features. Ann Transl Med. (2022) 10(4):201. doi: 10.21037/atm-22-462
45. Thawani R, McLane M, Beig N, Ghose S, Prasanna P, Velcheti V, et al. Radiomics and radiogenomics in lung cancer: a review for the clinician. Lung Cancer. (2018) 115:34–41. doi: 10.1016/j.lungcan.2017.10.015
46. Wilson R, Devaraj A. Radiomics of pulmonary nodules and lung cancer. Transl Lung Cancer Res. (2017) 6:86–91. doi: 10.21037/tlcr.2017.01.04
Keywords: lung cancer, SPN, pet scan, radiomics, random forest algorithm, SMOTE, cross-validation, bootstrap
Citation: Jha AK, Sherkhane UB, Purandare NC, Wee L, Dekker A and Rangarajan V (2025) Positron emission tomography imaging biomarker and artificial intelligence for the characterization of solitary pulmonary nodule. Front. Nucl. Med. 5:1611823. doi: 10.3389/fnume.2025.1611823
Received: 14 April 2025; Accepted: 23 June 2025;
Published: 4 July 2025.
Edited by:
Habouzit Vincent, Centre Hospitalier Universitaire (CHU) de Saint-Étienne, FranceReviewed by:
Catharina Lisson, Ulm University Medical Center, GermanyMurad Althobaiti, Imam Abdulrahman Bin Faisal University, Saudi Arabia
Pierre-Benoit Bonnefoy, CHU saint Etienne, France
Copyright: © 2025 Jha, Sherkhane, Purandare, Wee, Dekker and Rangarajan. This is an open-access article distributed under the terms of the Creative Commons Attribution License (CC BY). The use, distribution or reproduction in other forums is permitted, provided the original author(s) and the copyright owner(s) are credited and that the original publication in this journal is cited, in accordance with accepted academic practice. No use, distribution or reproduction is permitted which does not comply with these terms.
*Correspondence: Ashish Kumar Jha, YXNoaXNoLmt1bWFyLmpoYS43N0BnbWFpbC5jb20=