 Adrián Mosquera Orgueira1,2,3*
 Beatriz Antelo Rodríguez1,2,3
 Natalia Alonso Vence1,2Ángeles Bendaña López1,2
 José Ángel Díaz Arias1,2Nicolás Díaz Varela2Marta Sonia González Pérez1,2Manuel Mateo Pérez Encinas1,3José Luis Bello López1,2,3
- 1Health Research Institute of Santiago de Compostela (IDIS), Santiago de Compostela, Spain
- 2Division of Hematology, Complexo Hospitalario Universitario de Santiago de Compostela, SERGAS, Santiago de Compostela, Spain
- 3Department of Medicine, University of Santiago de Compostela, Santiago de Compostela, Spain
Chronic lymphocytic leukemia (CLL) is the most frequent lymphoproliferative syndrome in western countries. CLL evolution is frequently indolent, and treatment is mostly reserved for those patients with signs or symptoms of disease progression. In this work, we used RNA sequencing data from the International Cancer Genome Consortium CLL cohort to determine new gene expression patterns that correlate with clinical evolution.We determined that a 290-gene expression signature, in addition to immunoglobulin heavy chain variable region (IGHV) mutation status, stratifies patients into four groups with notably different time to first treatment. This finding was confirmed in an independent cohort. Similarly, we present a machine learning algorithm that predicts the need for treatment within the first 5 years following diagnosis using expression data from 2,198 genes. This predictor achieved 90% precision and 89% accuracy when classifying independent CLL cases. Our findings indicate that CLL progression risk largely correlates with particular transcriptomic patterns and paves the way for the identification of high-risk patients who might benefit from prompt therapy following diagnosis.
Introduction
Chronic lymphocytic leukemia (CLL) is a low-grade B-cell lymphoproliferative disease with an estimated yearly incidence in western countries of about 6.9 cases per 100,000 people (1) and remarkable variation between races. The incidence of CLL is higher in men than in women and it increases progressively from the age of 35 until the last decades of life (2). Currently, CLL treatment is delayed until disease progression (bone marrow failure, organomegaly, general symptoms, or high-grade lymphoma transformation) and in the case of refractory autoimmune phenomena (3, 4). Nevertheless, with the advent of new targeted treatments such as ibrutinib (5), idelalisib (6), and venetoclax (7), it is tempting to speculate that some individuals could benefit from early intervention immediately following diagnosis, when the tumoral mass is smaller and patients have a better physical condition. Thus, improved risk stratification for patients with CLL is needed.
Recent advances in CLL genomics have discovered new drivers of disease, many of which are associated with a different clinical evolution. Deletions (6p21, 6q15, 11q, 14q24, 15q15, 17p, 18p, and 20p; gains in 2p16, 5q24, and 8q24), trisomy 12, and gene mutations (TP53, ATM, NOTCH1, SF3B1, BIRC3, BRAF, POT1, ZNF292, NFKB2, MGA, IRF4, DDX3X, ZMYM3, and FUBP1)have been repeatedly observed in the CLL genome and are linked to rapid disease progression (8) Nevertheless, immunoglobulin heavy chain variable region (IGHV) mutation status, which is an indirect measure of the tumor lymphocytes' maturation stage (9), is among the most important single predictive factor known to date (10). IGHV unmutated patients show remarkably worse prognosis than IGHV mutated patients (10, 11) and only a few other genomic factors have proven to be associated with clinical evolution independent of this variable. Lymphocyte maturation is such an important indicator that DNA methylation status has been used to classify CLL into three different groups that resemble different B cell maturation stages (naive B cell, intermediate, and memory B cell). This classification was shown to outperform IGHV status at predicting time to first treatment (TTT) (12).
Mutations, genomic aberrations, and DNA methylation patterns induce transcriptomic changes that can be measured using RNA sequencing (RNAseq), a technique that offers an opportunity to identify new biomarkers for disease progression and drug response prediction (13–15). In fact, previous efforts to improve CLL risk stratification based on RNAseq data have demonstrated impressive results (16), but the clinical application is difficult due to the expense of extensive technical and bioinformatics efforts. Therefore, there is a need for smaller transcriptomics patterns correlated with disease evolution for medical use.
In this study, we performed machine-learning based Gaussian mixture model clustering on a subgroup of genes significantly associated with TTT in order to identify transcriptional clusters with clinical implications. We studied TTT due to the lack of treatment uniformity in the International Cancer Genome Consortium (ICGC) CLL cohort and because it is a variable associated with overall survival (17). We tested our results on a 196 patient cohort and validated its clinical significance in an independent 79 patient cohort. The overall results delineated two IGHV-independent transcriptional clusters that stratify patients according to their risk of treatment initiation. Furthermore, we demonstrated that machine learning algorithms using gene expression data can predict patient need for treatment in the first 5 years following diagnosis. We anticipate that our findings will improve the identification of high-risk CLL patients following diagnosis.
Materials and Methods
Data Sources and Patient Characteristics
We applied for access to the ICGC's CLL sequencing data (18) deposited in the European Genome-Phenome Database (EGA) (19). The Data Access Committee approved access to this data under DACO-1040945. Two CLL RNA-seq cohorts were uploaded in two stages with the following accession codes: EGAD00001001443 and EGAD00001000258.
The first cohort (EGAD00001001443, hereafter study cohort) contains RNAseq data and from CLL-purified cells of 196 individuals along with clinical data. The cohort was composed of 169 CLL, 22 monoclonal B cell lymphocytosis (MBL), and five small lymphocytic lymphoma (SLL) samples. There were 132 IGHV mutated cases and 64 IGHV unmutated cases in 119 males and 77 females. By staging at diagnosis, there were 22 MBL cases, 151 Binet Stage A cases, 14 Binet Stage B cases, and 8 Binet C stage cases.
The second cohort (EGAD00001000258, hereafter validation cohort) is composed of RNAseq data of CLL-purified cells from 98 individuals, of which 79 (55 males and 24 females) have publicly available phenotypic information. In this cohort there were 72 CLL, 4 SLL, and 3 MBL samples. 45 of the patients had mutated IGHV and 34 had unmutated IGHV. By staging at diagnosis, there were 3 MBL, 72 Binet Stage A, 3 Binet Stage B, and 1 Binet Stage C cases.
A summary of the patient characteristics of both cohorts can be consulted in Table 1.
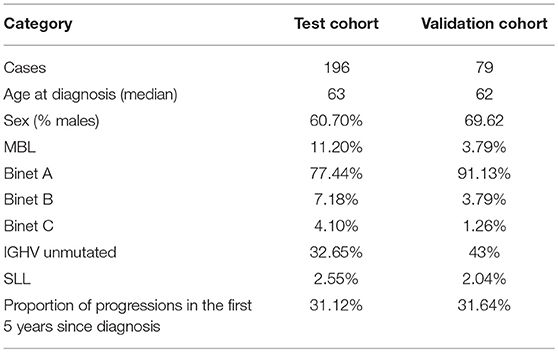
Table 1. Patient characteristics for the test and validation cohorts.
Data Preprocessing and Alignment
RNAseq paired-end data were obtained from Illumina paired-end sequencing performed by the ICGC CLL consortium as described by Ferreira et al. (16) Illumina adapters were removed using cutadapt (20) and alignment to the human reference genome (GRCh37) was performed using Hisat2 (21) with default specifications. We used the Hisat2-provided Hierarchical Graph FM index for GRCh37 with SNP and Ensembl transcript information. Bam files were sorted and indexed using samtools (22).
Gene Expression Estimation
RNAseq bam files were processed in R (23) according to the RNAseq gene expression protocol developed by Love et al. (24) Briefly, bam files were read using Rsamtools, (25) followed by gene-level expression estimation using the SummarizeOverlaps function from the GenomicAlignments package. (26) Gene models in GTF format were downloaded from Ensembl (GRCh37.75 version) (27). Genes with a median read count below one were discarded.
Statistical Analysis
We analyzed gene expression association with CLL's TTT using cox regression implemented in the survival package (28, 29). In this model we included the covariates donor sex and CLL stage (MBL, Binet Stage A, Binet Stage B, and Binet Stage C). Time to Treatment was calculated as the period between CLL diagnosis and the initiation of the first treatment for CLL. The day of last follow-up was used for right censoring the data of patients with incomplete follow-up.
Clustering was performed using the Mclust package (30) with default parameters. Briefly, Mclust infers the likeliest data clusters based on Gaussian Mixture Modeling fitted by an Expectation-Maximization (GMM-EM) algorithm.
Those genes with significant association with TTT in the study cohort (cox regression false discovery rate [FDR] below 5%) were selected as our initial list of genes. Variable selection was performed by adding one new gene in p-value ascending order to the model (starting with the first two most significant genes until reaching the top at 2,198 genes [FDR < 5%]) and computing the most likely clusters. For the sake of simplicity, we discarded the 25% least variable genes, the 50% least expressed genes and those with a high (>0.9) Spearman's rank correlation with any other gene in the input data. In the case of a highly correlated pair of genes, the one with the lowest p-value was discarded. In each iteration we forced Mclust to calculate the two most likely groups of samples in our data, and to select the best model according to the maximal Bayesian Information Criterion (BIC). Association with TTT calculated using cox regression (survival package), including IGHV mutation status as covariate in each iteration. P-value adjustment was performed with the Bonferroni method.
Machine Learning Ensembl Construction
For IGHV status and need of treatment at 5 years prediction we ran boosted trees analysis using BigML applications (31) with a 2,000 tree node threshold. We chose 5 years due to the following reasons: (1) it is important to differ which patients will have progression in the first years since diagnosis; and (2) the number of cases progressing in earlier years was too small in order to train a good classificator. Varying percentages of learning rates were tested. The best model was selected based on receiver operating characteristic (ROC) curves, Precision-Recall curves, and Kolmogorov-Smirnov statistics.
Results
Genes Associated With Time to Treatment and Clusterization
A cox regression model was constructed with gene expression, donor sex and CLL stage at diagnosis as independent variables. 2,198 genes were found to be significantly associated with TTT (FDR < 5%) in the study cohort.
Patient clusterization based on gene expression data using a GMM-EM algorithm retrieved 19 sets of genes that clustered samples into two groups with significant associations with TTT when adjusted for IGHV status (Bonferroni-adjusted p-value < 0.01) (Supplemental Table 1). The most significant cluster (cluster 2) contained 290 transcripts (Figure 1, Supplemental Table 2) and achieved an association p-value of 6.4 × 10⁻⁷ (Bonferroni p-value 1.4 × 10⁻³) with the TTT variable adjusted for IGHV mutation status (Figure 2). A significant association was confirmed in the validation cohort (IGHV adjusted p-value 3.05 × 10⁻³) (Figures 2, 3).
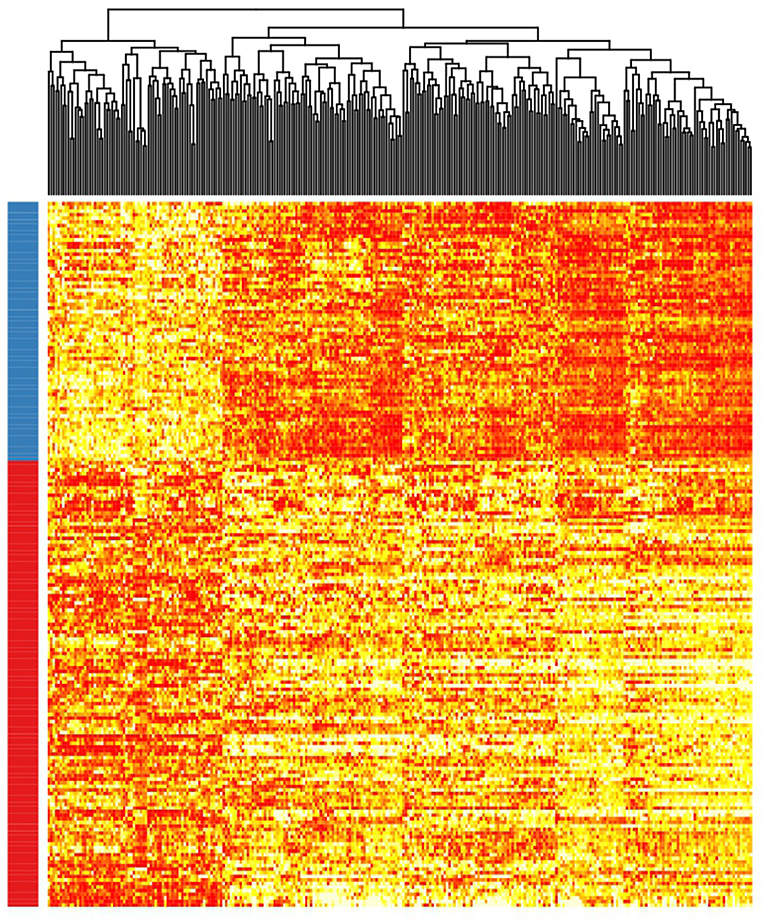
Figure 1. Heatmap showing the rank-transformed distribution of expression values for the 290 genes in the study cohort. Red-labeled samples on the left bar petain to C1 and blue-labeled samples pertain to C2.
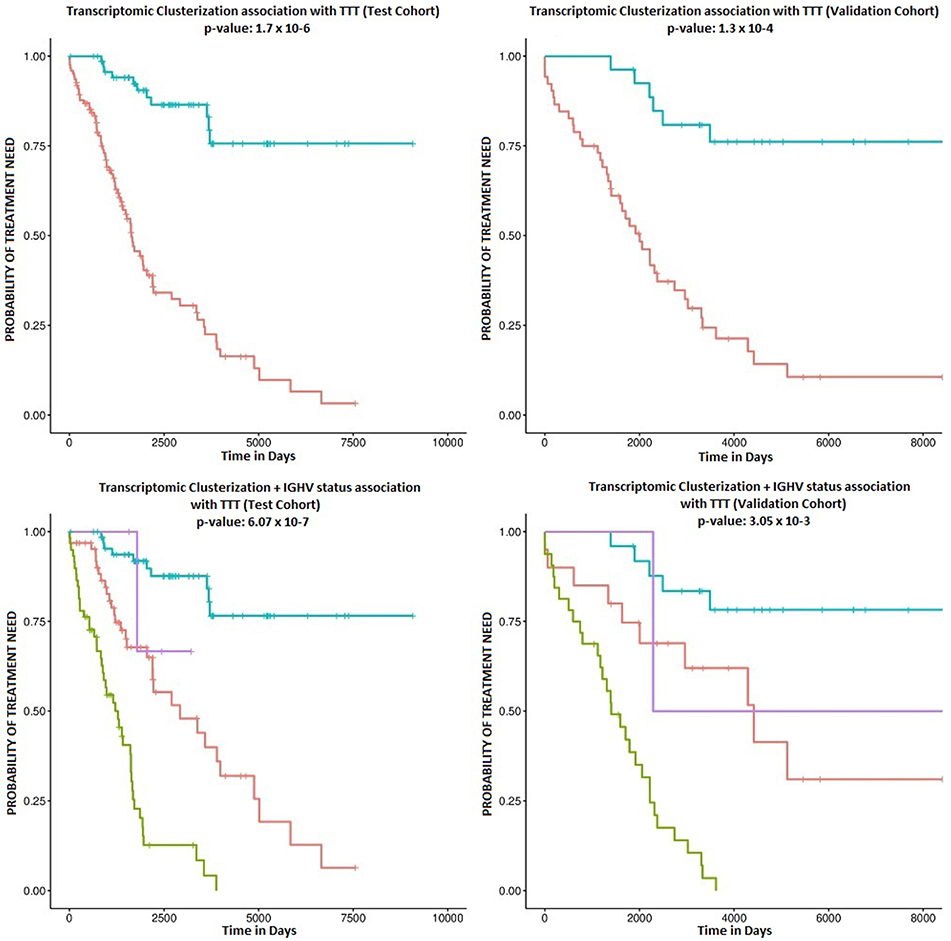
Figure 2. Kaplan-Meier survival plots. The upper plots show the association of C1 (red curve) and C2 (blue curve) with TTT in the study (left) and validation cohorts (right). Corresponding p-values are 1.7 × 10⁻⁶ and 1.3 × 10⁻⁴. The lower plots show the association with TTT stratified by IGHV mutation status in the study (left) and validation cohorts (right). The blue line indicates C2 samples with mutated IGHV, the purple line indicates C2 samples with unmutated IGHV, the red line indicates C1 samples with mutated IGHV, and the green line refers to C1 samples with unmutated IGHV.
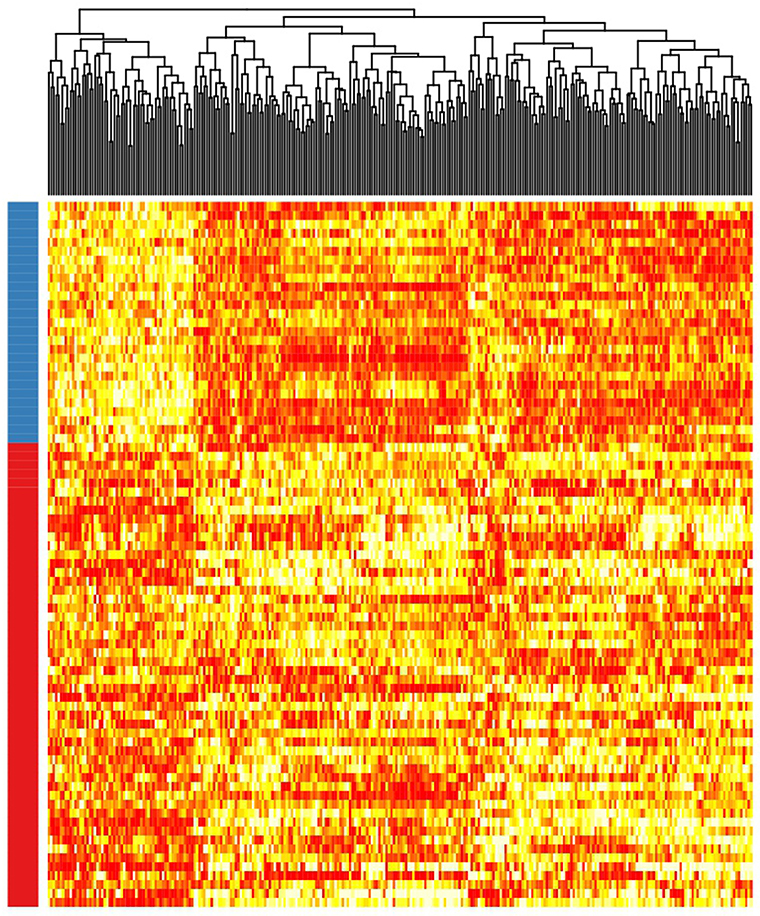
Figure 3. Heatmap showing the rank-transformed distribution of expression values for the 290 genes in the validation cohort. Red-labeled samples on the left bar petain to C1 and blue-labeled samples pertain to C2.
According to the selected classificator, patients in cluster two (C2) had a more favorable prognosis than patients in cluster one (C1) (Hazard Ratios (HR) of−1.70 and−1.41 in the test and validation cohorts, respectively), independently of IGHV mutation status. Among the study cohort, roughly 36.7% of patients belonged to C2, while 34.1% of patients in the validation cohort clustered within C2. C2 involved 51.5% of IGHV-mutated patients and 6.4% of IGHV-unmutated patients in the study cohort, as well as 55.5% of IGHV-mutated patients and 5.8% of IGHV-unmutated patients in the validation cohort.
Machine Learning for Treatment Free Survival Prediction
We were interested in a machine learning (ML) classifier that could predict which patients would require CLL therapy in the first years following diagnosis. We constructed model ensembles with all genes associated with TTT in Cox regression at a FDR of 5%. We also tested different learning rates (0.5, 1, 2.5, 5, and 10%). 222 patients had a follow-up period >5years or had been treated in the first 5 years following diagnosis, and we divided them into a training set (80% of patients, composed of 146 patients from the study cohort and 31 patients from the validation cohort) and a test set (20% of patients, composed of 45 patients from the validation cohort). ROC AUC and Precision-Recall AUC plots were evaluated to select the best results.
The best model used a 2.5% learning rate and 2,000 tree nodes. It achieved 90% precision at identifying patients that needed treatment in 5 years with 69.23% recall, and 88.57% precision at identifying those patients that did not require treatment in 5 years with 96.88% recall. We only detected 1 false positive case (3.1% False Positive Rate) and 4 false negatives (30% False Negative Rate). Average precision was 89.29%, accuracy was 88.89% and ROC area under the curve (AUC) was 0.911 (Figure 4 and Table 2). Precision-Recall AUC was 0.860 and 0.959 for predicting which patients would or would not need treatment within this period, respectively. In each case, the results mostly overlapped with the area under the convex hull (AUCH).
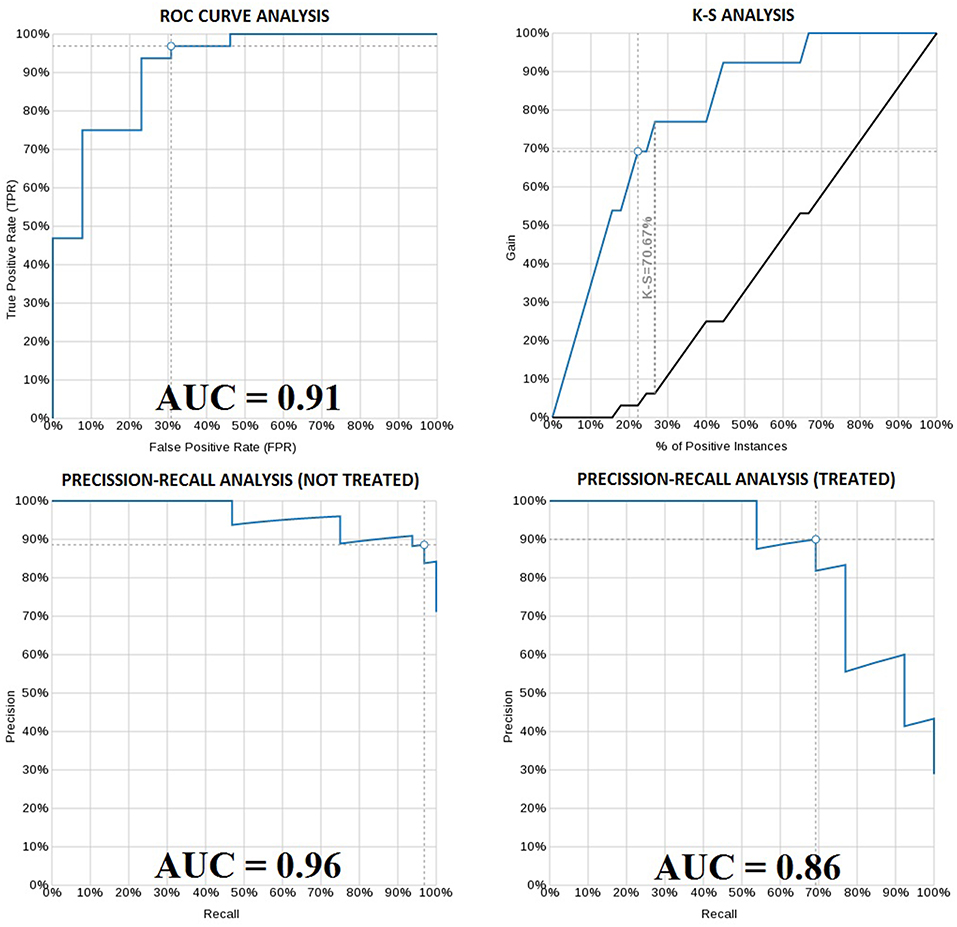
Figure 4. ROC curve of the boosted-tree Ensembl model for 5 year treatment need prediction (upper left). Kolmogorov-Smirnov plot for the same model (upper right). Precision-Recall plot for the 5 year not-treated (lower left) and treated (lower right) patients according to the same model. White dots in each graph indicate the probability threshold (in this case 50%), which is the point reflecting the best classification accuracy of the patients.
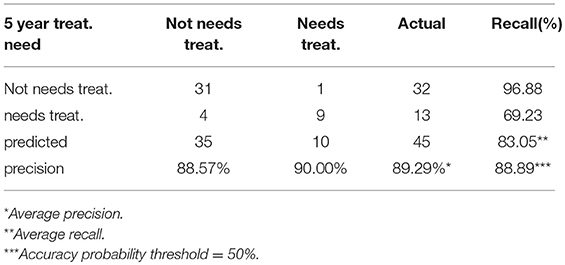
Table 2. Confusion Matrix for the boosted-tree Ensembl model predicting the 5 year need of treatment.
Discussion
The main aim of this study was to identify new transcriptomic patterns in order to improve CLL patient risk stratification. We used the GMM-EM algorithm to stratify patients in two clusters with remarkably different clinical behavior based on the expression of 290 genes, and we observed that this pattern was independent of IGHV mutation status. Interestingly, we identified a group of CLL patients with mutated IGHV and a low-risk transcriptomic profile that only need treatment in approximately 25% of the cases during disease evolution. Two additional groups (one composed of patients with mutated IGHV and a high-risk transcriptomic profile and the second composed of unmutated IGHV patients with a low-risk transcriptomic profile) have similar intermediate evolution, while a final group (composed of patients with unmutated IGHV and an adverse transcriptomic profile) has the highest probability of treatment need in the first years following diagnosis. These results are concordant with previous reports in the field. For example, Yepes et al. (32) reported a division of CLL cases in two groups based on microarray transcriptome characterization through unsupervised clustering analysis, which was validated in 4 independent cohorts. Similarly, Friedman et al. (33) described a 180 probe classifier based on microarray data that also divided two clusters of CLL patients independently of IGHV mutation status. Our findings are also similar to those published by Ferreira et al. (16), who described two gene expression clusters that show IGHV mutation-independent association with TTT using an early release of the ICGC CLL cohort. Nevertheless, there are remarkable differences between our analysis and that of Ferreira et al, Yepes et al. and Friedman et al. Firstly, our clusterization is based on a transcriptional pattern of a small subgroup of genes that facilitates its future applicability, whilst those of Ferreira et al. and Yepes et al. are based on whole transcriptome analysis. Secondly, our classifier is based on RNAseq data, a technology that has outperformed microarray analysis in most fields. With the use RNAseq it will be possible to couple transcriptome clusterization with targeted gene mutation detection, stereotyped B cell receptor expression or IGHV hypermutation status analysis.
We also describe a novel artificial intelligence algorithm that can predict a CLL patient's need for therapy during the first 5 years following diagnosis with high precision and accuracy. This is in line with other ML applications to oncologic malignancies that are starting to change paradigms in patient risk stratification and drug response prediction. For example, Aziz et al. (34) recently reported the identification of a ML model that integrates clinical and genomic data from patients with myelodysplastic syndrome (MDS). This model outperformed all commonly used prediction models in the field of MDS. Similarly, Yousefi et al. (35) used bayesian-optimized deep learning for survival prediction in pan-cancer analysis, showing not only better performance than other state-of-the-art methods, but also improved predictability of cancer survival through transfer learning in different types of cancer genomic data. Thus, it is likely that ML-driven algorithms applied to genomic and transcriptomic data will be used in the near future for the identification of “smoldering” CLLs that may benefit from early intervention.
RNAseq is a powerful technique that can sequence the whole transcriptome at an increasingly lower cost. Targeted RNAseq is being developed for clinical application, with the additional possibility of testing for gene mutations and fusion genes in the same technique. Therefore, defining reproducible gene expression patterns with clinical implications is a strategy that can close the gap between research and the clinical practice. Here we present patterns of gene expression that can improve CLL patient risk stratification with a relatively small set of the transcriptome. These results may pave the way for the design of new treatment strategies involving early CLL treatment in high-risk patients before disease progression.
Author Contributions
AMO designed the study performed research. AMO, BAR, JDA, and JBL analyzed the data. AMO wrote the paper. NAV, ABL, NDV, MGP, and MPE reviewed the paper.
Funding
The publication costs associated with this manuscript have been paid by Roche Pharmaceuticals. The funder played no role in the study design, the collection, analysis or interpretation of data, the writing of this paper or the decision to submit it for publication.
Conflict of Interest Statement
The authors declare that the research was conducted in the absence of any commercial or financial relationships that could be construed as a potential conflict of interest.
Acknowledgments
The authors thank the ICGC consortium for sharing the genomic data and the Centro de Supercomputación de Galicia (CESGA) for approving the access to informatics facilities with technical support. We would also like to thank BigML Inc., particularly Francisco J. Martín, for access to machine learning applications. The content of this paper is part of the doctoral thesis of AMO to obtain a PhD at the Department of Medicine, University of Santiago de Compostela.
Supplementary Material
The Supplementary Material for this article can be found online at: https://www.frontiersin.org/articles/10.3389/fonc.2019.00079/full#supplementary-material
Supplemental Table 1. This table represents the original 19 clusters with Bonferroni p-values < 0.01.
Supplemental Table 2. List of the 290 genes used for C1 vs. C2 clusterization.
References
1. Zhao Y, Wang Y, Ma S. Racial differences in four leukemia subtypes: comprehensive descriptive epidemiology. Sci Rep. (2018) 8:548. doi: 10.1038/s41598-017-19081-4
2. Dores GM, Anderson WF, Curtis RE, Landgren O, Ostroumova E, Bluhm EC, et al. Chronic lymphocytic leukaemia and small lymphocytic lymphoma: overview of the descriptive epidemiology. Br J Haematol. (2007) 139:809–19. doi: 10.1111/j.1365-2141.2007.06856.x
3. Mozas P, Rivas-Delgado A, Baumann T, Villamor N, Ortiz-Maldonado V, Aymerich M, et al. Analysis of criteria for treatment initiation in patients with progressive chronic lymphocytic leukemia. Blood Cancer J. (2018) 8:10. doi: 10.1038/s41408-017-0044-5
4. Eichhorst B, Robak T, Montserrat E, Ghia P, Hillmen P, Hallek M, et al. Chronic lymphocytic leukaemia: ESMO Clinical Practice Guidelines for diagnosis, treatment and follow-up. Ann Oncol. (2015) 26 (Suppl. 5):v78–84. doi: 10.1093/annonc/mdv303
5. Burger JA, Tedeschi A, Barr PM, Robak T, Owen C, Ghia P, et al. Ibrutinib as Initial therapy for patients with chronic lymphocytic leukemia. N Engl J Med. (2015) 373:2425–37. doi: 10.1056/NEJMoa1509388
6. Brown JR, Byrd JC, Coutre SE, Benson DM, Flinn IW, Wagner-Johnston ND, et al. Idelalisib, an inhibitor of phosphatidylinositol 3-kinase p110δ, for relapsed/refractory chronic lymphocytic leukemia. Blood (2014) 123:3390–7. doi: 10.1182/blood-2013-11-535047
7. Roberts AW, Davids MS, Pagel JM, Kahl BS, Puvvada SD, Gerecitano JF, et al. Roberts AW, Davids MS, Pagel JM, et al. Targeting BCL2 with venetoclax in relapsed chronic lymphocytic leukemia. N Engl J Med. (2016) 374:311–22. doi: 10.1056/NEJMoa1513257
8. Puente XS, Beà S, Valdés-Mas R, Villamor N, Gutiérrez-Abril J, Martín-Subero JI, et al. Non-coding recurrent mutations in chronic lymphocytic leukaemia. Nature (2015) 526:519–24. doi: 10.1038/nature14666
9. Oakes CC, Seifert M, Assenov Y, Gu L, Przekopowitz M, Ruppert AS, et al. DNA methylation dynamics during B cell maturation underlie a continuum of disease phenotypes in chronic lymphocytic leukemia. Nat Genet. (2016) 48:253–64. doi: 10.1038/ng.3488
10. Damle RN, Wasil T, Fais F, Ghiotto F, Valetto A, Allen SL, et al. Ig V gene mutation status and CD38 expression as novel prognostic indicators in chronic lymphocytic leukemia. Blood (1999) 94:1840–7.
11. Hamblin TJ, Davis Z, Gardiner A, Oscier DG, Stevenson FK. Unmutated Ig V(H) genes are associated with a more aggressive form of chronic lymphocytic leukemia. Blood (1999) 94:1848–54.
12. Queirós AC, Villamor N, Clot G, Martinez-Trillos A, Kulis M, Navarro A, et al. A B-cell epigenetic signature defines three biologic subgroups of chronic lymphocytic leukemia with clinical impact. Leukemia (2015) 29:598–605. doi: 10.1038/leu.2014.252
13. Maag JLV, Fisher OM, Levert-Mignon A, Kaczorowski DC, Thomas ML, Hussey DJ, et al. Novel aberrations uncovered in barrett's esophagus and esophageal adenocarcinoma using whole transcriptome sequencing. Mol Cancer Res. (2017) 15:1558–69. doi: 10.1158/1541-7786.MCR-17-0332
14. Wang Q, Gan H, Chen C, Sun Y, Chen J, Xu M, et al. Identification and validation of a 44-gene expression signature for the classification of renal cell carcinomas. J Exp Clin Cancer Res. (2017) 36:176. doi: 10.1186/s13046-017-0651-9
15. Zhang YH, Huang T, Chen L, Xu Y, Hu Y, Hu LD, et al. Identifying and analyzing different cancer subtypes using RNA-seq data of blood platelets. Oncotarget (2017) 8:87494–511. doi: 10.18632/oncotarget.20903
16. Ferreira PG, Jares P, Rico D, Gómez-López G, Martínez-Trillos A, Villamor N, et al. Transcriptome characterization by RNA sequencing identifies a major molecular and clinical subdivision in chronic lymphocytic leukemia. Genome Res. (2014) 24:212–26. doi: 10.1101/gr.152132.112
17. Ammann EM, Shanafelt TD, Wright KB, McDowell BD, Link BK, Chrischilles EA. Updating survival estimates in patients with chronic lymphocytic leukemia or small lymphocytic lymphoma (CLL/SLL) based on treatment-free interval length. Leuk Lymphoma (2018) 59:643–9. doi: 10.1080/10428194.2017.1349905
18. Ramsay AJ, Martínez-Trillos A, Jares P, Rodríguez D, Kwarciak A, Quesada V. Next-generation sequencing reveals the secrets of the chronic lymphocytic leukemia genome. Clin Transl Oncol. (2013) 15:3–8. doi: 10.1007/s12094-012-0922-z
19. Lappalainen I, Almeida-King J, Kumanduri V, Senf A, Spalding JD, Ur-Rehman S, et al. The European Genome-phenome Archive of human data consented for biomedical research. Nat Genet. (2015) 47:692–5. doi: 10.1038/ng.3312
20. Martin M. Cutadapt Removes Adapter Sequences From High-Throughput Sequencing Reads. EMBnet.journal, [S.l.], v. 17, n. 1, p. pp. 10-12, may. (2011) ISSN 2226-6089. Available online at: < http://journal.embnet.org/index.php/embnetjournal/article/view/200> (accessed February 15, 2018).
21. Kim D, Langmead B, Salzberg SL. HISAT: a fast spliced aligner with low memory requirements. Nat Methods. (2015) 12:357–60. doi: 10.1038/nmeth.3317
22. Li H, Handsaker B, Wysoker A, Fennell T, Ruan J, Homer N, et al. The Sequence Alignment/Map format and SAMtools. Bioinformatics (2009) 25:2078–9. doi: 10.1093/bioinformatics/btp352
23. R Development Core Team R: A Language and Environment for Statistical Computing. Vienna, Austria: the R Foundation for Statistical Computing. ISBN: 3-900051-07-0. Available online at: http://www.R-project.org/ (2011)
24. Love MI, Anders S, Kim V, Huber W. RNA-seq Workflow: Gene-level Exploratory Analysis and Differential Expression. Bioconductor. Available online at: https://www.bioconductor.org/help/workflows/rnaseqGene/ (2017)
25. Morgan M, Pagès H, Obenchain V, Hayden N. Rsamtools: Binary alignment (BAM), FASTA, Variant Call (BCF), and Tabix File Import. R package version 1.30.0, Available online at: http://bioconductor.org/packages/release/bioc/html/Rsamtools.html (2017)
26. Lawrence M, Huber W, Pagès H, Aboyoun P, Carlson M, Gentleman R., et al. Software for computing and annotating genomic ranges. PLoS ComputBiol. (2013) 9:e1003118. doi: 10.1371/journal.pcbi.1003118
27. Yates A, Akanni W, Amode MR, Barrell D, Billis K, Carvalho-Silva D, et al. Ensembl 2016. Nucleic Acids Res. (2016) 44(D1):D710–6. doi: 10.1093/nar/gkv1157
28. Therneau T (2015). A Package for Survival Analysis in S. version 2.38, Available online at: https://CRAN.R-project.org/package=survival
29. Therneau TM, Grambsch PM. Modeling Survival Data: Extending the Cox Model. New York, NY: Springer (2000) doi: 10.1007/978-1-4757-3294-8
30. Scrucca L, Fop M, Murphy TB, Raftery AE. mclust 5: clustering, classification and density estimation using gaussian finite mixture models. R J. (2016) 8:289–317.
31. BigML is Machine Learning made easy, viewed, 15 February 2018, Available, online at: https://bigml.com
32. Yepes S, Torres MM, Andrade RE. Clustering of expression data in chronic lymphocytic leukemia reveals new molecular subdivisions. PLoS ONE (2015) 10:e0137132. doi: 10.1371/journal.pone.0137132
33. Friedman DR, Weinberg JB, Barry WT, Goodman BK, Volkheimer AD, Bond KM, et al. A genomic approach to improve prognosis and predict therapeutic response in chronic lymphocytic leukemia. Clin Cancer Res. (2009) 15:6947–55. doi: 10.1158/1078-0432.CCR-09-1132
34. Nazha A, Komrokji RS, Barnard J, Al-Issa K., Padron E., Madanat Y. F, et al. A personalized prediction model to risk stratify patients with myelodysplastic syndromes (MDS). Blood (2017) 130(Suppl 1):160.
Keywords: chronic lymphocytic leukemia, time to treatment prediction, gene expression, RNAseq, machine learning, prognostic factors, IGHV
Citation: Mosquera Orgueira A, Antelo Rodríguez B, Alonso Vence N, Bendaña López Á, Díaz Arias JÁ, Díaz Varela N, González Pérez MS, Pérez Encinas MM and Bello López JL (2019) Time to Treatment Prediction in Chronic Lymphocytic Leukemia Based on New Transcriptional Patterns. Front. Oncol. 9:79. doi: 10.3389/fonc.2019.00079
Received: 23 November 2018; Accepted: 29 January 2019;
Published: 15 February 2019.
Edited by:
Adam Finn Binder, Thomas Jefferson University, United StatesReviewed by:
Michael Diamantidis, University Hospital of Larissa, GreeceJerry Polesel, Centro di Riferimento Oncologico di Aviano (IRCCS), Italy
Copyright © 2019 Mosquera Orgueira, Antelo Rodríguez, Alonso Vence, Bendaña López, Díaz Arias, Díaz Varela, González Pérez, Pérez Encinas and Bello López. This is an open-access article distributed under the terms of the Creative Commons Attribution License (CC BY). The use, distribution or reproduction in other forums is permitted, provided the original author(s) and the copyright owner(s) are credited and that the original publication in this journal is cited, in accordance with accepted academic practice. No use, distribution or reproduction is permitted which does not comply with these terms.
*Correspondence: Adrián Mosquera Orgueira, adrian.mosquera@live.com