 Xinyi Zhao1
 Wenyan Cui
 Ming D. Li
- 1State Key Laboratory for Diagnosis and Treatment of Infectious Diseases, Collaborative Innovation Center for Diagnosis and Treatment of Infectious Diseases, The First Affiliated Hospital, Zhejiang University School of Medicine, Hangzhou, China
- 2Research Center for Air Pollution and Health, Zhejiang University, Hangzhou, China
- 3Institute of Neuroimmune Pharmacology, Seton Hall University, South Orange, NJ, United States
Background: Gallbladder cancer (GBC) is a rare and aggressive malignancy of the biliary tract with a dismal survival rate. Effective biomarkers and therapeutic targets are urgently needed.
Methods: We analyzed gene expression profiles of GBC to identify differentially expressed genes (DEGs) and then used these DEGs to identify functional module biomarkers based on protein functional interaction (FI) networks. We further evaluated the module-gene protein expression and clinical significance with immunohistochemistry staining (IHC) in a tissue microarray (TMA) from 80 GBC samples.
Results: Five functional modules were identified. Module 0 included classical cancer signaling pathways, such as Ras and PI3K-Akt; and modules 1–4 included genes associated with muscle cells, fibrinogen, extracellular matrix, and integrins, respectively. We validated the expression of LIFR, PIK3R1, and MMP12, which were hubs or functional nodes in modules. Compared with paired peritumoural tissues, we found that the expression of LIFR (P = 0.002) and PIK3R1 (P = 0.046) proteins were significantly downregulated, and MMP12 (P = 0.006) was significantly upregulated. Further prognostic analysis showed that patients with low expression of LIFR had shorter overall survival than those with high expression (log-rank test P = 0.028), the same trend as for PIK3R1 (P = 0.053) and MMP12 (P = 0.006). Multivariate analysis indicated that expression of MMP12 protein (hazard ratio [HR] = 0.429; 95% confidence interval [CI] 0.198, 0.930; P = 0.032) was one of the significant independent prognostic factors for overall survival.
Conclusions: We found a highly reliable FI network, which revealed LIFR, PIK3R1, and MMP12 as novel prognostic biomarker candidates for GBC. These findings could accelerate biomarker discovery and therapeutic development in this cancer.
Introduction
Gallbladder cancer (GBC), the sixth most common gastrointestinal cancer, is an uncommon but challenging disease. Its incidence has recently increased highly worldwide (1). The risk factors for GBC include sex, aging, obesity, chronic cholecystitis, and cholelithiasis (2, 3). Because of the lack of an effective early diagnostic method, the disease often is not diagnosed until it has reached an advanced stage, when the prognosis generally is dismal, with a median survival of <1 year (3). Despite multiple studies on methods of molecular diagnosis and prediction of clinical outcomes (2), progress has been limited. More precise markers with better sensitivity and specificity are greatly needed for diagnosis and development of novel therapeutic strategies for GBC.
Recently, various network-based analytic approaches have been employed to search for signatures in microarray gene expression datasets that are related to clinical outcomes for several types of cancer (4–7). For example, Wu et al. used modules derived from a functional interaction (FI) network to identify a 75-gene signature associated with patient survival in ovarian cancer (8). Another study has indicated that multi-gene signatures are more effective for prediction than are single gene expression values (9).
To acquire further insights into the molecular mechanisms of GBC, we utilized gene expression profiles of five such cancers and five adjacent non-cancerous tissues using the Gene Expression Omnibus (GEO) database and analyzed them by constructing a protein FI network. We identified sets of genes that were either significantly downregulated or upregulated as functional module biomarkers for GBC. Finally, LIFR, PIK3R1, and MMP12 were confirmed as hubs or functional nodes in modules in 80 GBC patients using immunohistochemical (IHC) technique. The relations between expression of the three proteins and patient clinical characteristics and post-operative follow-up was revealed by statistical analysis.
Materials and Methods
Microarray Data
The gene expression profiles of five GBCs and five matched adjacent non-cancerous tissues were downloaded from GEO with accession number GSE62335 (10). Gene expression was analyzed using an Affymetrix Human Gene 2.0 ST array (Affymetrix Inc., Santa Clara, CA, USA). The raw CEL data were downloaded, and Robust Multi-Array Average (RMA) methods and the “Oligo” package from BioConductor (http://www.bioconductor.org) were used to normalize the data and annotate the probe information.
Initial Data Processing and Identification of DEGs
Normalized signal intensity data were imported into BRB-ArrayTools (v. 4.5; http://linus.nci.nih.gov/BRB-ArrayTools.html) for initial processing. We excluded those genes with more than 50% of data missed. We identified differentially expressed genes (DEGs) using a paired t-test with a random variance model, which is an improvement over the standard separate t-test when it is applied in small-sample microarray experiments (11). An adjusted-P value of 0.05 was considered nominally significant for each tested gene. Only genes with a fold change ≥2 and an adjusted-P value of < 0.05 were selected as DEGs.
Construction of an FI Network
A total of 217,249 pairs of FIs were downloaded from Reactome (v. 2014; http://www.reactome.org) (12). These pairwise relations are derived from datasets of protein–protein interactions from BioGrid (13), the Database of Interacting Proteins (14), the Human Protein Reference Database (15), I2D (16), IntACT (17), and MINT (18), as well as from gene co-expression data derived from multiple high-throughput techniques, including yeast two-hybrid assays, mass spectrometry pull-down experiments, and DNA microarrays (19). The above interaction information was imported into Cytoscape software (v. 3.2.1; http://www.cytoscape.org) to construct the FI network (20).
Pathway and Gene Ontology (GO) Term Enrichment Analysis for the FI Network
The ReactomeFIViz app was used in Cytoscape for pathway and GO enrichment analysis (21). The sources of pathway annotations included CellMap (http://www.pathwaycommons.org/pc/dbSnapshot.do?snapshot_id=8), Reactome (12), Kyoto Encyclopedia of Genes and Genomes (KEGG) (22), Panther Pathways (23), NCI–PID (24), and BioCarta (http://www.biocarta.com/genes/index.asp). A false discovery rate (FDR) of <0.05 was accepted as the cut-off criterion.
Identification of a Network-Based Functional Module
The Microarray Data Analysis tool from ReactomeFIViz was used for network-based functional analysis (21). The gene expression data were first loaded into this bioinformatics tool. Second, correlations among the genes were calculated in the whole FIs network. Finally, we applied the Markov cluster algorithm (MCL) to generate modules by selecting the threshold of a module size or an average correlation value. To control the size of network modules generated from MCL clustering, we used 5.0 as the inflation coefficient. For GBC data analysis, we chose MCL modules of size three or greater and an average Pearson correlation coefficient (PCC) ≥ 0.25 and chose an absolute value for edge weights. Nodes in different network modules are shown in different colors. Pathway or GO term enrichment analysis was used for each individual network module. We selected a size ≥3 as a cutoff to filter out network modules and chose an FDR <0.05 as a cutoff for viewing enriched pathways or GO terms.
Patient Samples
For tissue microarray (TMA) detection, 80 human GBC specimens, 20 of which had matched non-tumor tissues, were collected between 2007 and 2012 at Taizhou People's Hospital of China. All tissues were stored at the Biobank Center of National Engineering Center for Biochips at Shanghai in China. None of these patients received any preoperative anticancer therapy or post-operative adjuvant chemotherapy. The clinical pathologic features of patients are given in Table S1. The tumor differentiation grade and clinical stages were classified according to the American Joint Committee on Cancer (AJCC) TNM Classification (7th edition). We calculated the follow-up time from the date of surgery to the date of death or last visit. The use of human tissue samples and clinical data were approved by the Ethical Committees of the National Engineering Center for Biochips at Shanghai and Taizhou People's Hospitals. All donors had provided written informed consent for donating their tissues to research-related activities.
TMA Construction
The GBC tissue microarrays were constructed using tissue cores from Formalin-fixed, paraffin-embedded specimens. Representative cancer tissue regions and para-cancerous non-malignant or non-premalignant lesions gallbladder specimens were selected from each tissue block by licensed pathologists, and a single 1.5-mm core was taken from every donor block. Microarray blocks were constructed using an automated tissue arrayer (Beecher Instruments, Sun Prairie, WI, USA). Five-micrometer sections were dissected from the array blocks. Sections were stained with hematoxylin and eosin (H&E) to confirm the presence of tumor in each core.
IHC Staining
The IHC staining was conducted as described previously (25). To summarize, tissue sections were incubated at 4°C overnight with rabbit anti-LIFR diluted 1:1,500 (Abcam, Cambridge, UK), rabbit anti-PI3 kinase p85 alpha diluted 1:600 (Abcam), or rabbit anti-MMP12 diluted 1:100 (Abcam). The percentage of immunostaining and the staining intensity (0 = no staining, 1 = weak, 2 = moderate, and 3 = strong staining) were recorded. An H-score was calculated as follows: H-score = (% cells of 1 intensity × 1) + (% cells of 2 intensity × 2) + (% cells of 3 intensity × 3) (26). The maximum H-score would be 300, corresponding to 100% of cells with strong intensity. In statistical analysis, patient characteristics were compared according to the H-score when dichotomizing by the median value in 80 GBC patients. The IHC H-scores were determined independently by two pathologists, who were blinded to the patients' clinical data.
Statistical Analysis
SPSS 21.0 (SPSS Inc.; Chicago, IL, USA) and GraphPad Prism 6 (San Diego, CA USA) software were used for statistical analysis and graphic representations. The χ2 test was used to analyze the relations between protein expression and clinicopathologic features in GBC patients. Survival curves were evaluated using the Kaplan-Meier method, and differences between survival curves were tested by the log-rank test. Cox proportional hazards regression was used to examine univariate and multivariate analyses. The Forward Likelihood Ratio method was used to select independent variables in multivariate analysis.
Expression of LIFR, PIK3R1, and MMP12 From the Cancer Genome Atlas (TCGA) and Gene Expression Omnibus (GEO) Datasets
LIFR, PIK3R1, and MMP12 gene expression pattern in different gastrointestinal cancers were conducted on the TCGA dataset (27). We compared the three gene expression between cancer tissues and their adjacent non-cancerous tissues in four types of cancers, which included cholangio carcinoma, liver hepatocellular carcinoma, pancreatic adenocarcinoma, and stomach adenocarcinoma.
In addition, we found another public GBC dataset and used it for validation of our findings. This dataset was downloaded from the NCBI GEO database with the accession number of GSE76633 and GPL18180. For details on this dataset, please referred to the original report (28). Unpaired Student's t-test was used for this part of analysis, with a p-value < 0.05 being considered as significant.
Results
Identification of DEGs
The gene expression profile of GSE62335 was downloaded from the GEO database, and a random-variance mode method was used to identify DEGs in GBC compared with non-cancerous controls using a paired t-test with a random variance model (11). With the criteria of a fold change ≥ 2 and adjusted-P < 0.05, 198 genes were identified as DEGs (Table S2). Of these, 66 (33.3%) were upregulated, and the remaining 132 (66.7%) were downregulated (Table S2).
Construction of a GBC-Related FI Network
By mapping the GBC-related DEGs to the FI data, we constructed a GBC-related FI network. The network comprises 192 nodes: 150 isolated and 42 in seven clusters, with the largest cluster containing 20 nodes (Figure 1). These clustered nodes are connected via 50 FIs, which correspond to an effective mean degree of 1.2. “Degree” refers to the number of nearest neighbors of a node and effective mean degree to the average degree of all nodes other than the isolated ones. Nodes whose degrees scored ≥4 were selected as hub nodes. Under these criteria, we found that PIK3R1, ITGAX, CDH3, FGA, FGB, FGF2, FGG, JUP, and MYL9 were hub nodes in the FI network, suggesting that these genes play important roles in the initiation of GBC.
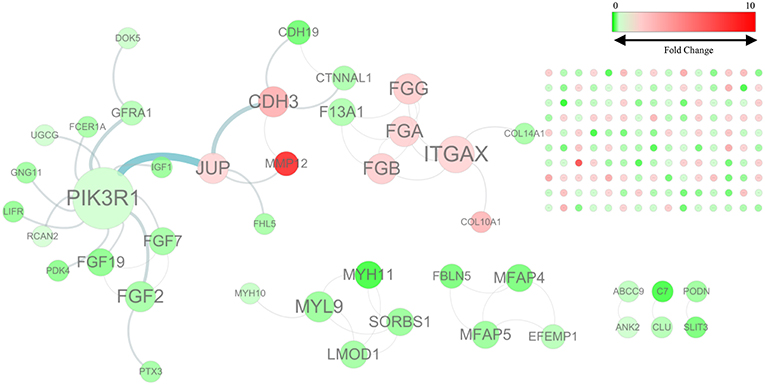
Figure 1. The functional interaction (FI) network constructed using GBC-related differentially expressed genes. Edges are based on FI annotation. Node sizes represent degree value of the FI network, ranging from 0 to 12. Node colors define fold changes in GBC-related DEGs, ranging from red for high expression to green for low expression, relative to non-cancerous samples.
Analysis of FI Network Functions
To classify these 192 significant genes functionally, we used ReactomeFIViz to identify significant enrichment of these genes in six pathways (see Table S3). The most significant pathway was extracellular matrix organization. The GO result showed that the most significant functional groups consisted of genes involved in extracellular matrix organization (biological process), extracellular vesicular exosomes (cellular component), and calcium-ion binding (molecular function) (see Tables S4–S6).
Construction of Network-Based Functional Modules
We chose the MCL as the network-clustering algorithm to take advantage of edge weights. We weighted each interaction edge according to the absolute value of the PCC of the extent of expression of the two genes connected by the edge. For GBC microarray data analysis, we chose MCL modules ≥ 3 and average PCCs ≥ 0.25. In the discovery set, five modules ranging in size from three to eight genes passed the filters (Table 1). An FI sub-network was constructed using 23 genes comprising five modules (Figure 2A). Using hierarchical clustering based on the extent of gene expression (Figure 2B), we found that the 23 genes in the modules could be used to differentiate GBC from non-cancerous samples.
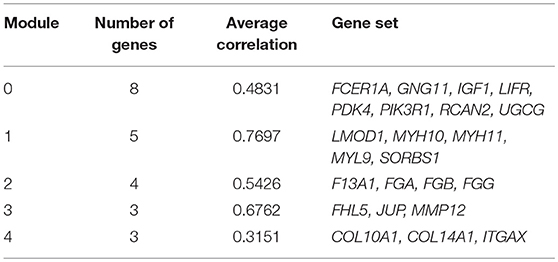
Table 1. Genes in modules in FI network.
Figure 2. Functional interaction sub-network constructed using module genes. (A) The five generated network modules comprise 23 genes, which are shown in different colors in different network modules. (B) Heat map of the 23 genes differentiating GBC samples from non-cancerous samples.
Biological Role of Functional Modules
To understand how the 23 genes of the five modules might be related to the molecular mechanisms of GBC, we performed a functional enrichment analysis on these modules based on pathway annotation (Table S7). The enriched pathways of Module 0 were related mainly to classical cancer pathways, such as Ras, PI3K-Akt, or mTOR signaling in KEGG and integrins in angiogenesis in NCI-PID. Modules 1 and 2 were related to muscle-specific genes and fibrinogen, respectively. The enriched pathway of Module 3 was that of Alzheimer disease–presenilin in NCI-PID, within which MMP12 was related to extracellular matrix also. Extracellular matrix organization in the reactome and the integrin signaling pathway in Panther were enriched in Module 4. An enrichment analysis of GO annotations (biological process, cellular component, molecular function) indicated that the GO biological functions of the modules were consistent mainly with pathway annotations (see Tables S8–S10).
Validation of Differential Expression of LIFR, PIK3R1, and MMP12 as Candidate Module-Biomarkers in GBC
According to the function of the modules and the degree value of the nodes in the GBC-related FI network, we chose PIK3R1 (degree = 8) as a functional hub gene in Module 0, which was the most related to classical cancer pathways (29–31), to validate expression in GBC. Moreover, LIFR was selected as the gene most relevant to PIK3R1 on the basis of the FI data of network and cluster correlation (Figure 2). Finally, the most upregulated gene, MMP12, was validated as a candidate indicator of the extracellular matrix pathway that was the most significantly enriched in the functional network, having an indirect effect on PIK3R1 through JUP.
We used IHC methods to determine LIFR, PIK3R1, and MMP12 protein expression in 20 GBC tumor tissues and patient-matched adjacent peritumor tissues. LIFR protein expression was significantly downregulated in 65% of the cases of GBC (13/20) (Figure 3B; P = 0.002). Similarly, PIK3R1 protein expression was significantly downregulated in 60% of cases (12/20) (Figure 3D; P = 0.046). However, MMP12 was significantly upregulated in 60% compared with paired peritumoral tissues (Figure 3F; P = 0.006). Representative images show that LIFR (Figure 3A) and PIK3R1 (Figure 3C) expression was located mainly in the plasma membrane or cytosol, yet MMP12 (Figure 3E) was expressed mainly in the extracellular region of GBC tissue. Furthermore, the expression data of these proteins were consistent with the mRNA expression trends of LIFR, PIK3R1, and MMP12, as determined by the microarray data (Figure 2B).
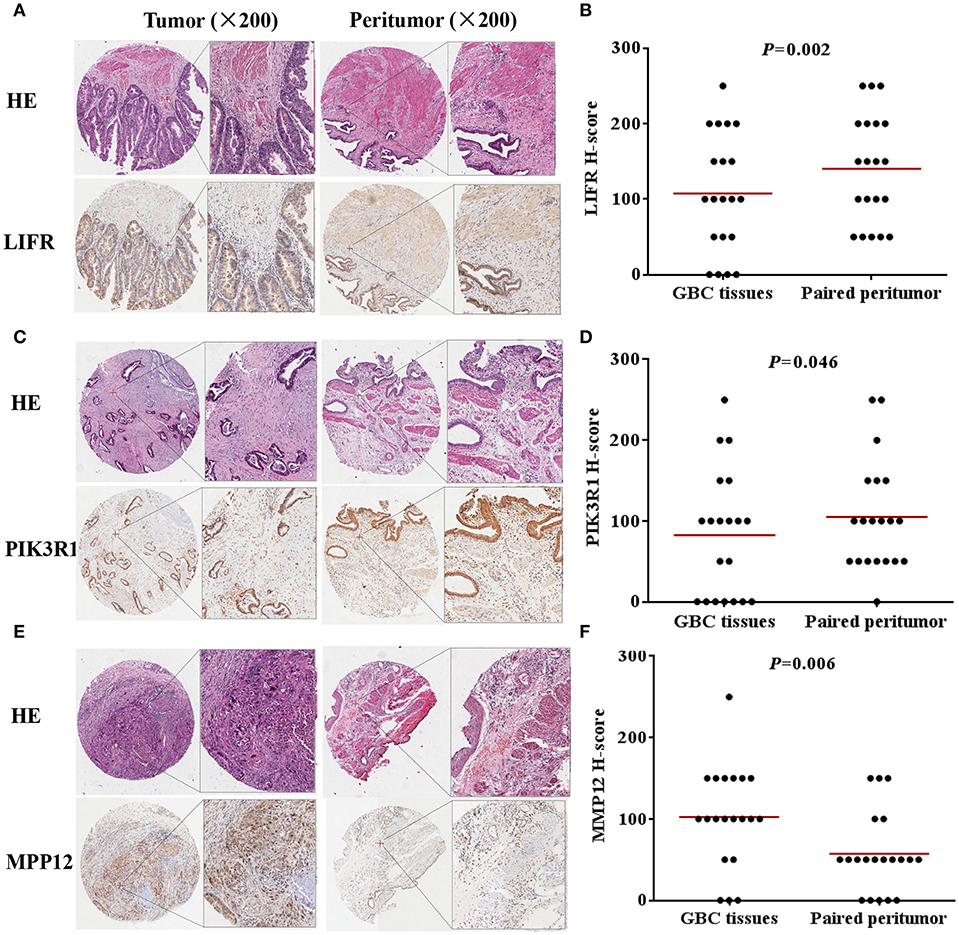
Figure 3. LIFR, PIK3R1, and MMP12 expression in gallbladder cancer tissue. Immunostaining of LIFR (A) expression in a representative tumor tissue and matched non-tumor tissue; original magnification ×200. (C,E) are representative images of PIK3R1 and MMP12, respectively. The differential protein expression of LIFR (B), PIK3R1 (D), and MMP12 (F) are shown in GBC tissues and matched non-tumor tissues of 20 patients as indicated. The median extent of expression of each protein is indicated by the horizontal line in the scatterplot figure.
Relation Between Expression of the Proteins and Clinical Features in GBC
To determine the clinical significance of LIFR, PIK3R1, and MMP12 expression in GBC, the χ2 test was used to assess the associations between expression of the three proteins and clinicopathologic features (patient age; sex; extent of histologic differentiation; tumor size; T, N, and M classification; and clinical stage). We found that LIFR expression in GBC tissues was closely associated with tumor size (P = 0.035), as was PIK3R1 (P = 0.040). However, no significant associations were detected between MMP12 expression and any clinicopathologic feature such as histologic differentiation; tumor size; T, N, or M classification; or clinical stage (Table 2).
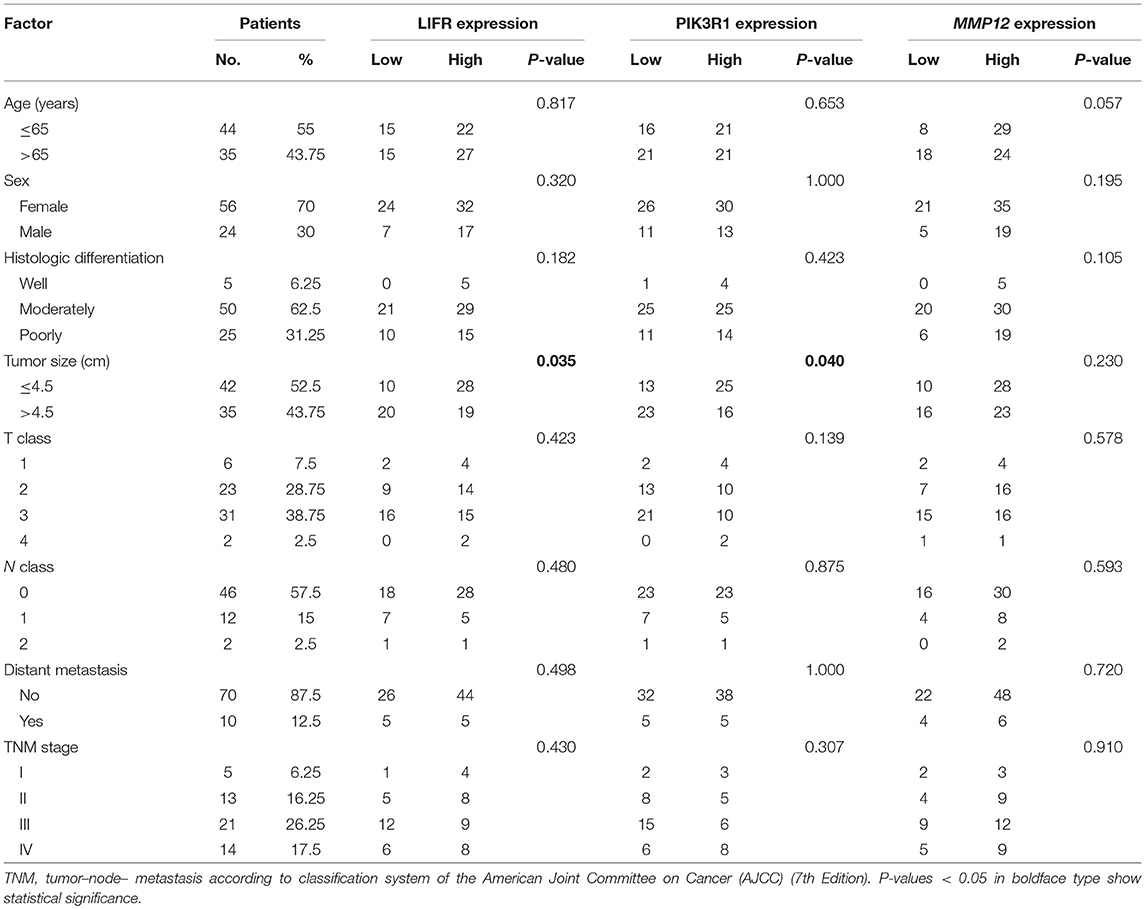
Table 2. Relation between expression of LIFR, PIK3R1, and MMP12 proteins and clinical characteristics of GBC.
Correlation Between Expression of Proteins and Prognosis
The prognostic significance of LIFR, PIK3R1, and MMP12 expression was evaluated with IHC values using the median value as the cutoff. The observation time was 79 months. We explored the correlation between the three proteins and clinical survival data by Kaplan-Meier analysis and the log-rank test. As shown in Figure 4A, patients with low expression of LIFR had poorer overall survival (OS) than those with high expression (Log-rank test, P = 0.028), as also was true for PIK3R1 (Figure 4B; P = 0.053) and MMP12 (Figure 4C; P = 0.006). The median OS of the patients with the low and high LIFR expression was 7.0 vs. 10.0 months, respectively. The median OSs in patients with low and high expression of PIK3R1 and MMP12 were 8.0 vs. 12.0 months and 5.5 vs. 11.5 months, respectively. In addition, univariate and multivariate analyses showed that MMP12 could be useful as an independent risk factor for prognosis. Univariate Cox regression analyses showed that histologic differentiation (P = 0.035), T classification (P = 0.038), distant metastasis (P = 0.025), clinical TNM stage (P = 0.007), LIFR expression (P = 0.039), and MMP12 expression (P = 0.01) were all significantly related to OS. Multivariate Cox regression analyses showed that distant metastasis (P = 0.038) and MMP12 expression (P = 0.032) were significantly different (Table 3).
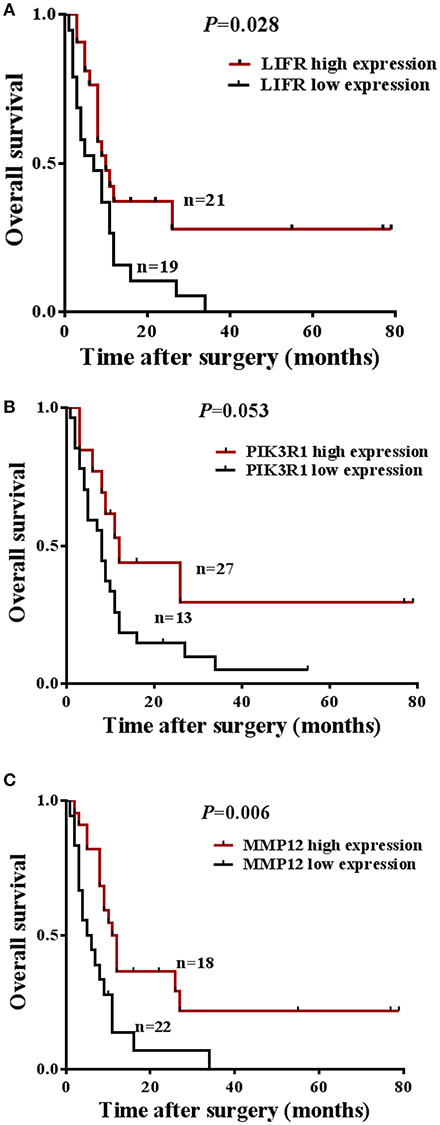
Figure 4. Prognostic significance of LIFR, PIK3R1, and MMP12 expression for GBC patients. (A) Kaplan-Meier curve for the overall survival (OS) of patients with low vs. high expression of LIFR (median OS 7.0 vs. 10.0 months, respectively; log-rank test, P = 0.028). (B) Kaplan-Meier curve for the OS of patients with low vs. high expression of PIK3R1 (median OS 8.0 vs. 12.0 months, respectively; log-rank test, P = 0.053). (C) Kaplan-Meier curve for the OS of patients with low vs. high expression of MMP12 (median OS 5.5 vs. 11.5 months, respectively; log-rank test, P = 0.006).
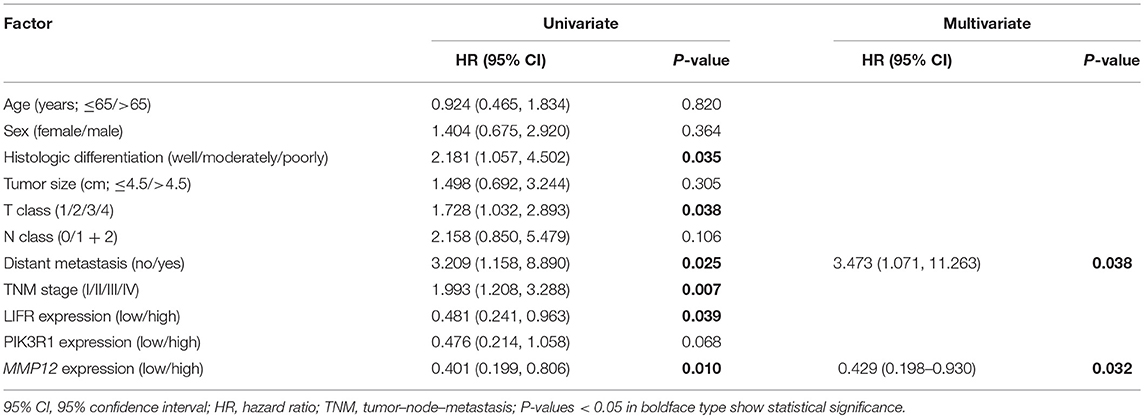
Table 3. Univariate and multivariate Cox regression analyses for overall survival in GBC.
Expression and Regulation Relation Among LIFR, PIK3R1, and MMP12
Because LIFR, PIK3R1, and MMP12 had protein–protein interactions in the GBC-related FI network, we next determined whether the three proteins exhibited expression correlation or direct regulation. By using IHC analysis in GBC tissues, we found that LIFR was colocalized with PIK3R1 in the plasma membrane or cytosol and that this colocalization was decreased in MMP12 compared with LIFR or PIK3R1 (Figure 5A). Interestingly, the expression of LIFR was the most positively correlated with PIK3R1 (r = 0.76; P < 0.0001; Figure 5B) compared with correlation between MMP12 and LIFR (r = 0.53; P < 0.0001; Figure 5C) or PIK3R1 (r = 0.66; P < 0.0001; Figure 5D) in 80 GBC patients. Furthermore, we searched the LIFR-PIK3R1 information of edges in the network, which was recorded in the Jak-STAT signaling pathway of KEGG (Figure 5E). These data suggested that LIFR directly regulates PIK3R1 by protein–protein interactions.
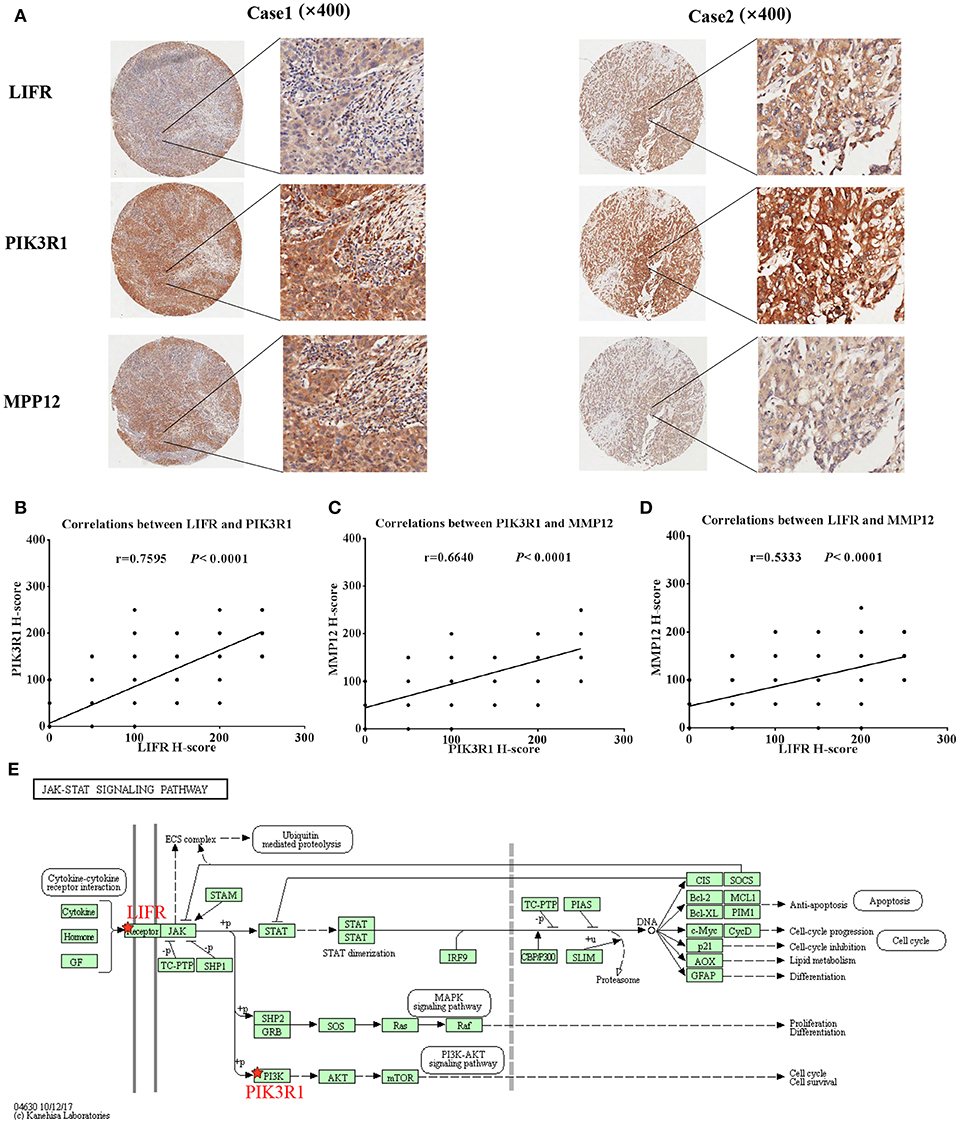
Figure 5. Expression and regulation relation among LIFR, PIK3R1, and MMP12 in GBC patients. (A) LIFR, PIK3R1, and MMP12 colocalized in two representative cases of GBC tissues were detected by immunostaining. Original magnification ×400. (B) Pearson's correlation analysis of LIFR expression with PIK3R1 expression in 80 GBC patients. (C) and (D) are representative of the relation between LIFR with MMP12 and relation between PIK3R1 with MMP12, respectively. (E) Regulation relation between LIFR and PIK3R1 in Jak-STAT signaling pathway of KEGG.
LIFR, PIK3R1, and MMP12 Gene Expression Pattern in Common Gastrointestinal Cancers
We analyzed mRNA expression levels of LIFR, PIK3R1 and MMP12 in cholangio carcinoma, liver hepatocellular carcinoma, pancreatic adenocarcinoma, and stomach adenocarcinoma, with the data from the TCGA. The results showed that LIFR was significantly downregulated in cholangio carcinoma and liver hepatocellular carcinoma although a downregulated trend of RNA expression was detected in all four types of cancers (Figure 6A). PIK3R1 showed no significant differences in all four types of cancers (Figure 6B), indicating that PIK3R1 was specific to GBC. MMP12 was significantly downregulated in pancreatic adenocarcinoma, but significantly upregulated in stomach adenocarcinoma (Figure 6C, P < 0.05), suggesting that the role of MMP12 in the progression of cancer differed among different types of cancers.
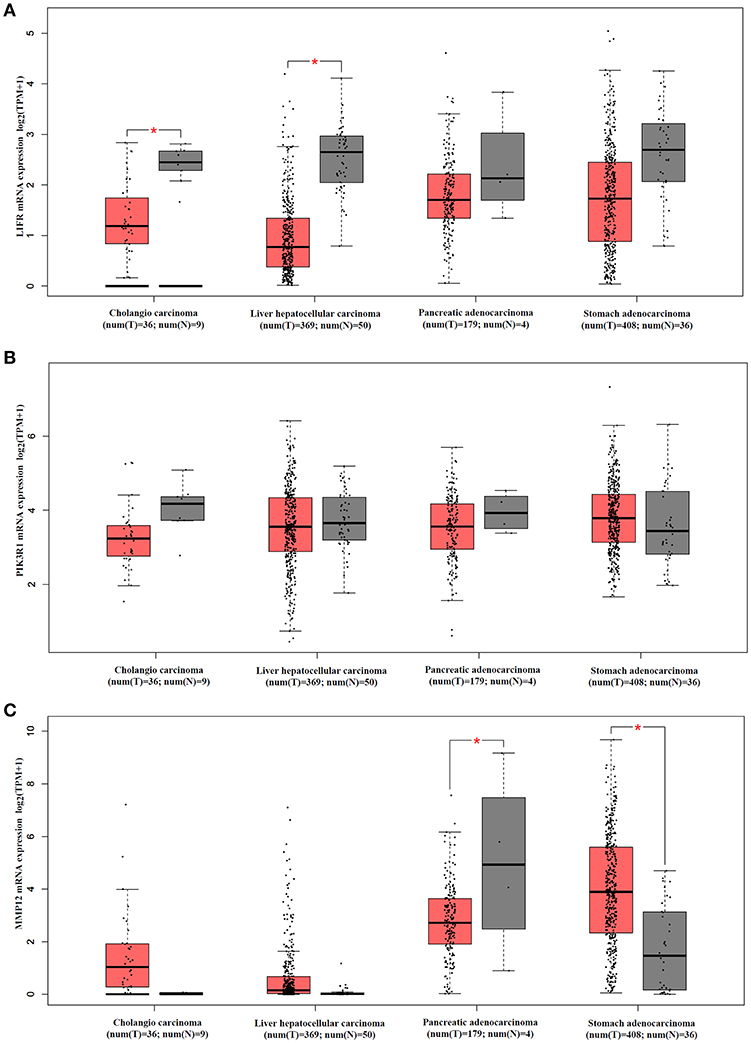
Figure 6. mRNA expression profile of LIFR, PIK3R1 and MMP12 in cholangio carcinoma, liver hepatocellular carcinoma, pancreatic adenocarcinoma and stomach adenocarcinoma. Expression profile of LIFR (A), PIK3R1 (B), and MMP12 (C) across all tumor samples and paired normal tissues. *P < 0.05.
Validation of Differential Expression of LIFR, PIK3R1, and MMP12 in Another GBC Dataset
We used another GBC dataset from GSE76633 to validate our original findings. Our statistical analysis showed that the mRNA expression of LIFR and PIK3R1 was significantly downregulated whereas that of MMP12 was significantly upregulated, compared with their corresponding adjacent normal tissues (Figure 7; P < 0.001 for all the three genes). The expression trends at the mRNA level of each gene in this independent dataset were consistent with our detected protein expression data in our sample (Figure 3).
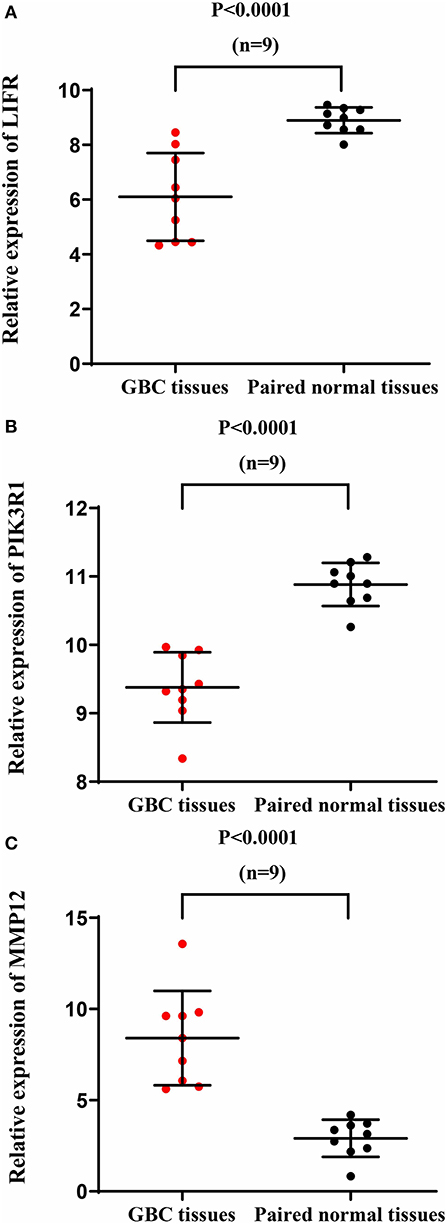
Figure 7. mRNA expression of LIFR, PIK3R1, and MMP12 in an independent GBC dataset (GSE76633). mRNA expression profile of LIFR (A), PIK3R1 (B), and MMP12 (C) across tumor samples and paired normal tissues.
Discussion
Gallbladder cancer is a highly malignant and quickly fatal disease, with a mean 5-year survival rate of only 5% (32). Its dismal prognosis is attributed to its late presentation, early lymph node metastases, frequent adjacent organ invasion, and poor response to chemotherapy. To improve the prognosis of GBC, it is important to understand the molecular mechanism relevant to gallbladder carcinogenesis and to establish appropriate molecular biomarkers enabling early diagnosis and progress monitoring.
A network-based analytic approach of microarray gene expression datasets offers a novel approach for systematically characterizing the underlying molecular etiology of malignancies and searching for gene signatures (19). Based on the microarray data, in this study, we built a highly reliable FI network to identify functional module biomarkers for GBC. According to the function of the modules and the degree value of the nodes in the network, LIFR, PIK3R1, and MMP12 as novel signatures in modules are further confirmed by IHC.
The central gene is PIK3R1 in Module 0, which module contains eight DEGs related to classical cancer pathways (FCER1A, GNG11, IGF1, LIFR, PDK4, PIK3R1, RCAN2, and UGCG). PIK3R1 encodes the p85 regulatory subunit-α, which plays a tumor suppressor role, regulating and stabilizing the p110α catalytic subunit encoded by the oncogene PIK3CA (33, 34). In our study, the mRNA and protein expression of PIK3R1 is differentially downregulated in GBC compared with non-cancerous samples (see Figures 2B, 3D). As shown in Figure 4B, it is clear that patients with low expression of PIK3R1 have a poorer OS than those with high expression (P = 0.053). Moreover, PIK3R1 is related to tumor size (P = 0.040) in clinical significance analysis. These data suggest that PIK3R1 plays a tumor suppressor role in GBC. Similarly, in other cancers, PIK3R1 downregulation has been proved to be an independent prognostic marker in breast cancers (35) and to promote propagation, migration, epithelial–mesenchymal transition, and a stem-like phenotype in renal cancer cells through the AKT/GSK3beta/CTNNB1 pathway (36). Importantly, we found PIK3R1 showed no significant differences in other four types of cancers, suggesting that PIK3R1 was specific to GBC among these common gastrointestinal cancers.
Another interesting gene is leukemia inhibitory factor receptor alpha (LIFR), which was positively correlated with PIK3R1 in our predicted and experimental results. The mRNA and protein expression of LIFR is differentially downregulated in GBC (see Figures 2B, 3B). Decreased LIFR expression correlated with a poor prognosis (Figure 4A; P = 0.028) and was related to tumor size (P = 0.035). Consistent with our investigation, LIFR has been proved to be a cancer metastasis suppressor that inhibits both local invasion and metastatic colonization in a variety of tumors (37, 38). Moreover, downregulation of LIFR expression appeared to be common in other four gastrointestinal cancers, especially in cholangio carcinoma and liver hepatocellular carcinoma (Figure 6A). Excitingly, we find that LIFR was colocalized with PIK3R1 in the plasma membrane or cytosol, and the expression of LIFR was significantly correlated with PIK3R1 (r = 0.76; P < 0.0001; Figure 5B). In addition, the predicted FI information showed that a receptor complex including LIFR activates a PIK3 complex containing PIK3R1 in the Jak-STAT signaling pathway of KEGG (Figure 5E). These data suggest that LIFR directly regulates PIK3R1 by protein–protein interactions in GBC.
Importantly, MMP12 of Module 3 was validated as a candidate indicator of the extracellular matrix pathway that was the most significantly enriched in the functional network. Interestingly, MMP12 may have an indirect effect on PIK3R1 through JUP according to FI prediction (Figure 2A). MMP12 is a member of the matrix metalloproteinase family, which is involved in the development and progression of malignancies (39, 40). MMP12 mRNA expression was the most upregulated gene, with a 9.38-fold change in DEGs (Figure 2B), which is consistent with the protein expression trend (Figure 3F; P = 0.006). In contrast to MMP12 as tumor suppressor, as reported by a previous study, our prognostic analysis showed that MMP12 was protective against GBC (Figure 4C; P = 0.006). Furthermore, multivariate Cox analysis implied that MMP12 is an independent protective factor for GBC (HR = 0.429; 95% CI 0.198, 0.930; P = 0.032). This controversial finding also is seen in other tumors; for instance, patients with hepatocellular or colon carcinomas whose tumors express MMP12 mRNA have better survival than those whose tumors do not express MMP12 and thus do not produce angiostatin (41, 42). In a squamous-cell carcinoma study, MMP12 had a dual role in tumor progression (43). Meanwhile, we found that MMP12 showed different trends among these common gastrointestinal cancers (Figure 6C). These discrepant results suggest that the role of MMP12 in cancer progression differs between tumor or cell types. Moreover, a positive effect of MMP12 on PIK3R1 (r = 0.664; P < 0.0001; Figure 5D) was observed, suggesting MMP12 has an indirect effect on PIK3R1 through JUP.
Finally, the other candidate functional modules were screened, some of which contain genes that have already been investigated for their physiological function in carcinogenesis and tumorigenesis. Module 1 contains five DEGs (i.e., LMOD1, MYH10, MYH11, MYL9, and SORBS1) that were all downregulated in GBC. The enriched pathways of Module 1 are related mainly to muscle biology. MYH10, MYH11, and MYL9 are members of the myosin family, a structural component of muscle. Recent research has found that myosins play important roles in cancer (44–46). SORBS1 encodes sorbin and SH3 domain containing 1, the SH3 domains of which play a role in this protein's ability to bind other cytoplasmic molecules and contribute to cytoskeletal organization, cell adhesion and migration, signaling, and gene expression. Downregulation of SORBS1 has been found in breast and prostate cancer (47, 48). Module 2, comprising F13A1, FGA, FGB, and FGG, is connected to Module 4, including COL10A1 and COL14A1, by ITGAX. A hub node in two modules, ITGAX is also known as CD11C and encodes the integrin-alpha X-chain protein, which is one of the four members of the β2 leukocyte integrin family. ITGAX is involved in various immunologic functions, including cell adhesion, migration, and phagocytosis (49–51). Expression of ITGAX is evident in aggressive prostate cancer (52). ITGAX can interact with extracellular matrix molecules such as fibrinogen (53) and collagen (54). It links Modules 2 and 4, with Module 2 related to fibrinogen and Module 4 to collagen. Proteins FGA, FGB, and FGG are components of fibrinogen, and F13A1 is a part of coagulation Factor XIII. Previous studies indicated that fibrinogen modulates angiogenic mechanisms to affect tumor growth and metastasis (55). Plasma fibrinogen overexpression was reported as an independent prognostic marker in GBC (56, 57). COL10A1 encodes the alpha chain of type X collagen, a biomarker that is upregulated in a variety of tumors (58). The remaining genes either are the subject on only scant literature related to their involvement in cancer or showed results somewhat inconsistent with those of previous studies. Thus, experiments should be conducted to verify our findings. Taken together, these functional modules may comprise novel diagnostic markers for GBC.
Overall, PIK3R1, LIFR, and MMP12 have never been reported in association with GBC. We first identified LIFR, PIK3R1, and MMP12 as novel prognostic biomarkers in this cancer. Additionally, we built a highly reliable GBC-related FI network of dysregulated pathways to reveal a pool of novel functional module genes for further investigation in GBC development and progression, which might provide targets for therapy.
Conclusions
In sum, our data demonstrated the effectiveness of network-based module analysis for biomarker discovery using gene expression data from GBC. Importantly, LIFR, PIK3R1, and MMP12 have been revealed as novel prognostic signatures that might be targets. The findings of this study could accelerate biomarker discovery and therapeutic development in GBC.
Data Availability
Publicly available datasets were analyzed in this study. This data can be found here: https://www.ncbi.nlm.nih.gov/geo/query/acc.cgi?acc=GSE62335.
Ethics Statement
This study was carried out in accordance with the recommendations of the Ethical Committees of the National Engineering Center for Biochips at Shanghai and Taizhou People's Hospitals with written informed consent from all subjects. All subjects gave written informed consent in accordance with the Declaration of Helsinki. The protocol was approved by the Ethical Committees of the National Engineering Center for Biochips at Shanghai and Taizhou People's Hospitals. The use of human tissue samples and clinical data were approved by the Ethical Committees of the National Engineering Center for Biochips at Shanghai and Taizhou People's Hospitals.
Author Contributions
XZ, MX, and ZC participated in data collection and analysis. XZ, MX, WY, and WC performed the laboratory experiments. XZ and ML conceived the study and wrote the paper. All authors approved the final manuscript.
Funding
This study was supported in part by the China Precision Medicine Initiative (2016YFC0906300), Research Center for Air Pollution and Health of Zhejiang University, and the State Key Laboratory for Diagnosis and Treatment of Infectious Diseases of the First Affiliated Hospital of Zhejiang University.
Conflict of Interest Statement
The authors declare that the research was conducted in the absence of any commercial or financial relationships that could be construed as a potential conflict of interest.
Acknowledgments
We thank Dr. David L. Bronson for excellent editing of this manuscript.
Supplementary Material
The Supplementary Material for this article can be found online at: https://www.frontiersin.org/articles/10.3389/fonc.2019.00325/full#supplementary-material
Abbreviations
DEGs, differentially expressed genes; FI, functional interaction; GBC, gallbladder cancer; GO, gene ontology; MCL, markov cluster algorithm; PCC, pearson correlation coefficient.
References
1. Hundal R, Shaffer EA. Gallbladder cancer: epidemiology and outcome. Clin Epidemiol. (2014) 6:99–109. doi: 10.2147/CLEP.S37357
2. Srivastava K, Srivastava A, Mittal B. Potential biomarkers in gallbladder cancer: present status and future directions. Biomarkers. (2013) 18:1–9. doi: 10.3109/1354750X.2012.717105
3. Boutros C, Gary M, Baldwin K, Somasundar P. Gallbladder cancer: past, present and an uncertain future. Surg Oncol. (2012) 21:e183–91. doi: 10.1016/j.suronc.2012.08.002
4. Laubenbacher R, Hower V, Jarrah A, Torti SV, Shulaev V, Mendes P, et al. A systems biology view of cancer. Biochim Biophys Acta. (2009) 1796:129–39. doi: 10.1016/j.bbcan.2009.06.001
5. Taylor IW, Linding R, Warde-Farley D, Liu Y, Pesquita C, Faria D, et al. Dynamic modularity in protein interaction networks predicts breast cancer outcome. Nat Biotechnol. (2009) 27:199–204. doi: 10.1038/nbt.1522
6. Chuang HY, Lee E, Liu YT, Lee D, Ideker T. Network-based classification of breast cancer metastasis. Mol Syst Biol. (2007) 3:140. doi: 10.1038/msb4100180
7. Chowdhury SA, Nibbe RK, Chance MR, Koyutürk M. Subnetwork state functions define dysregulated subnetworks in cancer. J Comput Biol. (2011) 18:263–81. doi: 10.1089/cmb.2010.0269
8. Wu G, Stein L. A network module-based method for identifying cancer prognostic signatures. Genome Biol. (2012) 13:R112. doi: 10.1186/gb-2012-13-12-r112
9. Vidal M, Cusick ME, Barabási AL. Interactome networks and human disease. Cell. (2011) 144:986–98. doi: 10.1016/j.cell.2011.02.016
10. Ma MZ, Zhang Y, Weng MZ, Wang SH, Hu Y, Hou ZY, et al. Long noncoding RNA GCASPC, a target of miR-17-3p, negatively regulates pyruvate carboxylase-dependent cell proliferation in gallbladder cancer. Cancer Res. (2016) 76:5361–71. doi: 10.1158/0008-5472.CAN-15-3047
11. Wright GW, Simon RM. A random variance model for detection of differential gene expression in small microarray experiments. Bioinformatics. (2003) 19:2448–55. doi: 10.1093/bioinformatics/btg345
12. Croft D, O'Kelly G, Wu G, Haw R, Gillespie M, Matthews L, et al. Reactome: a database of reactions, pathways and biological processes. Nucleic Acids Res. (2011) 39:D691–7. doi: 10.1093/nar/gkq1018
13. Chatr-Aryamontri A, Breitkreutz BJ, Oughtred R, Boucher L, Heinicke S, Chen D, et al. The BioGRID interaction database: 2015 update. Nucleic Acids Res. (2015) 43:D470–8. doi: 10.1093/nar/gku1204.
14. Salwinski L, Miller CS, Smith AJ, Pettit FK, Bowie JU, Eisenberg D. The database of interacting proteins: 2004 update. Nucleic Acids Res. (2004) 32:D449–51. doi: 10.1093/nar/gkh086
15. Keshava Prasad TS, Goel R, Kandasamy K, Keerthikumar S, Kumar S, Mathivanan S, et al. Human Protein Reference Database−2009 update. Nucleic Acids Res. (2009) 37:D767–72. doi: 10.1093/nar/gkn892
16. Brown KR, Jurisica I. Unequal evolutionary conservation of human protein interactions in interologous networks. Genome Biol. (2007) 8:R95. doi: 10.1186/gb-2007-8-5-r95
17. Orchard S, Ammari M, Aranda B, Breuza L, Briganti L, Broackes-Carter F, et al. The MIntAct project–IntAct as a common curation platform for 11 molecular interaction databases. Nucleic Acids Res. (2014) 42:D358–63. doi: 10.1093/nar/gkt1115
18. Licata L, Briganti L, Peluso D, Perfetto L, Iannuccelli M, Galeota E, et al. MINT, the molecular interaction database: 2012 update. Nucleic Acids Res. (2012) 40:D857–61. doi: 10.1093/nar/gkr930
19. Wu G, Feng X, Stein L. A human functional protein interaction network and its application to cancer data analysis. Genome Biol. (2010) 11:R53. doi: 10.1186/gb-2010-11-5-r53
20. Shannon P, Markiel A, Ozier O, Baliga NS, Wang JT, Ramage D, et al. Cytoscape: a software environment for integrated models of biomolecular interaction networks. Genome Res. (2003) 13:2498–504. doi: 10.1101/gr.1239303
21. Wu G, Dawson E, Duong A, Haw R, Stein L. ReactomeFIViz: a Cytoscape app for pathway and network-based data analysis. F1000Res. (2014) 3:146. doi: 10.12688/f1000research.4431.2
22. Kanehisa M, Furumichi M, Tanabe M, Sato Y, Morishima K. KEGG: new perspectives on genomes, pathways, diseases and drugs. Nucleic Acids Res. (2017) 45:D353–61. doi: 10.1093/nar/gkw1092
23. Mi H, Muruganujan A, Thomas PD. PANTHER in 2013: modeling the evolution of gene function, and other gene attributes, in the context of phylogenetic trees. Nucleic Acids Res. (2013) 41:D377–86. doi: 10.1093/nar/gks1118
24. Schaefer CF, Anthony K, Krupa S, Buchoff J, Day M, Hannay T, et al. PID: the Pathway Interaction Database. Nucleic Acids Res. (2009) 37:D674–9. doi: 10.1093/nar/gkn653
25. Yan LX, Liu YH, Xiang JW, Wu QN, Xu LB, Luo XL, et al. PIK3R1 targeting by miR-21 suppresses tumor cell migration and invasion by reducing PI3K/AKT signaling and reversing EMT, and predicts clinical outcome of breast cancer. Int J Oncol. (2016) 48:471–84. doi: 10.3892/ijo.2015.3287
26. McClelland RA, Finlay P, Walker KJ, Nicholson D, Robertson JF, Blamey RW, et al. Automated quantitation of immunocytochemically localized estrogen receptors in human breast cancer. Cancer Res. (1990) 50:3545–50.
27. Cancer Genome Atlas Research Network, Weinstein JN, Collisson EA, Mills GB, Shaw KR, Ozenberger BA, et al. The Cancer Genome Atlas Pan-Cancer analysis project. Nat Genet. (2013) 45:1113–20. doi: 10.1038/ng.2764
28. Wu XS, Wang F, Li HF, Hu YP, Jiang L, Zhang F, et al. LncRNA-PAGBC acts as a microRNA sponge and promotes gallbladder tumorigenesis. EMBO Rep. (2017) 18:1837–53. doi: 10.15252/embr.201744147
29. Polivka J Jr., Janku F. Molecular targets for cancer therapy in the PI3K/AKT/mTOR pathway. Pharmacol Ther. (2014) 142:164–75. doi: 10.1016/j.pharmthera.2013.12.004
30. Martini M, De Santis MC, Braccini L, Gulluni F, Hirsch E. PI3K/AKT signaling pathway and cancer: an updated review. Ann Med. (2014) 46:372–83. doi: 10.3109/07853890.2014.912836
31. Singh H, Longo DL, Chabner BA. Improving Prospects for Targeting RAS. J Clin Oncol. (2015) 33:3650–9. doi: 10.1200/JCO.2015.62.1052
33. Shekar SC, Wu H, Fu Z, Yip SC, Nagajyothi, Cahill SM, et al. Mechanism of constitutive phosphoinositide 3-kinase activation by oncogenic mutants of the p85 regulatory subunit. J Biol Chem. (2005) 280:27850–5. doi: 10.1074/jbc.M506005200
34. Taniguchi CM, Winnay J, Kondo T, Bronson RT, Guimaraes AR, Alemán JO, et al. The phosphoinositide 3-kinase regulatory subunit p85alpha can exert tumor suppressor properties through negative regulation of growth factor signaling. Cancer Res. (2010) 70:5305–15. doi: 10.1158/0008-5472.CAN-09-3399
35. Cizkova M, Vacher S, Meseure D, Trassard M, Susini A, Mlcuchova D, et al. PIK3R1 underexpression is an independent prognostic marker in breast cancer. BMC Cancer. (2013) 13:545. doi: 10.1186/1471-2407-13-545
36. Lin Y, Yang Z, Xu A, Dong P, Huang Y, Liu H, et al. PIK3R1 negatively regulates the epithelial-mesenchymal transition and stem-like phenotype of renal cancer cells through the AKT/GSK3beta/CTNNB1 signaling pathway. Sci Rep. (2015) 5:8997. doi: 10.1038/srep08997
37. Chen D, Sun Y, Wei Y, Zhang P, Rezaeian AH, Teruya-Feldstein J, et al. LIFR is a breast cancer metastasis suppressor upstream of the Hippo-YAP pathway and a prognostic marker. Nat Med. (2012) 18:1511–7. doi: 10.1038/nm.2940
38. Okamura Y, Nomoto S, Kanda M, Li Q, Nishikawa Y, Sugimoto H, et al. Leukemia inhibitory factor receptor (LIFR) is detected as a novel suppressor gene of hepatocellular carcinoma using double-combination array. Cancer Lett. (2010) 289:170–7. doi: 10.1016/j.canlet.2009.08.013
39. Lv FZ, Wang JL, Wu Y, Chen HF, Shen XY. Knockdown of MMP12 inhibits the growth and invasion of lung adenocarcinoma cells. Int J Immunopathol Pharmacol. (2015) 28:77–84. doi: 10.1177/0394632015572557
40. Qu P, Yan C, Du H. Matrix metalloproteinase 12 overexpression in myeloid lineage cells plays a key role in modulating myelopoiesis, immune suppression, and lung tumorigenesis. Blood. (2011) 117:4476–89. doi: 10.1182/blood-2010-07-298380
41. Gorrin Rivas MJ, Arii S, Furutani M, Harada T, Mizumoto M, Nishiyama H, et al. Expression of human macrophage metalloelastase gene in hepatocellular carcinoma: correlation with angiostatin generation and its clinical significance. Hepatology. (1998) 28:986–93.
42. Yang W, Arii S, Gorrin-Rivas MJ, Mori A, Onodera H, Imamura M. Human macrophage metalloelastase gene expression in colorectal carcinoma and its clinicopathologic significance. Cancer. (2001) 91:1277–83. doi: 10.1002/1097-0142(20010401)91:7 < 1277::AID-CNCR1129>3.0.CO;2-H
43. Kerkelä E, Ala-aho R, Klemi P, Grénman S, Shapiro SD, Kähäri VM, et al. Metalloelastase (MMP-12) expression by tumour cells in squamous cell carcinoma of the vulva correlates with invasiveness, while that by macrophages predicts better outcome. J Pathol. (2002) 198:258–69. doi: 10.1002/path.1198
44. Wang RJ, Wu P, Cai GX, Wang ZM, Xu Y, Peng JJ, et al. Down-regulated MYH11 expression correlates with poor prognosis in stage II and III colorectal cancer. Asian Pac J Cancer Prev. (2014) 15:7223–8. doi: 10.7314/APJCP.2014.15.17.7223
45. Huang YQ, Han ZD, Liang YX, Lin ZY, Ling XH, Fu X, et al. Decreased expression of myosin light chain MYL9 in stroma predicts malignant progression and poor biochemical recurrence-free survival in prostate cancer. Med Oncol. (2014) 31:820. doi: 10.1007/s12032-013-0820-4
46. Tan X, Chen M. MYLK and MYL9 expression in non-small cell lung cancer identified by bioinformatics analysis of public expression data. Tumour Biol. (2014) 35:12189–200. doi: 10.1007/s13277-014-2527-3
47. Chen YZ, Xue JY, Chen CM, Yang BL, Xu QH, Wu F, et al. PPAR signaling pathway may be an important predictor of breast cancer response to neoadjuvant chemotherapy. Cancer Chemother Pharmacol. (2012) 70:637–44. doi: 10.1007/s00280-012-1949-0
48. Vanaja DK, Ballman KV, Morlan BW, Cheville JC, Neumann RM, Lieber MM, et al. PDLIM4 repression by hypermethylation as a potential biomarker for prostate cancer. Clin Cancer Res. (2006) 12:1128–36. doi: 10.1158/1078-0432.CCR-05-2072
49. Uotila LM, Aatonen M, Gahmberg CG. Integrin CD11c/CD18 alpha-chain phosphorylation is functionally important. J Biol Chem. (2013) 288:33494–9. doi: 10.1074/jbc.C113.497446
50. Kukhtina NB, Rutkevich PN, Shevelev AIa, Vlasik TN, Aref'eva TI. [Participation of beta2-integrins CD11b/CD18 and CD11c/CD18 in adhesion and migration of cells on fibrinogen]. Ross Fiziol Zh Im I M Sechenova. (2011) 97:601–8.
51. Vinay DS, Kwon BS. CD11c+CD8+ T cells: two-faced adaptive immune regulators. Cell Immunol. (2010) 264:18–22. doi: 10.1016/j.cellimm.2010.05.010
52. Williams KA, Lee M, Hu Y, Andreas J, Patel SJ, Zhang S, et al. A systems genetics approach identifies CXCL14, ITGAX, and LPCAT2 as novel aggressive prostate cancer susceptibility genes. PLoS Genet. (2014) 10:e1004809. doi: 10.1371/journal.pgen.1004809
53. Garnotel R, Rittié L, Poitevin S, Monboisse JC, Nguyen P, Potron G, et al. Human blood monocytes interact with type I collagen through alpha x beta 2 integrin (CD11c-CD18, gp150-95). J Immunol. (2000) 164:5928–34. doi: 10.4049/jimmunol.164.11.5928
54. Loike JD, Sodeik B, Cao L, Leucona S, Weitz JI, Detmers PA, et al. CD11c/CD18 on neutrophils recognizes a domain at the N terminus of the A alpha chain of fibrinogen. Proc Natl Acad Sci USA. (1991) 88:1044–8.
55. Staton CA, Brown NJ, Lewis CE. The role of fibrinogen and related fragments in tumour angiogenesis and metastasis. Expert Opin Biol Ther. (2003) 3:1105–20. doi: 10.1517/14712598.3.7.1105
56. Bao RF, Shu YJ, Dong P, Gu J, Wu XS, Li ML, et al. [Change of coagulation in patients with gallbladder cancer and its clinical significance]. Zhonghua Wai Ke Za Zhi. (2013) 51:1067–70.
57. Shu YJ, Weng H, Bao RF, Wu XS, Ding Q, Cao Y, et al. Clinical and prognostic significance of preoperative plasma hyperfibrinogenemia in gallbladder cancer patients following surgical resection: a retrospective and in vitro study. BMC Cancer. (2014) 14:566. doi: 10.1186/1471-2407-14-566
Keywords: functional interaction network, gallbladder cancer, module biomarker, LIFR, PIK3R1, MMP12
Citation: Zhao X, Xu M, Cai Z, Yuan W, Cui W and Li MD (2019) Identification of LIFR, PIK3R1, and MMP12 as Novel Prognostic Signatures in Gallbladder Cancer Using Network-Based Module Analysis. Front. Oncol. 9:325. doi: 10.3389/fonc.2019.00325
Received: 25 February 2019; Accepted: 10 April 2019;
Published: 01 May 2019.
Edited by:
Zhi Sheng, Virginia Tech, United StatesReviewed by:
Robin T. Varghese, Edward Via College of Osteopathic Medicine, United StatesManas Kumar Santra, National Centre for Cell Science (NCCS), India
Copyright © 2019 Zhao, Xu, Cai, Yuan, Cui and Li. This is an open-access article distributed under the terms of the Creative Commons Attribution License (CC BY). The use, distribution or reproduction in other forums is permitted, provided the original author(s) and the copyright owner(s) are credited and that the original publication in this journal is cited, in accordance with accepted academic practice. No use, distribution or reproduction is permitted which does not comply with these terms.
*Correspondence: Ming D. Li, ml2km@zju.edu.cn; limd586@outlook.com