 Zhiheng Cheng1,2,3Yifeng Dai2Tiansheng Zeng4Yan Liu5Longzhen Cui5Tingting Qian1,3Chaozeng Si6Wenhui Huang1,3Ying Pang1Xu Ye1Jinlong Shi7
 Lin Fu1,3,8*
- 1Department of Hematology, The Second Affiliated Hospital of Guangzhou Medical University, Guangzhou, China
- 2Department of Pathology and Medical Biology, University of Groningen, University Medical Center Groningen, Groningen, Netherlands
- 3Translational Medicine Center, State Key Laboratory of Respiratory Disease, The Second Affiliated Hospital of Guangzhou Medical University, Guangzhou, China
- 4Department of Biomedical Sciences, University of Sassari, Sassari, Italy
- 5Translational Medicine Center, Huaihe Hospital of Henan University, Kaifeng, China
- 6Department of Operations and Information Management, China-Japan Friendship Hospital, Beijing, China
- 7Department of Biomedical Engineering, Chinese PLA General Hospital, Beijing, China
- 8Department of Hematology, Huaihe Hospital of Henan University, Kaifeng, China
One of the key features of acute myeloid leukemia (AML), a group of very aggressive myeloid malignancies, is their strikingly heterogenous outcomes. Accurate biomarkers are needed to improve prognostic assessment. Glutamate oxaloacetate transaminase 1 (GOT1) is essential for cell proliferation and apoptosis by regulating cell's metabolic dependency on glucose. It is unclear whether the expression level of GOT1 has clinical implications in AML. Therefore, we analyzed the data of 155 AML patients with GOT1 expression information from The Cancer Genome Atlas (TCGA) database. Among them, 84 patients were treated with chemotherapy alone, while 71 received allogeneic hematopoietic stem cell transplantation (allo-HSCT). In both treatment groups, high GOT1 expression was associated with shorter event-free survival (EFS) and overall survival (OS) (all P < 0.05). Multivariate analysis identified several independent risk factors for both EFS and OS in the chemotherapy-only group, including high GOT1 expression, age ≥60 years, white blood cell count ≥15 × 109/L, bone marrow blasts ≥70%, and DNMT3A, RUNX1 or TP53 mutations (all P < 0.05); but in the allo-HSCT group, the only independent risk factor for survival was high GOT1 expression (P < 0.05 for both EFS and OS). Kyoto Encyclopedia of Genes and Genomes (KEGG) enrichment analysis showed that the genes related to GOT1 expression were mainly concentrated in “hematopoietic cell lineage” and “leukocyte transendothelial migration” signaling pathways. Collectively, GOT1 expression may be a useful prognostic indicator in AML, especially in patients who have undergone allo-HSCT.
Introduction
Acute myeloid leukemia (AML), the most common type of acute leukemia, is a clinically, genetically, and molecularly heterogeneous disease associated with uncontrolled proliferation and blocked differentiation of immature myeloid progenitors (1). The choice of postremission strategy depends on AML risk stratification. The European LeukemiaNet (ELN) system is the most widely accepted risk stratification system in the postgenomic era. It heavily utilizes cytogenetic and molecular aberrations, such as FLT3-ITD, NPM1, CEBPA, RUNX1, TP53, and ASXL1 mutations (2). Additionally, abnormal oncogene expressions have attracted more attention in recent years, with great potentials to be incorporated into a refined AML risk stratification system (3, 4). For example, high expressions of the secreted frizzled-related protein 2 (sFRP2) and docking protein 7 (DOK7) genes are associated with better outcome (5, 6), while high expressions of FHL2 and iASPP are associated with poor survival in AML (7).
Despite the improvements in AML prognostication, individual outcomes within each risk group, especially the intermediate group, are still markedly heterogenous (8). Deeper understanding of leukemogenesis may inspire the identification of biomarkers that can allow molecular-based classification and risk-adapted therapies to improve the outcome of AML. Reprogrammed cellular metabolism is a hallmark of cancer (9). In pancreatic cancer (PC) cells and colorectal cancer (CRC) cells, a defect in an electron transport chain will convert the cells to depend on glutamine as the major energy source for cell growth and proliferation (10, 11). Upregulation of glutamate oxaloacetate transaminase 1 (GOT1), an essential and ubiquitous enzyme in glutamine metabolism, is present in many types of human cancer and correlates with poor prognosis (12, 13). A study shows that incubation of KRAS mutant CRC cells with GOT1 promotes proliferation and reduces apoptosis, suggesting that GOT1 is required for cell survival (14). PC cells are notoriously sensitive to glutamine deficiency because glutamine keeps their cellular redox state, that they rely on GOT1 to reprogram their glutamine metabolism; knocking down GOT1 can reduce PC cells' viability (15, 16).
Currently, the clinical and prognostic relevance of GOT1 in AML is unclear. Whether aberrant GOT1 expression could alter the effect of allogeneic hematopoietic stem cell transplantation (allo-HSCT), a curative treatment for AML (17), is also unanswered. Hence, we conducted a biomarker study to evaluate the clinical and prognostic value of GOT1 in AML, and whether allo-HSCT can overcome its prognostic effect.
Materials and Methods
Patients
The Cancer Genome Atlas (TCGA) database (https://cancergenome.nih.gov/) were screened for patients with GOT1 expression data and a total of 155 AML patients were included in this study (18). Peripheral blood samples were collected from all patients before treatment, and the Affymetrix microarray (U133) was used to analysis the expression of GOT1. Eighty-four patients were given chemotherapy alone, and were defined as the chemotherapy-only group; the other 71 patients with poor-risk features received allo-HSCT, and were defined as the allo-HSCT group. In all patients, age ranged from 18 to 88. Clinical and molecular characteristics at diagnosis were publicly accessible through TCGA database, such as peripheral blood (PB) white blood cell count (WBC), PB and bone marrow (BM) blast percentage, French-American-British (FAB) subtypes, and the frequencies of known recurrent genetic mutations. Primary endpoints were event-free survival (EFS) and overall survival (OS). The former was defined as the time from diagnosis to the first event including relapse, death, failure to achieve complete remission, or was censored at the last follow up. The latter was the time from diagnosis to death from any cause, or was censored at the last follow-up.
Statistical Analysis
Descriptive statistics were used to summarize patients' clinical and molecular characteristics by median and/or range. Due to the non-normal distribution of the numerical data, a nonparametric test, i.e., the Wilcoxon-Mann-Whitney test, was used for between-group comparison. The chi-square test was used for between-group comparison of categorical data. Survival was estimated using the Kaplan-Meier methods and log-rank test. For multivariate analysis of EFS and OS, Cox proportional hazard models were constructed, using a limited backward elimination procedure. Spearman correlation analysis was used to determine the relationships between GOT1 expression and genome expression profile. Multiple testing errors were assessed by false discovery rate (FDR). Kyoto Encyclopedia of Genes and Genomes (KEGG) enrichment analysis was conducted to evaluate the enrichment of GOT1-related gene expressions. A two-tailed P < 0.05 was considered statistically significant. All statistical analyses were performed by the SPSS software 22.0, the R software 3.5.0, and the GraphPad Prism software 7.0.
Results
Differences in Clinical and Molecular Characteristics Between GOT1high and GOT1low Patients in Different Treatment Groups
The chemotherapy-only and the allo-HSCT groups were each divided in two by the respective median GOT1 expression levels. Within each group, the comparison of clinical and molecular characteristics between high and low GOT1 expression subgroups were summarized in Table 1.
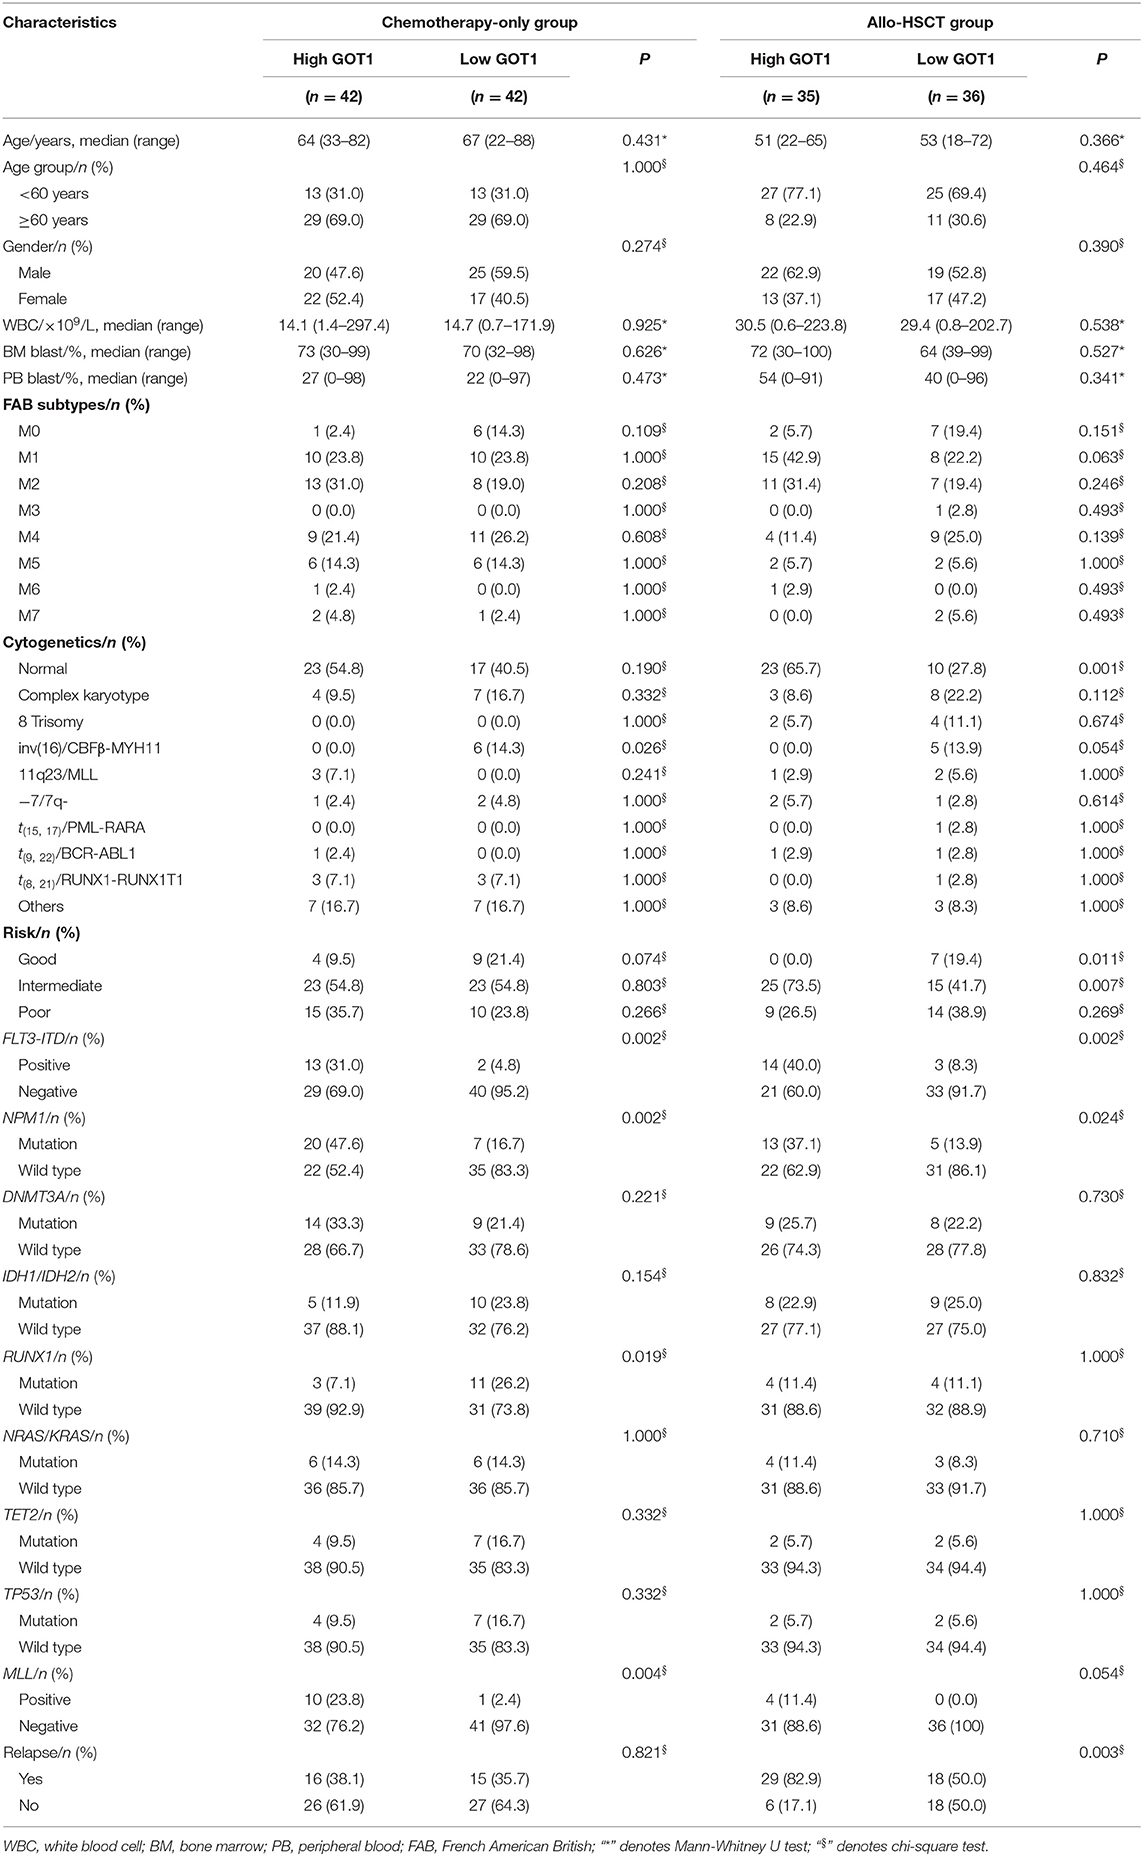
Table 1. Clinical and molecular characteristics of patients in different treatment groups.
In the chemotherapy-only group, the GOT1high subgroup had fewer patients with CBFβ-MYH11 (P = 0.026) and RUNX1 mutations (P = 0.019), but more with MLL fusions (P = 0.004), FLT3-ITD and NPM1 mutations (P = 0.002, P = 0.002, respectively), than the GOT1low subgroup. Age, gender distribution, WBC count, BM/PB blast percentage, FAB subtype distribution, risk stratification, frequencies of other recurrent genetic mutations (DNMT3A, IDH1/IDH2, NRAS/KRAS, TET2, and TP53), as well as the relapse rates, were similar in the two subgroups.
In the allo-HSCT group, normal karyotype (P = 0.001), intermediate-risk (P = 0.007), FLT3-ITD and NPM1 mutations (P = 0.002, P = 0.024, respectively) were more common in the GOT1high subgroup, but CBFβ-MYH11 (P = 0.054) and good-risk (P = 0.011) were less in the GOT1high subgroup. They also had higher relapse rate than the GOT1low subgroup. Age, gender distribution, WBC count, BM/PB blast percentage, FAB distribution, and frequencies of other recurrent genetic mutations (DNMT3A, IDH1/IDH2, RUNX1, NRAS/KRAS, TET2, TP53, and MLL), were similar in the two groups.
Prognostic Significance of GOT1 Expression in AML
Using the Kaplan-Meier method, it was shown that in the chemotherapy-only group, the GOT1high subgroup had shorter EFS and OS than their counterparts (P = 0.019, P = 0.033, Figures 1A,B); similar trend was also observed in the allo-HSCT group, where high GOT1 expressers also had significantly worse survival than the low expressers (P < 0.001 for EFS, P = 0.004 for OS, Figures 1C,D).
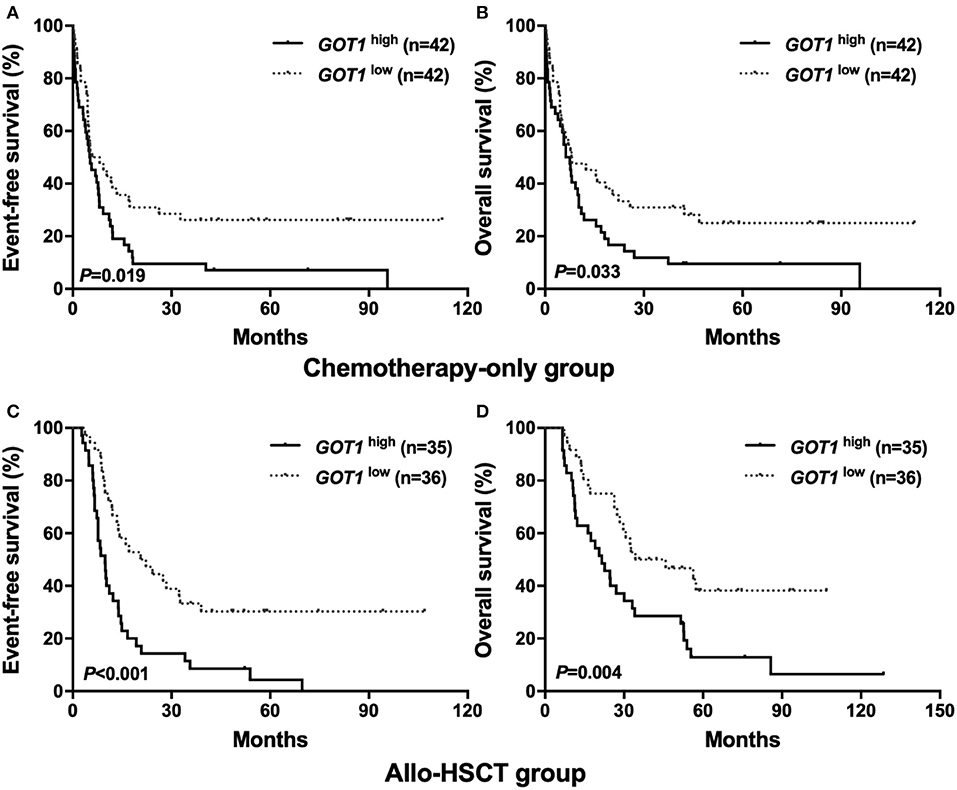
Figure 1. Kaplan-Meier curves of event-free survival (EFS) and overall survival (OS) in the chemotherapy-only and allo-HSCT groups. (A,B) In the chemotherapy-only group, high GOT1 expressers had shorter EFS and OS than the low expressers. (C,D) In the allo-HSCT group, high GOT1 expressers had shorter EFS and OS than the low expressers.
Possible Independent Prognostic Factors for the Two Groups
To further assess the prognostic value of GOT1 in each group, the expression level of GOT1 (high vs. low) and other commonly utilized AML risk stratification indices were used to construct multivariate analyses. The later included age (≥60 vs. <60 years), WBC count (≥15 vs. <15 × 109/L), BM blast percentage (≥70 vs. <70%), PB blast percentage (≥20 vs. <20%), FLT3-ITD (positive vs. negative), and other common genetic mutations (NPM1, DNMT3A, RUNX1, TET2, and TP53; mutated vs. wild).
In the chemotherapy-only group (Table 2), high GOT1 expression, older age, higher WBC count and BM blast percentage, and mutations in DNMT3A, RUNX1, and TP53, were independent risk factors for both EFS and OS (all P < 0.05).
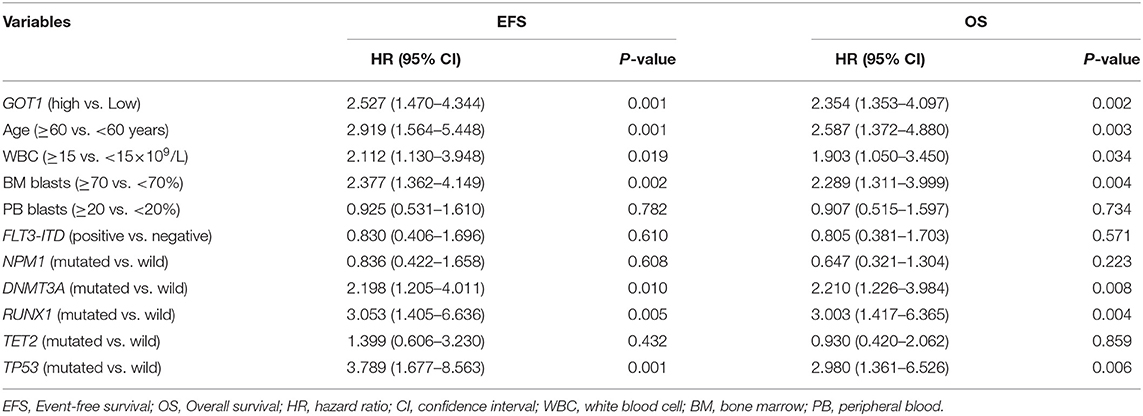
Table 2. Multivariate analysis of EFS and OS in the chemotherapy-only group.
In the allo-HSCT group (Table 3), high GOT1 expression was also an independent risk factor for both EFS and OS (all P < 0.01). For EFS, other independent risk factors included higher WBC count, FLT3-ITD and NPM1 mutations (all P < 0.05); RUNX1 and TP53 mutations were independent risk factors for OS (all P < 0.05).
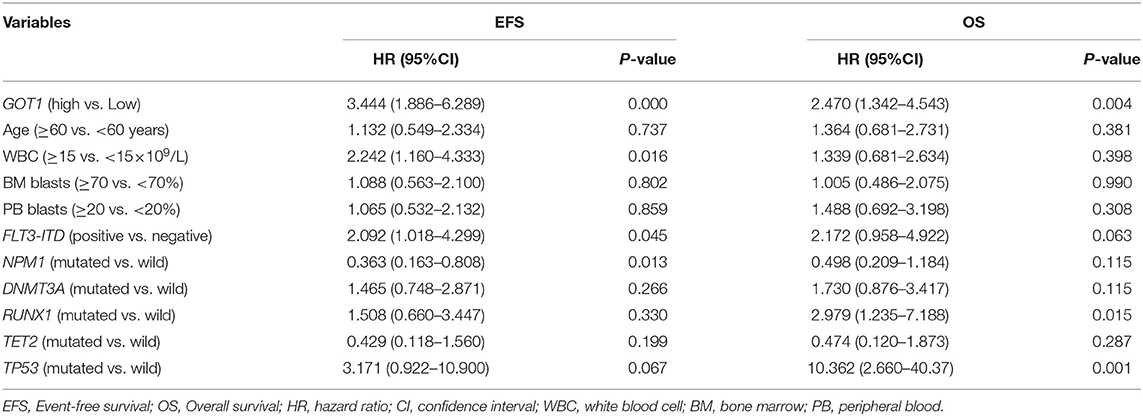
Table 3. Multivariate analysis of EFS and OS in the allo-HSCT group.
Association Between Genome Expression Profile and GOT1 Expression
To explore possible clues to the effects of GOT1 on AML, the high throughput sequencing information from TCGA database was used to summarize the GOT1-related gene expression profile. Three hundred and thirty-six up-regulated and 842 down-regulated genes that were significantly associated with GOT1 expression (P < 0.05, Figure 2A) were screened. Furthermore, KEGG enrichment analysis indicated that the genes associated with GOT1 expression were mainly concentrated in “cytokine-cytokine receptor interaction”, “osteoclast differentiation”, “chemokine signaling pathway”, “hematopoietic cell lineage”, and “leukocyte transendothelial migration” signaling pathways (Figure 2B).
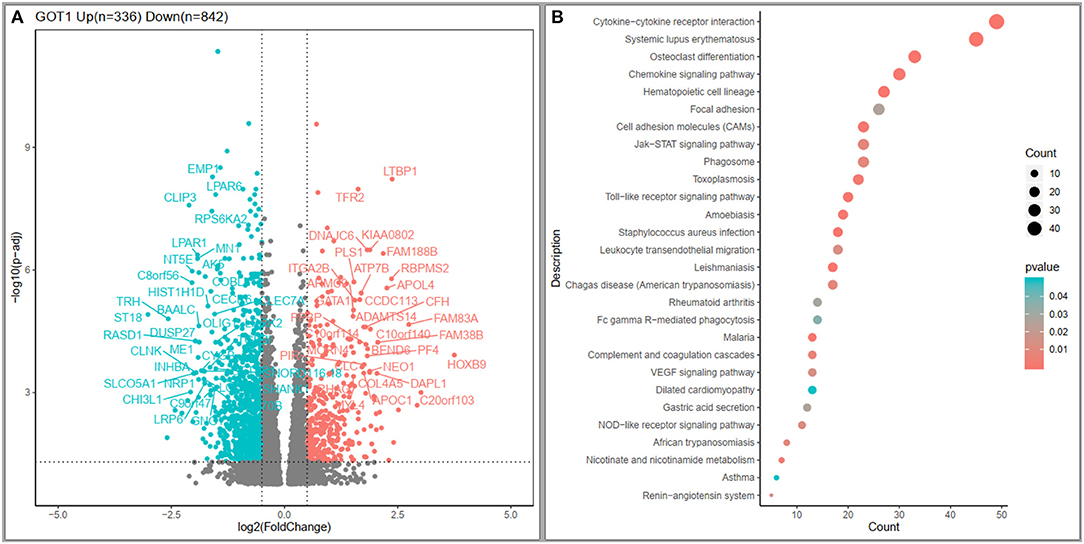
Figure 2. Genome expression profile and cell signaling pathways associated with GOT1 expression. (A) Volcano plot of differential gene expression. Up-regulated and down-regulated genes were labeled with red and cyan dots, respectively. (B) Kyoto Encyclopedia of Genes and Genomes (KEGG) enrichment analysis of genes related to GOT1 expression.
Discussion
In this retrospective study, we found that overexpression of GOT1 is uniformly associated with poor survival in AML patients, regardless of the treatment modality they underwent; allo-HSCT might not abate its strong, detrimental effect on AML prognosis.
While both are vital nutrients, unlike glucose, glutamine can supply the cancer cells with both carbon and nitrogen (11). Not only is glutamine a strong growth signal, it also has important metabolites such as glucosamine, nucleic acids, and non-essential amino acids (NEAAs) (19)—all these metabolic processes require the activity of GOT1 (20). Based on our analyses, high expression of GOT1 is more likely to co-exist with FLT3-ITD and NPM1 mutations, and high GOT1 expressers more frequently have worse outcomes. This suggests that there may be a superposition effect between the upregulation of GOT1 and some adverse prognostic factors in AML.
The tumorigenesis role of GOT1 has been studied in pancreatic cancer. A study demonstrated that one of the mechanisms of KRAS in inducing pancreatic ductal adenocarcinoma is by up-regulating GOT1 and inhibiting glutamate dehydrogenase 1 (GLUD1), thus reprogramming glutamine metabolism (11). Furthermore, other studies indicated that non-canonical anaplerotic glutamine metabolism plays a significant role in the generation of nicotinamide adenine dinucleotide phosphate (NADPH); down-regulation of GOT1 in pancreatic cancer cells could impair glutamine-dependent NADPH production, so as to stop cell growth (21). This metabolic process is also important in reducing reactive oxygen species (ROS) by coupling with other redox balance pathways such as glutathione synthesis (22). We found that high GOT1 expression is an independent poor prognostic factor for AML patients. KEGG enrichment analysis demonstrated that genes (LTBP1, TFR2, HOXB9, NEO1, DAPL1, EMP1, LPAR6, CLIP3, NRP1, SLCO5A1, and RPL5) involved in “cytokine-cytokine receptor interaction”, “osteoclast differentiation”, “chemokine signaling pathway”, “hematopoietic cell lineage”, and “leukocyte transendothelial migration” signaling pathways are significantly correlated with the GOT1 expression. It could be deduced that GOT1 might be involved in leukemogenesis through aforesaid pathways, although this would require further studies to confirm.
Multivariate analysis indicated that in the chemotherapy-only group, age ≥60 years, BM blasts ≥70%, and WBC count ≥15 × 109/L also independently contribute to poor survival. This is concordant with older studies that older age confers unfavorable prognosis in AML, possibly due to higher mutation burden, lower baseline performance status and more co-morbidities in this population (23). The deleterious effects of highly-active bone marrow blast proliferation and high peripheral WBC count on AML remission rate and survival are also well described in previous findings that they have adverse effect on OS (24, 25). In the chemotherapy-only group, DNMT3A, TP53, and RUNX1 mutations are also independent risk factors for EFS and OS, consistent with previous studies (26–28). But in the allo-HSCT group, apart from GOT1, only TP53 and RUNX1 mutations are associated with inferior OS. We speculated that allo-HSCT could reverse the adverse effects of FLT3-ITD, NPM1, and DNMT3A mutations, but could not reverse the impact of GOT1 expression. GOT1 might be a better prognostic biomarker than the other widely-used molecular markers.
In summary, our findings show that high GOT1 expression is an independent poor prognostic biomarker in AML, and its adverse prognostic effect couldn't be overcome by allo-HSCT. Given the relative simplicity to measure GOT1 expression at diagnosis and its distinct prognostic value, it is reasonable to envision it as a biomarker for risk stratification and guidance for treatments in AML. Our study was limited by its small, retrospective nature, and the results would need to be verified in a larger, prospective cohort.
Data Availability Statement
All data in this study were publicly accessible from The Cancer Genome Atlas (TCGA) database (https://cancergenome.nih.gov/). We were not involved direct interaction with patients. All analyses during this study were included in this article.
Author Contributions
ZC and LF conceived the study and wrote the manuscript. YD and TZ collected and analyzed the data. YL, LC, TQ, CS, WH, YP, XY, and JS participated in analyzing and discussing the results. All authors edited and approved the final manuscript.
Funding
This work was supported by grants from Xinjiang Joint Fund of National Natural Science Foundation of China (U1903117) and the National Natural Science Foundation of China (81500118).
Conflict of Interest
The authors declare that the research was conducted in the absence of any commercial or financial relationships that could be construed as a potential conflict of interest.
References
1. Döhner H, Weisdorf DJ, Bloomfield CD. Acute myeloid leukemia. N Engl J Med. (2015) 373:1136–52. doi: 10.1056/NEJMra1406184
2. Döhner H, Estey E, Grimwade D, Amadori S, Appelbaum FR, Büchner T, et al. Diagnosis and management of AML in adults: 2017 ELN recommendations from an international expert panel. Blood. (2017) 129:424–47. doi: 10.1182/blood-2016-08-733196
3. Patel JP, Gönen M, Figueroa ME, Fernandez H, Sun Z, Racevskis J, et al. Prognostic relevance of integrated genetic profiling in acute myeloid leukemia. N Engl J Med. (2012) 366:1079–89. doi: 10.1056/NEJMoa1112304
4. Prada-Arismendy J, Arroyave JC, Röthlisberger S. Molecular biomarkers in acute myeloid leukemia. Blood Rev. (2017) 31:63–76. doi: 10.1016/j.blre.2016.08.005
5. Aly RM, Taalab MM, Abdsalam EM. Prognostic significance of secreted frizzled-related protein 2 expression in cytogenetically normal primary acute myeloid leukemia. Am J Med Sci. (2015) 350:369–73. doi: 10.1097/MAJ.0000000000000567
6. Zhang L, Li R, Hu K, Dai Y, Pang Y, Jiao Y, et al. Prognostic role of DOK family adapters in acute myeloid leukemia. Cancer Gene Ther. (2019) 26:305–12. doi: 10.1038/s41417-018-0052-z
7. Cheng Z, Dai Y, Pang Y, Jiao Y, Zhao H, Zhang Z, et al. Enhanced expressions of FHL2 and iASPP predict poor prognosis in acute myeloid leukemia. Cancer Gene Ther. (2019) 26:17–25. doi: 10.1038/s41417-018-0027-0
8. Komanduri KV, Levine RL. Diagnosis and therapy of acute myeloid leukemia in the era of molecular risk stratification. Annu Rev Med. (2016) 67:59–72. doi: 10.1146/annurev-med-051914-021329
9. DeBerardinis RJ, Lum JJ, Hatzivassiliou G, Thompson CB. The biology of cancer: metabolic reprogramming fuels cell growth and proliferation. Cell Metab. (2008) 7:11–20. doi: 10.1016/j.cmet.2007.10.002
10. Wise DR, DeBerardinis RJ, Mancuso A, Sayed N, Zhang XY, Pfeiffer HK, et al. Myc regulates a transcriptional program that stimulates mitochondrial glutaminolysis and leads to glutamine addiction. Proc Natl Acad Sci USA. (2008) 105:18782–7. doi: 10.1073/pnas.0810199105
11. Son J, Lyssiotis CA, Ying H, Wang X, Hua S, Ligorio M, et al. Glutamine supports pancreatic cancer growth through a KRAS-regulated metabolic pathway. Nature. (2013) 496:101–5. doi: 10.1038/nature12040
12. Zhao H, Langerød A, Ji Y, Nowels KW, Nesland JM, Tibshirani R, et al. Different gene expression patterns in invasive lobular and ductal carcinomas of the breast. Mol Biol Cell. (2004) 15:2523–36. doi: 10.1091/mbc.e03-11-0786
13. Curtis C, Shah SP, Chin SF, Turashvili G, Rueda OM, Dunning MJ, et al. The genomic and transcriptomic architecture of 2,000 breast tumours reveals novel subgroups. Nature. (2012) 486:346–52. doi: 10.1038/nature10983
14. Wong CC, Qian Y, Li X, Xu J, Kang W, Tong JH, et al. SLC25A22 promotes proliferation and survival of colorectal cancer cells with KRAS mutations and xenograft tumor progression in mice via intracellular synthesis of aspartate. Gastroenterology. (2016) 151:945–60.e6. doi: 10.1053/j.gastro.2016.07.011
15. Chakrabarti G, Moore ZR, Luo X, Ilcheva M, Ali A, Padanad M, et al. Targeting glutamine metabolism sensitizes pancreatic cancer to PARP-driven metabolic catastrophe induced by β-lapachone. Cancer Metab. (2015) 3:12. doi: 10.1186/s40170-015-0137-1
16. Anglin J, Zavareh RB, Sander PN, Haldar D, Mullarky E, Cantley LC, et al. Discovery and optimization of aspartate aminotransferase 1 inhibitors to target redox balance in pancreatic ductal adenocarcinoma. Bioorg Med Chem Lett. (2018) 28:2675–8. doi: 10.1016/j.bmcl.2018.04.061
17. Gupta V, Tallman MS, He W, Logan BR, Copelan E, Gale RP, et al. Comparable survival after HLA-well-matched unrelated or matched sibling donor transplantation for acute myeloid leukemia in first remission with unfavorable cytogenetics at diagnosis. Blood. (2010) 116:1839–48. doi: 10.1182/blood-2010-04-278317
18. Ley TJ, Miller C, Ding L, Raphael BJ, Mungall AJ, Robertson A, et al. Genomic and epigenomic landscapes of adult de novo acute myeloid leukemia. N Engl J Med. (2013) 368:2059–74. doi: 10.1056/NEJMoa1301689
19. Hirschey MD, DeBerardinis RJ, Diehl AME, Drew JE, Frezza C, Green MF, et al. Dysregulated metabolism contributes to oncogenesis. Semin Cancer Biol. (2015) 35(Suppl):S129–S50. doi: 10.1016/j.semcancer.2015.10.002
20. Abrego J, Gunda V, Vernucci E, Shukla SK, King RJ, Dasgupta A, et al. GOT1-mediated anaplerotic glutamine metabolism regulates chronic acidosis stress in pancreatic cancer cells. Cancer Lett. (2017) 400:37–46. doi: 10.1016/j.canlet.2017.04.029
21. Zhou X, Curbo S, Li F, Krishnan S, Karlsson A. Inhibition of glutamate oxaloacetate transaminase 1 in cancer cell lines results in altered metabolism with increased dependency of glucose. BMC Cancer. (2018) 18:559. doi: 10.1186/s12885-018-4443-1
22. Morgan B, Sobotta MC, Dick TP. Measuring E(GSH) and H2O2 with roGFP2-based redox probes. Free Radic Biol Med. (2011) 51:1943–51. doi: 10.1016/j.freeradbiomed.2011.08.035
23. Cheng Z, Hu K, Tian L, Dai Y, Pang Y, Cui W, et al. Clinical and biological implications of mutational spectrum in acute myeloid leukemia of FAB subtypes M4 and M5. Cancer Gene Ther. (2018) 25:77–83. doi: 10.1038/s41417-018-0013-6
24. Bacher U, Haferlach C, Alpermann T, Kern W, Schnittger S, Haferlach T. Comparison of genetic and clinical aspects in patients with acute myeloid leukemia and myelodysplastic syndromes all with more than 50% of bone marrow erythropoietic cells. Haematologica. (2011) 96:1284–92. doi: 10.3324/haematol.2011.043687
25. Cheng Z, Dai Y, Pang Y, Jiao Y, Zhao H, Wu S, et al. Clinical and Biological Implications of Mutational Spectrum in Acute Myeloid Leukemia of FAB Subtypes M0 and M1. Cell Physiol Biochem. (2018) 47:1853–61. doi: 10.1159/000491065
26. Marcucci G, Metzeler KH, Schwind S, Becker H, Maharry K, Mrózek K, et al. Age-related prognostic impact of different types of DNMT3A mutations in adults with primary cytogenetically normal acute myeloid leukemia. J Clin Oncol. (2012) 30:742–50. doi: 10.1200/JCO.2011.39.2092
27. Mendler JH, Maharry K, Radmacher MD, Mrózek K, Becker H, Metzeler KH, et al. RUNX1 mutations are associated with poor outcome in younger and older patients with cytogenetically normal acute myeloid leukemia and with distinct gene and MicroRNA expression signatures. J Clin Oncol. (2012) 30:3109–18. doi: 10.1200/JCO.2011.40.6652
Keywords: acute myeloid leukemia, glutamate oxaloacetate transaminase 1, chemotherapy, allogeneic hematopoietic stem cell transplantation, prognosis
Citation: Cheng Z, Dai Y, Zeng T, Liu Y, Cui L, Qian T, Si C, Huang W, Pang Y, Ye X, Shi J and Fu L (2020) Upregulation of Glutamic-Oxaloacetic Transaminase 1 Predicts Poor Prognosis in Acute Myeloid Leukemia. Front. Oncol. 10:379. doi: 10.3389/fonc.2020.00379
Received: 15 July 2019; Accepted: 04 March 2020;
Published: 24 March 2020.
Edited by:
Massimo Breccia, Sapienza University of Rome, ItalyReviewed by:
Ranganatha R. Somasagara, North Carolina Central University, United StatesRehan Khan, Mayo Clinic Arizona, United States
Copyright © 2020 Cheng, Dai, Zeng, Liu, Cui, Qian, Si, Huang, Pang, Ye, Shi and Fu. This is an open-access article distributed under the terms of the Creative Commons Attribution License (CC BY). The use, distribution or reproduction in other forums is permitted, provided the original author(s) and the copyright owner(s) are credited and that the original publication in this journal is cited, in accordance with accepted academic practice. No use, distribution or reproduction is permitted which does not comply with these terms.
*Correspondence: Lin Fu, fulin022@126.com