 Liang Zhao
 Jiayue Zhang1†
 Peng Zhao
- 1Department of Neurosurgery, The First Affiliated Hospital of Nanjing Medical University, Nanjing, China
- 2Department of Respiratory and Critical Care Medicine, The First Affiliated Hospital of Nanjing Medical University, Nanjing, China
Alternative splicing (AS) of pre-mRNA has been widely reported to be associated with the progression of malignant tumors. However, a systematic investigation into the prognostic value of AS events in glioblastoma (GBM) is urgently required. The gene expression profile and matched AS events data of GBM patients were obtained from The Cancer Genome Atlas Project (TCGA) and TCGA SpliceSeq database, respectively. 775 AS events were identified as prognostic factors using univariate Cox regression analysis. The least absolute shrinkage and selection operator (LASSO) cox model was performed to narrow down candidate AS events, and a risk score model based on several AS events were developed subsequently. The risk score-based signature was proved as an efficient predictor of overall survival and was closely related to the tumor purity and immunosuppression in GBM. Combined similarity network fusion and consensus clustering (SNF-CC) analysis revealed two distinct GBM subtypes based on the prognostic AS events, and the associations between this novel molecular classification and clinicopathological factors, immune cell infiltration, as well as immunogenic features were further explored. We also constructed a regulatory network to depict the potential mechanisms that how prognostic splicing factors (SFs) regulate splicing patterns in GBM. Finally, a nomogram incorporating AS events signature and other clinical-relevant covariates was built for clinical application. This comprehensive analysis highlights the potential implications for predicting prognosis and clinical management in GBM.
Introduction
Glioblastoma (GBM) is the most common primary brain neoplasm in adults (1). Although given surgical resection followed by radiotherapy and temozolomide chemotherapy, GBM patients still show poor prognosis with a median overall survival of fewer than 15 months (2). One of the reasons accounting for the limited efficacy of regular treatment is the incomplete debulking surgery, which is subjected to the penetration of malignant cells into healthy tissues. Resistance to conventional chemotherapeutic drugs also poses a critical challenge to clinical GBM therapy (3). Therefore, an improved understanding of the molecular mechanisms underlying GBM progression for developing accurate prognostic markers and novel effective therapeutic strategies is urgently required.
The surge of advances in next-generation sequencing and other multi-omics technologies have made the revelation of the genomic features of GBM increasingly feasible (4, 5). Various pathways involved in gliomagenesis have been widely studied and improved our understanding of the complex mechanisms of GBM, such as PI3K/AKT/mTOR, PDGF/PDGFR, receptor tyrosine kinase, and p53 signaling. More importantly, high heterogeneity is a hallmark of GBM, and different GBM molecular subclasses were categorized based on gene expression or methylation data, which may guide the diagnosis and clinical therapy (6–9). However, these molecular classifications have not considered alternative splicing (AS) events.
AS has been proved to be a key factor underlying functional complexity in eukaryotes cells (10). Splicing of pre-mRNA contributes to proteomic diversity from a limited number of genes and therefore regulates the vast majority of biological processes and cellular phenotypes, some of which could be associated with malignant progression (11, 12). AS has been reported to be a universal phenomenon during regular cell activities, with approximately 95% of genes underwent this process (13). Recently, the AS landscapes in several human cancer types have been delineated, including head and neck squamous cell carcinoma, pancreatic ductal adenocarcinoma, colorectal cancer, and hepatocarcinoma (14–17). Cancer-related AS events can not only serve as predictive or prognostic factors but also as effective therapeutic targets. For example, Hu et al. found that MET-exon-14-skipping (METex14) was significantly enriched in secondary GBMs (sGBMs) and was responsible for the bleak prognosis. A MET kinase inhibitor targeting this specific splicing pattern has been invented and applied to the clinical treatment of sGBM patients (18). Also, accumulating evidence shows that the dysregulation of AS in the tumor can influence and remodel the microenvironment of the neoplastic niche (19, 20). In GBM, malignant niche recruits immune cells to create an immunosuppressive tumor microenvironment, therefore facilitate the proliferation and encroachment of tumor cells into normal tissues (21). To date, there have been very few systematic studies conducted to investigate the cross-talk between AS events and cancer-immune in GBM.
In our study, we deeply mined the AS events in GBM based on the large-scale transcriptome data from The Cancer Genome Atlas Project (TCGA). Overall survival-related AS events were identified, and an AS events-based signature was constructed to predict the clinical outcomes of GBM patients. Integrative bioinformatics analyses were carried out to explore the underlying biological mechanisms contributed by AS events. Additionally, we classified GBM into two distinct subtypes, and further assessed the association between these clusters and prognoses, clinicopathological features as well as the immune microenvironment. Finally, we developed a robust prognostic model to direct the decision-making in clinical management. Our study revealed the AS landscape of GBM and may shed new light on developing novel therapeutic methods.
Materials and Methods
Data Acquisition and Pre-Processing
In this cohort study, RNA sequencing data were obtained from the TCGA patients diagnosed with glioblastoma. Publically available level 3 transcriptome fragments per kilobase million (FPKM) data of the TCGA-GBM project (n = 166, Illumina HiSeq platform) were downloaded from the TCGA data portal (https://portal.gdc.cancer.gov). In the present study, FPKM values were transformed into transcripts per kilobase million (TPM) values, which are more comparable between different samples (22). Raw counts data of these corresponding GBM samples were also downloaded for differential expression analysis. The GISTIC copy number and methylation status of splicing factors in the TCGA-GBM cohort were downloaded from cBioPortal for Cancer Genomics (https://www.cbioportal.org/). Curated clinical information of these glioblastoma patients was derived from a TCGA Pan-Cancer research (23).
AS events profile of 152 glioblastoma patients in the selected TCGA-GBM cohort, a matrix consists of the Percent Spliced In (PSI) value of each sample, was obtained from the TCGA SpliceSeq database (https://bioinformatics.mdanderson.org/TCGASpliceSeq/PSIdownload.jsp). PSI value means the ratio between exons inclusion and exclusion read counts and indicates the efficiency of certain splicing process (24). To ensure the reliability of subsequent analyses, we predefined stringent filtering criteria: the PSI values of AS events in all GBM samples with a standard deviation > 0.05, mean > 0.1, and the percentage of samples with PSI values > 80 were included.
Identification of Prognostic AS Events and Construction of an AS Events-Based Risk Model
Univariate Cox regression analysis was carried out to find out the prognostic relationship between AS events and overall survival of GBM patients. AS events with P-value less than 0.05 in the univariate Cox regression analysis were regarded as survival-related factors and were selected for the next analysis. The least absolute shrinkage and selection operator (LASSO) cox model using 10-fold cross-validation was performed on the top 20 significant survival-related AS events that have the highest prognostic value to select the most useful prognostic markers of all types of AS events. The optimal lambda value was estimated based on the minimum criteria. Then, these candidate survival-related AS events were further subjected to multivariate Cox regression analysis (25). The risk-score model of AS events for predicting survival of GBM was constructed based on the combination of an AS PSI value and the corresponding regression coefficient (β) obtained from the multivariate Cox regression analysis (26). The formula of calculating the risk score of each GBM patient was as follows:]
where N is the number of AS events in the signature, βASi is the regression coefficient, and PSIASi represents the PSI value of a certain AS event in a single sample. GBM patients were divided into a high- and low-risk group according to the median risk score. Kaplan-Meier survival analysis based on the log-rank test was used to evaluate the predictive value of the risk model. Hazard ratios (HRs) and 95% confidence intervals (95% CIs) were calculated both in univariate and multivariate Cox regression analyses. The following clinical-relevant factors were included in the multivariate Cox regression analysis: gender, age, MGMT methylation status, Karnofsky Performance Status (KPS) score, IDH mutation status, and risk score. Finally, time-dependent receiver operating characteristic (ROC) curves were performed using the “timeROC” R package (v0.4) to display the accuracy of this risk model in predicting the clinical outcomes of GBM patients at different times.
Similar Network Fusion and Clustering
Based on all survival-related AS events, a modified clustering method, SNF-CC, which combining Similar network fusion (SNF) (27) with Consensus clustering (CC) (28), was applied to perform classification of all GBM patients in the cohort. SNF-CC algorithm was executed by “ExecuteSNF.CC” function implanted in “CancerSubtypes” R package (v1.12.1) (29). To guarantee a balance between high stability and low ambiguity, the detailed parameters were set as follows: clusterNum = 2, K = 20, alpha = 0.5, t = 20, maxK = 5, pItem = 0.8 and reps = 500. The consensus heatmap and cumulative distribution function (CDF) were used to select a more appropriate number of clusters. Furthermore, silhouette width, an index represents how similar a sample is matched to its identified cluster compared to other clusters, was validated in our study. The associations between AS events-based subtypes, clinicopathological features (age, overall survival status, KPS, IDH mutation, and MGMT methylation status), GBM molecular subtypes (Verhaak classification and EM/PM classification), and immune features (described below) were evaluated.
Functional Enrichment Analyses
Gene set enrichment analysis (GSEA) analysis was conducted using the R package “fgsea” (v1.12.0) (30). We ranked the GBM samples according to their log2-fold change value (from high to low) derived from differential expression analysis between two distinct groups and checked if any signaling pathway or molecular hallmark was associated with these differentially expressed genes. GSEA gene sets (curated gene sets (C2), Gene Ontology (GO) gene sets (C5), and hallmark gene sets (H)) were downloaded from the Molecular Signatures Database (v7.0) (https://www.gsea-msigdb.org/gsea/msigdb/index.jsp). To obtain robust results, gene-set permutations were performed 10,000 times, and enrichment P-values were adjusted by false discovery rates (FDR). FDR-adjusted P < 0.05 were considered as statistically significant. GO term enrichment and the Kyoto Encyclopedia of Genes and Genomes (KEGG) pathway analysis for genes of interest were performed using metascape (v3.5), which is an easy-to-use web portal that provides a comprehensive analysis for the functional annotation of lists of genes (31).
Single-Sample Gene Set Enrichment Analysis (ssGSEA)
The fractions of diverse infiltrated immune cells in tumor samples were estimated using the ssGSEA method implemented in the “GSVA” R package (v1.34.0, https://bioconductor.org/packages/release/bioc/html/GSVA.html). As an extension of Gene Set Enrichment Analysis (GSEA), ssGSEA evaluate the enrichment score of a certain gene set in every single sample (32). Twenty-four kinds of immune cell marker genes derived from a previously published research were integrated into immune cells specific gene sets (33). Markers associated with cells of the innate immune system, including natural killer (NK) cells, NK CD56dim cells, NK CD56bright cells, dendritic cells (DCs), immature DCs (iDCs), activated DCs (aDCs), neutrophils, mast cells, eosinophils, and macrophages, as well as those associated with cells of the adaptive immune system, including B, T central memory (Tcm), CD8+ T, T effector memory (Tem), T follicular helper (Tfh), Tγδ, Th1, Th2, Th17, and Treg cells, were included in the gene sets list. Finally, ssGSEA captured a numeric matrix containing enrichment scores of different immune cells across all GBM samples.
Evaluation of Immune Features
Immune infiltration features in GBM samples can be inferred by calculating tumor immunological indexes. According to a pan-cancer study aiming at developing an effective biomarker for predicting immunotherapy response (34), immune infiltration score (IIS), T cell infiltration score (TIS), antigen presentation machinery score (APS), and tumor immunogenicity score (TIGS) were computed. Briefly, IIS indicated total immune infiltration level in the tumor sample and was calculated as the mean of standardized infiltration scores for all kinds of immune cells obtained from the GSVA algorithm. Similarly, TIS was calculated using T cell subsets, including CD8+ T, T helper, T, Tcm, Tem, Th1, Th2, Th17, and Treg cells. APS was calculated with GSVA using APM related genes (PSMB5, PSMB6, PSMB7, PSMB8, PSMB9, PSMB10, TAP1, TAP2, ERAP1, ERAP2, CANX, CALR, PDIA3, TAPBP, B2M, HLA-A, HLA-B, and HLA-C). Tumor burden (TMB) was the number of non-synonymous mutations per megabase (MB). Here, we used 38 MB as the estimate of exome size and defined the TMB as the quotient of non-synonymous mutations and 38MB. Then, TIGS was calculated by multiply APS and TMB value. Predicted abundance of neoantigens in GBM samples was obtained from a previous study (35).
Prediction of Responses to Immune Checkpoint Blockade (ICB) Therapy
The subclass mapping method (SubMap) (36) was used to compare the gene expression matrices of different GBM subtypes with the expression profiles of several cancer types treated with ICB therapies, including transcriptomic data of 47 melanoma patients who received immunotherapy targeting CTLA-4 and PD-1, and NanoString data of 49 patients with four cancer types treated with anti-PD1 therapy (37, 38). This step was performed using the SubMap module (v3) on the GenePattern website (http://genepattern.broadinstitute.org/). Parameters of SubMap analysis were set as default: num marker genes = 100, num perm = 100, and num perm fisher = 1,000. P-values were adjusted by Bonferroni correction.
Splicing Correlation Network Construction
A list of splicing factors (SFs) was obtained from the SpliceAid2 database (http://www.introni.it/splicing.html). SpliceAid2 database embodies experimental curated splicing factors to help researchers understand the tissue-specific alternative splicing. The SF gene expression profile of GBM patients was retrieved from TCGA RNA-seq data. Overall survival-related SFs were determined using univariate Cox regression analysis. The correlation of SFs and AS events was evaluated by Pearson correlation analysis, and the regulatory network plot was generated in Cytoscape software (v3.8.0).
Construction and Validation of the Nomogram
Multivariable Cox proportional hazards regression analysis was applied with the following clinical-relevant covariates: gender, age, MGMT methylation status, Karnofsky Performance Status (KPS) score, IDH mutation status, and risk score. A combined nomogram was generated by the “regplot” R package (v1.0) as a quantitative tool for predicting the likelihood to die of each patient. The concordance index (C-index) was calculated to assess the consistency between model prediction and actual clinical outcomes of patients. The calibration plot was generated to evaluate the accuracy of the prediction for 1- and 2- year overall survival using this nomogram by the “rms” R package (v5.1-4). Additionally, decision curve analysis (DCA) was applied to evaluate the performance of the nomogram by the “rmda” R package (v1.6).
Statistical Analysis
The intersections of seven types of AS events in GBM were plotted using the “UpSetR” R package (v1.4.0) (39). The “glmnet” package (v3.0-2) was used to conduct the LASSO Cox regression model analysis. Kaplan-Meier survival curves were visualized to discover the difference of clinical outcomes between groups using “survival” and “survminer” R package (v0.4.6). 3D-PCA plot was generated using “mixOmics” (6.10.9) (40) and “rgl” (v0.100.5) (https://cran.r-project.org/web/packages/rgl/index.html) R package.
Restricted mean survival (RMS) represents the loss in average life expectancy for patients. We performed RMS time calculation based on the univariable Cox proportional hazards regression of overall survival (41). RMS and time ratio were estimated using the “survRM2” R package (v1.0-2).
ESTIMATE is a widely used method that can infer the fraction of immune and stromal cells in tumor samples using the gene expression profile (42). Tumor purity was defined as the percentage of malignant cells in a solid tumor sample. Here, the purity of each GBM sample was assessed by package “ESTIMATE” (v1.0.13, https://bioinformatics.mdanderson.org/estimate/rpackage.html). Furthermore, the tumor purity was further validated using the “TPES” R package (v1.0.0), which is a computational method for estimating tumor purity from single-nucleotide variants. Here, the tumor purity indexes of the TCGA-GBM samples calculated using the “TPES” algorithm were derived from the supplementary files of published literature (43).
All statistical analyses were performed using R (version 3.6.1, www.r-project.org), with chi-square or Fisher’s exact test for patients’ characteristics in different clusters, a Mann-Whitney U test for testing the differences in means of continuous data, and log-rank test for survival analysis. For all hypothetical tests, a two-sided P-value < 0.05 was considered to be statistically significant.
Results
The Landscape of AS Events in GBM
Integrated mRNA AS events profile was analyzed for 152 GBM patients from the TCGA cohort. Under the stringent filtering criteria, a total of 15,907 AS events from 6,491 genes were identified (Table S1). These AS events consisted of seven different splicing patterns: Alternate Acceptor site (AA), Alternate Donor site (AD), Alternate Promoter (AP), Alternate Terminator (AT), Exon Skip (ES), Retained Intron (RI), and Mutually Exclusive Exons (ME). Visualization of specific numbers and intersections of all types of AS events in GBM was generated in Figure 1A. Among all these types, ES and AP splicing modes accounted for almost 60% of the total number (9,478/15,907). Notably, a single gene may have more than one type of splicing patterns. We detected 2,184 genes contain two or more types of AS events in GBM samples. For instance, PDE4DIP has six types of AS events, including AA, AD, AP, AT, ES, and RI.
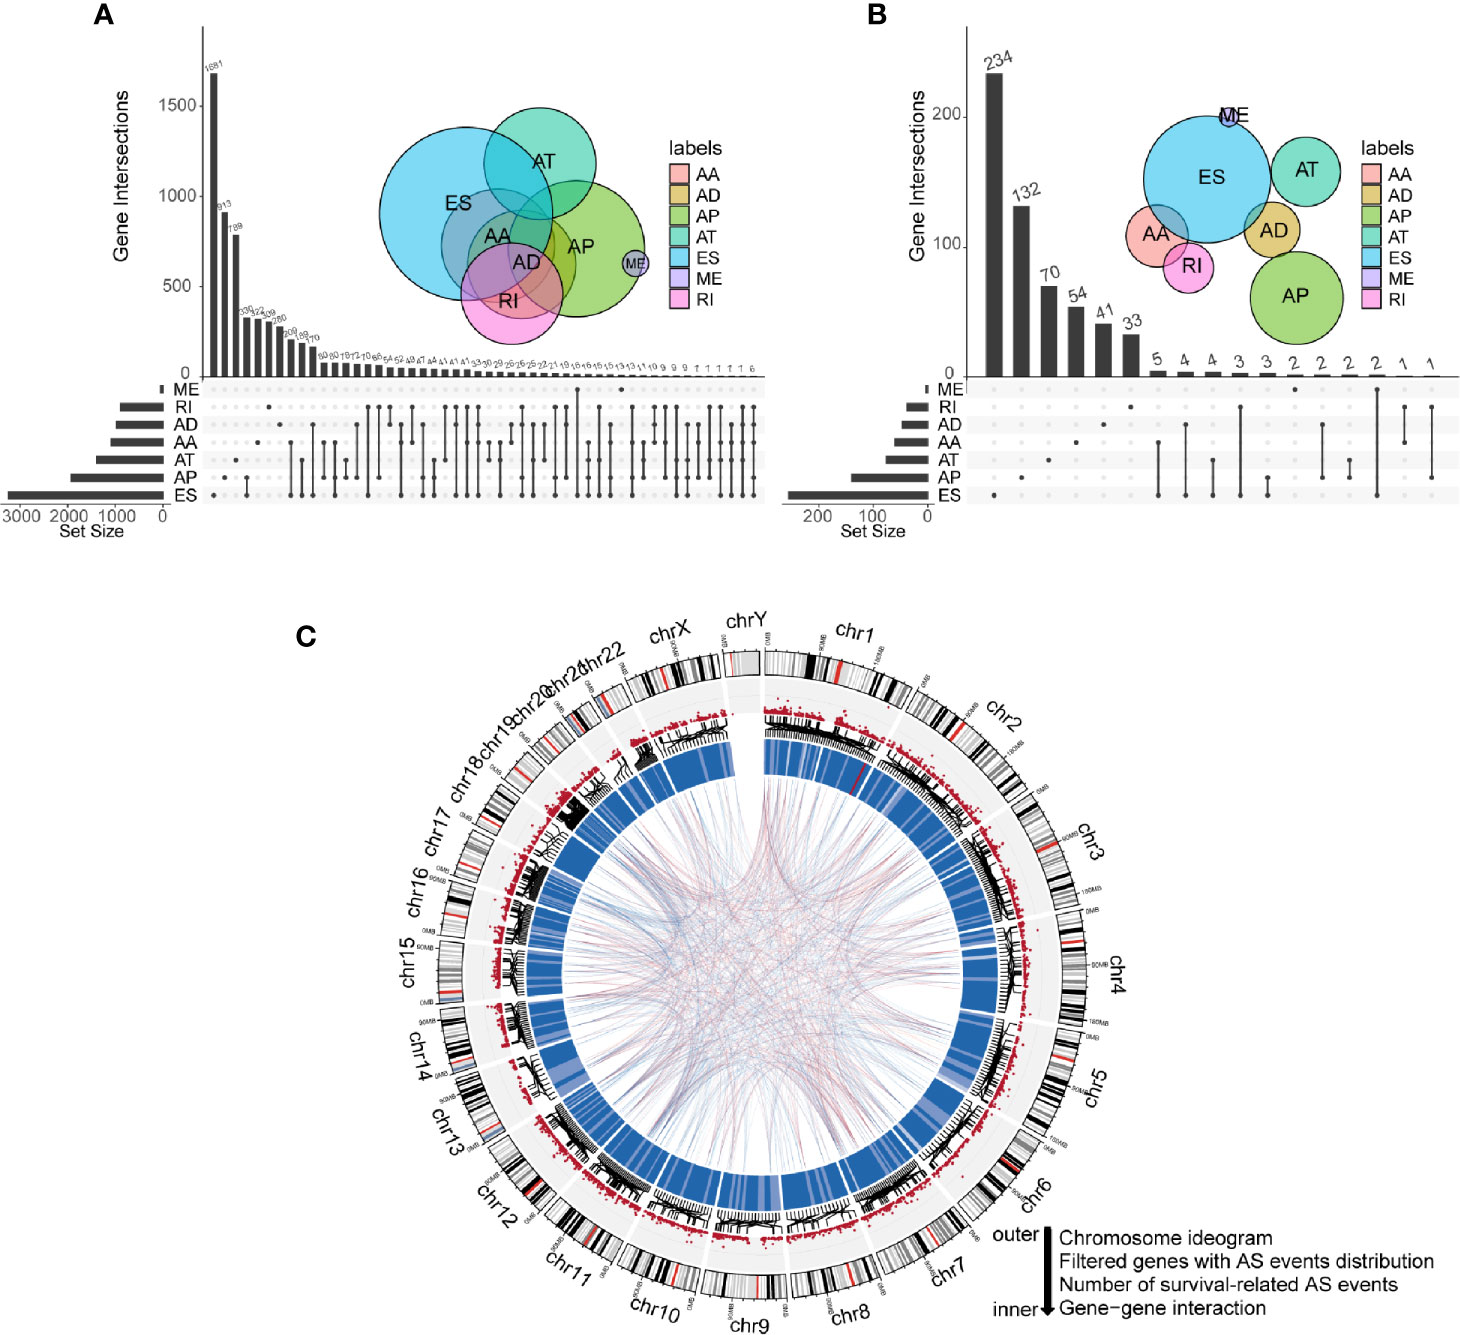
Figure 1 Profiling of all and prognostic alternative splicing (AS) events in glioblastoma (GBM). (A) UpSet diagram of interactions between all alternative splicing events in GBM. (B) UpSet diagram of interactions between overall survival-related AS events in GBM. (C) Circos plot of all AS events, prognostic AS events, and their parent genes in chromosomes. The circle panels from the outer to inner were described as follows: chromosome ideogram, genes with AS events distribution, number of survival-related AS events, and gene-gene interaction.
To explore the correlations between AS events and the overall survival of GBM patients, we performed univariate Cox regression analysis using PSI values of all AS events and survival information of patients. Eventually, 775 AS events of 593 genes were confirmed to be prognostic in GBM (P-value < 0.05). Among them, we noticed that some genes have more than one type of prognostic AS events. For example, AA and ES splicing modes of ATG4D were all associated with overall survival. The UpSet plot diagram was illustrated to visualize the interactions among these AS events (Figure 1B). A more intuitive landscape of AS events and their prognostic value in GBM was shown using the circos plot (Figure 1C).
Construction of an AS Events-Based Prognostic Model for GBM
Numerous survival-related AS events were identified after performing univariate Cox regression analysis. In order to get the AS events with the greatest potential prognostic value, LASSO Cox regression analysis was carried out, and 18 AS events were finally selected (Figures 2A, B). We also validated whether the original genes of these 18 AS events are survival-related factors when applying the univariate Cox regression analysis to the corresponding gene expression profiles, and we found that only two of them remain statistically significant, including SERGEF and FAM86B1 (P-value < 0.05) (Figure 2C). Besides, only SERGEF and its splicing isoform, SERGEF-14562-AD, shared similar prognostic value, while FAM86B1 and FAM86B1-82719-AD had the reverse patterns in prognostic value. As revealed above, we identified and characterized that isoform-based analysis can capture some meaningful transcripts that were not available for gene-level analysis.
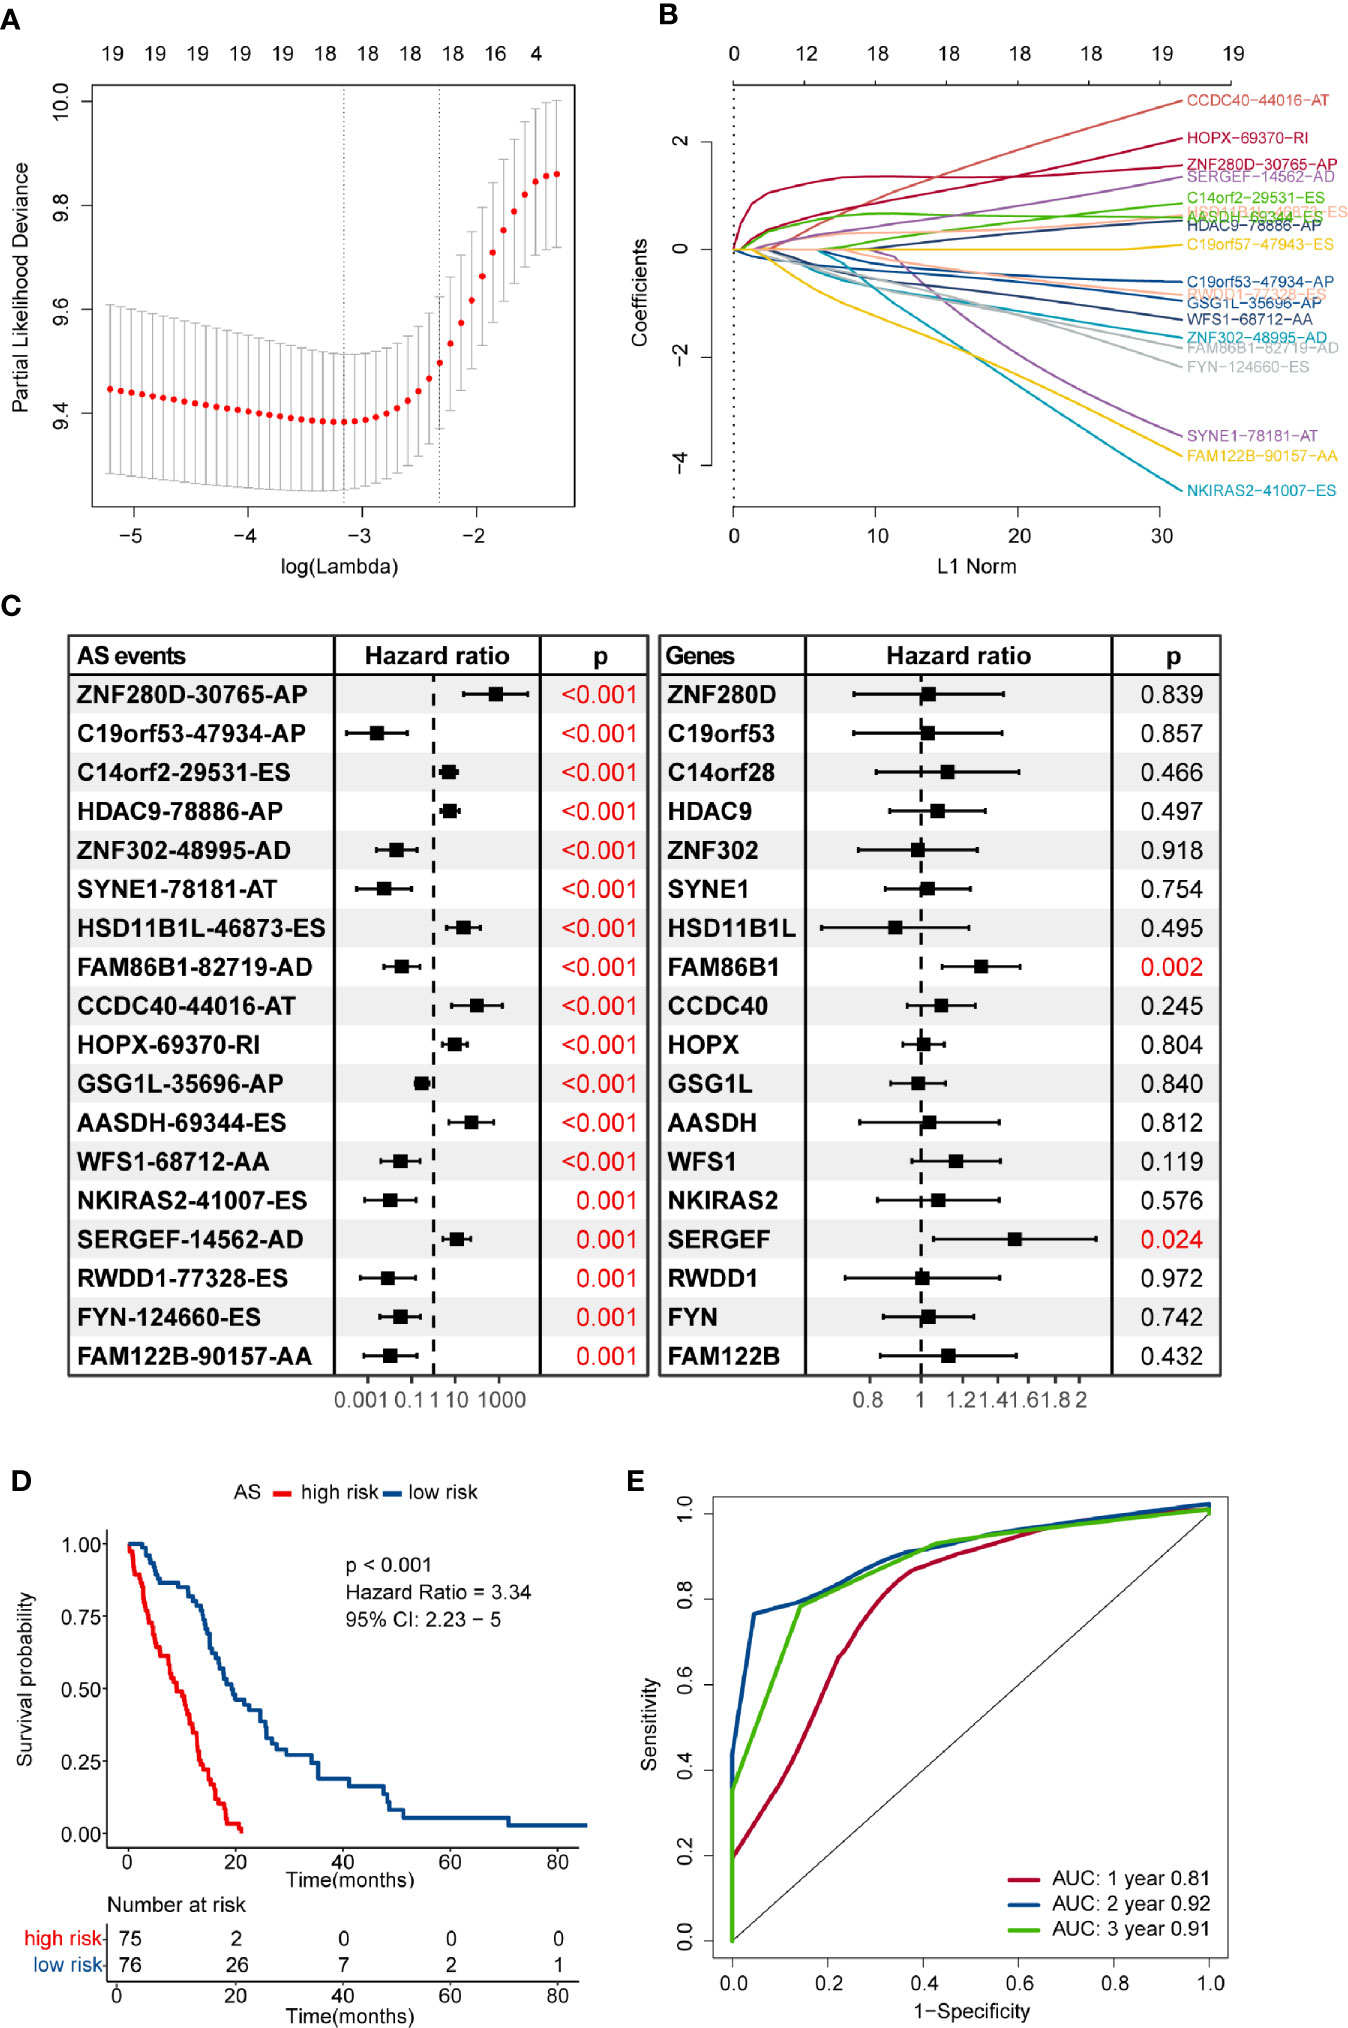
Figure 2 Construction and evaluation of an alternative splicing (AS) events-based risk model. (A) The partial likelihood deviance was plotted using vertical lines with red dots, and the dotted vertical lines represent values based on minimum criteria and 1-SE criteria, respectively. A value λ = 0.035 with log(λ) = -3.349 was chosen via minimum criteria. (B) Least absolute shrinkage and selection operator (LASSO) coefficient profiles of the candidate AS events by 10-fold cross-validation. (C) Prognostic value of the candidate AS events and their corresponding genes in the glioblastoma (GBM) cohort. The hazard ratio (HR) and P-values were calculated using the univariate Cox regression analysis. (D) Comparison of overall survival according to the AS events-based signature for patients. (E) Time-dependent receiver operating characteristic (ROC) analysis was used to assess the performance of the risk model in predicting 1-, 2- and 3-year survival of GBM patients.
Then, we developed a formula to compute the risk score for each GBM patient based on the PSI values and regression coefficients of AS events. The risk score of each GBM sample ranged from -13.782 to -7.970, and the median score of -10.569 was defined as the cut-off to separate the whole GBM cohort into high- and low-risk groups. The efficacy of the risk model for predicting overall survival of GBM patients was evaluated by performing Kaplan–Meier survival analysis. The result indicated that the risk score-based signature was significantly associated with the prognosis of GBM patients. Patients in the high-risk group had worse clinical outcomes than those in the low-risk group (HR = 3.34, 95% CI: 2.23–5, P < 0.001) (Figure 2D). The performance of the risk model was assessed in terms of the RMS time ratio between different risk groups, and significant shorter RMS time were observed in high-risk group compared with their low-risk counterparts (RMSlow-risk/RMShigh-risk = 1.793, 95% CI: 1.514–2.123, P < 0.001) (Table S2). Time-dependent ROC curves evaluated the performance of this risk model in predicting outcomes, and the area under the ROC curve was 0.81 at 1-year, 0.92 at 2-year, and 0.91 at 3-year, respectively (Figure 2E).
The risk score distribution, survival status, and AS events profile of this signature were shown in Figure 3A. More patients were found dead in the high-risk group than the low-risk group, and the overall survival time of high-risk patients was much shorter than patients of low-risk. We further calculated the different usage of the transcript isoforms in the alternative splicing signature in the different risk groups. The PSI value represents the frequency of the specific transcript isoform that occurred in the alternative splicing process. Therefore, we compared the PSI values of these AS events in the risk model signature to reflect the differential usage of the mRNA isoforms. The abundance of the risky AS events with HR greater than one in the high-risk group were more than the low-risk group, while the opposite pattern occurred in the protective AS events (Figure 3B). These results indicated that the substantial differences in survival between high- and low-risk groups might result from the isoform switching.
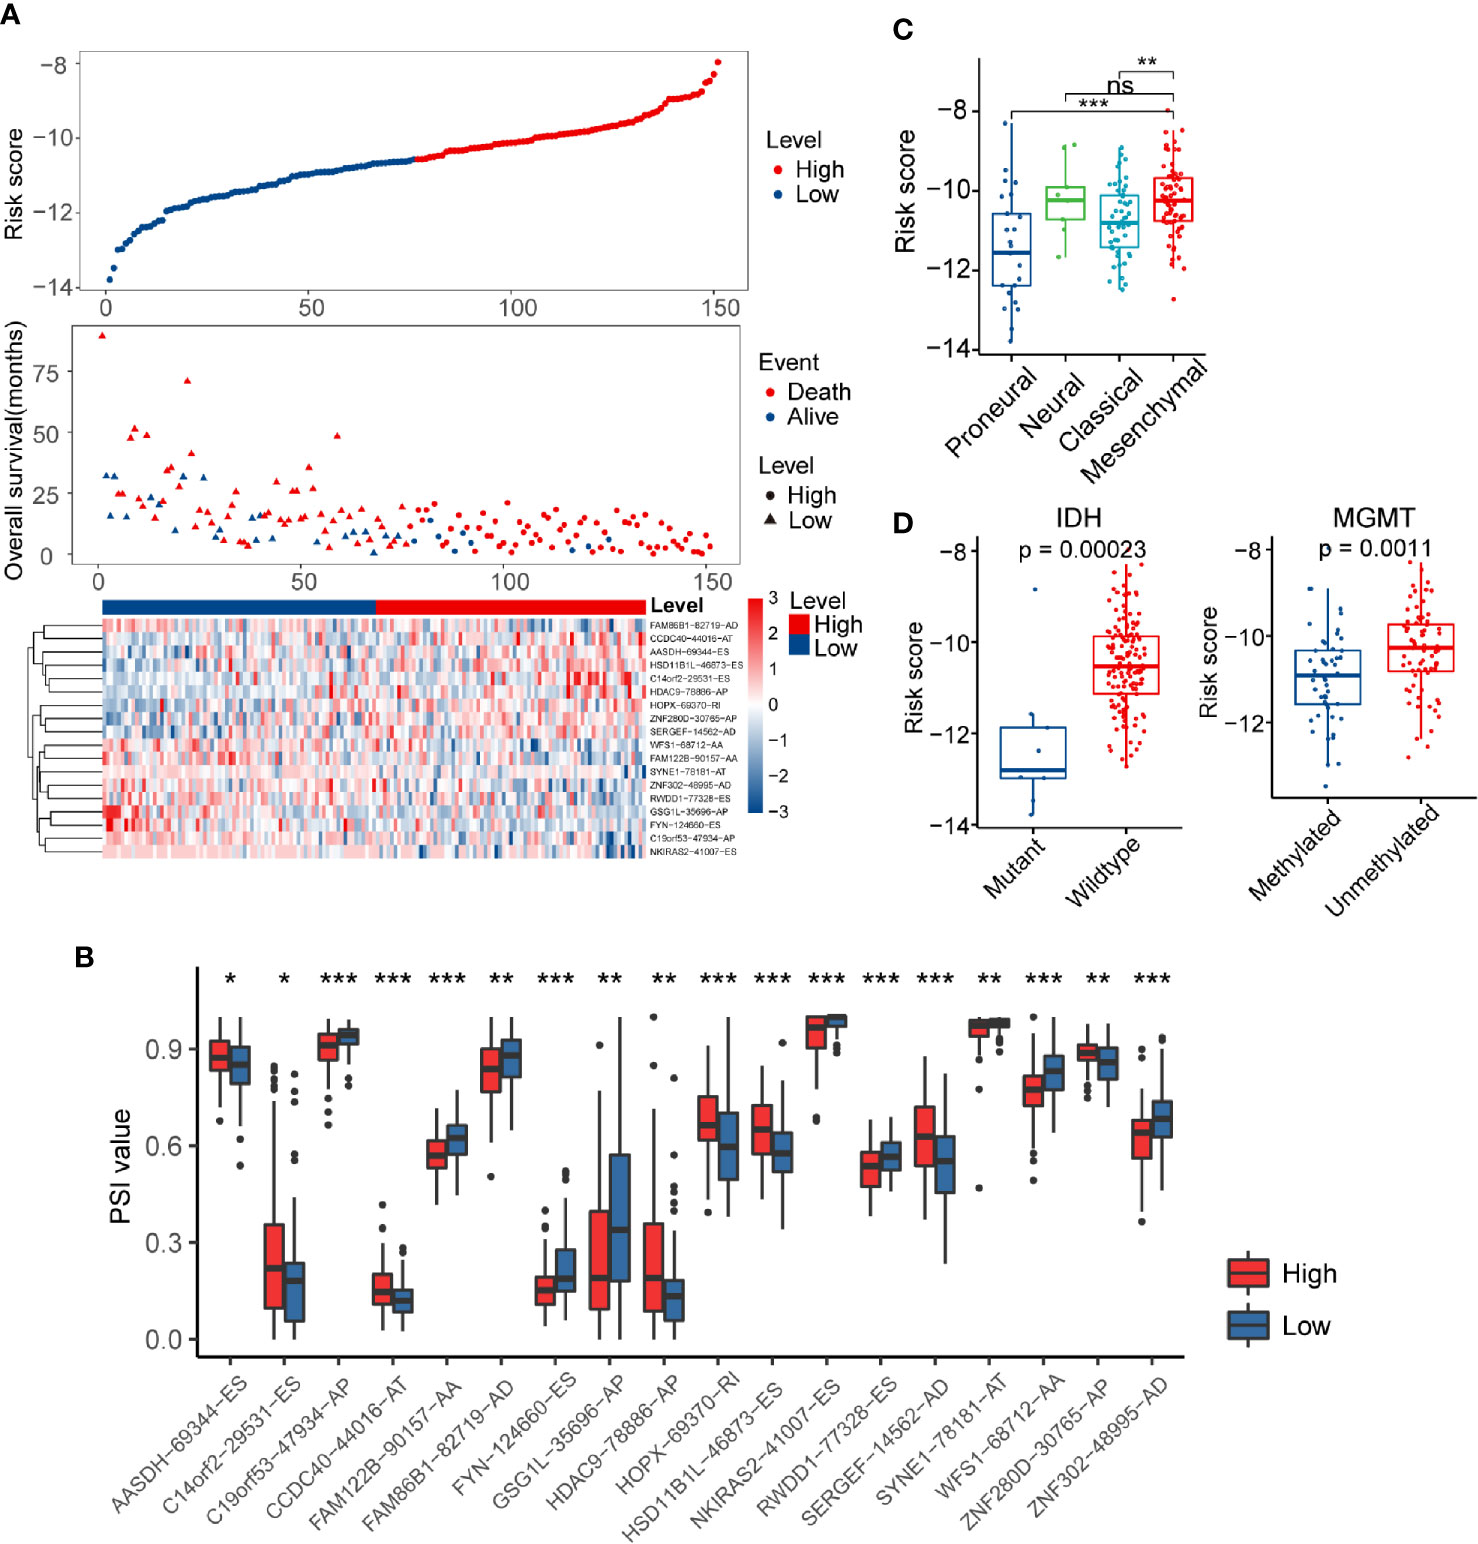
Figure 3 Distribution of the risk score and differences in clinicopathological features in glioblastoma (GBM) patients. (A) Overview of risk score, clinical outcomes of patients, and expression heatmap of 18 alternative splicing (AS) events in the signature. (B) Boxplots visualizing the different levels of Percent Spliced In (PSI) values between the high- and low-risk groups. (C) Risk score in different molecular subtypes of The Cancer Genome Atlas Project (TCGA) classification scheme. (D) Comparison of risk score according to IDH mutation status or MGMT methylation status. * indicates P < 0.05; ** indicates P < 0.01; *** indicates P < 0.001.
Verhaak’s GBM molecular classification was developed based on the gene expression profile of the TCGA GBM cohort and has been widely used for GBM research (9). The Verhaak subtype information of each sample in the present study was obtained from UCSC Xena (https://xenabrowser.net/). Next, we investigated the inter-tumor heterogeneity of risk score by examining the relationship of risk score with different Verhaak’s subtypes. Higher scores were found in the mesenchymal subtype compared to the classical and proneural subtype (Figure 3C). IDH mutation and MGMT methylation status are well-documented GBM molecular markers that can predict the overall survival of patients (44). In general, IDH wild-type and MGMT unmethylated status usually indicate a worse prognosis. We separated GBM patients into different groups based on these two biomarkers to explore the association between risk score and IDH mutation/MGMT methylation status (Figure 3D). We noticed that the risk score was significantly higher in the IDH wild-type group than the IDH mutation group (P < 0.001). A similar result was also found in MGMT unmethylated group (P < 0.01). Furthermore, the HRs for the AS events-based signature in the univariate and multivariate Cox regression analyses were 2.718 (P < 0.001, 95% CI: 2.186–3.38) and 2.496 (P < 0.001, 95% CI: 1.802–3.458), respectively (Table S3). Thus, the risk score model was proved to be an independent prognostic factor for GBM patients.
SNF-CC Identified Two Distinct Subtypes of GBM Patients
Patients without detailed survival information were excluded before performing the SNF-CC algorithm, and then PSI values of AS events in all samples were scaled via z-score standardization. The built-in Cox model function of the “CancerSubtypes” package enabled us to filter crucial survival-related splicing patterns specific to GBM. The performance of this clustering method was assessed by clustering heatmap, CDF curves, and silhouette width. The results demonstrated that SNF-CC achieved adequate robustness when all GBM patients were categorized into two distinct clusters, with Cluster1 consists of 45 patients and Cluster2 of 106 patients (Figure 4A, Figure S1). PCA analysis supported the effectiveness of this clustering method in defining GBM sub-grouping based on survival-related AS events (Figure 4B). Importantly, statistically significant differences in outcomes of patients were observed in these two clusters, and Cluster2 patients showed worse prognoses than those of Cluster 1 (HR = 2.07, 95% CI: 1.44–2.97, P < 0.001) (Figure 4C). A higher proportion of patients with IDH wild-type (fractions, 99.03% vs 81.82%, P = 3.06e-4) and MGMT unmethylation (fractions, 64.37% vs 44.44%, P = 0.047) was observed in Cluster2 compared with Cluster1 (Figure 4D). Also, we found a significant difference in Verhaak’s subtype among two clusters (P = 4.97e-11), and Cluster2 had more mesenchymal GBMs than Cluster1 (fractions, 55.24% vs. 15.91%) (Figure 4E). The EM/PM subtype is another glioma molecular classification based on the coexpression modules of EGFR and PDGFRA (45). The prognosis of EM glioma was much worse than PM glioma. Here, we noticed a significant relationship between EM/PM subtype and the novel classification scheme we developed (P = 1.23e-5), and Cluster2 had more EMhigh samples than Cluster1 (fractions, 71.43% vs 50%).
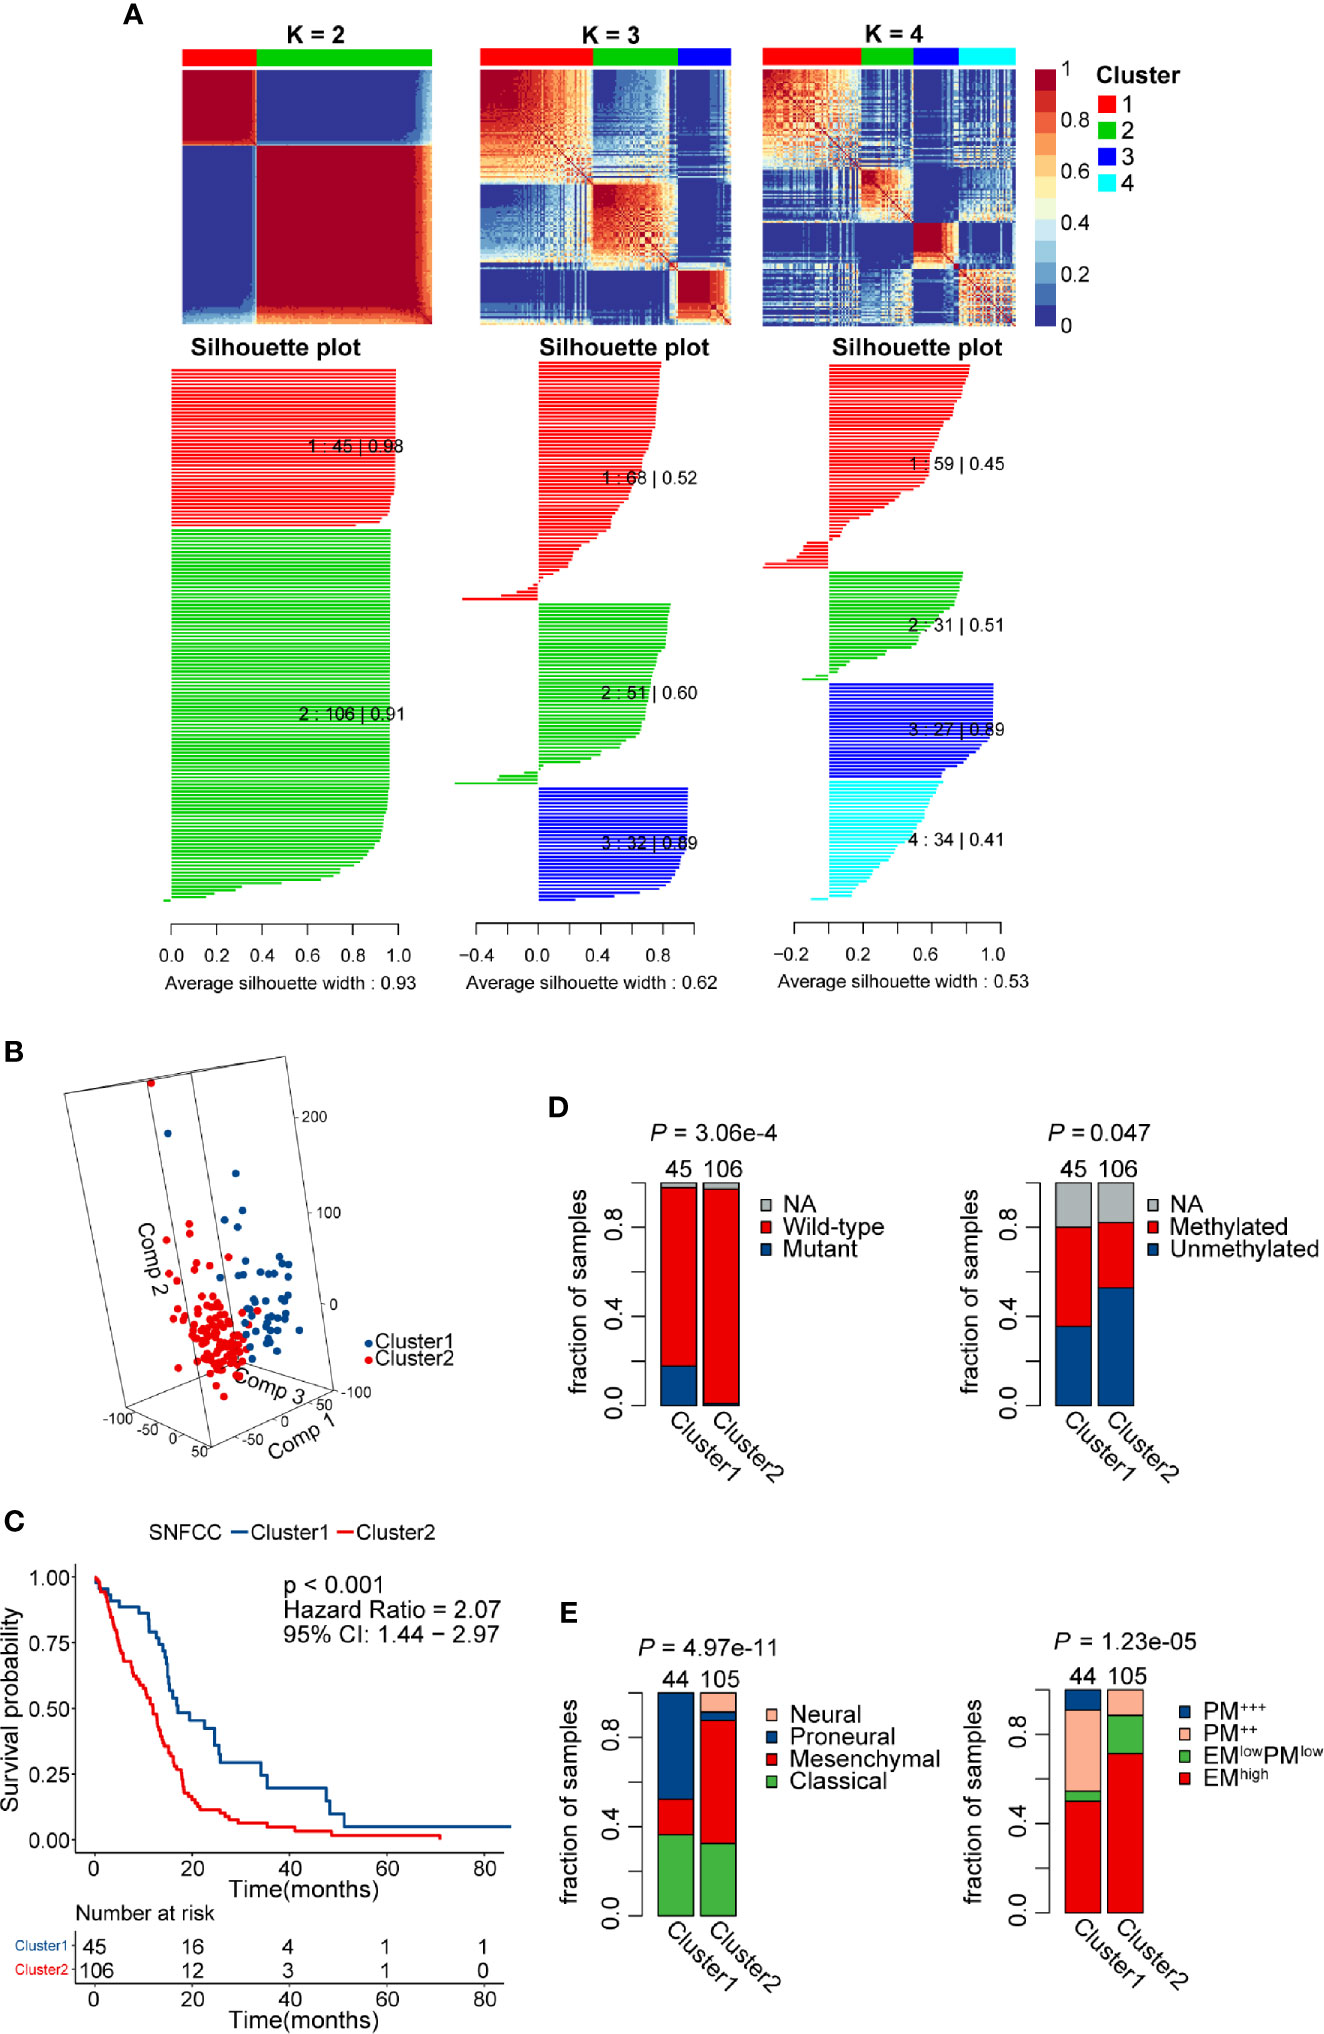
Figure 4 Identification of two distinct clusters using the similarity network fusion and consensus clustering (SNF-CC) method. (A) Heatmap of the sample similarity matrix and silhouette width plots of the subtypes for k = 2 to 4. (B) 3D-PCA (Principal Components Analysis) plot of patients in different clusters. Comp 1, Comp 2, and Comp 3 on axes represent three principal components respectively. (C) Comparison of overall survival for patients of different clusters. (D) Novel glioblastoma (GBM) classification was associated with IDH mutation and MGMT methylation status. Cluster2 tumors had a significantly higher IDH wild-type and MGMT unmethylation rate. (E) Significant associations between alternative splicing (AS) events-based classification and other GBM molecular subtypes. Cluster2 tumors had a significantly higher mesenchymal and EM subtype rate.
The remarkable differences in both clinicopathological and molecular characteristics between these two clusters suggested that different functional annotations and signaling pathways might exist. GSEA manifested a remarkable activation in cancer-associated signaling pathways was significantly enriched in Cluster2 compared with Cluster1, including epithelial-mesenchymal transition (NES = 2.27, FDR = 5.1e-4), P53 (NES = 1.52, FDR = 4.3e-3), IL6 JAK STAT3 signaling (NES = 2.35, FDR = 5.1e-4), and interferon-gamma response pathways (NES = 2.5, FDR = 5.1e-4) (Figure 5A, Table S4). Besides the cancer hallmark biological processes, Cluster2 was also involved in various immune-related responses, such as inflammatory response (NES = 2.55, FDR = 2e-3), adaptive innate immune response (NES = 2.59, FDR = 2e-3), innate immune response (NES = 2.49, FDR = 4.3e-3), and immune effector process regulation (NES = 2.34, FDR = 2e-3). Overexpressed genes in Cluster2 (log2-fold change > 1 and adjusted P-value < 0.05) were calculated as input for functional annotation analyses using Metascape. The GO and KEGG enrichment analysis indicated that Cluster2 had enriched genomic biological processes, including human immune response, cytokine-cytokine receptor interaction, T cell activation, cytokine production, IL-10 signaling, and regulation of leukocyte migration (Figure 5B).
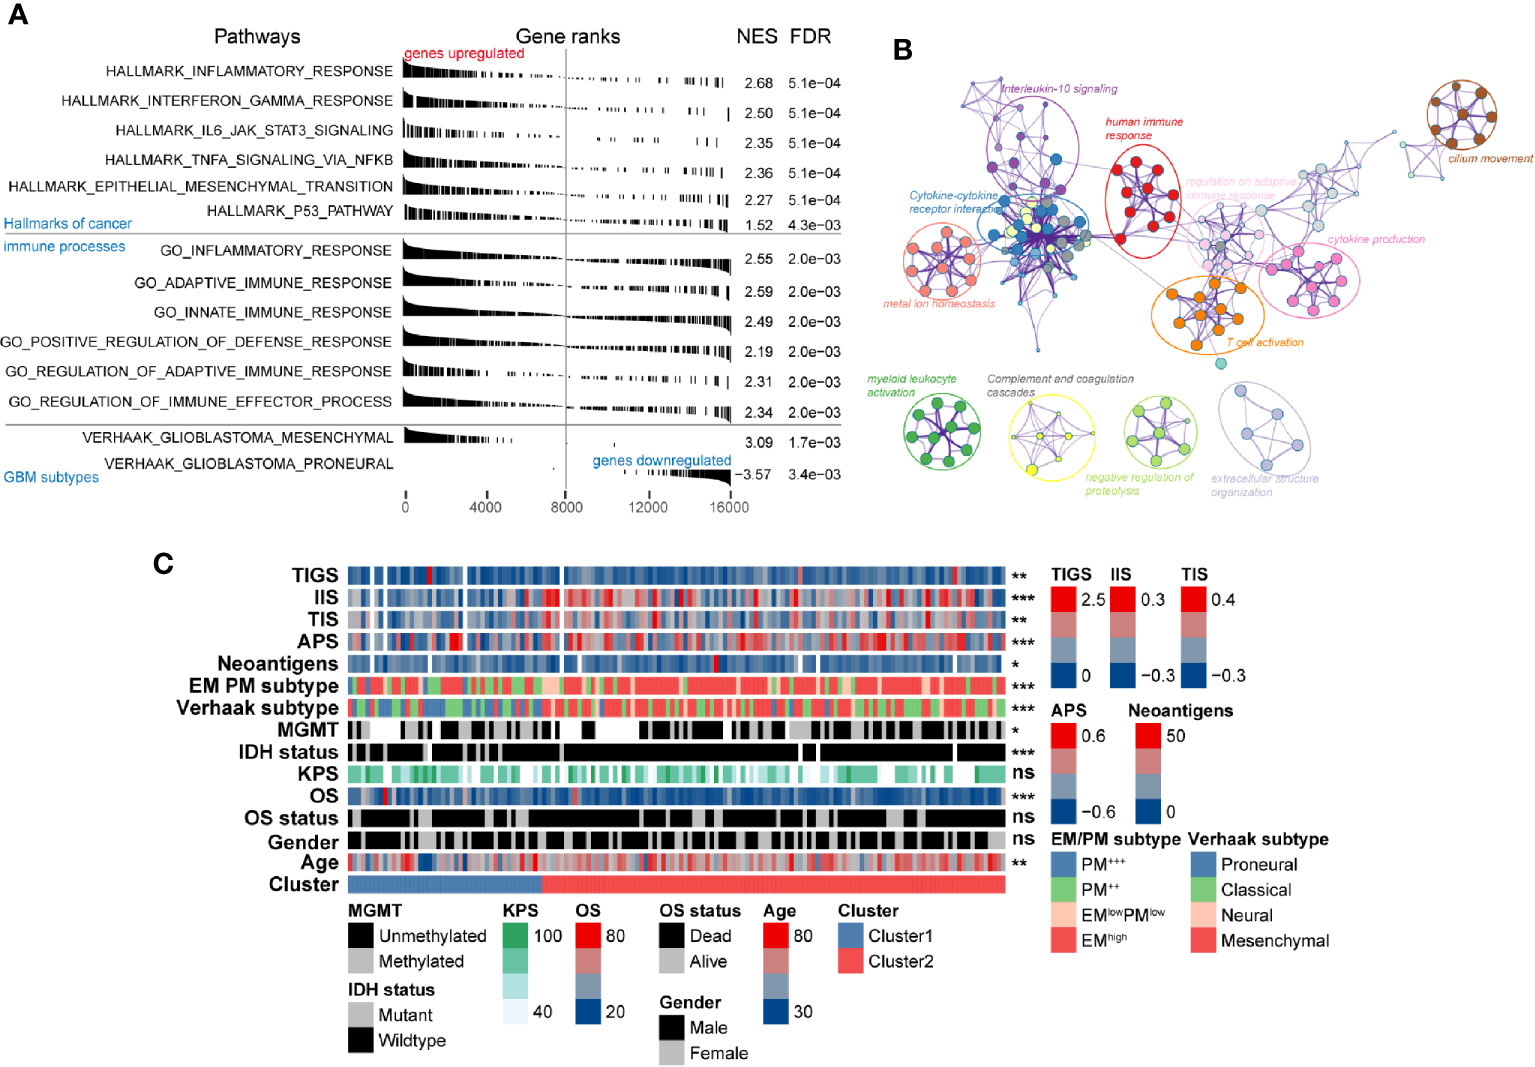
Figure 5 Functional annotation of the molecular differences and comparison of immunological features in different clusters. (A) Gene set enrichment analysis showing significant enrichment of various signaling pathways and gene sets in Cluster2 compared with that in Cluster1. The label of “genes upregulated” and “genes downregulated” represent genes upregulated/downregulated in Cluster2 compared with Cluster1. (B) Network of biological processes and signaling pathways enriched in genes upregulated in Cluster2 compared with Cluster1. (C) The association between novel alternative splicing (AS)-based glioblastoma (GBM) classification, clinicopathological factors, GBM subtypes, and immune features was annotated in the heatmap.
Association of Identified Subtypes With Immune Cell Infiltration in the GBM Microenvironment
The intratumoral microenvironment is a complex that consists of the tumor and non-tumor cells, such as stromal and immune cells (46). These non-malignant cells can regulate the progression of tumorigenesis via the cross-talk with malignant cells in GBM (47). We found that both IIS and TIS were much higher in Cluster2 than in Cluster1, which represented higher relative fractions of total immune cells (P < 0.001), and T cell subsets (P < 0.01) were infiltrated in tumors of Cluster2 (Figure 5C). Recently, immunotherapies targeting immune checkpoints blockade (ICB) had been proved to exhibit critical anti-tumor functions by promoting anti-tumor immune responses and inhibiting immunosuppressive effects. Clinical outcome of ICB therapy has been reported to be closely related to neoantigen abundance in some cancers (48, 49). Here, a significant depletion of the neoantigen burden was found in Cluster2 (P < 0.05). Besides, we also noticed a relatively higher level of APS in Cluster2 compared with Cluster1 (P < 0.001). In glioma, decreasing of neoantigens was tightly associated with intact APM function, increased infiltration of immune cells, and active immune processes (50). This may explain the phenomenon that Cluster2 contained higher APS, IIS, and TIS while harboring lower numbers of neoantigens.
To further validate the association between immune system processes and these two subtypes, the ssGSEA method was performed to estimate the differences in the detailed immune infiltration of 24 types of immune cells between these clusters (Figure 6A). We found that Cluster2 exhibited a higher abundance of pro-tumor immune cell types, including mast cells, immature dendritic cells (iDCs), CD56dim natural killer cells, macrophages, neutrophils, and regulatory T cells (Tregs) (Figure 6B). Meanwhile, anti-tumor immune cells, such as CD8+ T cells and B cells, were significantly significantly depleted in Cluster2 samples. These results indicated that the enrichment of numerous immune-related pathways in Cluster2 might result from the differences in recruitment or differentiation of diverse immune cells in tumors.
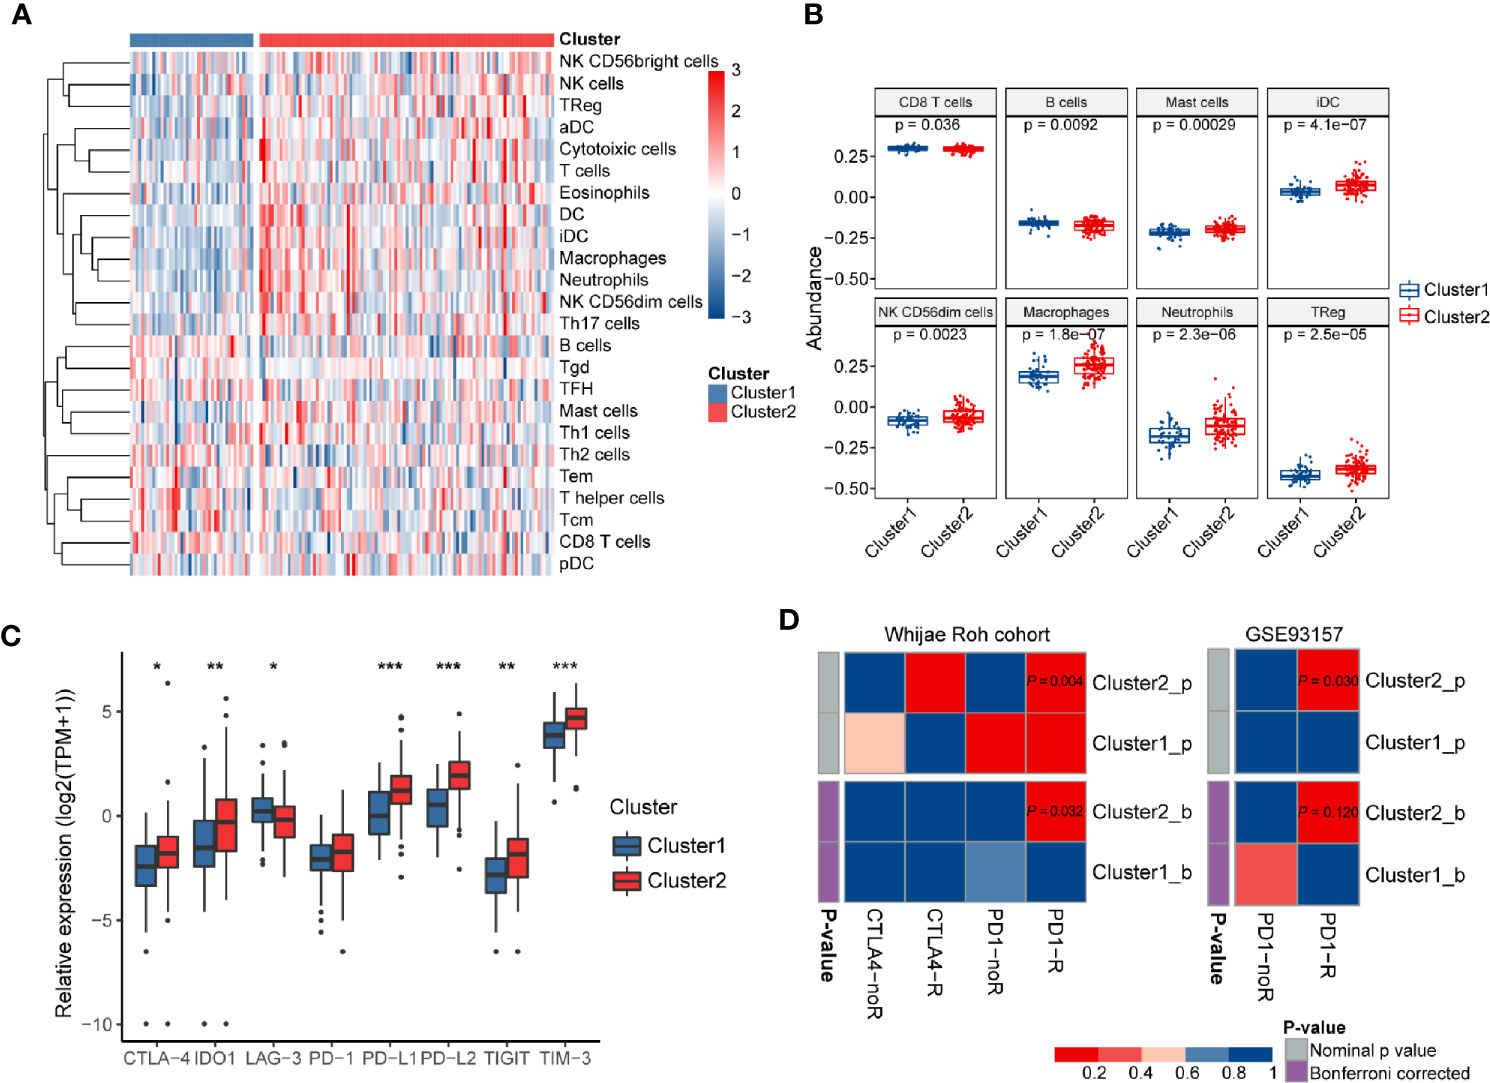
Figure 6 The immune landscapes and predicted immunotherapeutic responses among different clusters. (A) The relative proportion of immune cell infiltration in the two clusters obtained by ssGSEA analysis. (B) Boxplots visualizing significantly different abundance levels of infiltrated immune cells between the two clusters. (C) Comparison of the mRNA expression levels of several different immune checkpoints between these two clusters. (D) SubMap analysis of the GBM subtypes and two independent immunotherapeutic treatment datasets. SubMap analysis suggested that patients of Cluster2 may be more sensitive to anti-PD-1 immunotherapy. The colors in the cells represent the nominal and Bonferroni corrected p values.
Wang et al. pointed out that TIGS is an ideal index to predict clinical response to ICB therapy (33). Therefore, a higher TIGS level in Cluster2 suggested more patients may benefit from ICB therapy than those of Cluster1. The expression levels of immune checkpoints have been proposed to be useful references for selecting patients receiving immunotherapy. Thus, we further investigated the expression levels of several well-known immune checkpoints (TIM-3, TIGIT, LAG-3, PD-1, CTLA-4, PD-L1, PD-L2, and IDO1) between two distinct clusters. Most of them were more highly expressed in Cluster2 than in Cluster1 (P < 0.05) (Figure 6C). Finally, SubMap analysis manifested that samples in Cluster2 shared a higher similarity with the expression profile of melanoma patients who were responsive to PD-1 inhibitor treatment (P = 0.004, Bonferroni P = 0.032) (Figure 6D). Moreover, the same procedure performed on another cancer cohort containing 49 baseline tumors in four cancer types, GSE93157, also achieved similar results (P = 0.03, Bonferroni P = 0.12) (Figure 6D). These findings confirmed that GBM samples in Cluster2 may benefit from anti-PD-1 therapy compared with those of Cluster1.
Association of Risk Score and Immunosuppressors
We investigated the association between AS events-based risk score and tumor purity in GBM using both ESTIMATE and TPES algorithms, and we found a stable significant negative correlation among them (ESTIMATE: Pearson correlation coefficient (R) = -0.2, P = 0.015; TPES: R = -0.24, P = 0.0098) (Figure 7A). Meanwhile, higher stromal and immune score were observed in high- than the low-risk group (P < 0.05) (Figure S2). We also explored the relationship between risk score and glioma mediated immunosuppression. The gene sets of glioma-related immunosuppressive factors, including immunosuppressive cytokines and checkpoints, tumor-supportive macrophage chemotactic and skewing molecules, immunosuppressive signaling pathways, and immunosuppressors were extracted from previous reports (51, 52). The risk score was positively correlated with the expression of most genes (Figure S3). Pearson correlation analysis also found that risk score was positively correlated with immunosuppressive genes including TIMP1 (R = 0.450), BIRC3 (R = 0.435), ICAM1 (R = 0.361), CCL2 (R = 0.359), and RAB27A (R = 0.352) (Figure 7B). After that, ssGSEA analysis was carried out to assess the enrichment score of each gene set for every single GBM sample. Positive correlations between risk score and each gene set score were found (Figure 7C), indicating that AS events-based signature played a vital role in immunosuppression in GBM microenvironment.
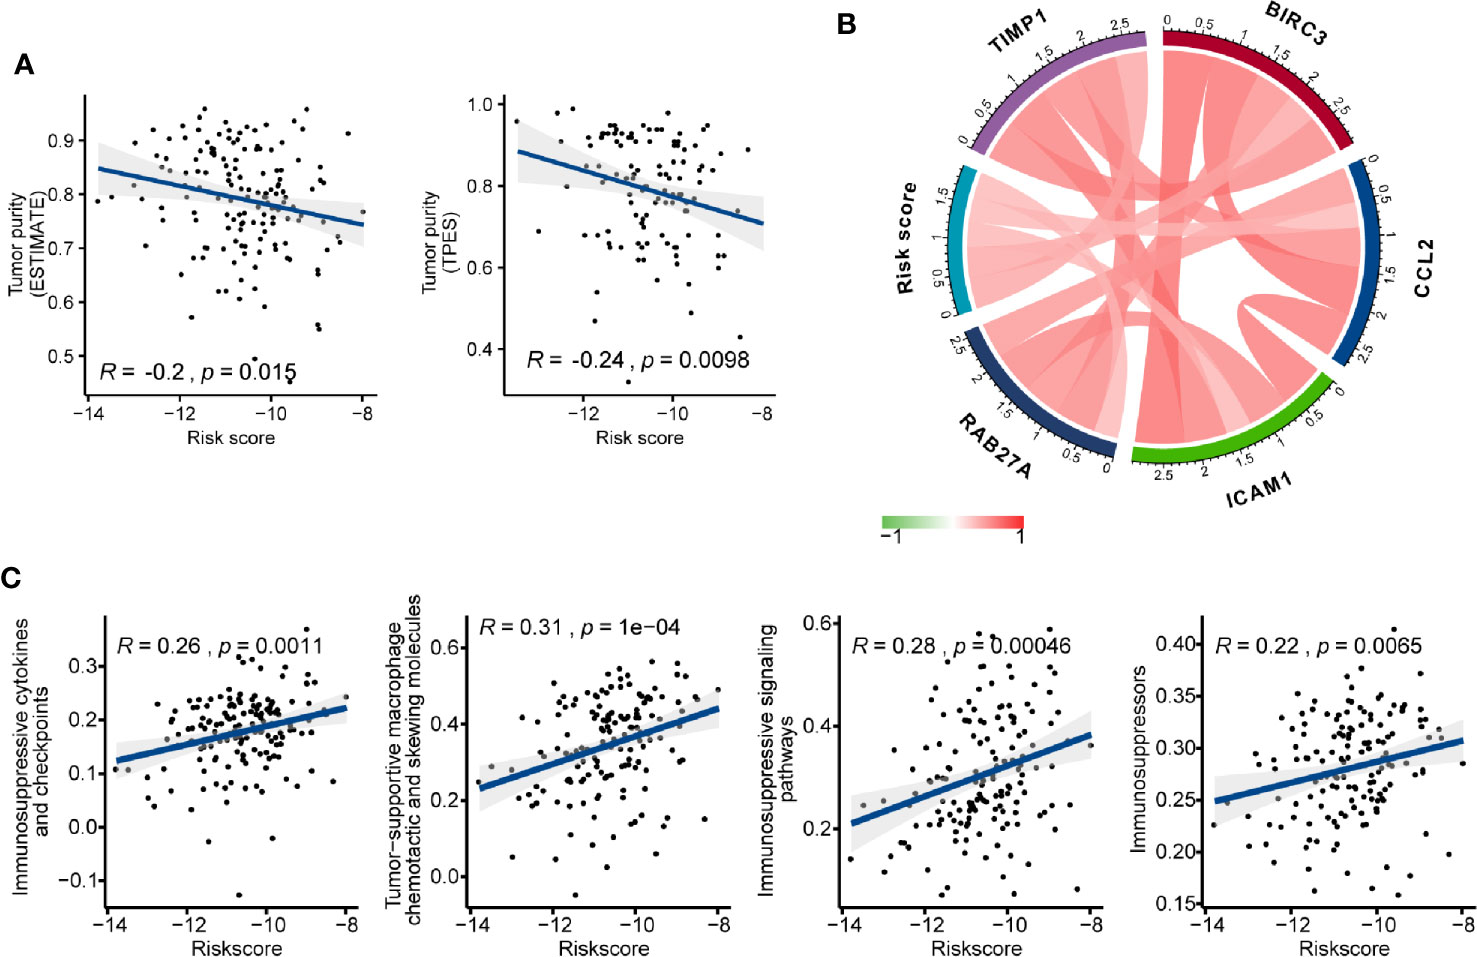
Figure 7 The immunosuppressive function of the alternative splicing (AS) events signature. (A) Correlation of risk score with glioblastoma (GBM) purity estimated by the “ESTIMATE” and “TPES” algorithms, respectively. (B) Correlation of the risk score with the expression levels of several representative immunosuppressive genes. (C) Correlation of risk score with ssGSEA scores of immunosuppressor metagenes.
The Network of Survival-Related AS Events and Splicing Factors
SFs play an important role in regulating the process of exons inclusion and introns exclusion during alternatively splicing pre-mRNA. Changes of SFs lead to the production of diverse splicing patterns of genes, including some oncogenic isoforms, and thus promote or inhibit tumorigenesis (53). In order to depict the potential regulatory network between SFs and prognostic AS events, univariate Cox regression analysis was carried out to identify the survival-related SFs in GBM. 16 SFs were regarded as core SFs (P < 0.05), including CELF6, HSPB1, HSPA5, TIA1, PQBP1, TIAL1, EEF1A1, FAM50B, NUDT21, SMNDC1, HNRNPC, PRMT5, JUP, MYEF2, LSM2, and HNRNPLL. Significant correlations with |R| > 0.4 and P < 0.05 were shown in the network map (Figure S4, Table S5). A total of 14 prognostic SFs were correlated with 116 AS events. Several most significant correlations were presented in Figure 8A.
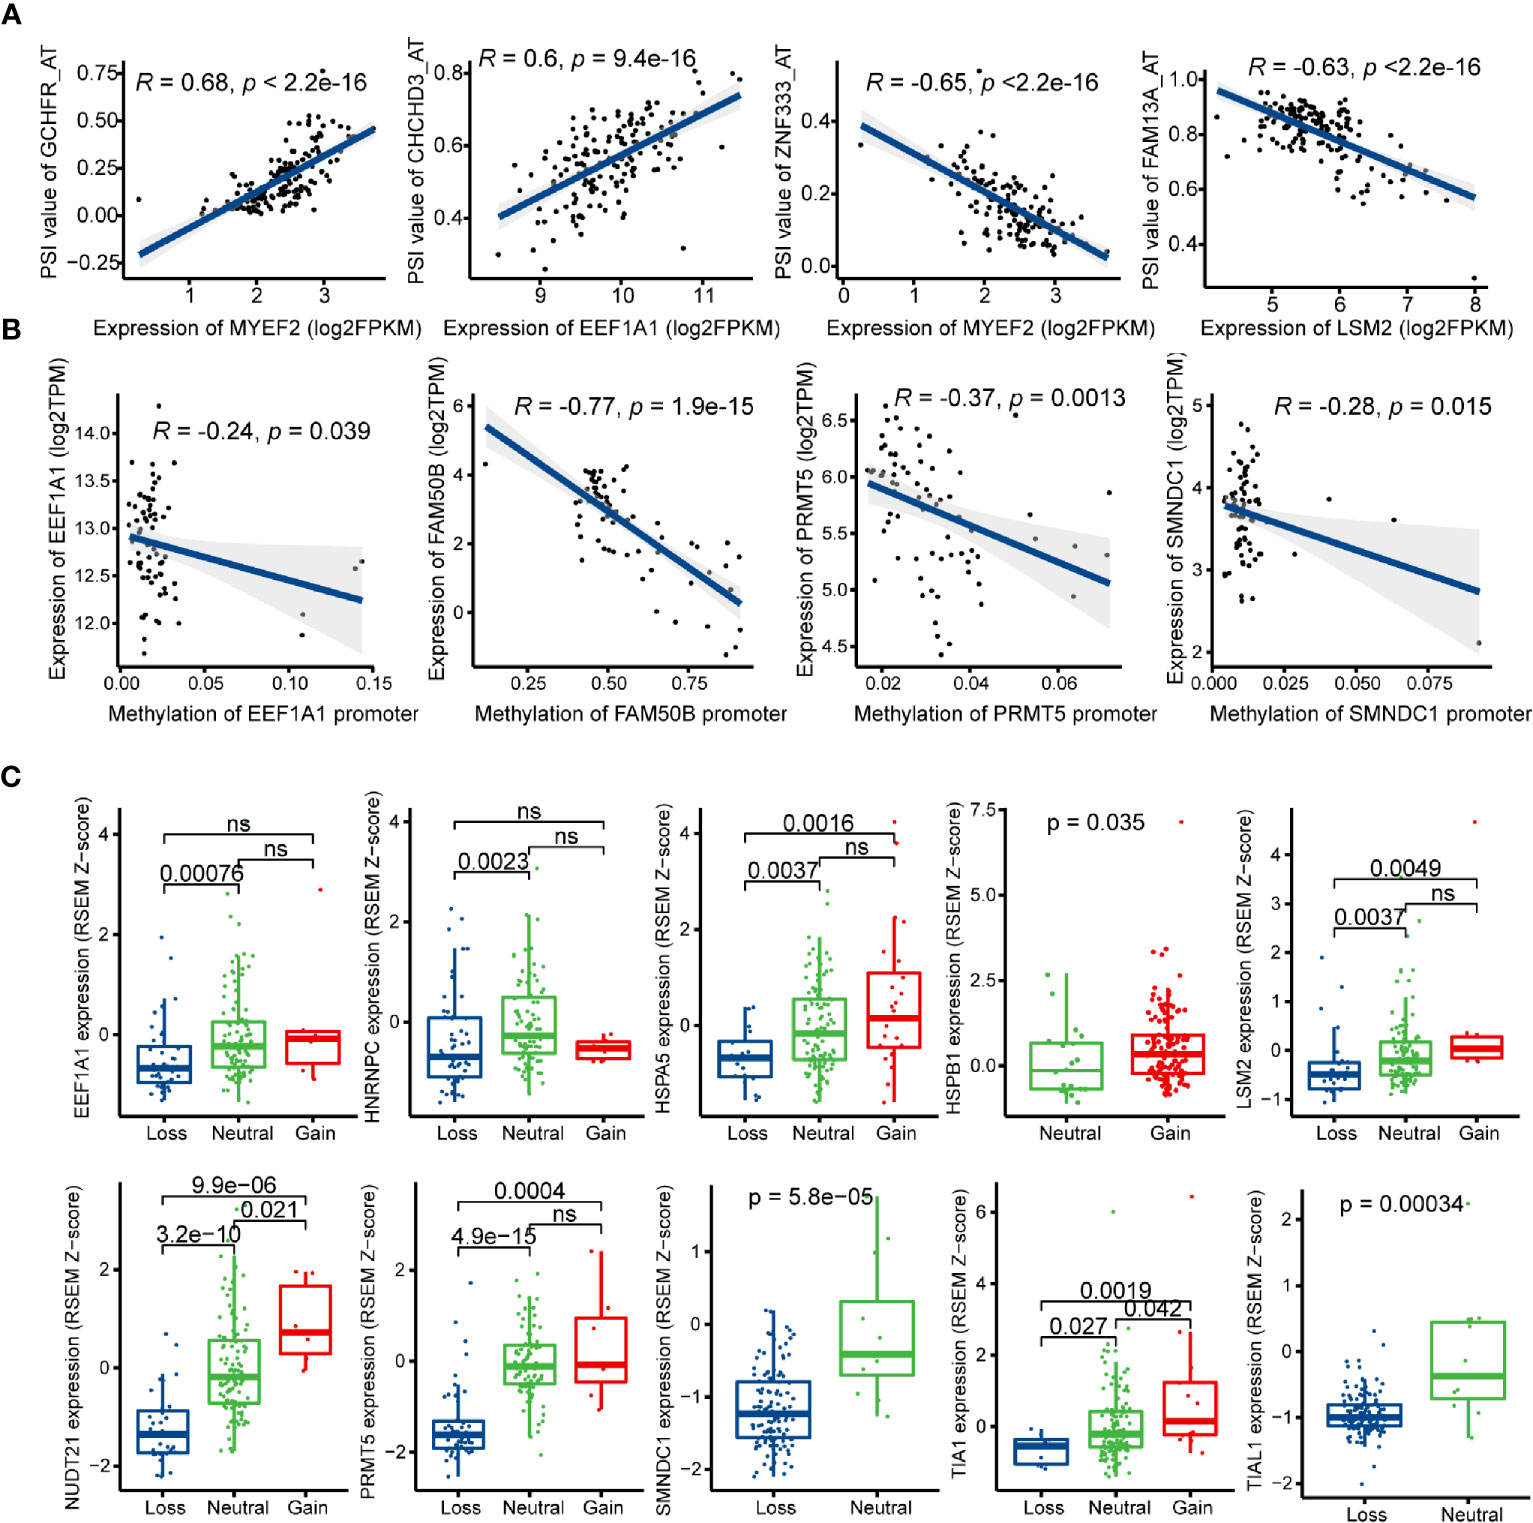
Figure 8 Regulatory mechanisms of splicing factors (SFs) in glioblastoma (GBM). (A) Representative correlations between Percent Spliced In (PSI) values of survival-related alternative splicing (AS) events and the expression of SFs. (B) Representative correlations between expression of SFs and the SFs promoter methylation. (C) Representative boxplots of SFs expression among different copy number status.
Posttranscriptional modification of SFs can also influence alternative splicing, such as phosphorylation and methylation (54, 55). In this study, the methylation levels of EEF1A1, FAM50B, PRMT5, and SMNDC1 promoters were negatively associated with their mRNA expression levels (Figure 8B). Next, we investigated the relationships between copy number alteration (CNA) and expression levels of prognostic SFs, and the expression levels of 10/14 SFs were associated with CNA events (Figure 8C).
Development of a Nomogram Based on AS Events
To develop a quantitative tool for predicting the prognosis of GBM patients, we established a nomogram by integrating clinicopathological risk factors and AS events-based signature based on the multivariable Cox proportional hazards model (Figure 9A). The point scale in the nomogram was utilized to generate point to these variables, and the risk of death of each GBM patient was qualified by accumulating total points of all variables. The risk score was found to have the most excellent weight among all these variables, which was consistent with the result of the previous multivariable Cox regression analysis. The C-index of this nomogram reached 0.774 (95%CI: 0.743–0.805). The result of the calibration plot further confirmed the significant consistency between predicted and observed actual clinical outcomes of GBM patients (Figure 9B). The decision curve analysis showed a higher overall net benefit using the nomogram than either the “treat all” or the “treat none” approach within a range of threshold probabilities > 10% (Figure 9C). Moreover, the same result was found when compared with the base model, which contained age, gender, KPS, IDH status, and MGMT methylation status of patients. All these findings demonstrated that the AS events-based nomogram is an optimal model for predicting the prognosis of GBM patients in clinical management.
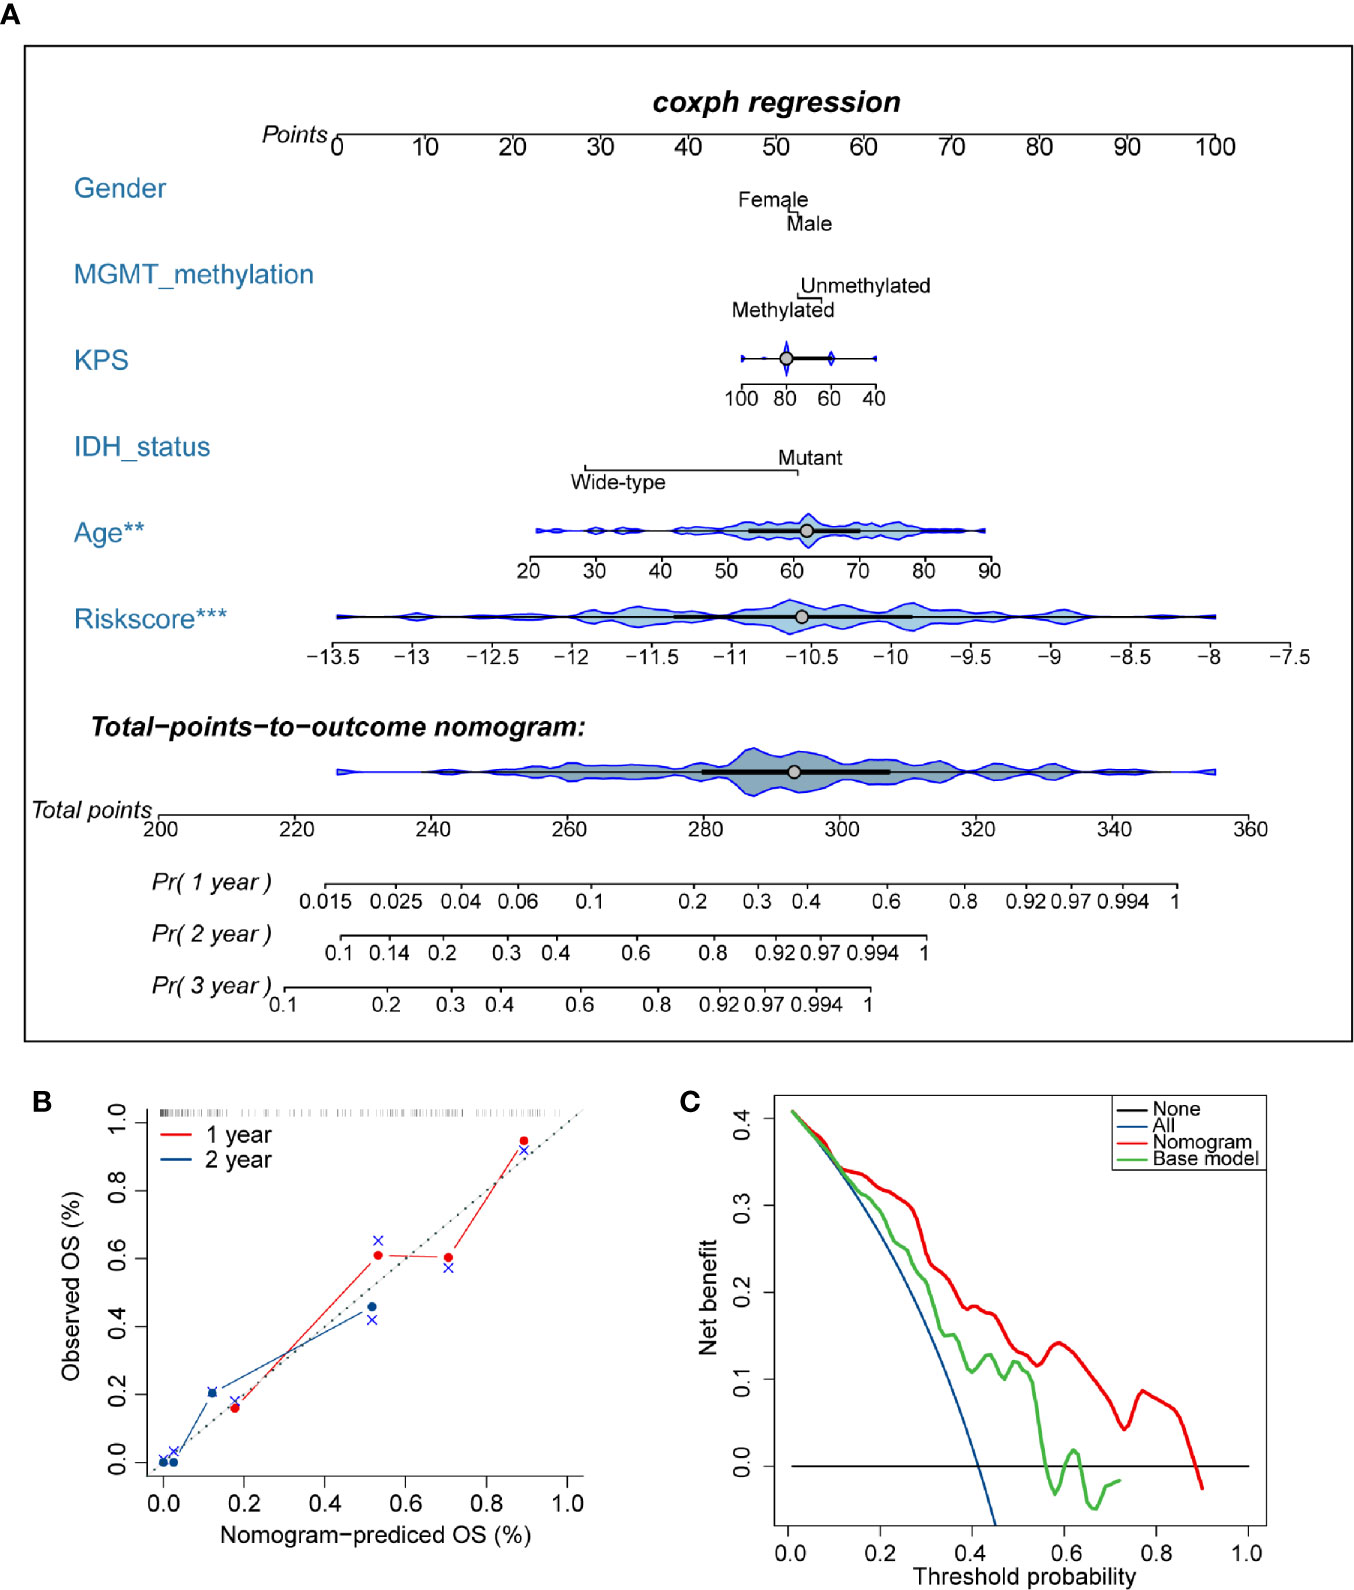
Figure 9 Developed nomogram to predict the risk of death in glioblastoma (GBM) patients. (A) Nomogram built with clinicopathological factors incorporated estimating 1-, 2-, and 3-year overall survival for GBM patients. The asterisk beside each variable in the nomogram represents the statistical significance. ** indicates P < 0.01; *** indicates P < 0.001. (B) The calibration curves describing the consistency between predicted and observed overall survival at 1- and 2-year. The estimated survival was plotted on the x-axis, and the actual outcome was plotted on the y-axis. The gray 45-degree dotted line represents an ideal calibration mode. (C) Decision curve analysis for the nomogram and base model. The red line measures the nomogram, and the green line represents the base model. The selected probability threshold is plotted on the abscissa.
Discussion
Alternative processing of mRNA, a universal phenomenon that happened in the process of transcriptional regulatory, can increase the diversity of protein to a large scale. The advent of next-generation sequencing and the development of bioinformatics make it possible to deeply elucidate the mechanisms of alternative splicing behind various biological processes, such as cancer. Combining with comprehensive multi-omics databases, such as TCGA, the novel role of alternative splicing in human cancers can be further explored. The previous studies had noticed that AS events of specific genes can drive or suppress tumorigenesis of glioma. For instance, GFAP-δ and GFAP-α are two types of GFAP alternative splice variants, and high GFAP-δ/α ratio in glioma cells contributes to a more invasive phenotype by activating the expression of DUSP4 (56). Li et al. demonstrated that β splicing of hTERT was tightly linked to higher tumor grades and poor prognosis of glioma patients (57). To our best knowledge, previous researches on AS events of diffuse glioma and GBM mainly focused on limited samples or cancer cell lines, and a large-scaled prognostic AS events in GBM remain largely unstudied.
Compared with microarray assays, RNA-seq is superior in sequencing depth and dynamic range, and more AS events can be identified using RNA-seq data. In recent years, signatures based on gene expression, DNA methylation, and even multi-omics profiles have been widely developed to clarify their clinical relevance in GBM (58–60). Here, transcriptome data of GBM samples in TCGA were obtained, and alternative splicing patterns were calculated using SpliceSeq, which is an effective tool to accurately identify potential AS events using RNA-seq data (61). We established an AS events-based signature as a potential prognostic model to categorize GBM patients into different risk groups. The remarkable discrepancy of overall survival in the two groups suggested the existence of significant tumor heterogeneity. Given that molecular heterogeneity may underlie differences in prognosis and responsivity to clinical therapy, we linked risk score to some GBM molecular features, such as TCGA Verhaak’s GBM classification, IDH mutation, and MGMT promoter methylation, and we confirmed that these samples are highly variable from patient to patient at a molecular level.
Due to the molecular heterogeneity, the use of the anatomical distribution, WHO grade, IDH mutation, and MGMT methylation status to classify patients and determinate therapeutic options have limited value. In this study, all survival-related AS events were filtered as input file of SNF-CC clustering, and two AS events-based clusters were identified. Overall survival, IDH mutation, MGMT methylation, Verhaak’s subtype, and EM/PM subtype were unevenly distributed among these newly identified subtypes. Interestingly, both Verhaak’s and EM/PM classification were based on patterns of gene expression, and the close associations between AS- and gene patterns-based subtype may indicate the resemblance in biological pathways. A series of functional annotation analyses showed that besides classical oncogenic hallmarks, Cluster2 samples also presented a stronger immunophenotype than samples in Cluster1. At first, the brain was regarded as an immunologically privileged organ due to the existence of the blood-brain barrier and the deficit of immune activities. The discovery that the infiltration of multiple immune cell types in CNS has made this view obsolete (62, 63). Thus, it could be speculated that immune signaling pathways exclusively enriched in the Cluster2 subtype might play an important role in driving tumorigenesis. After describing the landscapes of immune cell infiltration among samples of both subtypes, we preliminary noticed that much immune cell types were highly abundant in the Cluster2. However, contrary to what we expected, the prominent immune phenotype contributed to a worse instead of a favorable prognosis because of the large proportions of pro-tumorigenic immune cells as well as less anti-tumorigenic immune cells in these samples. Much more contents of cytotoxic cells, NK cells, neutrophils, and DCs in Cluster2 suggested that these patients may show better responsivities to immunotherapies. Also, as an effective index for ICB-response prediction, TIGS was much higher in Cluster2 compared with Cluster1, indicating more patients of Cluster2 might benefit from ICB treatment. Furthermore, we investigated the expression levels of several immune checkpoints aforementioned among two subtypes, and we found most of them were higher expressed in Cluster2, which indicated that patients of Cluster2 would benefit more from immune checkpoint inhibitors than those of Cluster1. Consistent with our hypotheses, patients in Cluster2 were demonstrated to be sensitive to anti-PD-1 therapy using SubMap analysis. Monoclonal antibodies targeting PD-1 had shown positive outcomes in several human cancer types, including melanoma, renal cell carcinoma, and non-small cell lung cancer (64). Newly published studies provided evidence that PD-1 blockade augmented antitumor immune response, chemokine transcripts expression, and T lymphocyte infiltration in GBM (65, 66). Although many clinical trials have demonstrated that the efficacy of ICB therapy for GBM remains unsatisfactory to date, Cloughesy et al. reported that the median overall survival for GBM patients received neoadjuvant (presurgical) PD-1 blockade was much longer than the adjuvant group (417 days vs. 228.5 days, HR = 0.39, P < 0.05) (66). This discrepancy may result from the dampened immune responses and the suppression of cellular immunity caused by surgery itself. GBM patients of cluster2 in our study were proved to be more sensitive to anti-PD-1 treatment, so we have the reason to speculate that these patients may benefit from the neoadjuvant administration before surgery. In clinical practice, precision identification of patients of this GBM subtype with biopsy and then followed with anti-PD-1 treatment before tumor resection may significantly prolong the survival time for patients. Currently, several clinical trials are still undergoing to utilize anti-PD-1 for the treatment of GBM (NCT02311920 and NCT03726515) (67, 68).
Multiple factors were reported to affect the effectiveness of ICB treatment, such as copy number alterations (CNAs), tumor mutation burden, mutational signature, and T-cell signature (34). The source article of the melanoma transcriptome mainly discussed the role of the CNAs in modulating the response to CTLA-4 and PD-1 blockade. However, to our best knowledge, none developed tool or algorithm is available for comparing the similarity of the mutational or CNA data. The gene expression profile contains rich information on the biological processes, including immune response. The high similarity of the gene expression patterns indicates the similarity of the genome to some extent and then may reflect the similar responses to the ICB therapy. Several studies have utilized the gene expression data of various types of cancer receiving ICB therapy to predict the possible responses to immunotherapy in the interested cancer types. For example, Ock et al. developed a transcriptional predictor of immunotherapy response for pan-cancer using publicly available data for the ICB therapy with gene expression profiles in several cancer types (69). Jiang et al. developed a computational method based on gene profiling data in several tumor types for anti-PD-1 and anti-CTLA4 therapies to accurately predict the outcome of melanoma patients treated with ICB (70). Zeng et al. included several genomic and transcriptomic datasets from patients with different cancer types treated with immunotherapy in their study to evaluate the efficiency of the tumor microenvironment score they developed in predicting the immunotherapeutic benefits (71). Among these studies, the gene expression data from patients with different tumors treated with ICB therapies, including renal cell carcinoma, melanoma, non-small cell lung carcinoma, head and neck squamous cell carcinoma, were applied not limited to the same cancer types. Thus, we have reasons to shift our gaze to the transcriptomic data for comparing the similarity of the gene profiles of the two clusters we identified with the data of other cancer types received ICB therapies.
We focused on the AS events-based risk model again and intended to explore whether this AS events signature is closely associated with the tumor microenvironment. Apart from neoplastic and immune cells, subpopulations of stromal cells also exist in the complex tumor niche, such as endothelial cells, fibroblasts, reactive astrocytes, and microglial cells, and feedbacks from these cell subsets can driver malignant progression (47, 72). The negative correlation between risk score and tumor purity indicated that AS events-based signature might influence the constituents of non-tumor cells in GBM samples. Meanwhile, the risk score was positively correlated to several gene sets of glioma-related immunosuppressive factors, suggesting that the worse prognosis of patients in the high-risk group may result from the enhanced immunosuppressive environment. A mass of genes known to be associated with the immunosuppressive function was generated to investigate how AS events-based signature functions as a regulator of immunosuppression. Large numbers of immunosuppressive genes were positively correlated with the increasing risk score: TIMP1 promoting recruitment of neutrophils to the liver to trigger the formation of the premetastatic microenvironment (73), BIRC3 producing cytokines and chemokines by regulating nucleotide-binding and oligomerization signaling pathways (74), ICAM1 boosting oral cancer progression by inducing CD163-positive macrophages adhesion (75), CCL2 highly expressed in pancreatic tumors promoting anti-tumor immunity by increasing the infiltration of immunosuppressive CCR2+ macrophages (76), LGALS1 inhibiting immunosuppressive cytokines by decreasing M2 macrophages and myeloid-derived suppressor cells in GBM (77), FOXP3+ Treg cells resulting in poor prognosis in various human cancers (78–80).
Splicing factors are known to function as oncogenes or tumor suppressors by regulating specific splice variants in glioma (81–83). Thus, we developed a correlation network between SFs and AS events to clarify the splicing regulatory mechanisms in GBM. Several factors have been reported essential to drive tumorigenesis among these crucial SFs, such as TIA1 (84), PQBP1 (85), HSPB1 (86), and EEF1A1 (87). Considering the expression levels of protein-coding genes were susceptible to the promoter loci methylation and copy number variation status, we investigated the influence of these kinds of factors on SFs expression. Therefore, we constructed a comprehensive network to help understand the potential regulatory pathways in cancer as well as motivate the development of novel target drugs for clinical treatment.
Although our research sheds new light on the novel molecular classification and immune microenvironment, we still have to acknowledge some limitations in the study. Firstly, our study was designed retrospectively, and findings should be further validated by prospective research. The prognostic value of AS events-based signature should be evaluated in clinical management. Secondly, the findings of the aberrant AS events and the construction of the developed prognostic model were merely based on the expression profiles of TCGA-GBM dataset, other independent GBM datasets should be included to further validate and expand these findings. We have searched large-scale gene expression profiles on GBM samples, but unfortunately only the TCGA project has the curated alternative splicing patterns of the corresponding tumor samples so that we can explore the potential value of the alternative splicing in GBM by integrating mRNA level information. Thirdly, limited by a scarcity of normal brain samples as references in the SpliceSeq database, specific AS events in GBM were not detected. We noticed that only five normal brain samples with both AS and gene expression profiles were included in the TCGA-GBM dataset. The huge difference in the size of the normal and GBM samples make it inapplicable for the identification of differentially expressed AS events. Comparing the differences of the AS patterns directly will inevitably introduce statistical bias, and the result may be unstable and incredible. Furthermore, our study was based on single-omics (AS events), so that the distinct molecular and clinicopathologic features among patients of high- and low-risk groups, as well as different subtypes, may result from intrinsic discrepancies of other factors, such as somatic mutation and DNA methylation. Also, we acknowledge that the RNA-seq data of GBM in the TCGA database was based on the bulk tumor sequencing, and the gene expression profiles cannot precisely represent the expression patterns of the cancer cells inside due to the inherent heterogeneity. The detailed characterization of the expression patterns of specific cancer cells needs the support of the single-cell sequencing method. Although several some computational approaches have been developed to estimate specific gene expression profiles for tumor cells inside the bulk samples, such as ISOpure and DeMixT, the prediction accuracy of these algorithms has not been validated in the TCGA-GBM cohort (88, 89). Applying these estimation methods to the unverified TCGA-GBM dataset directly may introduce unexpected bias. In addition, it is insufficient to predict the responses to immunotherapies for GBM merely based on AS events. Other omics data should be aggregated to develop a robust biomarker for immunotherapy response prediction.
In summary, our study identified significant prognosis related value of AS events in GBM and built an effective risk model to predict the survival outcomes for patients. Also, the aberrant alternative spliced variants were closely associated with the regulation of the immune microenvironment during the development of malignant tumors. The potential mechanisms that prognostic splicing factors affecting the overall survival of patients by regulating AS events were further exploited. Moreover, newly developed GBM classification based on AS events clustering analysis uncovered the inherent relevance of molecular and immune features. Therefore, this deep-mining analysis of AS patterns may provide some new perspectives to develop novel therapeutic strategies against GBM.
Data Availability Statement
Publicly available datasets were analyzed in this study. These data can be found here: TCGA (https://portal.gdc.cancer.gov/) and TCGA SpliceSeq database (https://bioinformatics.mdanderson.org/TCGASpliceSeq).
Author Contributions
LZ and PZ designed the study. LZ, JZ, and ZL performed research. YW provided data collection and visualization. LZ and SX drafted the manuscript. All authors contributed to the article and approved the submitted version.
Funding
This study was supported by the National Natural Science Foundation of China (Grant No. 81673210).
Conflict of Interest
The authors declare that the research was conducted in the absence of any commercial or financial relationships that could be construed as a potential conflict of interest.
Acknowledgments
All authors sincerely thank the outstanding contribution of the TCGA project.
Supplementary Material
The Supplementary Material for this article can be found online at: https://www.frontiersin.org/articles/10.3389/fonc.2020.555632/full#supplementary-material
References
1. Riemenschneider M, Reifenberger G. Molecular neuropathology of gliomas. Int J Mol Sci (2009) 10(1):184–212. doi: 10.3390/ijms10010184
2. Stupp R, Mason WP, Van Den Bent MJ, Weller M, Fisher B, Taphoorn MJ, et al. Radiotherapy plus concomitant and adjuvant temozolomide for glioblastoma. New Engl J Med (2005) 352(10):987–96. doi: 10.1056/NEJMoa043330
3. Eramo A, Ricci-Vitiani L, Zeuner A, Pallini R, Lotti F, Sette G, et al. Chemotherapy resistance of glioblastoma stem cells. Cell Death Differentiation (2006) 13(7):1238. doi: 10.1038/sj.cdd.4401872
4. Patel AP, Tirosh I, Trombetta JJ, Shalek AK, Gillespie SM, Wakimoto H, et al. Single-cell RNA-seq highlights intratumoral heterogeneity in primary glioblastoma. Science (2014) 344(6190):1396–401. doi: 10.1126/science.1254257
5. Pine AR, Cirigliano SM, Nicholson JG, Hu Y, Linkous A, Miyaguchi K, et al. Tumor microenvironment is critical for the maintenance of cellular states found in primary glioblastomas. Cancer Discov (2020) 10(7):964–79. doi: 10.1158/2159-8290.CD-20-0057
6. Wang Q, Hu B, Hu X, Kim H, Squatrito M, Scarpace L, et al. Tumor evolution of glioma-intrinsic gene expression subtypes associates with immunological changes in the microenvironment. Cancer Cell (2017) 32(1):42–56. e6. doi: 10.1016/j.ccell.2017.06.003
7. Ceccarelli M, Barthel FP, Malta TM, Sabedot TS, Salama SR, Murray BA, et al. Molecular profiling reveals biologically discrete subsets and pathways of progression in diffuse glioma. Cell (2016) 164(3):550–63. doi: 10.1016/j.cell.2015.12.028
8. Noushmehr H, Weisenberger DJ, Diefes K, Phillips HS, Pujara K, Berman BP, et al. Identification of a CpG island methylator phenotype that defines a distinct subgroup of glioma. Cancer Cell (2010) 17(5):510–22. doi: 10.1016/S1040-1741(10)79529-4
9. Verhaak RG, Hoadley KA, Purdom E, Wang V, Qi Y, Wilkerson MD, et al. Integrated genomic analysis identifies clinically relevant subtypes of glioblastoma characterized by abnormalities in PDGFRA, IDH1, EGFR, and NF1. Cancer Cell (2010) 17(1):98–110. doi: 10.1016/j.ccr.2009.12.020
10. Pan Q, Shai O, Lee LJ, Frey BJ, Blencowe BJ. Deep surveying of alternative splicing complexity in the human transcriptome by high-throughput sequencing. Nat Genet (2008) 40(12):1413. doi: 10.1038/ng.259
11. Liu Y, Gonzàlez-Porta M, Santos S, Brazma A, Marioni JC, Aebersold R, et al. Impact of alternative splicing on the human proteome. Cell Rep (2017) 20(5):1229–41. doi: 10.1016/j.celrep.2017.07.025
12. Baralle FE, Giudice J. Alternative splicing as a regulator of development and tissue identity. Nat Rev Mol Cell Biol (2017) 18(7):437. doi: 10.1038/nrm.2017.27
13. Nilsen TW, Graveley BR. Expansion of the eukaryotic proteome by alternative splicing. Nature (2010) 463(7280):457. doi: 10.1038/nature08909
14. Li Z-X, Zheng Z-Q, Wei Z-H, Zhang L-L, Li F, Lin L, et al. Comprehensive characterization of the alternative splicing landscape in head and neck squamous cell carcinoma reveals novel events associated with tumorigenesis and the immune microenvironment. Theranostics (2019) 9(25):7648. doi: 10.7150/thno.36585
15. Yang C, Wu Q, Huang K, Wang X, Yu T, Liao X, et al. Genome-wide profiling reveals the landscape of prognostic alternative splicing signatures in pancreatic ductal adenocarcinoma. Front Oncol (2019) 9:511. doi: 10.3389/fonc.2019.00511
16. Zong Z, Li H, Yi C, Ying H, Zhu Z, Wang H. Genome-wide profiling of prognostic alternative splicing signature in colorectal cancer. Front Oncol (2018) 8:537. doi: 10.3389/fonc.2018.00537
17. Zhu G-Q, Zhou Y-J, Qiu L-X, Wang B, Yang Y, Liao W-T, et al. Prognostic alternative mRNA splicing signature in hepatocellular carcinoma: a study based on large-scale sequencing data. Carcinogenesis (2019) 40(9):1077–85. doi: 10.1093/carcin/bgz073
18. Hu H, Mu Q, Bao Z, Chen Y, Liu Y, Chen J, et al. Mutational landscape of secondary glioblastoma guides MET-targeted trial in brain tumor. Cell (2018) 175(6):1665–78. e18. doi: 10.1016/j.cell.2018.09.038
19. Yao J, Caballero OL, Huang Y, Lin C, Rimoldi D, Behren A, et al. Altered expression and splicing of ESRP1 in malignant melanoma correlates with epithelial–mesenchymal status and tumor-associated immune cytolytic activity. Cancer Immunol Res (2016) 4(6):552–61. doi: 10.1158/2326-6066.CIR-15-0255
20. Kim EK, Yoon SO, Jung WY, Lee H, Kang Y, Jang Y-J, et al. Implications of NOVA1 suppression within the microenvironment of gastric cancer: association with immune cell dysregulation. Gastric Cancer (2017) 20(3):438–47. doi: 10.1007/s10120-016-0623-3
21. Razavi S-M, Lee KE, Jin BE, Aujla PS, Gholamin S, Li G. Immune evasion strategies of glioblastoma. Front Surg (2016) 3:11. doi: 10.3389/fsurg.2016.00011
22. Wagner GP, Kin K, Lynch VJ. Measurement of mRNA abundance using RNA-seq data: RPKM measure is inconsistent among samples. Theory Biosci (2012) 131(4):281–5. doi: 10.1007/s12064-012-0162-3
23. Liu J, Lichtenberg T, Hoadley KA, Poisson LM, Lazar AJ, Cherniack AD, et al. An integrated TCGA pan-cancer clinical data resource to drive high-quality survival outcome analytics. Cell (2018) 173(2):400–16.e11. doi: 10.1016/j.cell.2018.02.052
24. Schafer S, Miao K, Benson CC, Heinig M, Cook SA, Hubner N. Alternative splicing signatures in RNA-seq data: Percent spliced in (PSI). Curr Protoc Hum Genet (2015) 87(1):11.6. 1–.6. 4. doi: 10.1002/0471142905.hg1116s87
25. Chen Q-F, Li W, Wu P, Shen L, Huang Z-L. Alternative splicing events are prognostic in hepatocellular carcinoma. Aging (Albany NY) (2019) 11(13):4720. doi: 10.18632/aging.102085
26. Li B, Cui Y, Diehn M, Li R. Development and validation of an individualized immune prognostic signature in early-stage nonsquamous non–small cell lung cancer. JAMA Oncol (2017) 3(11):1529–37. doi: 10.1001/jamaoncol.2017.1609
27. Wang B, Mezlini AM, Demir F, Fiume M, Tu Z, Brudno M, et al. Similarity network fusion for aggregating data types on a genomic scale. Nat Methods (2014) 11(3):333. doi: 10.1038/nmeth.2810
28. Monti S, Tamayo P, Mesirov J, Golub T. Consensus clustering: a resampling-based method for class discovery and visualization of gene expression microarray data. Mach Learn (2003) 52(1):91–118. doi: 10.1023/A:1023949509487
29. Xu T, Le TD, Liu L, Su N, Wang R, Sun B, et al. CancerSubtypes: an R/Bioconductor package for molecular cancer subtype identification, validation and visualization. Bioinformatics (2017) 33(19):3131–3. doi: 10.1093/bioinformatics/btx378
30. Sergushichev A. An algorithm for fast preranked gene set enrichment analysis using cumulative statistic calculation. BioRxiv (2016) 060012. doi: 10.1101/060012
31. Zhou Y, Zhou B, Pache L, Chang M, Khodabakhshi AH, Tanaseichuk O, et al. Metascape provides a biologist-oriented resource for the analysis of systems-level datasets. Nat Commun (2019) 10(1):1–10. doi: 10.1038/s41467-019-09234-6
32. Barbie DA, Tamayo P, Boehm JS, Kim SY, Moody SE, Dunn IF, et al. Systematic RNA interference reveals that oncogenic KRAS-driven cancers require TBK1. Nature (2009) 462(7269):108–12. doi: 10.1038/nature08460
33. Bindea G, Mlecnik B, Tosolini M, Kirilovsky A, Waldner M, Obenauf AC, et al. Spatiotemporal dynamics of intratumoral immune cells reveal the immune landscape in human cancer. Immunity (2013) 39(4):782–95. doi: 10.1016/j.immuni.2013.10.003
34. Wang S, He Z, Wang X, Li H, Liu X-S. Antigen presentation and tumor immunogenicity in cancer immunotherapy response prediction. Elife (2019) 8:e49020. doi: 10.7554/eLife.49020
35. Rooney MS, Shukla SA, Wu CJ, Getz G, Hacohen N. Molecular and genetic properties of tumors associated with local immune cytolytic activity. Cell (2015) 160(1-2):48–61. doi: 10.1016/j.cell.2014.12.033
36. Hoshida Y, Brunet J-P, Tamayo P, Golub TR, Mesirov JP. Subclass mapping: identifying common subtypes in independent disease data sets. PloS One (2007) 2(11):e1195. doi: 10.1371/journal.pone.0001195
37. Roh W, Chen P-L, Reuben A, Spencer CN, Prieto PA, Miller JP, et al. Integrated molecular analysis of tumor biopsies on sequential CTLA-4 and PD-1 blockade reveals markers of response and resistance. Sci Trans Med (2017) 9(379):eaah3560. doi: 10.1126/scitranslmed.aah3560
38. Prat A, Navarro A, Paré L, Reguart N, Galván P, Pascual T, et al. Immune-related gene expression profiling after PD-1 blockade in non–small cell lung carcinoma, head and neck squamous cell carcinoma, and melanoma. Cancer Res (2017) 77(13):3540–50. doi: 10.1158/0008-5472.CAN-16-3556
39. Conway JR, Lex A, Gehlenborg N. UpSetR: an R package for the visualization of intersecting sets and their properties. Bioinformatics (2017) 33(18):2938–40. doi: 10.1093/bioinformatics/btx364
40. Rohart F, Gautier B, Singh A, Lê Cao K-A. mixOmics: An R package for ‘omics feature selection and multiple data integration. PloS Comput Biol (2017) 13(11):e1005752. doi: 10.1371/journal.pcbi.1005752
41. Eng KH, Schiller E, Morrell K. On representing the prognostic value of continuous gene expression biomarkers with the restricted mean survival curve. Oncotarget (2015) 6(34):36308. doi: 10.18632/oncotarget.6121
42. Yoshihara K, Shahmoradgoli M, Martínez E, Vegesna R, Kim H, Torres-Garcia W, et al. Inferring tumour purity and stromal and immune cell admixture from expression data. Nat Commun (2013) 4:2612. doi: 10.1038/ncomms3612
43. Locallo A, Prandi D, Fedrizzi T, Demichelis F. TPES: tumor purity estimation from SNVs. Bioinformatics (2019) 35(21):4433–5. doi: 10.1093/bioinformatics/btz406
44. Yan H, Parsons DW, Jin G, McLendon R, Rasheed BA, Yuan W, et al. IDH1 and IDH2 mutations in gliomas. New Engl J Med (2009) 360(8):765–73. doi: 10.1056/NEJMoa0808710
45. Sun Y, Zhang W, Chen D, Lv Y, Zheng J, Lilljebjorn H, et al. A glioma classification scheme based on coexpression modules of EGFR and PDGFRA. Proc Natl Acad Sci U.S.A. (2014) 111(9):3538–43. doi: 10.1073/pnas.1313814111
46. Golebiewska A, Bougnaud S, Stieber D, Brons NH, Vallar L, Hertel F, et al. Side population in human glioblastoma is non-tumorigenic and characterizes brain endothelial cells. Brain (2013) 136(Pt 5):1462–75. doi: 10.1093/brain/awt025
47. Quail DF, Joyce JA. The microenvironmental landscape of brain tumors. Cancer Cell (2017) 31(3):326–41. doi: 10.1016/j.ccell.2017.02.009
48. Le DT, Uram JN, Wang H, Bartlett BR, Kemberling H, Eyring AD, et al. PD-1 blockade in tumors with mismatch-repair deficiency. New Engl J Med (2015) 372(26):2509–20. doi: 10.1056/NEJMoa1500596
49. Rizvi NA, Hellmann MD, Snyder A, Kvistborg P, Makarov V, Havel JJ, et al. Mutational landscape determines sensitivity to PD-1 blockade in non–small cell lung cancer. Science (2015) 348(6230):124–8. doi: 10.1126/science.aaa1348
50. Nejo T, Matsushita H, Karasaki T, Nomura M, Saito K, Tanaka S, et al. Reduced Neoantigen Expression Revealed by Longitudinal Multiomics as a Possible Immune Evasion Mechanism in Glioma. Cancer Immunol Res (2019) 7(7):1148–61. doi: 10.1158/2326-6066.CIR-18-0599
51. Doucette T, Rao G, Rao A, Shen L, Aldape K, Wei J, et al. Immune heterogeneity of glioblastoma subtypes: extrapolation from the cancer genome atlas. Cancer Immunol Res (2013) 1(2):112–22. doi: 10.1158/2326-6066.CIR-13-0028
52. Cai J, Chen Q, Cui Y, Dong J, Chen M, Wu P, et al. Immune heterogeneity and clinicopathologic characterization of IGFBP2 in 2447 glioma samples. Oncoimmunology (2018) 7(5):e1426516. doi: 10.1080/2162402X.2018.1426516
53. Sveen A, Kilpinen S, Ruusulehto A, Lothe R, Skotheim RI. Aberrant RNA splicing in cancer; expression changes and driver mutations of splicing factor genes. Oncogene (2016) 35(19):2413–27. doi: 10.1038/onc.2015.318
54. Leva V, Giuliano S, Bardoni A, Camerini S, Crescenzi M, Lisa A, et al. Phosphorylation of SRSF1 is modulated by replicational stress. Nucleic Acids Res (2012) 40(3):1106–17. doi: 10.1093/nar/gkr837
55. Kaneb HM, Dion PA, Rouleau GA. The FUS about arginine methylation in ALS and FTLD. EMBO J (2012) 31(22):4249–51. doi: 10.1038/emboj.2012.291
56. van Bodegraven EJ, van Asperen JV, Sluijs JA, van Deursen CB, van Strien ME, Stassen O, et al. GFAP alternative splicing regulates glioma cell-ECM interaction in a DUSP4-dependent manner. FASEB J (2019) 33(11):12941–59. doi: 10.1096/fj.201900916R fj201900916R.
57. Li G, Shen J, Cao J, Zhou G, Lei T, Sun Y, et al. Alternative splicing of human telomerase reverse transcriptase in gliomas and its modulation mediated by CX-5461. J Exp Clin Cancer Res (2018) 37(1):78. doi: 10.1186/s13046-018-0749-8
58. Zhang X-Q, Sun S, Lam K-F, Kiang KM-Y, Pu JK-S, Ho AS-W, et al. A long non-coding RNA signature in glioblastoma multiforme predicts survival. Neurobiol Dis (2013) 58:123–31. doi: 10.1016/j.nbd.2013.05.011
59. Shukla S, Patric IRP, Thinagararjan S, Srinivasan S, Mondal B, Hegde AS, et al. A DNA methylation prognostic signature of glioblastoma: identification of NPTX2-PTEN-NF-κB nexus. Cancer Res (2013) 73(22):6563–73. doi: 10.1158/0008-5472.CAN-13-0298
60. Park J, Shim J-K, Yoon S-J, Kim SH, Chang JH, Kang S-G. Transcriptome profiling-based identification of prognostic subtypes and multi-omics signatures of glioblastoma. Sci Rep (2019) 9(1):1–11. doi: 10.1093/bioinformatics/bts452
61. Ryan MC, Cleland J, Kim R, Wong WC, Weinstein JN. SpliceSeq: a resource for analysis and visualization of RNA-Seq data on alternative splicing and its functional impacts. Bioinformatics (2012) 28(18):2385–7. doi: 10.1093/bioinformatics/bts452
62. Louveau A, Harris TH, Kipnis J. Revisiting the mechanisms of CNS immune privilege. Trends Immunol (2015) 36(10):569–77. doi: 10.1016/j.it.2015.08.006
63. Weiss N, Miller F, Cazaubon S, Couraud P-O. The blood-brain barrier in brain homeostasis and neurological diseases. Biochim Biophys Acta (BBA)-Biomembranes (2009) 1788(4):842–57. doi: 10.1016/j.bbamem.2008.10.022
64. Baumeister SH, Freeman GJ, Dranoff G, Sharpe AH. Coinhibitory pathways in immunotherapy for cancer. Annu Rev Immunol (2016) 34:539–73. doi: 10.1146/annurev-immunol-032414-112049
65. Schalper KA, Rodriguez-Ruiz ME, Diez-Valle R, López-Janeiro A, Porciuncula A, Idoate MA, et al. Neoadjuvant nivolumab modifies the tumor immune microenvironment in resectable glioblastoma. Nat Med (2019) 25(3):470–6. doi: 10.1038/s41591-018-0339-5
66. Cloughesy TF, Mochizuki AY, Orpilla JR, Hugo W, Lee AH, Davidson TB, et al. Neoadjuvant anti-PD-1 immunotherapy promotes a survival benefit with intratumoral and systemic immune responses in recurrent glioblastoma. Nat Med (2019) 25(3):477–86. doi: 10.1038/s41591-018-0337-7
67. Ranjan S, Quezado M, Garren N, Boris L, Siegel C, Lopes Abath Neto O, et al. Clinical decision making in the era of immunotherapy for high grade-glioma: report of four cases. BMC Cancer (2018) 18(1):239. doi: 10.1186/s12885-018-4131-1
68. Bagley S, Desai A, Binder Z, Nasrallah M, Hwang W-T, Maloney-Wilensky E, et al. RBTT-12. A Phase I Study Of Egfrviii-Directed Car T Cells Combined With Pd-1 Inhibition In Patients With Newly, Diagnosed, Mgmt-Unmethylated Glioblastoma: Trial In Progress. Neuro-Oncology (2019) 21(Supplement_6):vi221–vi. doi: 10.1093/neuonc/noz175.923
69. Ock C-Y, Hwang J-E, Keam B, Kim S-B, Shim J-J, Jang H-J, et al. Genomic landscape associated with potential response to anti-CTLA-4 treatment in cancers. Nat Commun (2017) 8(1):1–13. doi: 10.1038/s41467-017-01018-0
70. Jiang P, Gu S, Pan D, Fu J, Sahu A, Hu X, et al. Signatures of T cell dysfunction and exclusion predict cancer immunotherapy response. Nat Med (2018) 24(10):1550–8. doi: 10.1038/s41591-018-0136-1
71. Zeng D, Li M, Zhou R, Zhang J, Sun H, Shi M, et al. Tumor microenvironment characterization in gastric cancer identifies prognostic and immunotherapeutically relevant gene signatures. Cancer Immunol Res (2019) 7(5):737–50. doi: 10.1158/2326-6066.CIR-18-0436
72. Bonavia R, Inda MM, Cavenee WK, Furnari FB. Heterogeneity maintenance in glioblastoma: a social network. Cancer Res (2011) 71(12):4055–60. doi: 10.1158/0008-5472.Can-11-0153
73. Seubert B, Grünwald B, Kobuch J, Cui H, Schelter F, Schaten S, et al. Tissue inhibitor of metalloproteinases (TIMP)-1 creates a premetastatic niche in the liver through SDF-1/CXCR4-dependent neutrophil recruitment in mice. Hepatology (2015) 61(1):238–48. doi: 10.1002/hep.27378
74. Bertrand MJ, Doiron K, Labbé K, Korneluk RG, Barker PA, Saleh M. Cellular inhibitors of apoptosis cIAP1 and cIAP2 are required for innate immunity signaling by the pattern recognition receptors NOD1 and NOD2. Immunity (2009) 30(6):789–801. doi: 10.1016/j.immuni.2009.04.011
75. Usami Y, Ishida K, Sato S, Kishino M, Kiryu M, Ogawa Y, et al. Intercellular adhesion molecule-1 (ICAM-1) expression correlates with oral cancer progression and induces macrophage/cancer cell adhesion. Int J Cancer (2013) 133(3):568–78. doi: 10.1002/ijc.28066
76. Sanford DE, Belt BA, Panni RZ, Mayer A, Deshpande AD, Carpenter D, et al. Inflammatory monocyte mobilization decreases patient survival in pancreatic cancer: a role for targeting the CCL2/CCR2 axis. Clin Cancer Res (2013) 19(13):3404–15. doi: 10.1158/1078-0432.CCR-13-0525
77. Chen Q, Han B, Meng X, Duan C, Yang C, Wu Z, et al. Immunogenomic analysis reveals LGALS1 contributes to the immune heterogeneity and immunosuppression in glioma. Int J Cancer (2019) 145(2):517–30. doi: 10.1002/ijc.32102
78. Winerdal ME, Marits P, Winerdal M, Hasan M, Rosenblatt R, Tolf A, et al. FOXP3 and survival in urinary bladder cancer. BJU Int (2011) 108(10):1672–8. doi: 10.1111/j.1464-410X.2010.10020.x
79. Deng L, Zhang H, Luan Y, Zhang J, Xing Q, Dong S, et al. Accumulation of foxp3+ T regulatory cells in draining lymph nodes correlates with disease progression and immune suppression in colorectal cancer patients. Clin Cancer Res (2010) 16(16):4105–12. doi: 10.1158/1078-0432.CCR-10-1073
80. Zeng C, Yao Y, Jie W, Zhang M, Hu X, Zhao Y, et al. Up-regulation of Foxp3 participates in progression of cervical cancer. Cancer Immunol Immunotherapy (2013) 62(3):481–7. doi: 10.1007/s00262-012-1348-8
81. LeFave CV, Squatrito M, Vorlova S, Rocco GL, Brennan CW, Holland EC, et al. Splicing factor hnRNPH drives an oncogenic splicing switch in gliomas. EMBO J (2011) 30(19):4084–97. doi: 10.1038/emboj.2011.259
82. Song X, Wan X, Huang T, Zeng C, Sastry N, Wu B, et al. SRSF3-Regulated RNA Alternative Splicing Promotes Glioblastoma Tumorigenicity by Affecting Multiple Cellular Processes. Cancer Res (2019) 79(20):5288–301. doi: 10.1158/0008-5472.Can-19-1504
83. Zhou X, Wang R, Li X, Yu L, Hua D, Sun C, et al. Splicing factor SRSF1 promotes gliomagenesis via oncogenic splice-switching of MYO1B. J Clin Invest (2019) 129(2):676–93. doi: 10.1172/jci120279
84. Hamdollah Zadeh MA, Amin EM, Hoareau-Aveilla C, Domingo E, Symonds KE, Ye X, et al. Alternative splicing of TIA-1 in human colon cancer regulates VEGF isoform expression, angiogenesis, tumour growth and bevacizumab resistance. Mol Oncol (2015) 9(1):167–78. doi: 10.1016/j.molonc.2014.07.017
85. Zhang Y, Zhao H, Xu W, Jiang D, Huang L, Li L. High Expression of PQBP1 and Low Expression of PCK2 are Associated with Metastasis and Recurrence of Osteosarcoma and Unfavorable Survival Outcomes of the Patients. J Cancer (2019) 10(9):2091. doi: 10.7150/jca.28480
86. Choi S-H, Nam J-K, Kim B-Y, Jang J, Jin Y-B, Lee H-J, et al. HSPB1 inhibits the endothelial-to-mesenchymal transition to suppress pulmonary fibrosis and lung tumorigenesis. Cancer Res (2016) 76(5):1019–30. doi: 10.1158/0008-5472.CAN-15-0952
87. Chen S-L, Lu S-X, Liu L-L, Wang C-H, Yang X, Zhang Z-y, et al. eEF1A1 overexpression enhances tumor progression and indicates poor prognosis in hepatocellular carcinoma. Trans Oncol (2018) 11(1):125–31. doi: 10.1016/j.tranon.2017.11.001
88. Anghel CV, Quon G, Haider S, Nguyen F, Deshwar AG, Morris QD, et al. ISOpureR: an R implementation of a computational purification algorithm of mixed tumour profiles. BMC Bioinf (2015) 16(1):156. doi: 10.1186/s12859-015-0597-x
Keywords: glioblastoma, alternative splicing, prognostic signature, molecular classification, immune microenvironment
Citation: Zhao L, Zhang J, Liu Z, Wang Y, Xuan S and Zhao P (2021) Comprehensive Characterization of Alternative mRNA Splicing Events in Glioblastoma: Implications for Prognosis, Molecular Subtypes, and Immune Microenvironment Remodeling. Front. Oncol. 10:555632. doi: 10.3389/fonc.2020.555632
Received: 25 April 2020; Accepted: 09 December 2020;
Published: 26 January 2021.
Edited by:
Maria Caffo, University of Messina, ItalyReviewed by:
Concetta Crisafulli, University of Messina, ItalyYunfeng Wang, Université Paris-Saclay, France
Copyright © 2021 Zhao, Zhang, Liu, Wang, Xuan and Zhao. This is an open-access article distributed under the terms of the Creative Commons Attribution License (CC BY). The use, distribution or reproduction in other forums is permitted, provided the original author(s) and the copyright owner(s) are credited and that the original publication in this journal is cited, in accordance with accepted academic practice. No use, distribution or reproduction is permitted which does not comply with these terms.
*Correspondence: Peng Zhao, zhaopeng@njmu.edu.cn
†These authors have contributed equally to this work