 Ning Kang1,2,3†Yeying Fang1†
 Huijun Zhu2†Zhiling Shi4Liuyin Chen4YuShuang Lu4Housheng Wang1Jiamei Lu1
 Wenqi Liu2*
 Kai Hu1*
- 1Department of Radiation Oncology, The First Affiliated Hospital of Guangxi Medical University, Nanning, China
- 2Department of Radiation Oncology, The Second Affiliated Hospital of Guangxi Medical University, Nanning, China
- 3Department of Oncology, Yue Bei People’s Hospital, Shaoguan, China
- 4Graduate School of Guangxi Medical University, Nanning, China
Background: The American Joint Committee on Cancer-Tumor (AJCC-T) staging system for esophageal carcinoma patients, which is based on the depth of tumor invasion, is not applicable in some cases. This study aims to assess the prognostic value of CT imaging-based tumor volume and its usefulness for T staging in patients with non-surgical esophageal squamous cell carcinoma (ESCC).
Methods: We retrospectively reviewed the records of 158 ESCC patients undergoing definitive (chemo) radiotherapy from two hospitals. Tumor volume based on the CT imaging was calculated using the formula: V = πabc / 6. Three cutoff points for tumor volume were obtained with the X-tile software. Overall survival (OS) was analyzed using the Kaplan–Meier method. The -2 log-likelihood ratio and Akaike Information Criterion (AIC) value were evaluated to compare the AJCC-T staging system with the proposed T staging method.
Results: The median tumor volume was 19.8 cm³ (range from 1.0 to 319.5 cm³). The three optimal cutoff points of tumor volume were 12.7, 22.8, and 51.9 cm³, and the patients were divided into four groups named as proposed T1–T4 stages. The 3-year OS rates in patients with proposed T1 to T4 stages were 67.9%, 30.6%, 21.3%, and 5.3%, respectively. The −2 log-likelihood ratios of the AJCC-T stage and proposed T stage were 1,068.060 and 1,047.418, respectively. The difference in the AIC value between the two T staging systems was 18.642.
Conclusion: CT imaging-based tumor volume was superior to the depth of tumor invasion for T staging in predicting the prognosis of non-surgical ESCC patient.
Introduction
According to the latest global cancer incidence and mortality statistics, it was estimated that there would be 572,034 new cases of esophageal carcinoma (EC) diagnosed in 2018 worldwide, resulting in an estimated 508,585 related deaths (1). It was also reported that there were about 477,900 new EC cases and 375,000 deaths caused by this cancer in China in 2015, and it had the third highest incidence rate and the fourth highest mortality rate (2). Thus, EC is regarded as a severe public health concern both in China and worldwide. In addition, owing to the lack of typical symptoms and low screening rates, 40–60% of the patients with EC were diagnosed with an advanced stage and were not suitable for radical surgery (3).
In the current AJCC-tumor-node-metastasis (TNM) staging system, the T stages of EC patients are defined as the depth of tumor invasion. However, some EC patients are unresectable so that the depth of tumor invasion is occasionally difficult to determine accurately. Endoscopic ultrasonography (EUS) is the best method to determine the extent of local early lesions, but this method fails sometimes because luminal stenosis is not rare in EC patients (4). Moreover, some studies have shown that the preoperative EUS stage was not consistent with the postoperative pathological stage (5, 6). On the other hand, unlike in Western countries, where esophageal adenocarcinoma (EAC) is predominant, approximately 90% of EC is squamous cell carcinoma in China (7, 8). Consequently, the current staging system which is mainly based on the survival data of EAC may not be applicable for esophageal squamous cell carcinoma (ESCC) (9). Given these factors, it is necessary to develop an accurate and feasible staging system for patients with non-surgical ESCC.
This study aims to develop a simple and applicable T staging method for patients with non-surgical ESCC that can represent their prognosis better than the AJCC-T staging system. To this end, the tumor volume was calculated by retrospectively analyzing its dimensions on CT imaging before treatment, and the appropriate cutoff point was determined using statistical software in the present study. Then, the proposed T stages were redefined according to the tumor volume and were compared with the AJCC-T stages to access the rationality of using CT imaging-based tumor volume as T stages.
Materials and Methods
Patients
A total of 158 patients with non-surgical ESCC treated with definitive (chemo) radiotherapy in the radiation oncology department of the First and the Second Affiliated Hospital of Guangxi Medical University between January 2010 and December 2015 were enrolled. All patients were recruited based on the following selection criteria: (i) diagnosed with pathologically confirmed ESCC; (ii) aged ≥18 years and ≤80 years; (iii) underwent definitive (chemo) radiotherapy initially and without any prior treatments; (iv) had complete information for staging; (v) had no other malignancy or distant metastasis (M0); (vi) had completed the treatment plan; (vii) had no severe cardiopulmonary insufficiency; and (viii) had an Eastern Cooperative Oncology Group performance status of 0–2. This study was approved by the Medical Ethics Committee of the hospitals. The requirement for written informed consent was waived owing to the retrospective nature of this study.
Clinical Staging
After the pathological determination of ESCC, staging modalities included barium esophagography, upper gastrointestinal endoscopy, EUS, and CT scans of the cervix, thorax, and abdomen using intravenous contrast. Bronchoscopy, 18F-fluorodeoxyglucose positron emission tomography-CT, and EUS-guided fine-needle aspiration were used for a proportion of the patients.
The criteria for lesions were the localized or circumferential thickening of the esophageal wall, the thickness of the esophageal wall exceeding 5 mm, the diameter of the non-gasless esophagus exceeding 10 mm, or irregular local lumen stenosis. The location and length of the lesions, as determined by esophageal barium meal examination, were also considered. The lesion length (a) of tumor invasion in the superoinferior direction and the longest (b) and the shortest (c) diameters at the maximum transverse plane of the tumor were comprehensively evaluated, and then the tumor volume was calculated using the formula: V = πabc / 6 (10, 11). Lesion measurements were performed independently by two radiation oncologists (deputy chief physician or above) on CT imaging. A third reviewer was consulted when there was a volume variation of more than 10%. In order to restage the patients accurately according to the tumor volume, the clinical information of the patients was collated into a database.
The TNM classification was first performed according to the 6th edition AJCC staging system for ESCC. The X-tile software (version 3.6.1, Yale University School of Medicine, New Haven, CT, USA) was applied to obtain three appropriate cutoff points for tumor volume, and then the patients were divided into four groups named as proposed T1–T4 stages. Subsequently, we used the proposed T stages instead of the T stages in the 6th edition AJCC-TNM clinical staging system to determine the modified clinical stages.
Treatment Protocols
External beam radiation was delivered using either three-dimensional conformal radiotherapy technique or intensity-modulated radiation therapy for all patients. The gross tumor volume (GTV) of the esophagus was defined according to the aforementioned imaging examinations. The involved lymph nodes (GTVnd) were defined as lymph nodes with a short diameter of ≥5 mm for paraesophageal, tracheoesophageal groove, and pericardial angle lymph nodes, while for other metastatic lymph nodes it was a short diameter ≥10 mm. The clinical target volume (CTV) was generated with a 2–4 cm margin in the superoinferior direction and 5–10 mm margins were left in the anteroposterior and lateral directions around the primary GTV.
For cervical and upper thoracic tumors, the CTV included supraclavicular and paraesophageal lymph nodes, and those in one, two, four, and seven lymph node stations. For middle thoracic tumors, the CTV included tracheoesophageal sulcus, paraesophageal lymph nodes, and those in one, two, four, seven, and eight lymph node stations. For lower thoracic tumors, the CTV included lymph nodes located at stations four, seven, and eight and paraesophageal, perigastric, and celiac axis regions.
The planning target volume (PTV) was generated by adding a 5 mm margin to the target. The radiation dose delivered to 95% PGTV was 60–64 Gy (2.0–2.2 Gy per fraction) and 50.4–54 Gy (1.8–2.0 Gy per fraction) to 95% PCTV in 28–32 fractions. The radiation was delivered five times a week.
All patients were recommended to receive concurrent and adjuvant platinum-based chemotherapy (plus paclitaxel or 5-fluorouracil) every three weeks. Sixty-two patients refused chemotherapy, whereas the remaining 96 patients received at least one cycle of chemotherapy.
Follow-Up
All patients were followed up every three months in the first two years and every six months until five years, then annually thereafter. Regular follow-up regimens included physical, laboratory, imaging, and endoscopic examinations for assessing recurrence or metastasis. Overall survival was defined as the time between the date of the beginning of treatment and the date of death or the last follow-up. The patients were mainly followed up via telephone, and the outpatient and inpatient records were reviewed. The follow-up period was up to August 1, 2018.
Statistical Analysis
The optimal cutoff point of tumor volume was obtained using the X-tile software. Overall survival rates in univariate analysis were calculated using the Kaplan–Meier method. Survival curves were compared using the log-rank test. Multivariate analyses were performed using Cox regression models, and p ≤0.05 was considered statistically significant. All statistical analyses were performed using SPSS software (version 23.0, SPSS Inc., Chicago, IL, USA).
Results
Patient Characteristics
Among the 158 patients recruited in this study, 140 (88.6%) were men, and 18 (11.4%) were women. The median age of the patients was 58 years (range from 39 to 80 years). The demographic and clinicopathological characteristics of the patients are summarized in Table 1.
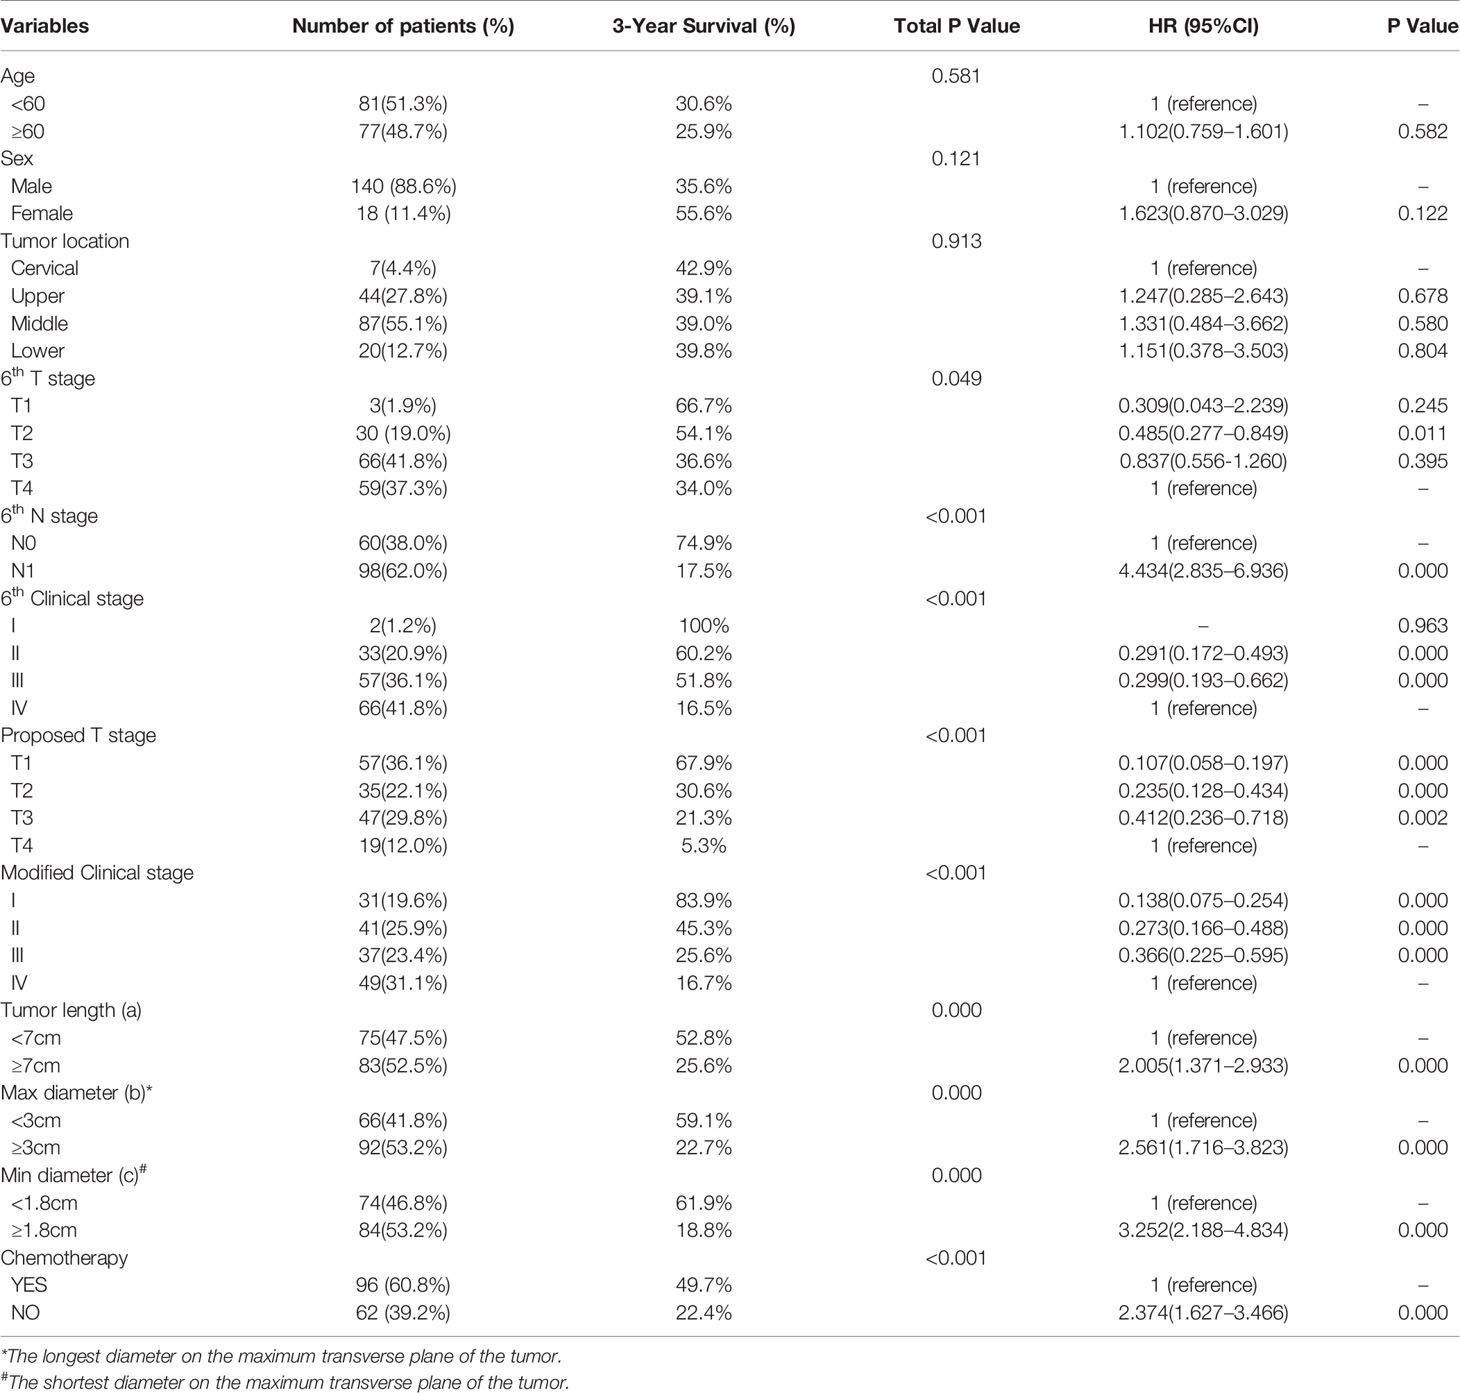
Table 1 Clinicopathological Characteristics of patients and Results of Univariate Analysis for 3-year OS.
The median tumor volume was 19.8 cm³ (range from 1.0 to 319.5 cm³) as calculated using the formula: V = πabc / 6. The three optimal cutoff points of tumor volume were 12.7, 22.8, and 51.9 cm³ using the X-tile software. The patients were divided into four groups defined as follows: 57 cases of T1 (tumor volume <12.7 cm³), 35 cases of T2 (12.7cm³ ≤tumor volume <22.8 cm³), 47 cases of T3 (22.8 cm³ ≤tumor volume <51.9 cm³), and 19 cases of T4 (tumor volume ≥51.9 cm³). One hundred and sixteen patients were changed from the AJCC-T stage to proposed T stage as summed up in Table 2. This led to 85 patients being migrated between the 6th AJCC TNM staging system and the modified staging method as summed up in Table 3.
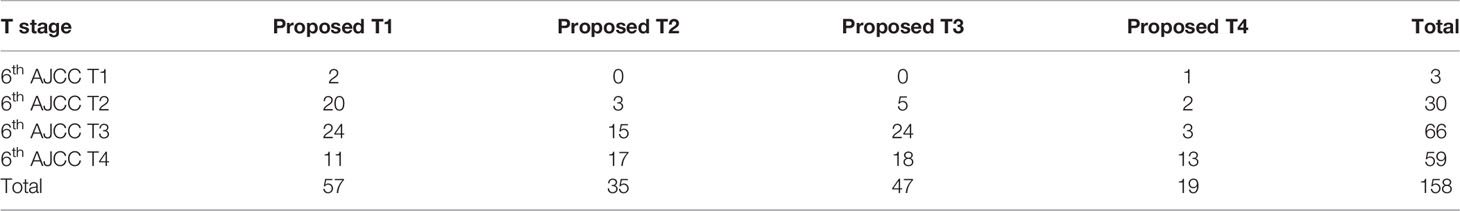
Table 2 Cross table of T stage for patients according to the 6th AJCC-T staging system and the proposed T staging method.
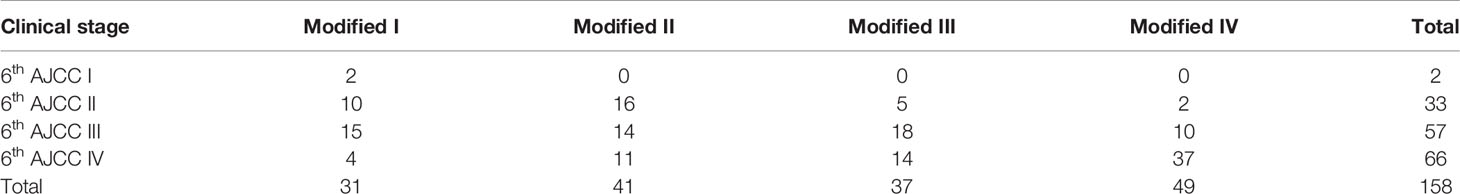
Table 3 Cross table of clinical stage for patients according to the 6th AJCC-TNM staging system and the modified staging method.
In addition, the tumor length (a) ranged from 1.6 to 18.5 cm (mean, 7.2 cm; median, 7.0 cm), and the longest (b) and the shortest (c) diameters on the maximum transverse plane of the tumor ranged from 1.2 to 8.0 cm (mean, 3.2 cm; median, 3.0 cm) and 0.7 to 5.4 cm (mean, 1.9 cm; median, 1.8 cm), respectively (Table 4).
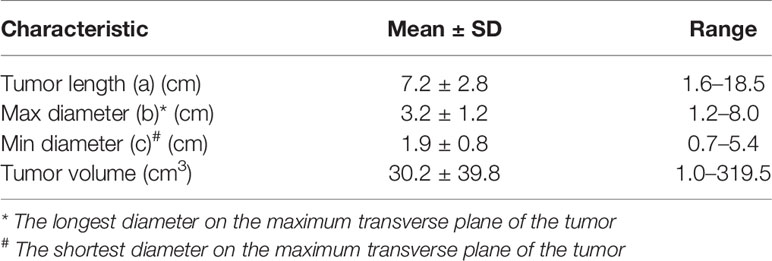
Table 4 Characteristics of the tumor.
Overall Survival Rates
During the period of analysis, 111 patients (70.3%) died. The median follow-up time was 29 months (range from 3.0 to 93.0 months), and the 3- and 5-year OS rates were 39.0 and 17.0%, respectively.
The 3-year survival rates in patients with T1, T2, T3, and T4 stages according to the 6th edition AJCC-T staging system were 66.7%, 54.1%, 36.6%, and 34.0%, respectively (Figure 1A; p = 0.049). However, there were no significant differences in survival between patients in T3 and T4 subgroups. Overlapping survival curves were also observed between patients with stage II and III disease (Figure 1B; p < 0.001).
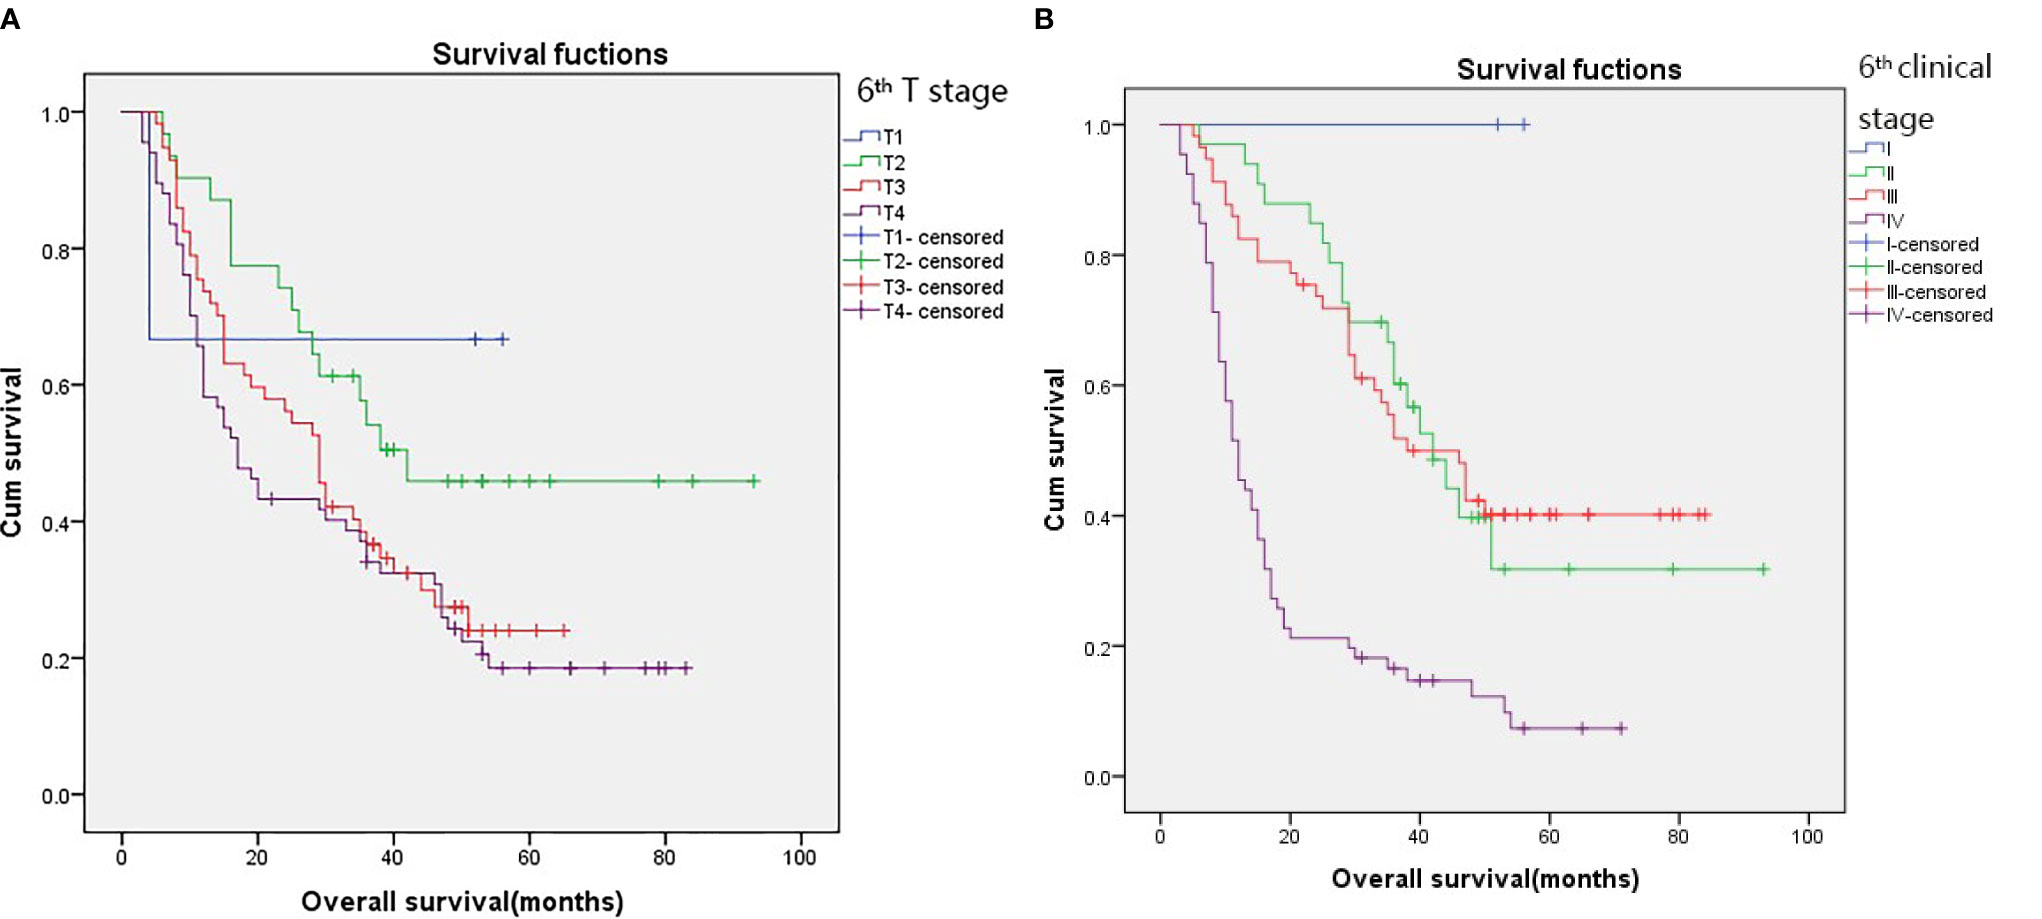
Figure 1 Kaplan–Meier survival curves for patients stratified on basis of the 6th T stages (A) and 6th clinical stage (B).
Nevertheless, Kaplan–Meier survival curve analysis based on the proposed T stage and modified clinical stage indicated that they had good discriminatory ability in each subgroup, as they showed a relatively distinct distribution of survival (Figures 2A, B; p < 0.001 for both).
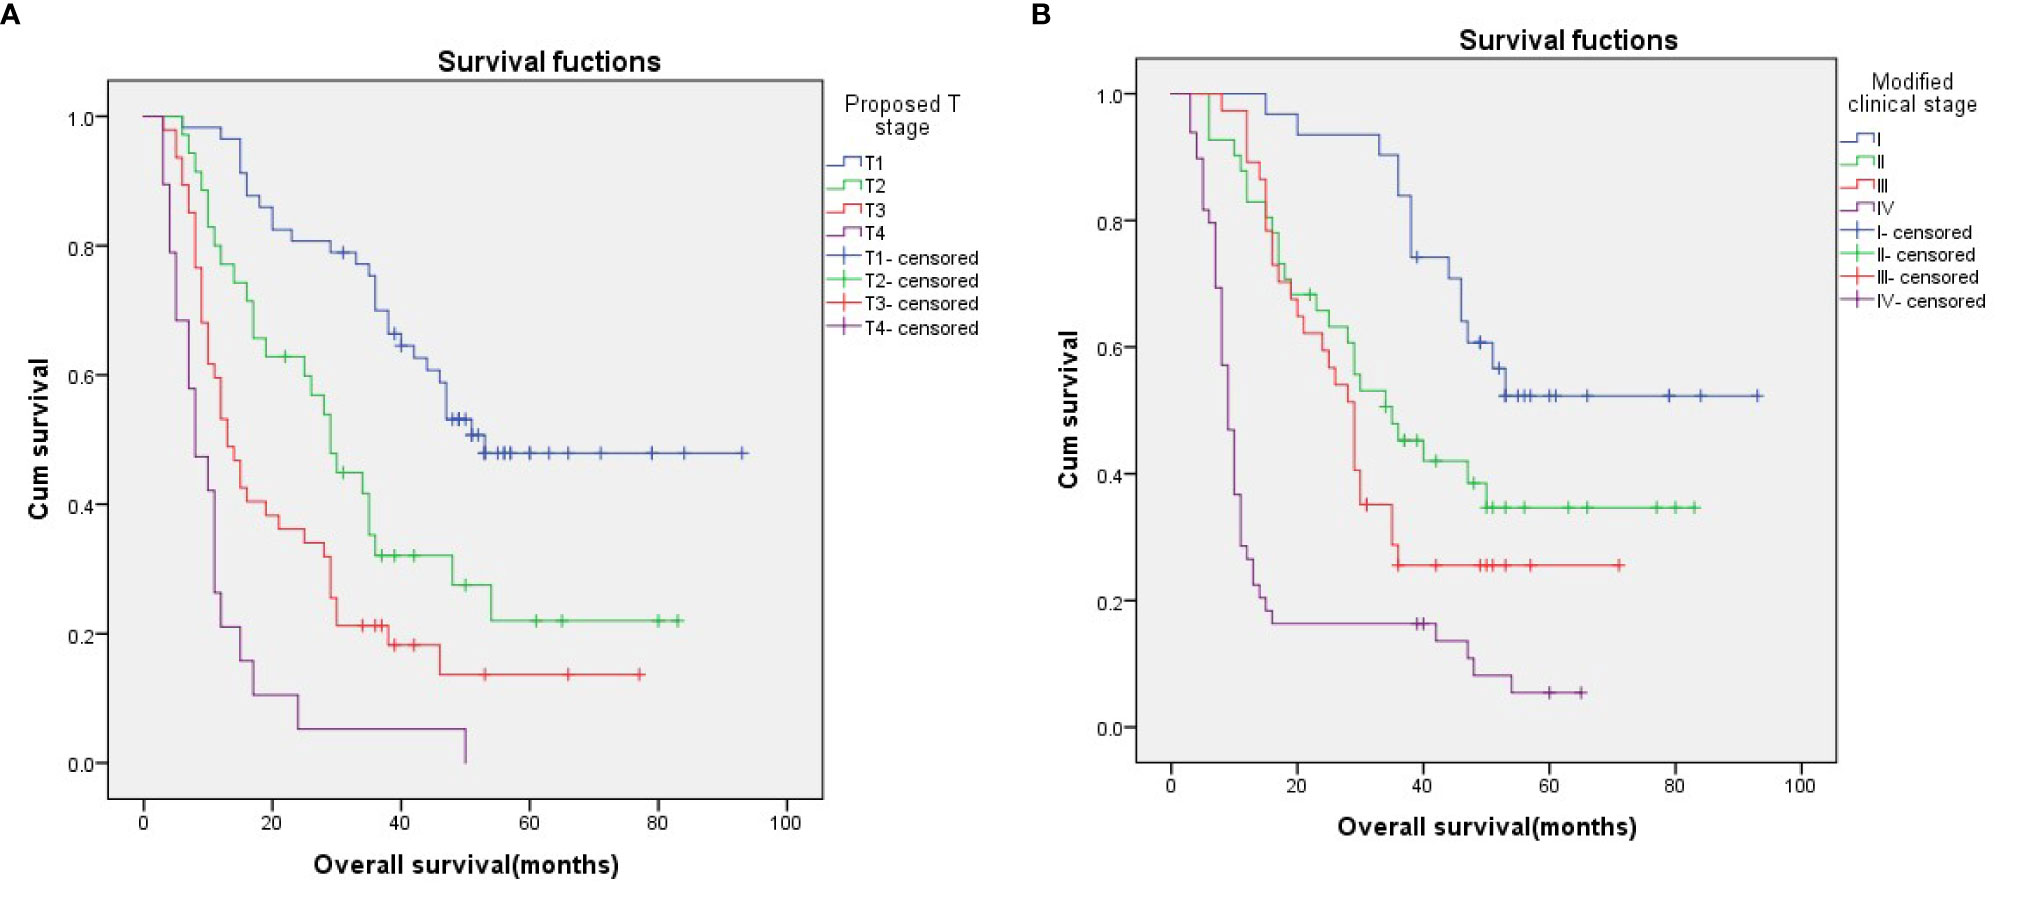
Figure 2 Kaplan–Meier survival curves for patients stratified on basis of the proposed T stages (A) and the modified clinical stage (B).
To evaluate the utility of the proposed T stages in predicting survival in different N stages, we performed a stratified analysis in the N0 and N1 subgroups based on the 6th edition AJCC-N staging system. The results showed that, in both the N0 and N1 subgroups, survival could be well discriminated between patients with the proposed T stages (Figures 3A, B; p < 0.001 for both).
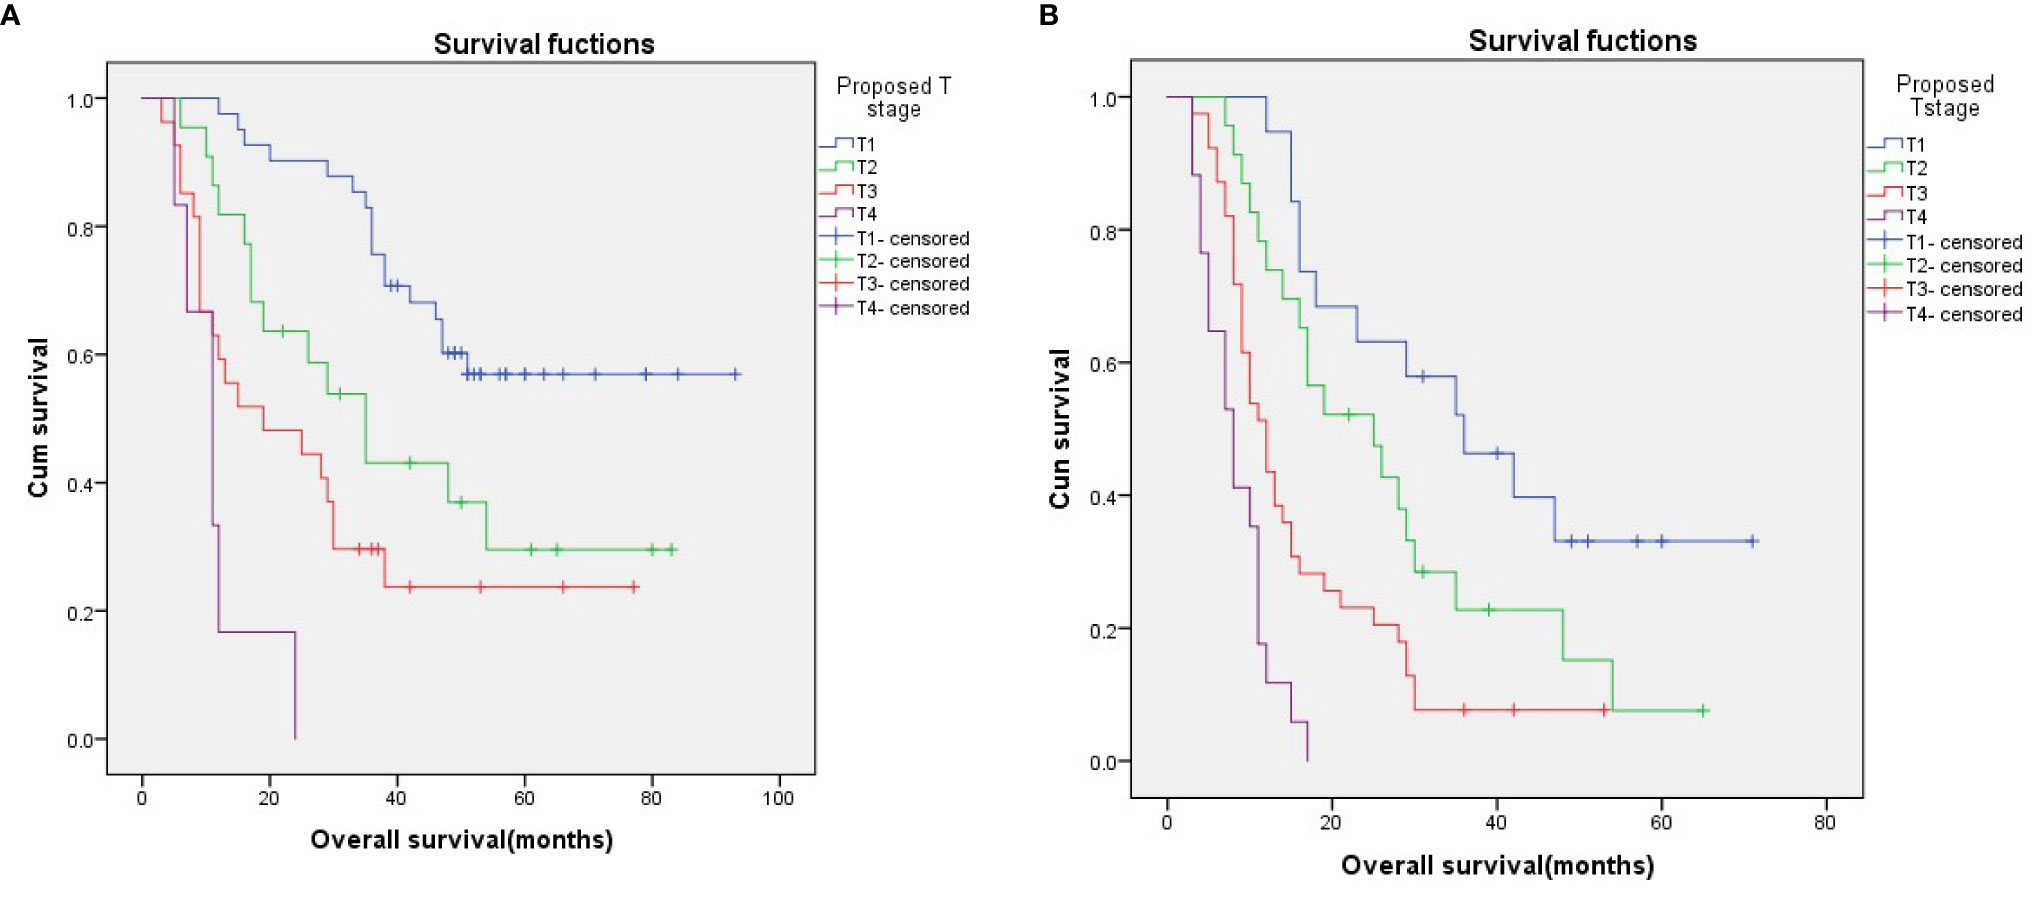
Figure 3 Survival curves for N0 (A) and N1 (B) patients stratified according to the proposed T stages.
Univariate and Multivariate Analyses
In the univariate analysis, 6th T stage, 6th N stage, 6th clinical stage, proposed T stage, modified clinical stage, chemotherapy, tumor length, and the longest and the shortest diameters on the maximum transverse plane of the tumor were prognostic predictors (Table 1). In the multivariate analysis, 6th T stage, 6th N stage, proposed T stage, modified clinical stage, and chemotherapy were independent prognostic factors (Table 5).
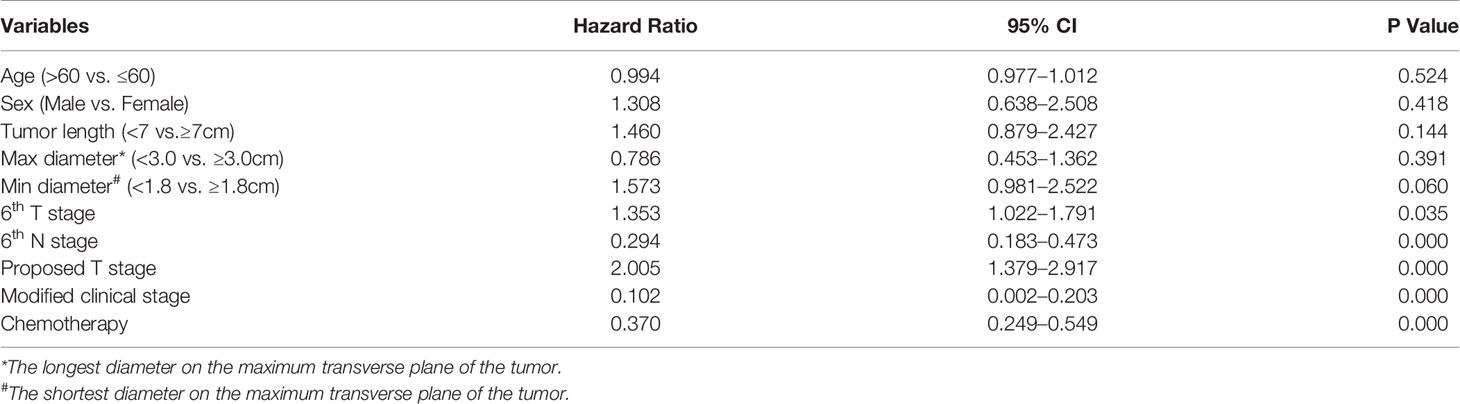
Table 5 Multivariate Cox Regression Analyses of the Prognostic Factors for OS in Patients with ESCC.
Comparison Between the 6th Edition AJCC-T and the Proposed T Staging System
According to the 6th edition AJCC-T stage, there were significant differences in the 3-year OS rates among the four groups (Figure 1A; p=0.049). According to the proposed T stage based on tumor volume, the 3-year OS rate was also significantly different among the groups (Figure 2A; p < 0.001). The –2 log-likelihood ratios of the 6th edition AJCC-T stage and proposed T stage were 1,068.060 and 1,047.418, respectively. The difference in the AIC value between the two T staging systems was 18.642.
Discussion
The AJCC-TNM system is the most widely used cancer staging system worldwide and is based on the following information: primary tumor, regional lymph node, and distant metastasis (12). Nevertheless, the current 8th edition AJCC-TNM staging system, which is surgical pathology-based, still has two problems for patients with non-surgical EC. First, it is difficult to accurately determine the number of metastatic lymph nodes (13); second, it is also difficult to evaluate the depth of tumor invasion accurately. Radiation oncologists prefer to use the 6th edition AJCC-TNM staging system for non-surgical EC to avoid the first problem (14). For the second problem, EUS can be used to assess the thickness of the esophageal wall, which is considered to be the best procedure for determining the locoregional extension of EC (15). However, the accuracy of EUS in T staging is not satisfactory. Luo et al. (16) analyzed the staging of 112 ESCC patients and showed that the preoperative clinical staging that was assessed with EUS was not consistent with the postoperative pathological stage. In another study conducted by Barbour et al. (17), 22 of 76 (29%) EC patients with cT0-1 (preoperative EUS staging) lesions were understaged and approximately 36% of patients classified with cT2 or larger tumors were overstaged when compared with the postoperative pathological stage. Similarly, Atay et al. (18) evaluated the staging accuracy in 499 EC patients undergoing esophagectomy and found that only 14% (70/499) of patients have been staged accurately, with 50% (248/499) of patients were understaged and 36% (181/499) overstaged. Hardacker et al. (19) also found that 44% of 107 EC patients staged as cT2N0M0 with EUS were understaged. Because the accuracy of EUS classification is debatable, the AJCC-T staging system based on the depth of tumor invasion is sometimes not applicable in patients with non-surgical EC.
The effect of tumor length on the prognosis of EC has always been controversial. In the 1983 version of the AJCC-TNM staging system, the T1 stage was defined as esophageal tumor length ≤5 cm, and the T2 stage was defined as esophageal tumor length >5 cm (20). However, the tumor length was replaced by the depth of tumor invasion, which was used for T staging of EC in the subsequent 1987 version of the AJCC-TNM staging system (21). Nevertheless, neither tumor length nor tumor invasion depth performed perfectly. In 2010, the Chinese Clinical Staging Expert Group published a Clinical Staging Criteria, which considered tumor length and diameter as the basis of T staging for non-surgical patients with EC (22). However, these criteria remain in draft form and lack high-level evidence to support it. The tumor volume calculation formula that we have adopted combines the tumor length with the longest and shortest diameters on the maximum transverse plane of the tumor well. In the present study, according to the CT imaging-based tumor volume and the proposed T staging system, the 3-year OS in patients with the T1 to T4 stages was 67.9, 30.6, 21.3, and 5.3%, respectively. After the multivariate analysis, the 3-year survival rates of the proposed T stages and the modified clinical stages were also significantly different among the groups, indicating that the tumor volume was a good indicator to predict the prognosis of non-surgical ESCC patients. In addition, our study also found that the tumor length and the longest and shortest diameters on the maximum transverse plane of the tumor were all related to the prognosis, which was consistent with the results of many other studies (23, 24).
Many studies demonstrated that the tumor volume was correlated with the prognosis of patient with EC. Chen et al. (14) retrospectively analyzed the clinical data of 187 patients with EC after radiotherapy and found that the survival time in patients with high tumor volume (>39.41 cm3) was significantly shorter than that in patients with low tumor volume (≤39.41 cm3). Créhange et al. (25) calculated the tumor volumes in 148 patients with EC by assimilating and representing the esophageal tumor as two opposing truncated cones, observing that patients with tumor volume ≥100 cm3 had significantly worse OS than those with tumor volume <100 cm3. Recently, Chen et al. (26) reported that the clinical T staging based on tumor volume could accurately predict the prognosis in patients with non-surgical EC, and suggested that tumor volume should be included as a staging factor in the clinical TNM staging. In this study, we first observed the overlapping survival curves of the T stage according to the 6th edition AJCC-TNM staging system. After restaging according to tumor volume, there was a significant difference among the four groups. This means that the proposed T staging method in this study surpassed the 6th edition AJCC-T staging in predicting the prognosis of non-surgical ESCC patients, and the difference in AIC value between the two T staging systems was 18.642.
At present, radiation oncologists could delineate and automatically calculate the tumor volume in non-surgical EC patients who underwent radiotherapy using the treatment planning system, which was considered to be a more accurate measurement of tumor volume (27, 28). However, the correct diagnosis and exact stage classification should be completed before the determination of the treatment plan, and not after preparation for radiotherapy. Furthermore, tertiary diagnosis and treatment measures have not been fully implemented in China; most radiotherapy equipment is now allocated to developed regions, making the tumor volume measurement unfulfillable for some patients in less developed areas. In contrast, CT imaging-based measurement of tumor volume advocated in this study has better universality and applicability.
However, there are some limitations in the present study. First, it was a two-center retrospective study with a relatively small sample size. Second, for patients with non-surgical ESCC, the tumor load was always high; thus, the number of patients with T1 stage included in this study was small, which may have limited the statistical power. Third, owing to the small sample size, the cutoff values obtained in our study were not necessarily accurate, which may have also affected the applicability of the study results. Thus, our results still need to be further verified in a larger number of clinical cases.
Conclusion
CT imaging-based tumor volume was superior to the depth of tumor invasion for T staging in predicting the prognosis of non-surgical ESCC patient treated with definitive (chemo) radiotherapy. Using tumor volume as the basis for T staging can provide a simple and accurate staging method for non-surgical ESCC patients and help clinicians make better treatment decisions. However, because of the small sample size of our study, the findings need to be confirmed by large-scale multicenter studies.
Data Availability Statement
The raw data supporting the conclusions of this article will be made available by the authors, without undue reservation.
Ethics Statement
The studies involving human participants were reviewed and approved by the Medical Ethics Committee of the First and the Second Affiliated Hospital of Guangxi Medical University. Written informed consent for participation was not required for this study in accordance with the national legislation and the institutional requirements.
Author Contributions
NK, YF, and HZ wrote the initial draft and accomplished the final version. NK, LC, and YL collected the data. YF, HZ, and JL interpreted and analyzed the data. ZS and HW edited and submitted the manuscript. WL and KH developed the idea and designed the study. All authors contributed to the article and approved the submitted version.
Funding
This work was supported by the Natural Science Foundation of Guangxi (2018JJA140869), and the Guangxi Medical and Health Appropriate Technology Development and Application Project (S2018097).
Conflict of Interest
The authors declare that the research was conducted in the absence of any commercial or financial relationships that could be construed as a potential conflict of interest.
References
1. Bray F, Ferlay J, Soerjomataram I, Siegel RL, Torre LA, Jemal A. Global Cancer Statistics 2018: GLOBOCAN Estimates of Incidence and Mortality Worldwide for 36 Cancers in 185 Countries. CA: Cancer J Clin (2018) 68:394–424. doi: 10.3322/caac.21492
2. Chen WQ, Zheng RS, Baade PD, Zhang SW, Zeng HM, Bray F, et al. Cancer statistics in China, 2015. CA: Cancer J Clin (2016) 66:115–32. doi: 10.3322/caac.21338
3. Tachibana M, Kinugasa S, Hirahara N, Yoshimura H. Lymph node classification of esophageal squamous cell carcinoma and adenocarcinoma. Eur J Cardiothorac Surg (2008) 34:427–31. doi: 10.1016/j.ejcts.2008.04.022.4
4. Luo LN, He LJ, Gao XY, Huang XX, Shan HB, Luo GY, et al. Endoscopic Ultrasound for Preoperative Esophageal Squamous Cell Carcinoma: a Meta-Analysis. PLoS One (2016) 11:e0158373. doi: 10.1371/journal.pone.0158373
5. Krill T, Baliss M, Roark R, Sydor M, Samuel R, Zaibaq J, et al. Accuracy of endoscopic ultrasound in esophageal cancer staging. J Thorac Dis (2019) 11:S1602–9. doi: 10.21037/jtd.2019.06.50
6. Thosani N, Singh H, Kapadia A, Ochi N, Lee JH, Ajani J, et al. Diagnostic accuracy of EUS in differentiating mucosal versus submucosal invasion of superficial esophageal cancers: a systematic review and meta-analysis. Gastrointest Endosc (2012) 75:242–53. doi: 10.1016/j.gie.2011.09.016
7. Rustgi AK, El-Serag HB. Esophageal carcinoma. N Engl J Med (2014) 371:2499–509. doi: 10.1056/NEJMra1314530
8. Zeng HM, Chen WQ, Zheng RS, Zhang SW, Ji JS, Zou XN, et al. Changing cancer survival in China during 2003-15: a pooled analysis of 17 population-based cancer registries. Lancet Glob Health (2018) 6:e555–67. doi: 10.1016/S2214-109X(18)30127-X
9. Rice TW, Apperson-Hansen C, DiPaola LM, Semple ME, Lerut TE, Orringer MB, et al. Worldwide Esophageal Cancer Collaboration: clinical staging data. Dis Esophagus (2016) 29:707–14. doi: 10.1111/dote.12493
10. Kim HJ, Kim WC. Pretreatment tumor diameter/volume and pelvic lymph node status assessed by magnetic resonance imaging for uterine cervical carcinoma treated with concurrent chemotherapy and radiotherapy. J Obstet Gynaecol Res (2008) 34:529–37. doi: 10.1111/j.1447-0756.2008.00733.x
11. Rodriguez E Jr, Skarecky D, Narula N, Ahlering TE. Prostate volume estimation using the ellipsoid formula consistently underestimates actual gland size. J Urol (2008) 179:501–3. doi: 10.1016/j.juro.2007.09.083
12. Rice TW, Ishwaran H, Ferguson MK, Blackstone EH, Goldstraw P. Cancer of the esophagus and esophagogastric junction: an eighth edition staging primer. J Thorac Oncol (2017) 12:36–42. doi: 10.1016/j.jtho.2016.10.016
13. Hu K, Kang N, Liu Y, Guo D, Jing W, Lu JM, et al. Proposed revision of N categories to the 8th edition of the AJCC-TNM staging system for non-surgical esophageal squamous cell cancer. Cancer Sci (2019) 110:717–25. doi: 10.1111/cas.13891
14. Chen Y, Zhang Z, Jiang GL, Zhao KL. Gross tumor volume is the prognostic factor for squamous cell esophageal cancer patients treated with definitive radiotherapy. J Thorac Dis (2016) 8:1155–61. doi: 10.21037/jtd.2016.04.08
15. Lightdale CJ, Kulkarni KG. Role of endoscopic ultrasonography in the staging and follow-up of esophageal cancer. J Clin Oncol (2005) 23:4483–9. doi: 10.1200/JCO.2005.20.644
16. Luo HC, Lin GS, Cheng HH, Fu ZC. A preliminary study on the consistency between the non-surgical staging and the surgical-pathological staging in oesophageal carcinoma. Interact Cardiovasc Thorac Surg (2012) 15:344–7. doi: 10.1093/icvts/ivs187
17. Barbour AP, Rizk NP, Gerdes H, Bains MS, Rusch VW, Brennan MF, et al. Endoscopic ultrasound predicts outcomes for patients with adenocarcinoma of the gastroesophageal junction. J Am Coll Surg (2007) 205:593–601. doi: 10.1016/j.jamcollsurg.2007.05.010
18. Esophageal Cancer Study Group Participating Centers. Predictors of staging accuracy, pathologic nodal involvement, and overall survival for cT2N0 carcinoma of the esophagus. J Thorac Cardiovasc Surg (2018) S0022-5223(18):32814–9. doi: 10.1016/j.jtcvs.2018.10.057
19. Hofstetter W. Treatment of clinical T2N0M0 esophageal cancer. Ann Surg Oncol (2014) 21:3713–4. doi: 10.1245/s10434-014-3935-8
20. Thompson WM. Esophageal cancer. Int J Radiat Oncol Biol Phys (1983) 9:1533–65. doi: 10.1016/0360-3016(83)90329-2.20
21. Hermanek P, Scheibe O, Spiessl B, Wagner G. TNM classification of malignant tumors: new edition 1987. Rofo (1987) 146:732–3. doi: 10.1055/s-2008-1048578
22. Wan J, Yu JM, Zhang HZ, Pan JJ, Lang JY, Xia TY, et al. Expert panel of clinical staging for esophageal carcinoma treated with non-surgical methods. Clinical staging standard for esophageal carcinoma treated with non-surgical methods (draft). Chin J Radiat Oncol (2010) 19:179–80.
23. Yang JB, Liu YH, Li B, Jiang P, Wang C. Prognostic significance of tumor length in patients with esophageal cancer undergoing radical resection: A PRISMA-compliant meta-analysis. Med (Baltimore) (2019) 98:e15029. doi: 10.1097/MD.0000000000015029
24. Xu HY, Wu SX, Luo HS, Chen CY, Lin LX, Huang HC, et al. Prognostic value of tumor length and diameter for esophageal squamous cell cancer patients treated with definitive (chemo)radiotherapy: Potential indicators for non-surgical T staging. Cancer Med (2019) 8:6326–34. doi: 10.1002/cam4.2532
25. Créhange G, Bosset M, Lorchel F, Buffet-Miny J, Dumas JL, Mercier M, et al. Tumor volume as outcome determinant in patients treated with chemoradiation for locally advanced esophageal cancer. Am J Clin Oncol (2006) 29:583–7. doi: 10.1097/01.coc.0000242346.25229.48
26. Chen J, Lin Y, Cai W, Su T, Wang B, Li J, et al. A new clinical staging system for esophageal cancer to predict survival after definitive chemoradiation or radiotherapy. Dis Esophagus (2018) 31. doi: 10.1093/dote/doy043
27. Toya R, Matsuyama T, Saito T, Imuta M, Shiraishi S, Fukugawa Y, et al. Impact of hybrid FDG-PET/CT on gross tumor volume definition of cervical esophageal cancer: reducing interobserver variation. J Radiat Res (2019) 60:348–52. doi: 10.1093/jrr/rrz004
Keywords: tumor volume, CT imaging, non-surgical, esophageal squamous cell carcinoma, prognosis
Citation: Kang N, Fang Y, Zhu H, Shi Z, Chen L, Lu Y, Wang H, Lu J, Liu W and Hu K (2021) Prognostic Value of CT Imaging-Based Tumor Volume in Patients With Non-Surgical Esophageal Squamous Cell Carcinoma. Front. Oncol. 10:602681. doi: 10.3389/fonc.2020.602681
Received: 04 September 2020; Accepted: 04 December 2020;
Published: 22 January 2021.
Edited by:
Cornelis F. M. Sier, Leiden University, NetherlandsReviewed by:
Deliang Guo, The Ohio State University, United StatesKuaile Zhao, Fudan University, China
Copyright © 2021 Kang, Fang, Zhu, Shi, Chen, Lu, Wang, Lu, Liu and Hu. This is an open-access article distributed under the terms of the Creative Commons Attribution License (CC BY). The use, distribution or reproduction in other forums is permitted, provided the original author(s) and the copyright owner(s) are credited and that the original publication in this journal is cited, in accordance with accepted academic practice. No use, distribution or reproduction is permitted which does not comply with these terms.
*Correspondence: Wenqi Liu, bGl1d2VucWlneEAxNjMuY29t; Kai Hu, aHVrYWlneG11QDE2My5jb20=
†These authors have contributed equally to this work and share first authorship