 Lijuan Xiang1,2†
 Sihan Wu
 Hu Liu
- 1Department of Tumor Biotherapy (5th Ward of the Department of Oncology), Anhui Provincial Cancer Hospital, West District of The First Affiliated Hospital of USTC, Division of Life Sciences and Medicine, University of Science and Technology of China, Hefei, China
- 2Department of Oncology, The First Affiliated Hospital of Anhui Medical University, Hefei, China
- 3Department of Oncology, Affiliated Provincial Hospital of Anhui Medical University, Hefei, China
- 4Department of Oncology, Yijishan Hospital, Wannan Medical College, Wuhu, China
Introduction: Human exhaled volatile organic compounds (VOCs) are being extensively studied for the purposes of noninvasive cancer diagnoses. This article was primarily to assess the feasibility of utilizing exhaled VOCs analysis for gastrointestinal cancer (GIC) diagnosis.
Methods: PRISMA-based system searches were conducted for related studies of exhaled VOCs in GIC diagnosis based on predetermined criteria. Relevant articles on colorectal cancer and gastroesophageal cancer were summarized, and meta analysis was performed on articles providing sensitivity and specificity data.
Results: From 2,227 articles, 14 were found to meet inclusion criteria, six of which were on colorectal cancer (CRC) and eight on Gastroesophageal cancer(GEC). Five articles could provide specific data of sensitivity and specificity in GEC, which were used for meta-analysis. The pooled sensitivity, specificity, diagnostic odds ratio (DOR), and area under the curve (AUC) were calculated based on the combination of these data, and were 85.0% [95% confidence interval (CI): 79.0%–90.0%], 89.0% (95%CI: 86.0%–91.0%), 41.30 (21.56–79.10), and 0.93, respectively.
Conclusion: VOCs can distinguish gastrointestinal cancers from other gastrointestinal diseases, opening up a new avenue for the diagnosis and identification of gastrointestinal cancers, and the analysis of VOCs in exhaled breath has potential clinical application in screening. VOCs are promising tumor biomarkers for GIC diagnosis. Furthermore, limitations like the heterogeneity of diagnostic VOCs between studies should be minded.
Introduction
Gastrointestinal cancer is of the leading causes of cancer deaths, approximately accounting for 22.2% of worldwide cancer related deaths (1). Till now, histological biopsy under endoscopy is still the predominant diagnostic method for gastrointestinal cancer. Since the early symptoms of gastrointestinal cancer are not specific, endoscopy yields unsatisfactory diagnostic rates, which also have shortages of being costly, painful and unsuitable for gastrointestinal cancer screening. Convenient, non-invasive and low-cost diagnostic methods are urgently needed for early cancer diagnoses and screening. Fecal occult blood testing, serum biomarkers and gastrointestinal barium angiography are commonly used in gastrointestinal cancer diagnosis, and fecal occult blood test is the most widely used and evaluable tests for current colorectal cancer screening. However, its clinical value is limited because of high false positive and negative rates. Serum biomarkers for gastrointestinal cancer, such as carcinoembryonic antigen (CEA) and Cancer antigen 19-9 (CA199) cannot play the expected diagnostic roles due to their poor accuracies. Gastrointestinal barium angiography can understand the overall location and size of the lesion, and the anatomic relationship with the entire organ, but there is a certain amount of radioactivity, and the procedures are troublesome. Therefore, noninvasive biomarkers are especially needed to be found for the purpose of diagnoses of gastrointestinal cancer.
Under normal physiological conditions, the concentrations of exhaled VOCs produced by the body’s metabolism were approximately 10-12 mol/L to 10-9 mol/L (2). In pathological conditions, metabolic abnormalities occurred and the production of VOCs increased significantly (3). Therefore, abnormal metabolic and pathological changes in vivo can be deduced by detecting increased VOCs. In the past decades, there have been extensive clinical studies to explore the relationship between the chemical compositions of the patients’ exhaled breath and clinical status of the patients. It is encouraging that exhaled VOCs have been used to diagnose some clinical conditions (4–6). As a new type of non-invasive examination method, it has shown broad application prospects in diagnosing pulmonary diseases (7–11), infections (12–16) and cancers (17–21), etc. It is generally believed that the production mechanism of VOCs is related to the excessive oxidative reactions taking places in cancer cells (22, 23), then spreading through the blood to the lung and respiratory tract.
Exhaled VOCs as a diagnostic tool for gastrointestinal cancer are of growing interest to scientists. However, most of the current researches are in the early stages lacking unified conclusions. Here, we systematically summarized the current knowledge on their potential clinical usages in early detection of gastrointestinal cancer and conducted a meta-analysis to evaluate their diagnosis power, hoping to build a stepping stone for future researches.
Methods
Search Strategies
This systematic review was completed in accordance with the Preferred Reporting Items for Systematic Reviews and Meta-Analysis (PRISMA) statement. PRISMA-based system searches were conducted (24) until 23 December 2018 in PubMed, EBSCO, ELSEVIER ScienceDirect, Wiley Online Library, and The Cochrane Library. At the same time, the references were followed for related reviews to obtain relevant information undiscovered. The terms “cancer OR tumor OR neoplasm OR malignant OR carcinoma”, “exhaled” and “VOCs” or “volatile organic compounds” were considered as keywords searching for related articles.
Inclusion and Exclusion Criteria
The inclusion criteria of related studies about exhaled VOCs in GIC diagnosis were as below: (i)pathologically confirmed gastrointestinal cancer; (ii) trials that analyzed endogenous VOCs within exhaled breath to diagnose or assess cancer; (iii) clinical studies.
The exclusion criteria were as below: (i) no specific experimental details were provided; (ii) commentary articles rather than research articles. (iii) VOCs were analyzed not in exhaled breath but in breath condensate or other biofluid, including urine, serum, feces, and gastric content. In addition, articles that presented sensitivity and specificity data were included as criteria for meta-analysis.
Data Extraction and Quality Assessment
Two reviewers independently screened and extracted data based on inclusion and exclusion criteria, discussed and resolved in case of disagreement. General Information such as authors, countries, participants, methodologies, techniques and experimental conclusions included in the study was extracted. Sensitivity and specificity that could be used for meta analysis was also extracted. The quality of included studies for meta-analysis was assessed using QUADAS-2 which was used for the quality assessment of diagnostic accuracy studies specially (25).
Methodological quality and risk of bias of included studies was determined by combining the Newcastle–Ottawa Scale (26) (NOS)。In this scale, each study was divided into three groups based on eight items: selection of study groups, comparability between groups, and determination of outcomes. The maximum score for each item was 1, but proportionality allowed for a score of 2. Total scores ranged from 0 to 9, with higher scores indicating better quality. The quality assessment was conducted independently by two authors (LJX and CYB) based on the Newcastle Ottawa Scale. The implementation of this assessment tool is discussed by both authors. The degree of agreement between the two authors was calculated by the other author (SHW). For the current study, we considered studies with a score of 7 or higher as high quality studies. Low-quality studies (Newcastle Ottawa score equal to or less than 4) were excluded.
Statistical Analysis
META-DISC software(version 1.4) was adopted to evaluate the diagnostic values of articles included in meta-analysis. The source of heterogeneity was first evaluated, including threshold effects and non-threshold effects. The threshold effect was checked by the SROC curve plan: if it was in the “shoulder arm” shape, it indicated that there was a threshold effect; otherwise the opposite. Heterogeneity between studies was evaluated by applying the chi-square and I2 test, if P<0.05, I2>50%, which indicated the existence of statistical heterogeneity. As for the combination of effect quantities, when there was a threshold effect, the best method for data combination was to fit SROC curve and calculate AUC, or to apply other statistics such as Q index. If the heterogeneity was due to non-threshold effect, the analysis could be attempted in homogeneous subgroups. The publication bias of the included studies was assessed using the Deeks’ funnel plot of stata12.0. An asymmetric funnel plot was obtained when publication bias was present, i.e., a slope P <0.05.
Results
Description of Included Studies
A total of 2227 articles were found using the search strategy described before among which 1,959 articles remained after removing duplicate articles. 1,932 studies were excluded from the title and abstract for using irrelevant papers, reviews and non-English papers. Thus, 27 studies were selected for full-text browsing. 13 studies were excluded for not meeting the inclusion and exclusion requirements. Thereby, 14 studies were included in the systematic description, including six in CRC and eight in GEC (shown in Figure 1). Five studies in GEC were able to conduct meta-analysis.
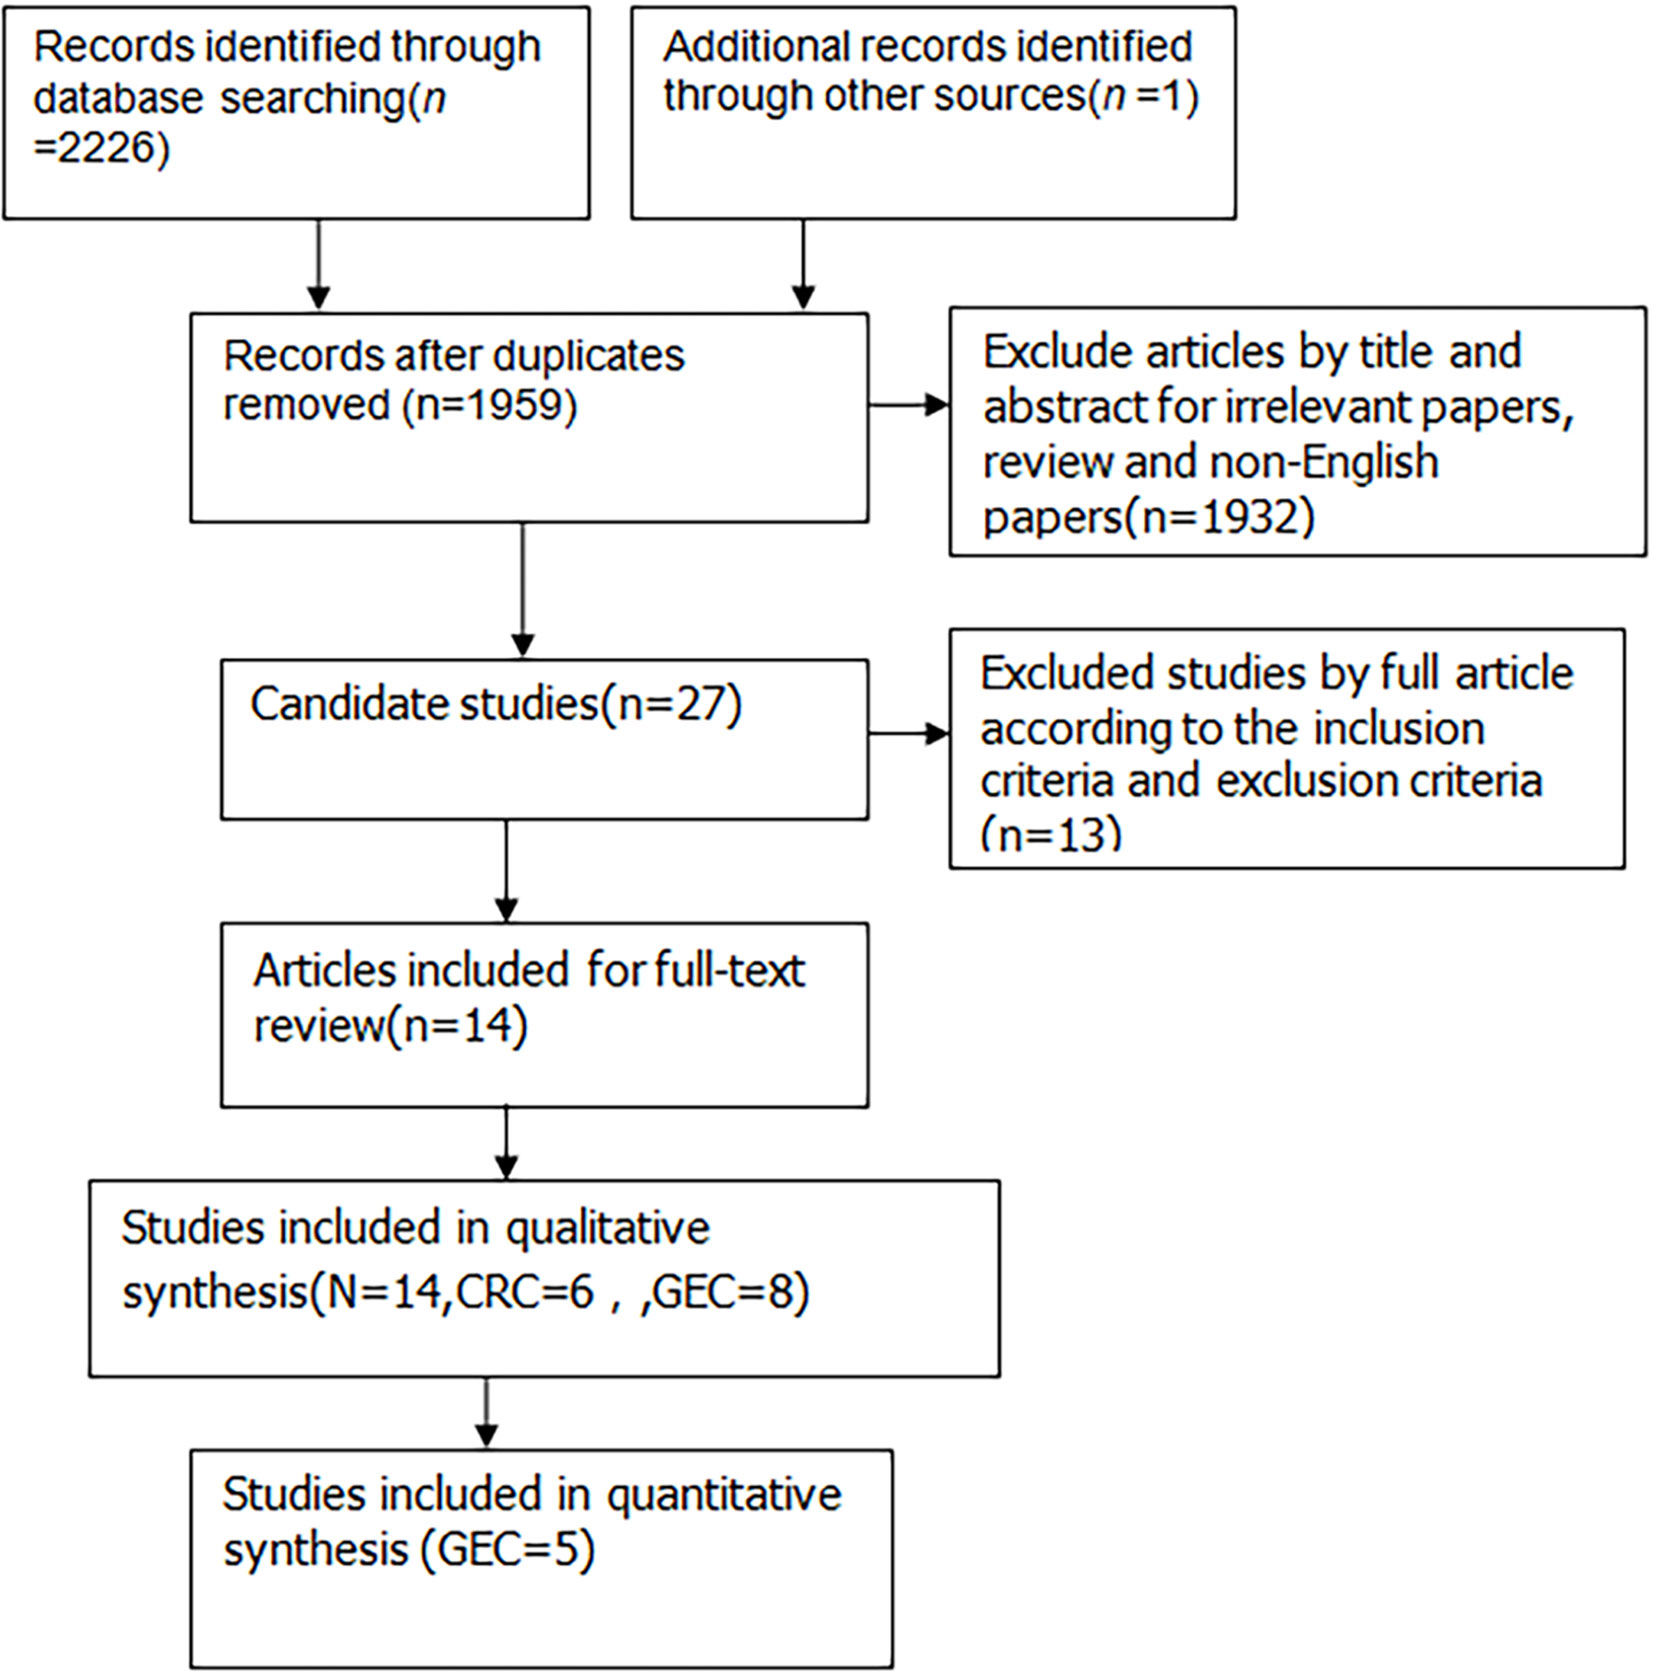
Figure 1 Flowchart of study selection for this meta analysis.
Data of the 14 studies on gastrointestinal cancer diagnoses by exhaled breath VOC were summarized comprehensively. Various techniques had been described to collect and analyze exhaled VOCs. Exhaled gas samples were usually collected temporarily in inert bags (including tedlar bags, mylar bags, nalophan bags and steel breath bags) or cans, volume varied between 20 ml and 4 L, and then analyzed directly; some of them used sorbent tubes to trap the exhaled gas before analysis because the gas could be stored in them for a long time without loss. The most commonly used detection technique was Gas Chromatography-Mass Spectrometer (GC-MS, n=8), usually combined with nano-sensor (n=5), and one combined with a probabilistic neural network (PNN). Four studies were analyzed using selected ion flow tube mass spectrometry (SIFT-MS), whilst one study used self-made proton transfer reaction mass spectrometry (PTR-MS). There were seven of the 14 reviewed studies used an leave-one-out cross-validation, but only two (27, 28) used an additional data set to verify the model. Basic information about the included studies of CRC and GEC was summarized in Tables 1 and 2, respectively. The potential biomarkers found in the exhalation of CRC and GEC patients are detailed in Tables 3 and 4. No consistent markers were found in the CRC study. It is worth noting that 10 VOCs appeared in two or more Gastroesophageal cancer studies, as shown in Figure 2, which partly reveals the repeatability of exhaled VOCs in the Gastroesophageal cancer field. Moreover, five studies capable of meta-analysis were evaluated with QUADAS-2 (Figure 3). The average Newcastle Ottawa score was 7.2 for all included studies (Table 5).
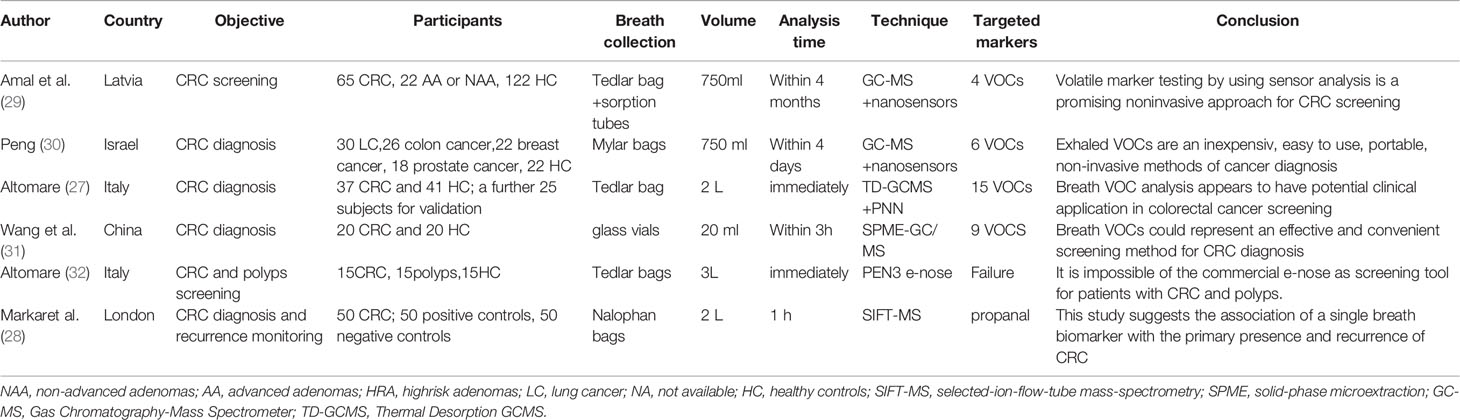
Table 1 Characteristics of included studies on exhaled VOCs for CRC diagnosis.
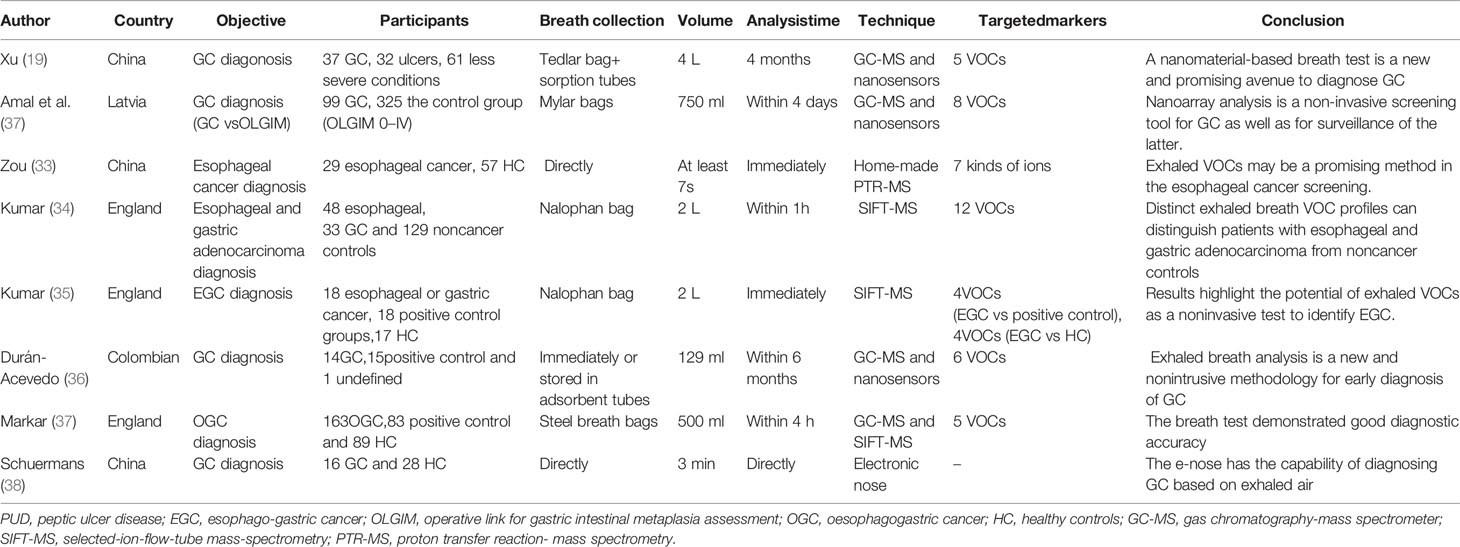
Table 2 Characteristics of included studies on exhaled VOCs for GEC diagnosis.
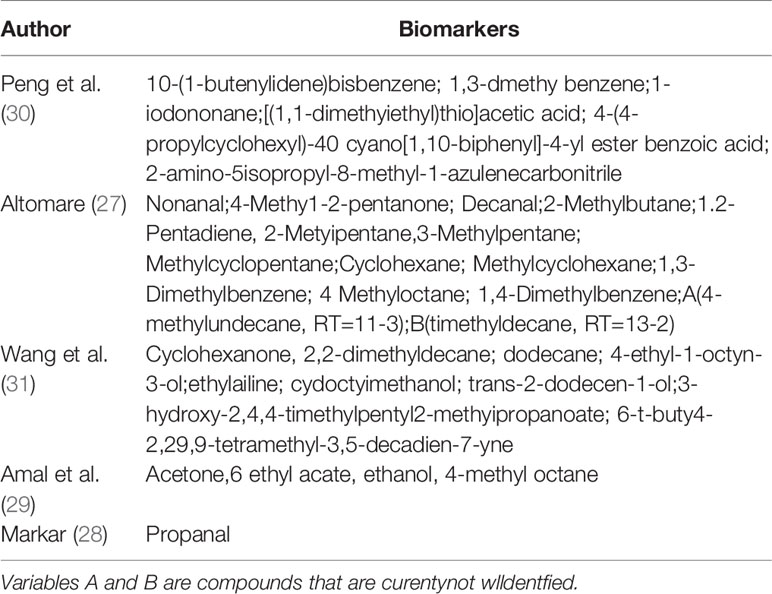
Table 3 Expiratory biomarkers between CRC patints and healthy patients.
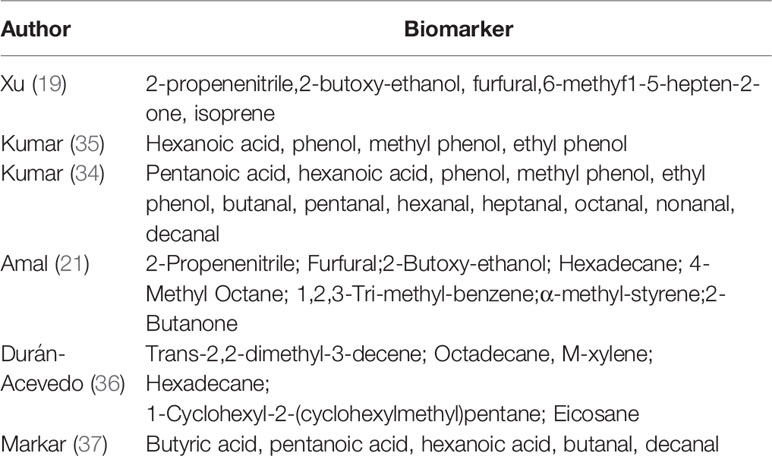
Table 4 Expiratory biomarkers between GEC patients andnon-cancer patients.
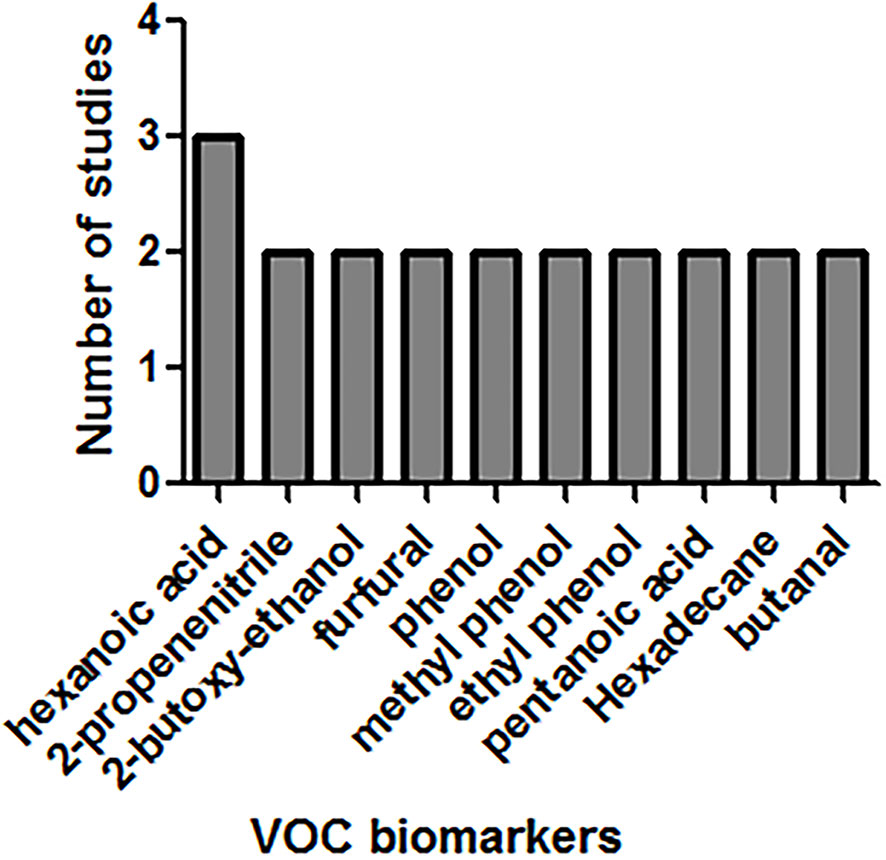
Figure 2 VOCs appeared in two or more GEC studies.
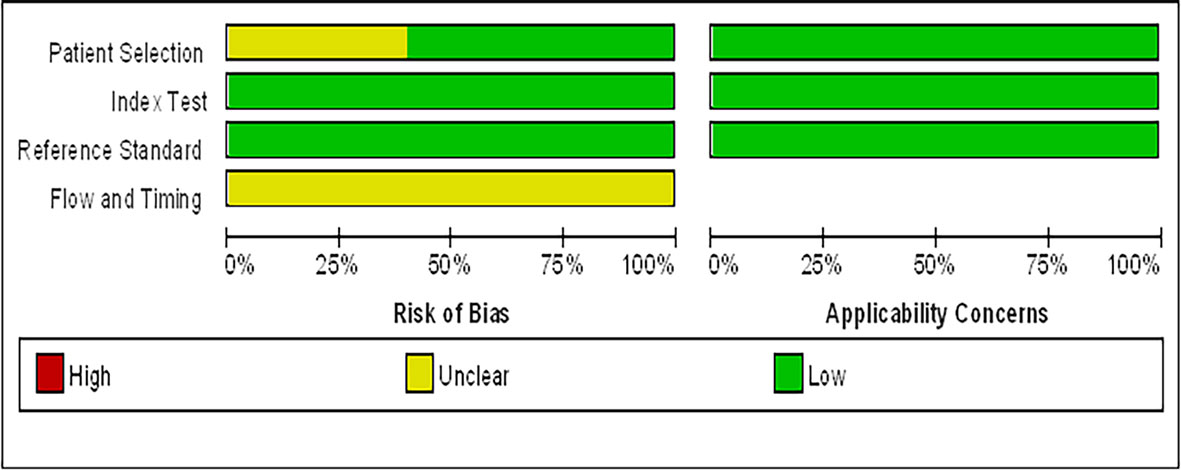
Figure 3 Graphical display for the Quality Assessment of Diagnostic Accuracy Studies-2 tool results: review authors’ judgements about each domain presented as percentages across included studies.
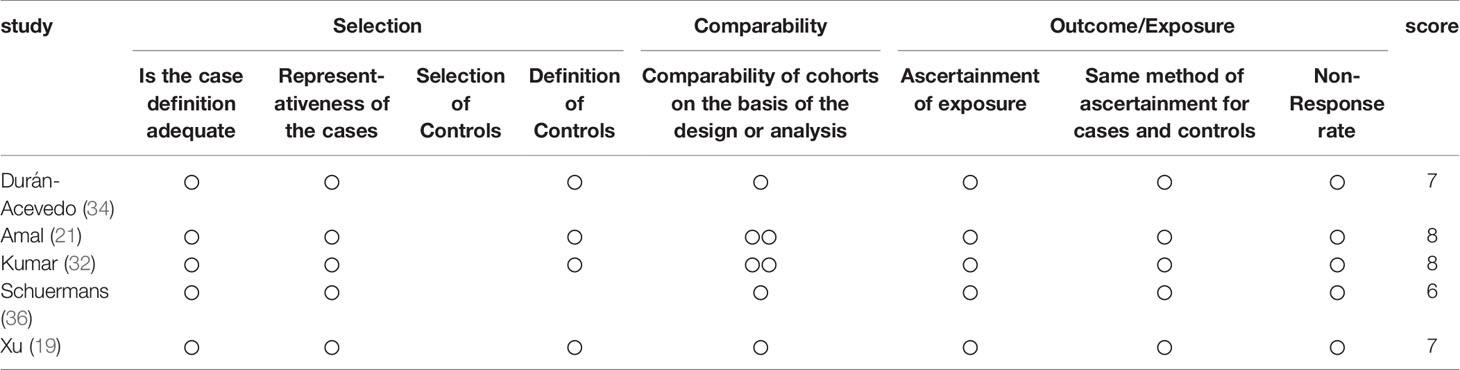
Table 5 Newcastle–Ottawa Scale scores.
Exhaled VOCs for CRC
The first reported attempt to identify CRC with exhaled VOCs was Peng et al. (30), the results showed that six VOCs could be used to distinguish colon cancer from healthy controls (HC). They also studied the relationship of exhaled VOCs between lung, colon, breast, prostate cancers and HC by GC-MS and nanosensor. Both techniques could distinguish “healthy” and “cancerous” by breathing, and furthermore, nano-arrays could also be used in differentiation among different cancer types. Amal et al. (29), also used GC-MS and nanosensor techniques to screen CRC. Four VOCs (Acetone, ethylacetate, ethanol, and 4-methyl octane), identified by GC-MS, showed significant differences between CRC group and control group in both studies. Additionally, this study also included adenoma patients as an independent group for comparative analysis, which were also found that could be effectively distinguished from either the cancer group or the control group.
In a clinical study, Altomare et al. (27) used thermal-desorber (TD) GC-MS and a probabilistic neural network (PNN) to analyze exhaled VOCs in 37 people with CRC and 41 controls. After the exclusion of unusual compounds and removal of ineffective variables, 15 potentially high discriminate power compounds were left behind. The pattern of applying PNN with 15 compounds showed significant performance with an accuracy of over 75%. Similar promising results were shown by Wang et al. (31) using solid-phase microextraction (SPME)-GC/MS, which was used to discriminate between 20 CRC patients and 20 HC with high diagnostic performance through nine significant VOCs. Markar et al. (28) analyzed exhaled breath samples from 50 CRC, 50 positive controls, and 50 negative controls patients using SIFT-MS. Seven compounds were shown to be statistically different between the cancer group and the control group, of which only propanal (NO+) had a meaningful increase in the cancer group related to the control group. When using a threshold of 28 ppbv, the sensitivity and specificity of CRC diagnosis were found to be as high as 96% and 76%, respectively. Beyond that their research group also explored the VOC changes associated with CRC recurrence after surgical resection. After surgery, propanal reduced to the desired levels consistent with the control patients, and with CRC recurrence, its levels significantly increased. Altomare et al. (39) picked 48 patients which belonged to the CRC group of 52 patients already monitored in their previous study, and 55 HC also confirmed the potential application of VOCs pattern in CRC patients for clinical follow-up. Eleven compounds were selected for discriminating disease-free patients after curative surgery from CRC patients before surgery with a sensitivity of 100% and a specificity of 97.92%. Disease-free follow-up patients could also be well recognized from HC by the same VOCs pattern. This study further suggested the potential association of exhaled VOCs with cancer screening and secondary prevention.
At the same time, a reliability assay of commercial electronic nose (PEN3 e-nose) as a screening tool for CRC and polyp patients found that it was impossible to discriminate the tested groups by using supervised or unsupervised statistical methods (32). They analyzed that the sensor’s unspecific response to the presence of defined exhaled VOC may be the reason for random classification of subjects to each group.
Exhaled VOCs for GEC
A few of studies found that an accurate Gastroesophageal cancer diagnosis was possible using profiles of VOCs (Table 2). Kumar et al. (35) applied SIFT-MS to quantify the exhaled VOCs in three groups of patients, GEC, benign disease of the esophagus or stomach, and healthy cohort, 17 VOCs had been investigated in this study. Four of 17 VOCs were found to be in statistically significant different between cancer and positive control groups. Comparison of VOC profiles between cancer and HC also revealed a similar differential pattern. ROC analysis was used for the combination of the above four VOCs to discriminate the Gastroesophageal cancer group from positive controls, with an integrated AUC of 0.91. Similar to the previous study, Kumar et al. (33) performed breath analysis on two groups of patients with esophageal (N=48) or gastric adenocarcinoma (N=33) group, noncancer control group including Barrett’s metaplasia (N=16), benign upper gastrointestinal diseases (N=62) and a normal upper gastrointestinal tract (N=51) by SIFT-MS analysis, twelve VOCs were revealed in these two groups with significant higher concentration differences. The results showed that differentiated exhaled VOCs could distinguish esophageal or gastric adenocarcinoma patients from noncancer patients satisfactorily.
Durán-Acevedo et al. (36) utilized GC-MS and nanosensors to analyze breath samples from 14 gastric cancer (GC) and 15 positive control. A significantly higher concentration of six VOCs was found in the cancer group compared to the control. And the nanosensors were able to discriminate gastric cancer patients from controls achieving a sensitivity of 100% and a specificity of 93%. Xu et al. (19) analyzed breath samples from 37 gastric cancer, 32 ulcers, and 61 less severe conditions, and found that five VOCs of gastric cancer and/or peptic ulcer patients were significantly increased compared with less severe gastric conditions. The nanomaterial-based sensors analysis results shown that it could well separate gastric cancer, gastric benign disease, gastric ulcer and less severe conditions. And the results were not affected by confounding factors. In addition, early stages GC (I and II) and late stages GC (III and IV) could also be distinguished (89% sensitivity; 94% specificity). A similar study was conducted by Amal et al. (37, 40), and 968 breath samples from 484 patients (including 99 with GC) were analyzed by GC-MS and nanosensors, respectively. It was found that cancer patients and high risk patients had distinctive respiratory markers. GC-MS revealed eight of 130 different VOCs differed in various groups. The combination of cross-reactive nanoarrays and pattern recognition methods found that the gastric cancer group and the control group (OLGIM 0-IV) could be distinguished with a sensitivity of 73% and a specificity of 98%. And the subgroups also could be distinguished effectively.
Markar et al. used the previous published data sets to create a 5-VOCs diagnostic model with a diagnostic accuracy of 90%. In this study, they utilized GC-MS and SIFT-MS to verify the feasibility of OGC patients and controls detection by measuring VOCs in the exhaled breath. The result showed certain volatile components of exhalation had potential for non-invasive OGC with a diagnostic accuracy of 0.85 (35). Schuermans (38) analyzed the exhaled VOC profiles from 16 GC and 28 HC with electronic nose (It is manufactured by eNose in Zutphen, The Netherlands. It contains three micro hot plate metal oxide sensors and a pump). The results showed the e-nose were able to discriminate patients from controls achieving a sensitivity of 81% and a specificity of 71%, with an accuracy of 75%.
Zou et al. (33) utilized home-made PTR-MS to compare breath samples from 29 esophageal cancer patients and 57 healthy people. It had been found that seven kinds of ions in the breath mass spectrum could better distinguish between the two groups of patients with a sensitivity of 86.2% and a specificity of 89.5%, respectively. Five of the seven ions reduced and the rest two increased when esophageal cancer patients compared with the healthy people. The AUC of ROC analysis was 0.943.
Data Analysis of Meta-Analysis
Five of the eight studies on the diagnostic Gastroesophageal cancer provided gastric cancer diagnostic study data, which met the quantitative analysis criteria. Sensitivity and specificity were extracted from the five studies (Table 6). The methodology of analysis technique used had no effect on the results because they only used different means to analyze the same class of substances to diagnose the same disease.
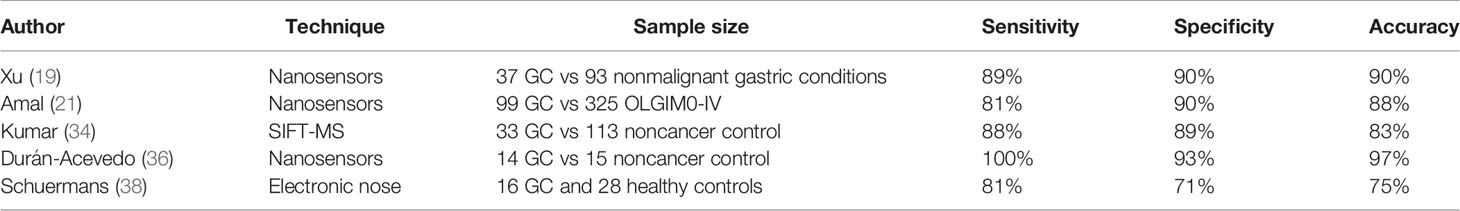
Table 6 Studies included in the meta-analysis.
A pooled analysis of the included five studies showed no heterogeneity in sensitivity (chi-squared=6.77, p=0.1485; I2 of 40.9%) or specificity(chi-squared=7.04, p=0.1337; I2 of 43.2%). Therefore, the fixed effect model was applied. The pooled results reported a mean (95%CI) sensitivity of 85% (79% to 90% CI) and specificity of 89% (86% to 91% CI). The mean (95% CI) pooled positive likelihood ratio (PLR) was 6.65 (4.41–10.02), which indicated that GC patients are approximately six times more likely to have a GC-related exhaled VOC profiles than individuals without GC. And the mean (95% CI) pooled negative likelihood ratio (NLR) and diagnostic odds ratio (DOR) was 0.19 (0.14–0.26) and 41.30 (21.56–79.10), respectively. The area under the SROC curve (AUC) was 0.93. More information was available in Figure 4.
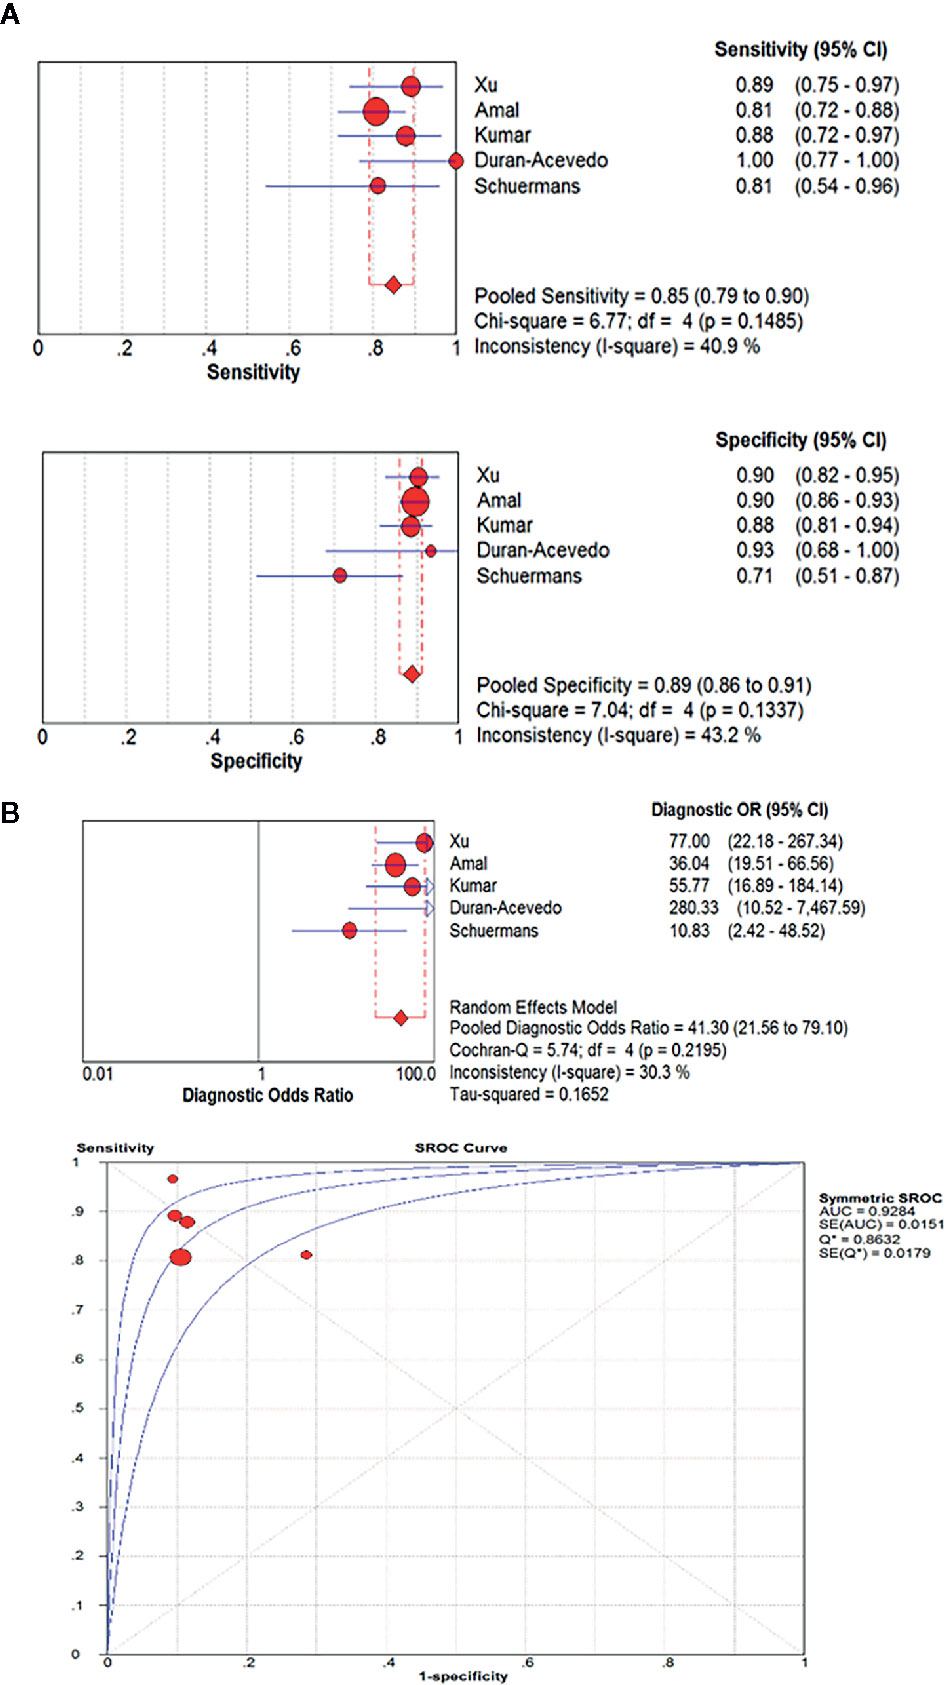
Figure 4 The pooled sensitivity, specificity, diagnostic odds ratio and SROC curve of exhaled VOC profiles in GC diagnosis. (OR, odds ratio; CI, confidence interval; DOR, diagnostic odds ratio.) (A) The pooled results reported a mean sensitivity of 85% (79% to 90% CI) and specificity of 89%(86% to 91% CI). (B) The mean (95% CI) pooled DOR was 41.30(21.56–79.10). The area under the SROC curve(AUC) was 0.93.
Publication Bias and Heterogeneity
As a result of the Deeks funnel plot, there was no published bias (P=0.362>0.05) (Figure 5), although this result was limited by the small number of studies included in the meta-analysis. One of the main causes of heterogeneity in diagnostic studies was the threshold effect. To evaluate the diagnostic threshold, ROC curve plan and the Spearman’s correlation coefficient between sensitivity and 1-specificity was calculated. ROC curve plane scatter chart was not “shoulder arm” distribution and the correlation coefficient was 0.100, (p = 0.873), suggesting that there was no heterogeneity from the threshold effect.
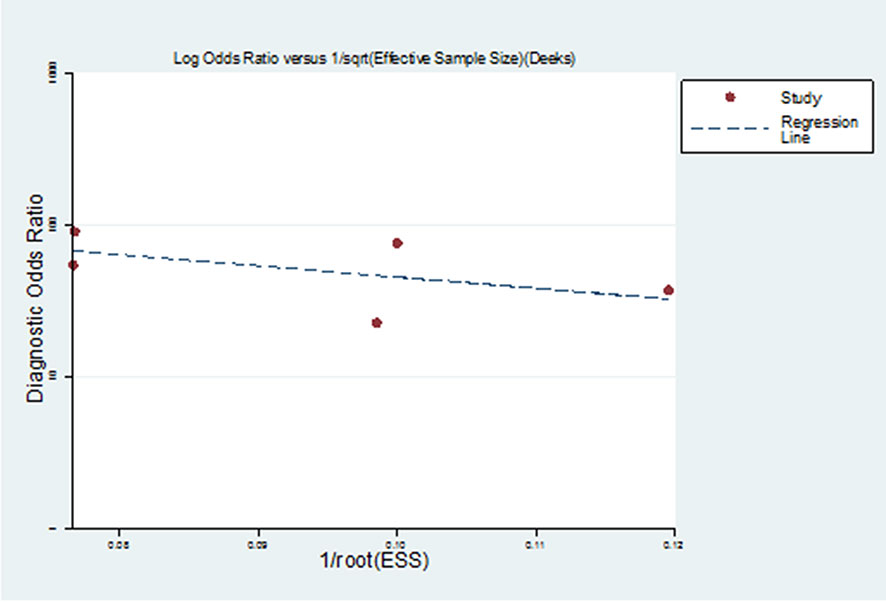
Figure 5 Deeks funnel plot of studies included in the meta-analysis. There was no published bias in Deeks funnel plot of studies included in the meta-analysis.
Discussion
Measurement of VOC signal profiles in exhaled gases is intended to identify a unique fingerprint/odor bolt associated with certain diseases potentially contributing to early diagnosis and improving survival rate. The principle behind exhaled VOCs in cancer detection is that cancer-associated VOCs in the tissue are released into the bloodstream and eventually exhaled by alveolar gas exchange (41). Researches mentioned in this review suggested that certain possible VOC biomarkers could be used to identify GIC with considerable sensitivity and specificity, which will make up for the deficiency of current GIC screening methods and shed light on the current development of GIC diagnosis. Additionally they are also expected to play a role in monitoring cancer recurrences. Our meta-analysis showed that VOCs were used to distinguish between GC and nonmalignant gastric conditions with sensitivity of 85%, and specificity of 89%. And GC patients were approximately six times more likely to have a GC-related exhaled VOC profiles than individuals without GC. DOR and AUC values were 41.30 and 0.93, respectively. These data indicate that exhaled VOC fingerprint analysis may be a promising approach for GC diagnosis. In addition, studies using VOCs to identify CRC and healthy patients displayed a diagnostic accuracy greater than 80% (27–29).
The Possible Biochemical Origin
Next, we focus on the possible biochemical origin of the VOCs markers that has been identified in two or more studies of GEC. Among the 10 VOCs, we found that phenol and its derivatives were significantly elevated in exhaled breath of GEC patients, namely phenol, methyl phenol and ethyl phenol. Phenol is one of the decomposition products of tyrosine (42), so we speculate that the increased demand and overuse of amino acids in tumor tissue may be responsible for the increase of phenol in exhaled breath of GEC patients. Studies had shown that plasma tyrosine levels were significantly reduced in patients with GEC (43–45), to some extent indicate the credibility of the results. In addition, changes in the concentration of phenolic compounds were also observed in gastric cancer urine (46) and gastric contents (47). However, the corrupting effect of intestinal bacteria on protein products also produces phenols. The study of Ahmed WM et al. (48) further confirmed that the metabolism of commensal microbes and pathogenic bacteria are likely to affect the composition of exhaled VOCs. Therefore, it is necessary to analyze the potential biological sources of volatiles.
Xu et al. (19) and Amal et al. (40) both found that 2-acrylonitrile significantly increased in the exhaled breath of GEC patients, compared to the non-GEC group. Mochalski P et al. found that the levels of 2-propenenitrile was related to the occurrence of H. pylori through an ANOVA test on non-cancerous tissue samples (49). Pylori infection, as one of the important causes of gastric cancer, which providing clues to the production mechanism of this compound. As a class 2B carcinogen, 2-acrylonitrile can be produced from tobacco combustion or automobile exhaust. Despite studies showing that smoking, diet and other confounding factors do not affect the experimental results (28, 29, 37). But it cannot be ignored that the composition of exhaled breath was susceptible to indoor air pollutants. So confounding factors should be controlled as much as possible.
Studies showed that the production of exhaled VOCs was associated with lipid peroxidation (22, 23); alkanes are mainly produced by peroxidation of polyunsaturated fatty acids (PUFAs), which contain multiple conjugated double bonds and methylene-CH2- groups (50) provides the basic conditions for the production of alkanes. Therefore, it is possible to detect the increase in hexadecane relative to non-cancerous tissues in exhalation of GEC patients.
The above is just a tentative explanation of the increased VOCs in GEC exhaled breath. The specific mechanism needs to be further studied.
Research Limitations
Although the above studies on the use of exhaled VOCs for the diagnosis of GIC have all achieved positive results, there is great heterogeneity among the diagnostic VOCs obtained. Next we will analyze the possible reasons.
Influence of Detection Technique
The preference of instrument detection range may be one of the reasons for the large heterogeneity of the analyzed VOCs. The traditional method of VOC analysis is mainly GC-MS, which can give qualitative and quantitative information about exhaled VOCs (19, 35, 37). However, there are certain restrictions on the use of this technology, which is expensive and complicated. Inevitably, the use of VOCs for clinical diagnosis and monitoring requires more feasible technical support. Nanomaterial-based sensors, also called electronic noses, a new analysis method has been used for diseases diagnosis research due to their smaller size, easier to use, less expensive, as well as the advantages of sensitive, fast, and responsive. The commonly used electronic nose consists of a nonselective electrochemical sensor arrays and an appropriate pattern recognition software. This technology records distinct patterns of different VOCs present in a gas mixture in response to an unknown component, excluding the need to chemically separate or identify individual components. However, the possible detection limitations of the sensor system must take into account.
Influence of Collection Method
It is worth noting that those studies reviewed are diverse in the use of procedures for collection and anatomical collection sites. A study showed that expiratory flow rate and breath holding time could affect the level of exhaled breath significantly (51). Unfortunately, most studies lack consistency in these parameters. Furthermore, common techniques for sample storage include the use of containers, such as inert bags, glass bottles, will also introduce contaminants and cause the loss of volatile organic compounds during storage (52, 53), although it turns out that Tedlar bag is superior to the rest of the polymers in terms of background emissions, especially stability and reusability. It is also important to note that the exhaled gas includes the alveolar gas exchanged with blood, and the respiratory dead space air, that which is, gas present on the airway or on the top of the alveoli that cannot exchange with blood. Should respiratory dead space air be removed during gas collection? Four research groups (29, 30, 37) filtered the dead space air and only collected the alveolar breath to analysis, but most research groups used mixed gases directly. Further research is needed to determine whether it is necessary to filter the dead space air.
Influence of Endogenous and Exogenous Volatile Organic Compounds
Since exhaled breath includes a variety of endogenous and exogenous VOCs, we need to confirm that these VOCs are related to cellular metabolism itself, not to the microenvironment of indirect metabolic pathways in cancer or other in vivo (human or animal). A study showed that the composition of exhaled breath was susceptible to indoor air pollutants, and at the same time, as many as 86 substances were detected in exhaled breath, which were significantly associated with smoking habits (54). So confounding factors should be controlled as much as possible. Moreover, the metabolism of commensal microbes and pathogenic bacteria are likely to affect the composition of exhaled VOCs (48). So It is necessary to analyze the potential biological source of volatiles. Studies showed that H. pylori uses host cholesterol to defend against antibiotics (55), which leads to an increase in cholesterol biosynthesis, and isoprene as an intermediate in cholesterol biosynthetic pathways will increase accordingly, which may explain the observed higher levels of exhaled isoprene in patients with gastric ulcers (19). In addition to the above, more complicated situations need to be considered. Some gases are found to be exchanged in the airways or alveoli according to their blood solubility. Blood high solubility gases are exchanged in the airways, while low exchanges in the alveoli (56–59). Therefore, we should re-evaluate the diagnostic value of vocs with significant differences.
Additionally, the more commonly encountered shortcomings are the small sample size and the relatively single disease currently studied. there are certain limitations in the clinical complexities. Most research is still limited to the study of exhaled breath biomarkers, showing the potential of breath analysis in the field of gastrointestinal diagnosis. Lack of further large-sample clinical validation studies.
Conclusion
Gastrointestinal cancer is one of the common malignant tumors with a high mortality rate. Therefore, early diagnosis and screening are the key to improving their prognosis. As a non-invasive tool, exhaled VOCs have shown great potential in gastrointestinal cancer diagnosis. which will make up for the shortcomings of current GIC screening methods and provide inspiration for the current development of GIC diagnosis. However, most of the volatiles detected by the current researches have large heterogeneity, so it is particularly important to establish a standard gas collection process and find a portable and accurate detection platform. At the same time, it is necessary to analyze the possible biochemical origin of these volatiles and clarify some endogenous and exogenous interference factors.
At present, the origin of the acquired diagnostic volatiles is mostly in the stage of analysis and inference, and the specific molecular metabolism mechanism is not clear, resulting in a lack of sufficient theoretical support. In addition, to use these volatiles as early tools for clinical diagnosis, large-scale multi-center clinical validation studies are still needed.
Data Availability Statement
The original contributions presented in the study are included in the article/supplementary material. Further inquiries can be directed to the corresponding author.
Author Contributions
LX and SW completed the design, data analysis and manuscript writing. HL contributed to the conception and revised the manuscript. QH and CB provided suggestions for revision of the manuscript. All authors contributed to the article and approved the submitted version.
Funding
National Natural Science Foundation of China (Grant No. 81472750; 82061138004) and Natural Science Foundation of Anhui Province (Grant No. 1508085MH171).
Conflict of Interest
The authors declare that the research was conducted in the absence of any commercial or financial relationships that could be construed as a potential conflict of interest.
References
1. Torre LA, Bray F, Siegel RL, Ferlay J, Lortet-Tieulent J, Jemal A. Global cancer statistics, 2012. CA Cancer J Clin (2015) 65(2):87–108. doi: 10.3322/caac.21262
2. Miekisch W, Schubert JK, Noeldge-Schomburg GF. Diagnostic potential of breath analysis–focus on volatile organic compounds. Clin Chim Acta (2004) 347(1-2):25–39. doi: 10.1016/j.cccn.2004.04.023
3. Hakim M, Broza YY, Barash O, Peled N, Phillips M, Amann A, et al. Volatile organic compounds of lung cancer and possible biochemical pathways. Chem Rev (2012) 112(11):5949–66. doi: 10.1021/cr300174a
4. Kerlin P, Wong L. Breath hydrogen testing in bacterial overgrowth of the small intestine. Gastroenterology (1988) 95(4):982–8. doi: 10.1016/0016-5085(88)90173-4
5. Kharitonov SA, Yates D, Robbins RA, Logan-Sinclair R, Shinebourne EA, Barnes PJ. Increased nitric oxide in exhaled air of asthmatic patients. Lancet (1994) 343(8890):133–5. doi: 10.1016/s0140-6736(94)90931-8
6. Ohara S, Kato M, Asaka M, Toyota T. Studies of 13C-urea breath test for diagnosis of Helicobacter pylori infection in Japan. J Gastroenterol (1998) 33(1):6–13. doi: 10.1007/pl00009968
7. Ibrahim B, Basanta M, Cadden P, Singh D, Douce D, Woodcock A, et al. Non-invasive phenotyping using exhaled volatile organic compounds in asthma. Thorax (2011) 66(9):804–9. doi: 10.1136/thx.2010.156695
8. Van Berkel JJ, Dallinga JW, Moller GM, Godschalk RW, Moonen EJ, Wouters EF, et al. A profile of volatile organic compounds in breath discriminates COPD patients from controls. Respir Med (2010) 104(4):557–63. doi: 10.1016/j.rmed.2009.10.018
9. Barker M, Hengst M, Schmid J, Buers HJ, Mittermaier B, Klemp D, et al. Volatile organic compounds in the exhaled breath of young patients with cystic fibrosis. Eur Respir J (2006) 27(5):929–36. doi: 10.1183/09031936.06.00085105
10. Mazzone PJ, Wang XF, Xu Y, Mekhail T, Beukemann MC, Na J, et al. Exhaled breath analysis with a colorimetric sensor array for the identification and characterization of lung cancer. J Thorac Oncol (2012) 7(1):137–42. doi: 10.1097/JTO.0b013e318233d80f
11. Phillips M, Basa-Dalay V, Blais J, Bothamley G, Chaturvedi A, Modi KD, et al. Point-of-care breath test for biomarkers of active pulmonary tuberculosis. Tuberculosis (Edinb) (2012) 92(4):314–20. doi: 10.1016/j.tube.2012.04.002
12. Neerincx AH, Geurts BP, van Loon J, Tiemes V, Jansen JJ, Harren FJ, et al. Detection of Staphylococcus aureus in cystic fibrosis patients using breath VOC profiles. J Breath Res (2016) 10(4):46014. doi: 10.1088/1752-7155/10/4/046014
13. Berna AZ, McCarthy JS, Wang RX, Saliba KJ, Bravo FG, Cassells J, et al. Analysis of Breath Specimens for Biomarkers of Plasmodium falciparum Infection. J Infect Dis (2015) 212(7):1120–8. doi: 10.1093/infdis/jiv176
14. Chambers ST, Syhre M, Murdoch DR, McCartin F, Epton MJ. Detection of 2-pentylfuran in the breath of patients with Aspergillus fumigatus. Med Mycol (2009) 47(5):468–76. doi: 10.1080/13693780802475212
15. Karban A, Nakhleh MK, Cancilla JC, Vishinkin R, Rainis T, Koifman E, et al. Programmed Nanoparticles for Tailoring the Detection of Inflammatory Bowel Diseases and Irritable Bowel Syndrome Disease via Breathprint. Adv Healthc Mater (2016) 5(18):2339–44. doi: 10.1002/adhm.201600588
16. Joensen O, Paff T, Haarman EG, Skovgaard IM, Jensen P, Bjarnsholt T, et al. Exhaled breath analysis using electronic nose in cystic fibrosis and primary ciliary dyskinesia patients with chronic pulmonary infections. PloS One (2014) 9(12):e115584. doi: 10.1371/journal.pone.0115584
17. Wang C, Sun B, Guo L, Wang X, Ke C, Liu S, et al. Volatile organic metabolites identify patients with breast cancer, cyclomastopathy, and mammary gland fibroma. Sci Rep (2014) 4:5383. doi: 10.1038/srep05383
18. Hakim M, Billan S, Tisch U, Peng G, Dvrokind I, Marom O, et al. Diagnosis of head-and-neck cancer from exhaled breath. Br J Cancer (2011) 104(10):1649–55. doi: 10.1038/bjc.2011.128
19. Xu ZQ, Broza YY, Ionsecu R, Tisch U, Ding L, Liu H, et al. A nanomaterial-based breath test for distinguishing gastric cancer from benign gastric conditions. Br J Cancer (2013) 108(4):941–50. doi: 10.1038/bjc.2013.44
20. Bouza M, Gonzalez-Soto J, Pereiro R, de Vicente JC, Sanz-Medel A. Exhaled breath and oral cavity VOCs as potential biomarkers in oral cancer patients. J Breath Res (2017) 11(1):016015. doi: 10.1088/1752-7163/aa5e76
21. Amal H, Shi DY, Ionescu R, Zhang W, Hua QL, Pan YY, et al. Assessment of ovarian cancer conditions from exhaled breath. Int J Cancer (2015) 136(6):E614–22. doi: 10.1002/ijc.29166
22. Hassanein M, Callison JC, Callaway-Lane C, Aldrich MC, Grogan EL, Massion PP. The state of molecular biomarkers for the early detection of lung cancer. Cancer Prev Res (Phila) (2012) 5(8):992–1006. doi: 10.1158/1940-6207.Capr-11-0441
23. Phillips M, Cataneo RN, Saunders C, Hope P, Schmitt P, Wai J. Volatile biomarkers in the breath of women with breast cancer. J Breath Res (2010) 4(2):26003. doi: 10.1088/1752-7155/4/2/026003
24. Moher D, Liberati A, Tetzlaff J, Altman DG, Group P. Preferred reporting items for systematic reviews and meta-analyses: the PRISMA statement. J Clin Epidemiol (2009) 62(10):1006–12. doi: 10.1016/j.jclinepi.2009.06.005
25. Whiting PF, Rutjes AW, Westwood ME, Mallett S, Deeks JJ, Reitsma JB, et al. QUADAS-2: a revised tool for the quality assessment of diagnostic accuracy studies. Ann Intern Med (2011) 155(8):529–36. doi: 10.7326/0003-4819-155-8-201110180-00009
26. Stang A. Critical evaluation of the Newcastle-Ottawa scale for the assessment of the quality of nonrandomized studies in meta-analyses. Eur J Epidemiol (2010) 25(9):603–5. doi: 10.1007/s10654-010-9491-z
27. Altomare DF, Di Lena M, Porcelli F, Trizio L, Travaglio E, Tutino M, et al. Exhaled volatile organic compounds identify patients with colorectal cancer. Br J Surg (2013) 100(1):144–50. doi: 10.1002/bjs.8942
28. Markar SR, Chin ST, Romano A, Wiggins T, Antonowicz S, Paraskeva P, et al. Breath Volatile Organic Compound Profiling of Colorectal Cancer Using Selected Ion Flow-tube Mass Spectrometry. Ann Surg (2019) 269(5):903–10. doi: 10.1097/sla.0000000000002539
29. Amal H, Leja M, Funka K, Lasina I, Skapars R, Sivins A, et al. Breath testing as potential colorectal cancer screening tool. Int J Cancer (2016) 138(1):229–36. doi: 10.1002/ijc.29701
30. Peng G, Hakim M, Broza YY, Billan S, Abdah-Bortnyak R, Kuten A, et al. Detection of lung, breast, colorectal, and prostate cancers from exhaled breath using a single array of nanosensors. Br J Cancer (2010) 103(4):542–51. doi: 10.1038/sj.bjc.6605810
31. Wang C, Ke C, Wang X, Chi C, Guo L, Luo S, et al. Noninvasive detection of colorectal cancer by analysis of exhaled breath. Anal Bioanal Chem (2014) 406(19):4757–63. doi: 10.1007/s00216-014-7865-x
32. Altomare DF, Porcelli F, Picciariello A, Pinto M, Di Lena M, Caputi Iambrenghi O, et al. The use of the PEN3 e-nose in the screening of colorectal cancer and polyps. Tech Coloproctol (2016) 20(6):405–9. doi: 10.1007/s10151-016-1457-z
33. Zou X, Zhou W, Lu Y, Shen C, Hu Z, Wang H, et al. Exhaled gases online measurements for esophageal cancer patients and healthy people by proton transfer reaction mass spectrometry. J Gastroenterol Hepatol (2016) 31(11):1837–43. doi: 10.1111/jgh.13380
34. Kumar S, Huang J, Abbassi-Ghadi N, Mackenzie HA, Veselkov KA, Hoare JM, et al. Mass Spectrometric Analysis of Exhaled Breath for the Identification of Volatile Organic Compound Biomarkers in Esophageal and Gastric Adenocarcinoma. Ann Surg (2015) 262(6):981–90. doi: 10.1097/SLA.0000000000001101
35. Kumar S, Huang J, Abbassi-Ghadi N, Spanel P, Smith D, Hanna GB. Selected ion flow tube mass spectrometry analysis of exhaled breath for volatile organic compound profiling of esophago-gastric cancer. Anal Chem (2013) 85(12):6121–8. doi: 10.1021/ac4010309
36. Duran-Acevedo CM, Jaimes-Mogollon AL, Gualdron-Guerrero OE, Welearegay TG, Martinez-Marin JD, Caceres-Tarazona JM, et al. Exhaled breath analysis for gastric cancer diagnosis in Colombian patients. Oncotarget (2018) 9(48):28805–17. doi: 10.18632/oncotarget.25331
37. Markar SR, Wiggins T, Antonowicz S, Chin ST, Romano A, Nikolic K, et al. Assessment of a Noninvasive Exhaled Breath Test for the Diagnosis of Oesophagogastric Cancer. JAMA Oncol (2018) 4(7):970–6. doi: 10.1001/jamaoncol.2018.0991
38. Schuermans VNE, Li Z, Jongen A, Wu Z, Shi J, Ji J, et al. Pilot Study: Detection of Gastric Cancer From Exhaled Air Analyzed With an Electronic Nose in Chinese Patients. Surg Innov (2018) 25(5):429–34. doi: 10.1177/1553350618781267
39. Altomare DF, Di Lena M, Porcelli F, Travaglio E, Longobardi F, Tutino M, et al. Effects of Curative Colorectal Cancer Surgery on Exhaled Volatile Organic Compounds and Potential Implications in Clinical Follow-up. Ann Surg (2015) 262(5):862–6; discussion 6-7. doi: 10.1097/SLA.0000000000001471
40. Amal H, Leja M, Funka K, Skapars R, Sivins A, Ancans G, et al. Detection of precancerous gastric lesions and gastric cancer through exhaled breath. Gut (2016) 65(3):400–7. doi: 10.1136/gutjnl-2014-308536
41. Preti G, Labows JN, Kostelc JG, Aldinger S, Daniele R. Analysis of lung air from patients with bronchogenic carcinoma and controls using gas chromatography-mass spectrometry. J Chromatogr (1988) 432:1–11. doi: 10.1016/s0378-4347(00)80627-1
42. Geypens B, Claus D, Evenepoel P, Hiele M, Maes B, Peeters M, et al. Influence of dietary protein supplements on the formation of bacterial metabolites in the colon. Gut (1997) 41(1):70–6. doi: 10.1136/gut.41.1.70
43. Miyagi Y, Higashiyama M, Gochi A, Akaike M, Ishikawa T, Miura T, et al. Plasma free amino acid profiling of five types of cancer patients and its application for early detection. PloS One (2011) 6(9):e24143. doi: 10.1371/journal.pone.0024143
44. Zhang X, Xu L, Shen J, Cao B, Cheng T, Zhao T, et al. Metabolic signatures of esophageal cancer: NMR-based metabolomics and UHPLC-based focused metabolomics of blood serum. Biochim Biophys Acta (2013) 1832(8):1207–16. doi: 10.1016/j.bbadis.2013.03.009
45. Norton JA, Gorschboth CM, Wesley RA, Burt ME, Brennan MF. Fasting plasma amino acid levels in cancer patients. Cancer (1985) 56(5):1181–6. doi: 10.1002/1097-0142(19850901)56:5<1181::aid-cncr2820560535>3.0.co;2-8
46. Cheng Y, Xie G, Chen T, Qiu Y, Zou X, Zheng M, et al. Distinct urinary metabolic profile of human colorectal cancer. J Proteome Res (2012) 11(2):1354–63. doi: 10.1021/pr201001a
47. Kumar S, Huang J, Cushnir JR, Spanel P, Smith D, Hanna GB. Selected ion flow tube-MS analysis of headspace vapor from gastric content for the diagnosis of gastro-esophageal cancer. Anal Chem (2012) 84(21):9550–7. doi: 10.1021/ac302409a
48. Ahmed WM, Lawal O, Nijsen TM, Goodacre R, Fowler SJ. Exhaled Volatile Organic Compounds of Infection: A Systematic Review. ACS Infect Dis (2017) 3(10):695–710. doi: 10.1021/acsinfecdis.7b00088
49. Mochalski P, Leja M, Gasenko E, Skapars R, Santare D, Sivins A, et al. Ex vivo emission of volatile organic compounds from gastric cancer and non-cancerous tissue. J Breath Res (2018) 12(4):046005. doi: 10.1088/1752-7163/aacbfb
50. Kneepkens CM, Lepage G, Roy CC. The potential of the hydrocarbon breath test as a measure of lipid peroxidation. Free Radic Biol Med (1994) 17(2):127–60. doi: 10.1016/0891-5849(94)90110-4
51. Bikov A, Paschalaki K, Logan-Sinclair R, Horváth I, Kharitonov SA, Barnes PJ, et al. Standardised exhaled breath collection for the measurement of exhaled volatile organic compounds by proton transfer reaction mass spectrometry. BMC Pulm Med (2013) 13:43. doi: 10.1186/1471-2466-13-43
52. Beauchamp J, Herbig J, Gutmann R, Hansel A. On the use of Tedlar® bags for breath-gas sampling and analysis. J Breath Res (2008) 2(4):46001. doi: 10.1088/1752-7155/2/4/046001
53. Mochalski P, King J, Unterkofler K, Amann A. Stability of selected volatile breath constituents in Tedlar, Kynar and Flexfilm sampling bags. Analyst (2013) 138(5):1405–18. doi: 10.1039/c2an36193k
54. Filipiak W, Ruzsanyi V, Mochalski P, Filipiak A, Bajtarevic A, Ager C, et al. Dependence of exhaled breath composition on exogenous factors, smoking habits and exposure to air pollutants. J Breath Res (2012) 6(3):36008. doi: 10.1088/1752-7155/6/3/036008
55. McGee DJ, George AE, Trainor EA, Horton KE, Hildebrandt E, Testerman TL. Cholesterol enhances Helicobacter pylori resistance to antibiotics and LL-37. Antimicrob Agents Chemother (2011) 55(6):2897–904. doi: 10.1128/aac.00016-11
56. Anderson JC, Babb AL, Hlastala MP. Modeling soluble gas exchange in the airways and alveoli. Ann BioMed Eng (2003) 31(11):1402–22. doi: 10.1114/1.1630600
57. King J, Unterkofler K, Teschl G, Teschl S, Koc H, Hinterhuber H, et al. A mathematical model for breath gas analysis of volatile organic compounds with special emphasis on acetone. J Math Biol (2011) 63(5):959–99. doi: 10.1007/s00285-010-0398-9
58. King J, Unterkofler K, Teschl G, Teschl S, Mochalski P, Koç H, et al. A modeling-based evaluation of isothermal rebreathing for breath gas analyses of highly soluble volatile organic compounds. J Breath Res (2012) 6(1):16005. doi: 10.1088/1752-7155/6/1/016005
Keywords: volatile organic compounds, exhaled breath, gastrointestinal cancer, early diagnosis, meta-analysis
Citation: Xiang L, Wu S, Hua Q, Bao C and Liu H (2021) Volatile Organic Compounds in Human Exhaled Breath to Diagnose Gastrointestinal Cancer: A Meta-Analysis. Front. Oncol. 11:606915. doi: 10.3389/fonc.2021.606915
Received: 16 September 2020; Accepted: 21 January 2021;
Published: 26 February 2021.
Edited by:
Stephen J. Pandol, Cedars Sinai Medical Center, United StatesReviewed by:
Ramesh Arasaradnam, University of Warwick, United KingdomGiorgio Pennazza, Campus Bio-Medico University, Italy
Copyright © 2021 Xiang, Wu, Hua, Bao and Liu. This is an open-access article distributed under the terms of the Creative Commons Attribution License (CC BY). The use, distribution or reproduction in other forums is permitted, provided the original author(s) and the copyright owner(s) are credited and that the original publication in this journal is cited, in accordance with accepted academic practice. No use, distribution or reproduction is permitted which does not comply with these terms.
*Correspondence: Hu Liu, drliuhu@yahoo.com
†These authors have contributed equally to this work