 Nicolas Borisov1
 Anna Sergeeva2
 Maria Suntsova3,4
 Mikhail Raevskiy1Nurshat Gaifullin5Larisa Mendeleeva2Alexander Gudkov3Maria Nareiko2
 Andrew Garazha6,7
 Victor Tkachev6,7
 Xinmin Li8
 Maxim Sorokin3,6,7*Vadim Surin2
 Anton Buzdin3,4,6*
- 1Moscow Institute of Physics and Technology, Laboratory for Translational Genomic Bioinformatics, Dolgoprudny, Russia
- 2National Research Center for Hematology, Ministry of Health of the Russian Federation, Moscow, Russia
- 3I.M. Sechenov First Moscow State Medical University, Institute of Personalized Medicine, Moscow, Russia
- 4Shemyakin-Ovchinnikov Institute of Bioorganic Chemistry, Group for Genomic Analysis of Cell Signaling Systems, Moscow, Russia
- 5Department of Pathology, Faculty of Medicine, Lomonosov Moscow State University, Moscow, Russia
- 6Omicsway Corp., Research Department, Walnut, CA, United States
- 7Oncobox Ltd., Research Department, Moscow, Russia
- 8Department of Pathology and Laboratory Medicine, University of California Los Angeles, Los Angeles, CA, United States
Multiple myeloma (MM) affects ~500,000 people and results in ~100,000 deaths annually, being currently considered treatable but incurable. There are several MM chemotherapy treatment regimens, among which eleven include bortezomib, a proteasome-targeted drug. MM patients respond differently to bortezomib, and new prognostic biomarkers are needed to personalize treatments. However, there is a shortage of clinically annotated MM molecular data that could be used to establish novel molecular diagnostics. We report new RNA sequencing profiles for 53 MM patients annotated with responses on two similar chemotherapy regimens: bortezomib, doxorubicin, dexamethasone (PAD), and bortezomib, cyclophosphamide, dexamethasone (VCD), or with responses to their combinations. Fourteen patients received both PAD and VCD; six received only PAD, and 33 received only VCD. We compared profiles for the good and poor responders and found five genes commonly regulated here and in the previous datasets for other bortezomib regimens (all upregulated in the good responders): FGFR3, MAF, IGHA2, IGHV1-69, and GRB14. Four of these genes are linked with known immunoglobulin locus rearrangements. We then used five machine learning (ML) methods to build a classifier distinguishing good and poor responders for two cohorts: PAD + VCD (53 patients), and separately VCD (47 patients). We showed that the application of FloWPS dynamic data trimming was beneficial for all ML methods tested in both cohorts, and also in the previous MM bortezomib datasets. However, the ML models build for the different datasets did not allow cross-transferring, which can be due to different treatment regimens, experimental profiling methods, and MM heterogeneity.
Introduction
Multiple myeloma (MM) is a hematological cancer which arises from abnormal antibody producing white blood plasma cells (1). MM affects approximately 500,000 people and results in ~100,000 deaths annually (2, 3) being currently considered treatable but rarely curable (4, 5). There are several MM chemotherapy treatment regimens currently in use, among which eleven include bortezomib (6) (Table 1). Bortezomib is a targeted drug that specifically binds and inhibits 26S proteasome, thus affecting proteolytic degradation pathways (20). Patients with MM respond differently on bortezomib-containing treatment schemes (21), and many patients develop adverse effects including neuromuscular and cardiovascular toxicity (22). Thus, new prognostic biomarkers are needed to personalize treatments with bortezomib (21).
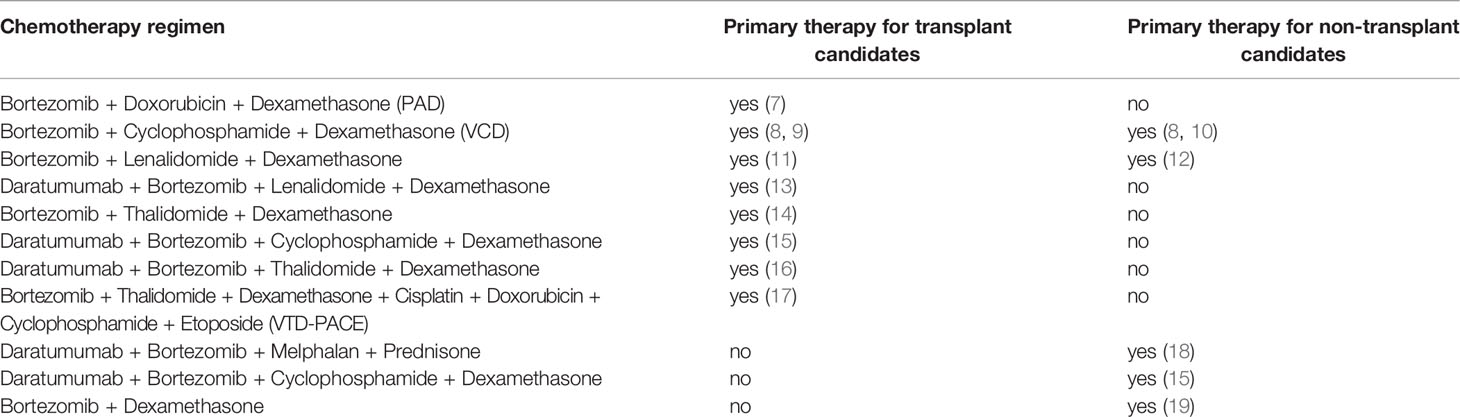
Table 1 Bortezomib containing chemotherapy regimens currently in use for the first-line treatment of multiple myeloma.
High-throughput gene expression data including RNA sequencing profiles can be used for finding effective cancer biomarkers (23, 24). There is a shortage now for clinically annotated molecular profiles of MM that could be used to establish novel molecular diagnostics for most of the current clinical treatment regimens. For several regimens with bortezomib, MM gene expression profiles had been previously established and published for patients who were classified as either responders or non-responders. For example, in a study (25) using Affymetrix Human Genome U133 expression microarrays, 169 MM profiles were published for 85 responder patients and for 84 non-responders on monotherapy with bortezomib (26). In another paper (27) an Affymetrix Human Exon 1.0 ST Array expression dataset was published with the 33 responder and 28 non-responder profiles for the bortezomib monotherapy followed by autologous stem cell transplantation (ASCT) (28). However, monotherapy with bortezomib is not currently a recommended option for the treatment of MM due to its lower efficacy compared to combinational therapies (6). For one of the options currently in clinical use for the MM namely bortezomib + thalidomide + dexamethasone scheme, there is a publicly available dataset (29) obtained using Affymetrix Human Genome U133 Plus arrays for the 69 responder and 49 non-responder patients (28). Other examples account for the studies of bortezomib, doxorubicin, and dexamethasone (PAD) chemotherapy regimen at Myeloma Institute for Research and Therapy (55 responders and 153 non-responders) (30–40), and during Dutch-Belgian HOVON project (30–32, 41–44), where 94 responders and 59 non-responders were investigated; for both studies Affymetrix microarrays were used.
In this study we report new RNA sequencing profiles for 58 (53 after mapped reads threshold filtering) MM patients annotated with the documented responses on two chemotherapy regimens that include bortezomib: PAD, or bortezomib, cyclophosphamide, and dexamethasone (VCD). These regimens are similar in their composition and differ in the presence of doxorubicin that interferes with the DNA replication by intercalating with the nucleobases (45) or cyclophosphamide that produces crosslinks between the DNA strands (46). Both treatment regimens showed clinical benefit and were accepted as first-line treatment of multiple myeloma internationally and in the Russian Federation (Table 1). To our knowledge, this is the first annotated RNA sequencing molecular dataset for the PAD and VCD regimens of MM chemotherapy. In addition, the current profiles were obtained using the same protocols, equipment and reagents as for the ANTE database of RNA sequencing profiles for healthy human tissues and are, therefore, fully compatible with the enclosed eleven profiles for the normal CD138+ cells (47).
The MM biosamples investigated here were taken prior to the first-line chemotherapy treatments and subjected to RNA sequencing. Following treatment, the patients were clinically characterized to assess clinical responses according to the International Myeloma Working Group. Totally, 11 high-quality profiles were obtained for the “complete responders” (CR), 17 for “very good partial responders” (VGPR), 12 for “partial responders” (PR), and 13 for “minimal responders” (MR), where CR + VGPR can be considered good responders and PR + MR—poor responders. Among them, 14 patients received both PAD and VCD treatments (3–12 courses, sequentially), 33 received only VCD (3–12 courses) and 6—only PAD (4–6 courses).
We then used enhanced algorithms for five machine learning (ML) methods to build a classifier distinguishing good and poor treatment responders: support vector machines (SVM), Tikhonov (ridge) regression (RR), binomial naïve Bayes (BNB), random forest (RF) and multi-layer perceptron (MLP). The best result for full PAD+VCD cohort (n = 53) was produced by BNB method (AUC 0.84, sensitivity >0.8, specificity >0.84), and for the VCD cohort (n = 47) by the MLP method (AUC 0.89, sensitivity >0.87, specificity >0.83). In both optimal solutions, FloWPS dynamic data trimming method (26, 48, 49) was used to reduce data dimensionality. We also showed that the same approach was effective for classifying other annotated MM datasets with different bortezomib treatment regimens. We also compared gene expression profiles for the good and poor responders and found five genes commonly regulated here and in the previous datasets (all upregulated in the good responders): FGFR3, MAF, IGHA2, IGHV1-69, and GRB14.
Materials and Methods
Clinically Annotated Biosamples
From March 2016 till June 2018, we collected 58 biosamples of bone marrow cells enriched for the presence of CD138-expressing mononuclear cells, isolated for the patients diagnosed with multiple myeloma (MM) and prescribed with further first-line chemotherapy treatments according to PAD and/or VCD regimens. The MM patients were 29–78 years old, mean age was 58 y.o., 31 male and 27 female patients (Supplementary Table 1). To isolate mononuclear cells, we used Ficoll Paque Plus medium (Sigma) according to the manufacturer’s recommendations. CD138+ cells fractions were obtained using magnetic granules coated with CD138-specific human antibodies MicroBeads (Miltenyi Biotec) and MS Columns (Miltenyi Biotec), according to the manufacturer’s recommendations. Cells were counted by Scepter™ 2.0 Handheld Automated Cell Counter (Merck Millipore) and immediately subjected to RNA extraction.
In parallel, a set of normal samples of CD138+ mononuclear cells was isolated from eleven 25–42 y.o. (mean age 32 y.o.; five males and six females) healthy volunteers as described in (47).
In all tumor related CD138+ experimental fractions the content of MM cells varied between 45 and 97%, as estimated by the pathologist using BD FACSCanto II flow cytometer (Becton Dickinson, USA) and phycoerythrin-conjugated anti-CD138 antibodies. This fraction was then subjected to RNA sequencing with approximately 30 million sequencing reads per library. In parallel, the patient treatment responses on bortezomib, doxorubicin, and dexamethasone (PAD) or bortezomib, cyclophosphamide, and dexamethasone (VCD) regimens, or their combinations, were registered and documented. Among them, 17 patients received both PAD and VCD treatments (3–12 courses, sequentially), 36 received only VCD (3–12 courses), and 5-only PAD (4–6 courses). Totally, 13 RNA sequencing profiles were obtained for the “complete responders” (CR), 17 for “very good partial responders” (VGPR), 14 for “partial responders” (PR), and 16 for “minimal responders” (MR), Supplementary Table 1. Moreover, for two poor responder cases (patients 111 and 115) we isolated MM mononuclear CD138+ cells following tumor relapse on PAD + VCD treatment and performed RNA sequencing (Supplementary Table 1).
For all the biosamples, informed written consents to participate in this study were collected from the patient’s legal representatives. The consent procedure and the design of the study were approved by the ethical committees of the Sechenov Moscow First Medical University, of the Clinical Center Vitamed (Moscow), and of the National Research Center for Hematology (Moscow, Russia).
Preparation of Libraries and RNA Sequencing
For RNA extraction, cells were resuspended in TRI Reagent (MRC) and then Direct-zol RNA MiniPrep (Zymo Research) was used for the RNA extraction. RNA was quantified using Nanodrop (Thermo Fisher Scientific), ethanol-precipitated, and stored in liquid nitrogen until sequencing. For library preparation, RNA Integrity Number (RIN) was measured using Agilent 2100 bioanalyzer. Agilent RNA 6000 Nano or Qubit RNA Assay Kits were used to measure RNA concentration. For depletion of ribosomal RNA, we used KAPA RNA Hyper with RiboErase Kit (KAPA Biosystems). Different adaptors were used for multiplexing samples in one sequencing run. Library concentrations and quality were measured using Qubit ds DNA HS Assay kit (Life Technologies) and Agilent Tapestation (Agilent). RNA sequencing was performed using Illumina HiSeq 3000 equipment for single end sequencing, 50 bp read length, for approximately 30 million raw reads per sample. Data quality check was conducted using Illumina SAV. De-multiplexing was performed using Illumina Bcl2fastq2 v 2.17 software. In parallel, we also isolated fractions of control CD138+ cells from eleven healthy volunteers and subjected them to RNA sequencing using the same protocol, equipment and reagents. The healthy donor profiles were published previously as part of the ANTE atlas of RNA sequencing data in healthy tissues (47).
Processing of RNA Sequencing Data
RNA sequencing FASTQ files were processed with STAR aligner (27) in ‘GeneCounts’ mode with the Ensembl human transcriptome annotation (Build version GRCh38 and transcript annotation GRCh38.89). Ensembl gene IDs were converted to HGNC gene symbols using Complete HGNC dataset (https://www.genenames.org, database version of July 13, 2017. In total, expression levels were established for 36,596 annotated genes with corresponding HGNC identifiers. Additional quality control (QC) metrics for obtained data were generated using NCBI MAGIC software (28, 49, 50). All metrics and detailed protocol for each sample can be found in Supplementary Table 2.
Data Clustering
‘1’ was added to all raw gene counts prior to cluster analyses, to avoid zero expression values, as described by Dillies et al. (51), the gene expression data were merged into single datasets and quantile normalized (52). Hierarchical clustering was performed using R ward.D2 method. The dendrogram was visualized using custom R script.
Dataset Preparation for Machine Learning (ML) Applications
According to (26, 48, 49), the preparation of datasets for the analysis included several steps: (i) normalization of expression levels using the DESeq2 method (51); (ii) finding top 30 marker genes having the highest AUC values for discriminating good and poor responder cases; (iii) performing the leave-one-out (LOO) cross-validation procedure to identify robust core marker gene set that will be used for building the ML models. The latter core marker gene set is an intersection of top 30 marker gene sets for all combinations of but one samples (26, 28, 48, 49).
ML Applications
Although modern ML applications in clinical cancer genomics may rely on deep learning methods (53–55), they require large preceding case cohorts (56), which was not the case for neither of the MM expression datasets under investigation. Thus, to further characterize them we used several non-deep ML methods implemented in the Python sklearn library (56).
The ML analysis of the experimental MM profiles was performed in two modes. First—when all 53 patients were included whose gene expression profiles passed the quality control (PAD+VCD cohort). Second, when 47 patients were included who had either only VCD or combination of PAD and VCD, but not only PAD (VCD cohort).
For each ML method we used a data trimming/preprocessing step using FloWPS method (R package flowpspkg.tar.gz) to increase robustness and efficiency due to individual sample-specific selection of training dataset (26, 48, 49). Among the ML methods, we used linear support vector machines (SVM) and ridge regression (RR) with default parameter settings for the sklearn package. Additionally, we applied random forest (RF), binomial naïve Bayes (BNB), and multi-layer perceptron (MLP) with the settings, which previously showed the best performance for building cancer responder classifiers (26). For RF these settings were n_estimators = 30, criterion = ‘entropy’. For BNB: alpha = 1.0, binarize = 0.0, and fit_prior = False. For MLP: hidden_layer_sizes = 30, alpha = 0.001. To compensate possible effect of unequal number of responder and non-responder samples, all SVM and RF calculations were done with setting class_weight = ‘balanced’ and class_weight = ’balanced_subsample’, respectively. All other parameters were used with the default settings.
Data Records
MM gene expression profiles were deposited to Gene Expression Omnibus database (GEO) under accession number GSE159426. The data is provided as a matrix of raw counts as produced by STAR. The mapping statistic for the corresponding dataset is shown in Supplementary Table 2. The RNA sequencing profiles for healthy CD138-positive controls were deposited in GEO database with accession number GSE120795.
Code Availability
R code for building dendrograms with bar plots is freely available on Gitlab at: https://gitlab.com/oncobox/watermelon_multisection/blob/master/utils/gallow_plot.R. Flowpspkg.tar.gz is available on Gitlab at: https://gitlab.com/borisov_oncobox/flowpspkg.
Results and Discussion
Initial Analysis of RNA Sequencing Data
Primary RNA sequencing data were characterized in detail with the NCBI MAGIC software (57) (Supplementary Table 2) and analyzed to assess if the profiles obtained are congruent with the biological nature of the biosamples under study. To this end we mixed the MM data obtained here with the profiles obtained by us using the same protocols, equipment and reagents for eleven samples of CD138+ cells of healthy volunteers (47). We performed hierarchical clustering analysis and observed that in line with the biological significance with one exception the norms formed a compact cluster on the dendrogram separately from the cancers (Figure 1). Furthermore, the outstanding normal profile had relatively low number of sequencing reads (Figure 1) and didn’t meet the previously established quality control (QC) criterion for this RNA sequencing protocol of having at least 2.5 million uniquely gene-mapped reads per library (47). This established threshold effectively marked samples with low quality values of other QC metrics, e.g. proportion of genomic counts, high rate of mismatches, number of reads spanning splice junction, high percentage of ribosomal counts (47). Filtering of the profiles that didn’t meet mapped-reads QC resulted in a tight clustering both on the dendrogram and on the principal component analysis (PCA) plot and removed healthy outlier (Figures 2A, B). However, the good (CR + VGPR) and poor (PR + MR) MM responders showed mixed trend and didn’t form any response-specific clusters (Figures 2C, D).
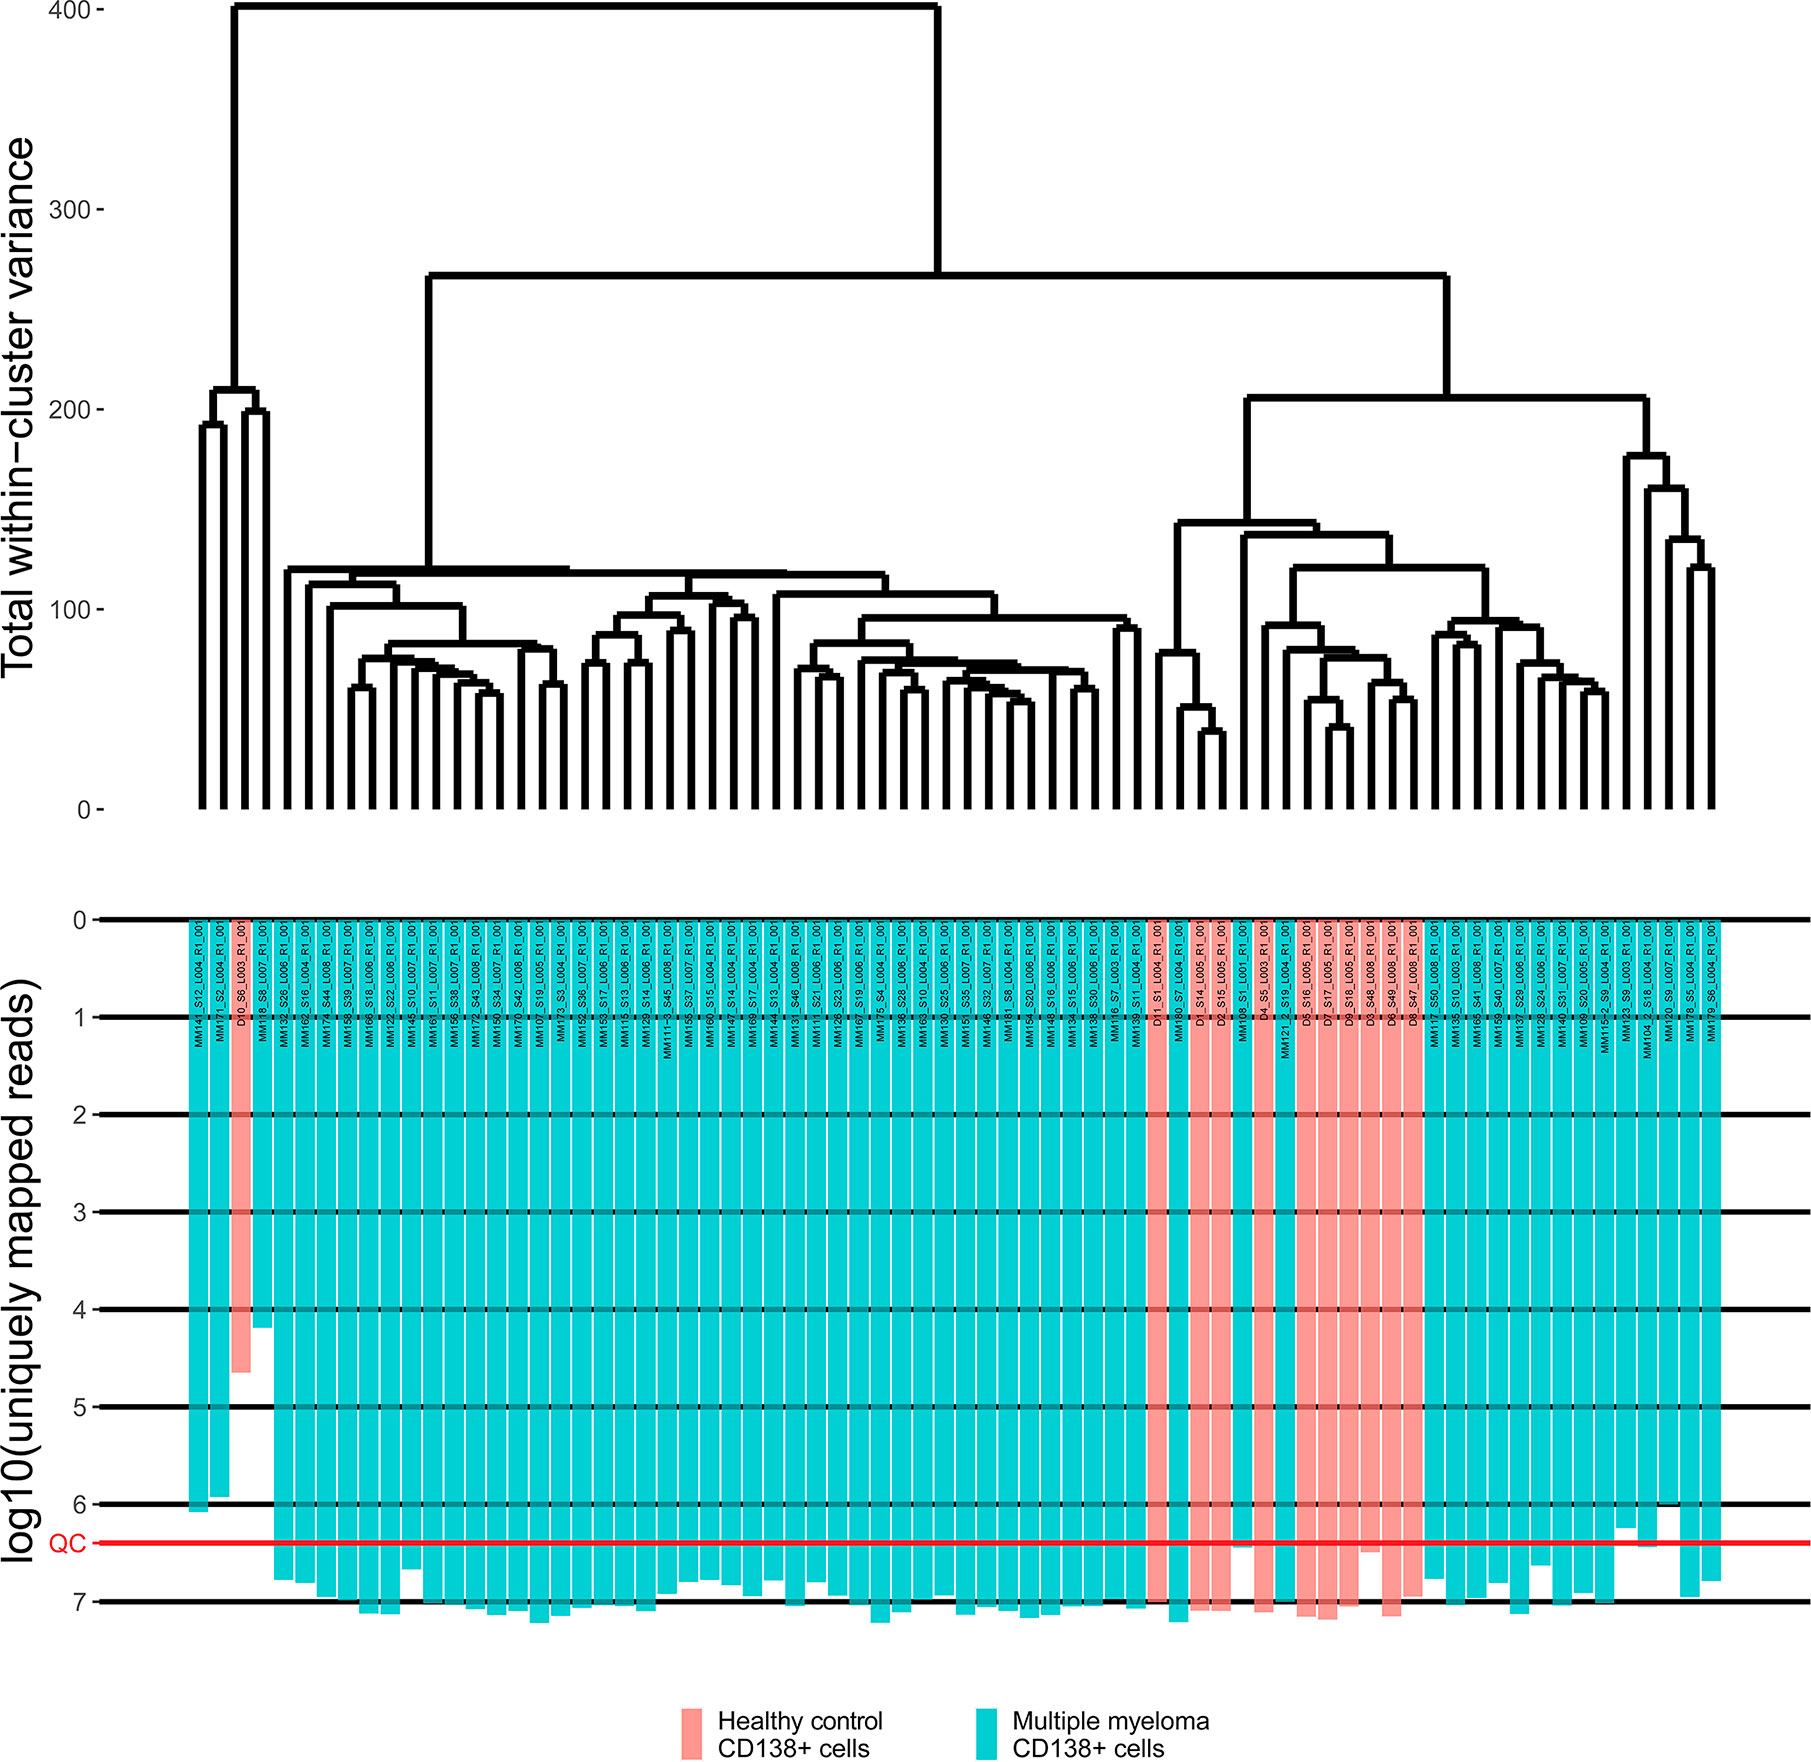
Figure 1 The hierarchical clustering dendrogram of all experimental RNA sequencing profiles of the control and multiple myeloma samples. Gene expression data were used to calculate Euclidian distances between the samples. Color indicates the sample type. The lower scale indicates the number of uniquely mapped reads. QC denotes the quality control threshold of 2.5 million uniquely mapped reads.
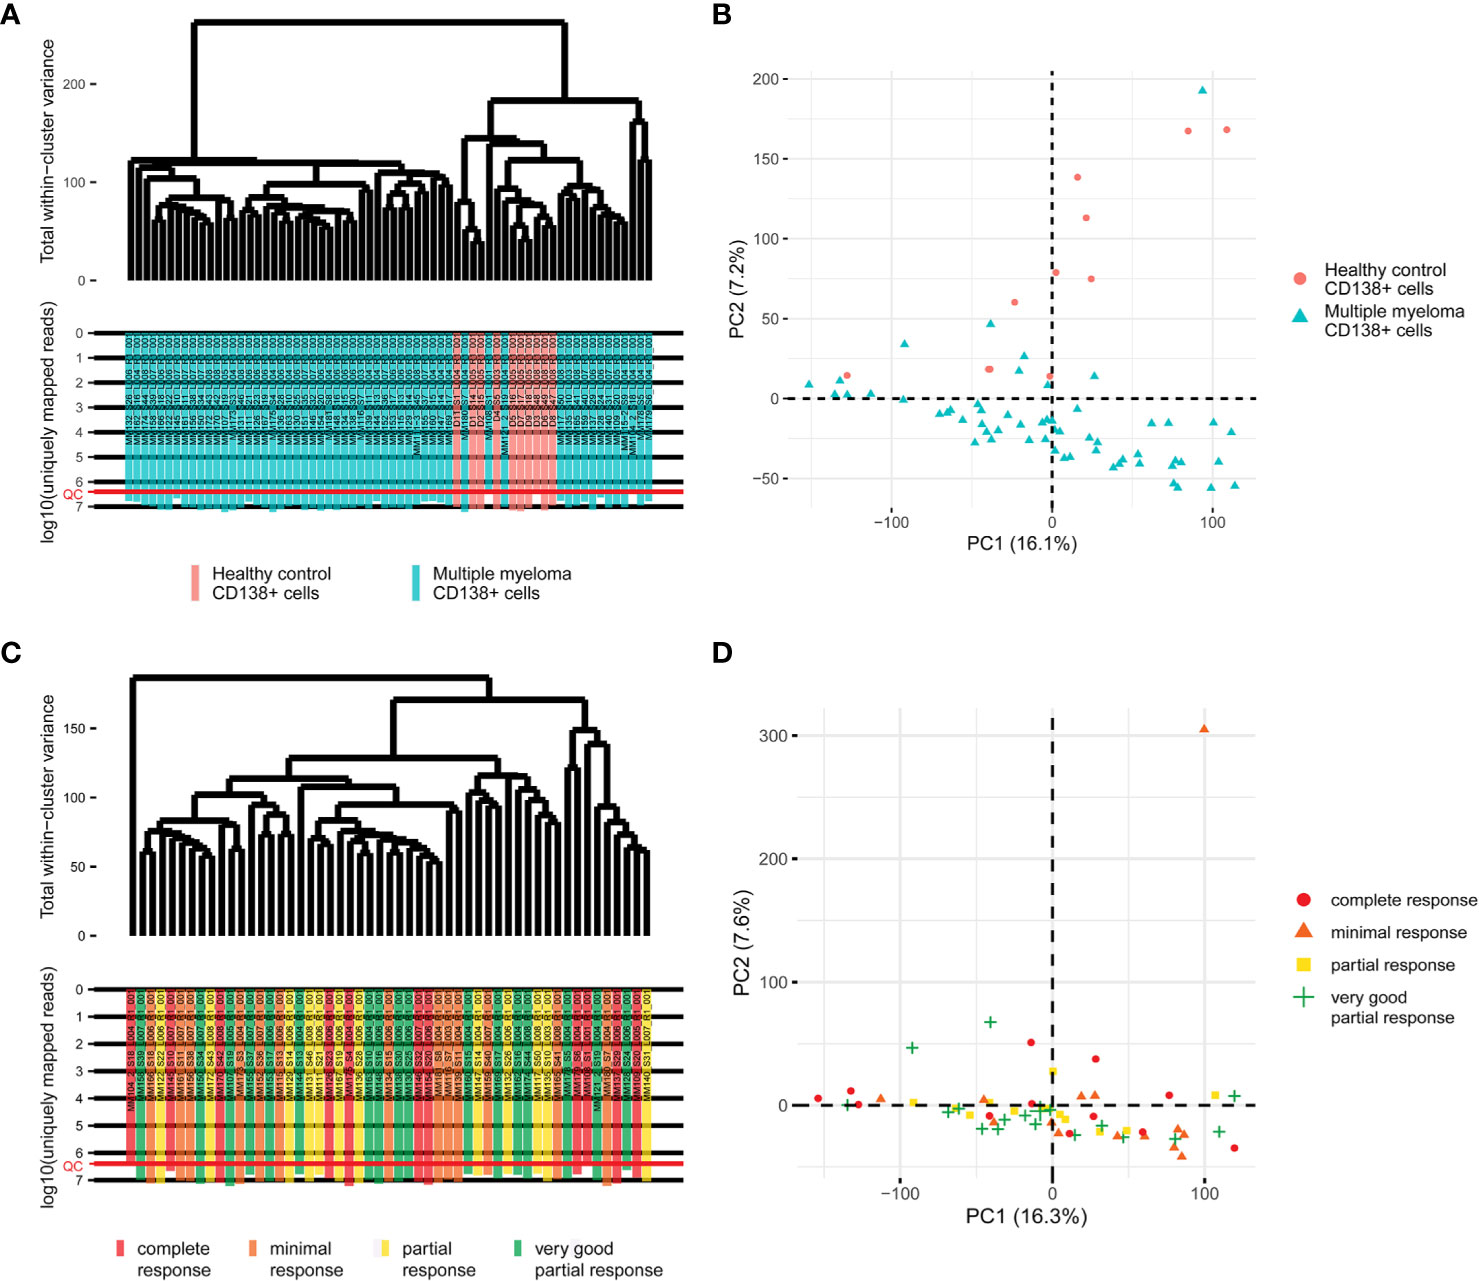
Figure 2 (A) The hierarchical clustering dendrogram of QC-passed experimental RNA sequencing profiles of the control and multiple myeloma samples. Gene expression data were used to calculate Euclidian distances between the samples. The color markers indicate the sample types. The lower scale indicates the number of uniquely mapped reads. ‘QC’ denotes the quality control threshold of 2.5 million uniquely mapped reads. (B) PCA for QC-passed experimental RNA sequencing profiles of the control and multiple myeloma samples. The color markers indicate the sample types. (C) The hierarchical clustering dendrogram of QC-passed experimental RNA sequencing profiles of the multiple myeloma samples. Gene expression data were used to calculate Euclidian distances between the samples. The color markers indicate the response. The lower scale indicates the number of uniquely mapped reads. ‘QC’ denotes the quality control threshold of 2.5 million uniquely mapped reads. (D) PCA for QC-passed experimental RNA sequencing profiles of the multiple myeloma samples. The color markers indicate the response.
Building of ML-Assisted Classifiers for VCD MM Responders and Non-Responders
For our further analyses we used molecular profiles that passed mapped-reads QC and represented 53 MM patients (Supplementary Table 1), where 28 were classified as the good (CR + VGPR) and 25 as the poor (MR + PR) responders.
Reducing data dimensionality in disproportionately rich datasets is required for statistically justified tests (49). Prior to using machine learning (ML) approaches, we performed feature selection procedure to identify core marker gene expression set comparable in size to the number of the patient cases under analysis (26, 28). To this end we selected the most informative fraction of the initial data that can distinguish between the good and poor treatment responder classes using a leave-one-out-based method (48). Because of the size of our MM dataset (n = 53 for full cohort and 47 for VCD) the n-fold cross-validation scheme is too rough for such a limited dataset, and the leave-one-out (i.e., 53/47-fold cross-validation approach for full/VCD cohort, respectively) is the best way to obtain more accurate results.
For each clinical case i = 1, … 53/47, we determined the top 30 marker genes that distinguished responder and non-responder cases in a sub-dataset that contains all samples but i. For all 52/46 such sub-datasets each having 52/46 cases, we interrogated each gene taken one by one and obtained the set of top 30 genes showing the highest ROC AUC values for the difference between responder and non-responder profiles. Area under the ROC curve (AUC) is the universal metric of a biomarker robustness depending on its sensitivity and specificity (28). It varies from 0.5 till 1, and the standard discrimination threshold is typically set as 0.7, where the items with greater AUC are thought high-quality biomarkers (58). AUC is broadly used for scoring of molecular biomarkers in oncology (23, 59–62).
The final list of core marker genes was then obtained by intersecting top 30 gene sets for all 53/47 sub-datasets. By using this procedure, we obtained a set of 8 core marker genes whose expression was characteristic for the MM patient (non)responder cohort (Figures 3, 4; Table 2, Supplementary Tables 3, 4).
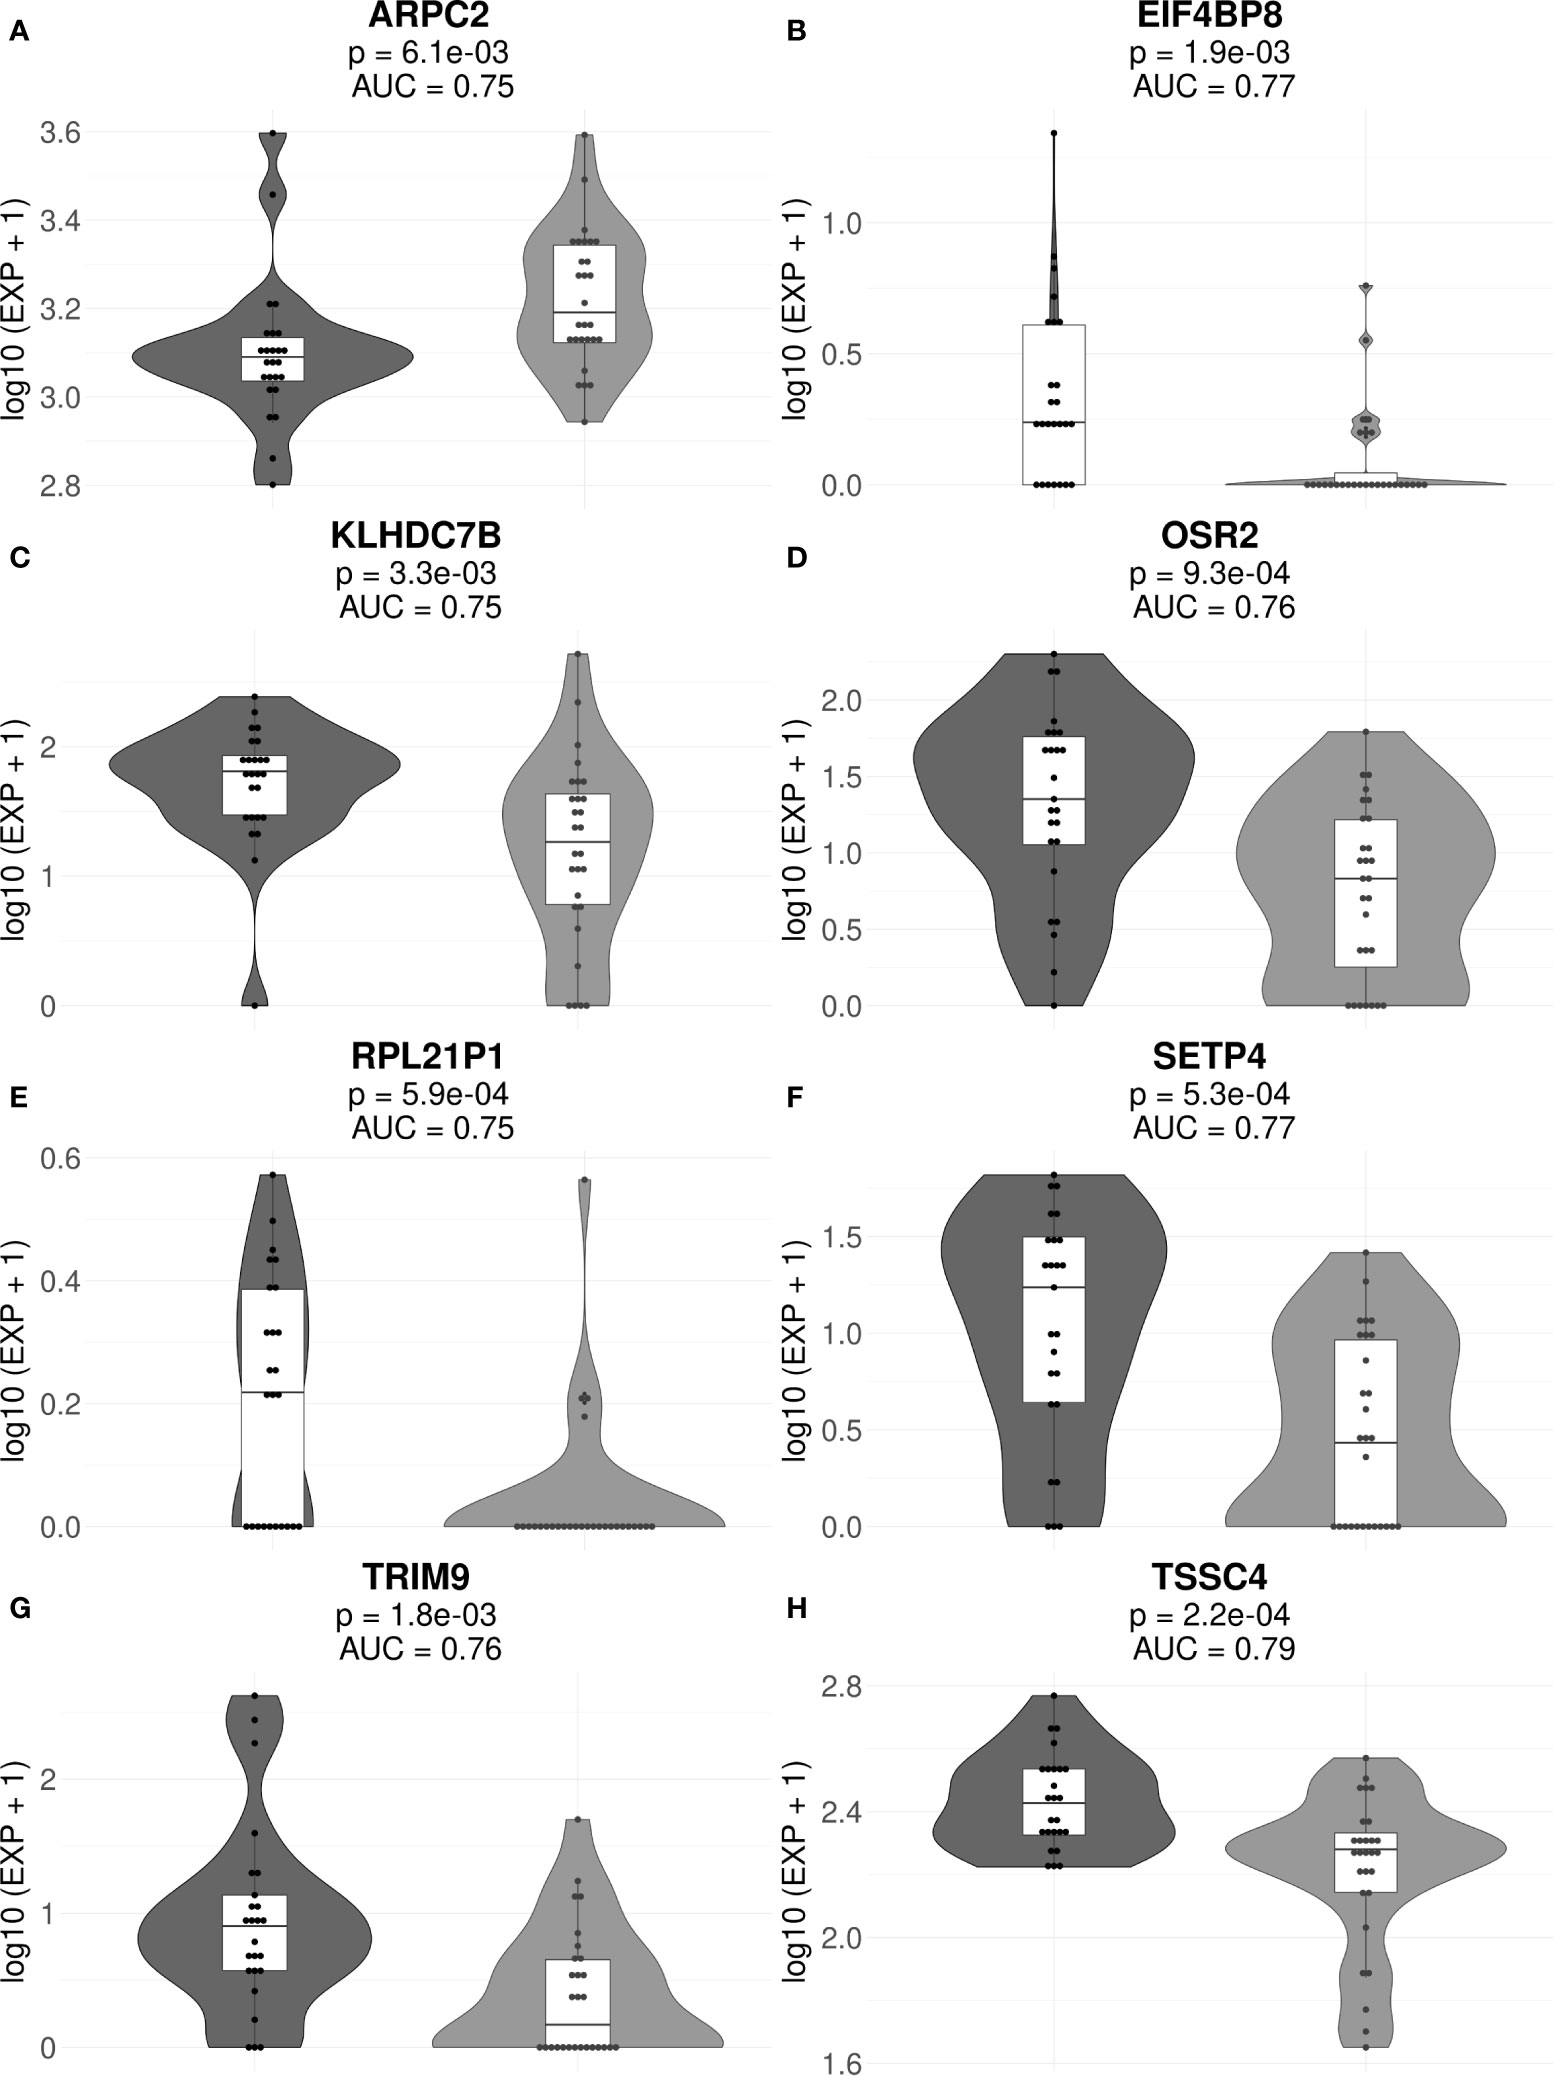
Figure 3 Gene expression levels of genes ARPC2 (A), EIF4BP8 (B), KLHDC7B (C), OSR2 (D), RPL21P1 (E), SETP4 (F), TRIM9 (G), and TSSC4 (H) in the full cohorts of MM responders and poor responders to PAD/VCD therapy. For every gene, paired t-test p-values and AUC values are shown. Each dot on the graph represents single MM sample. Grey indicates good treatment responders, black—poor responders.
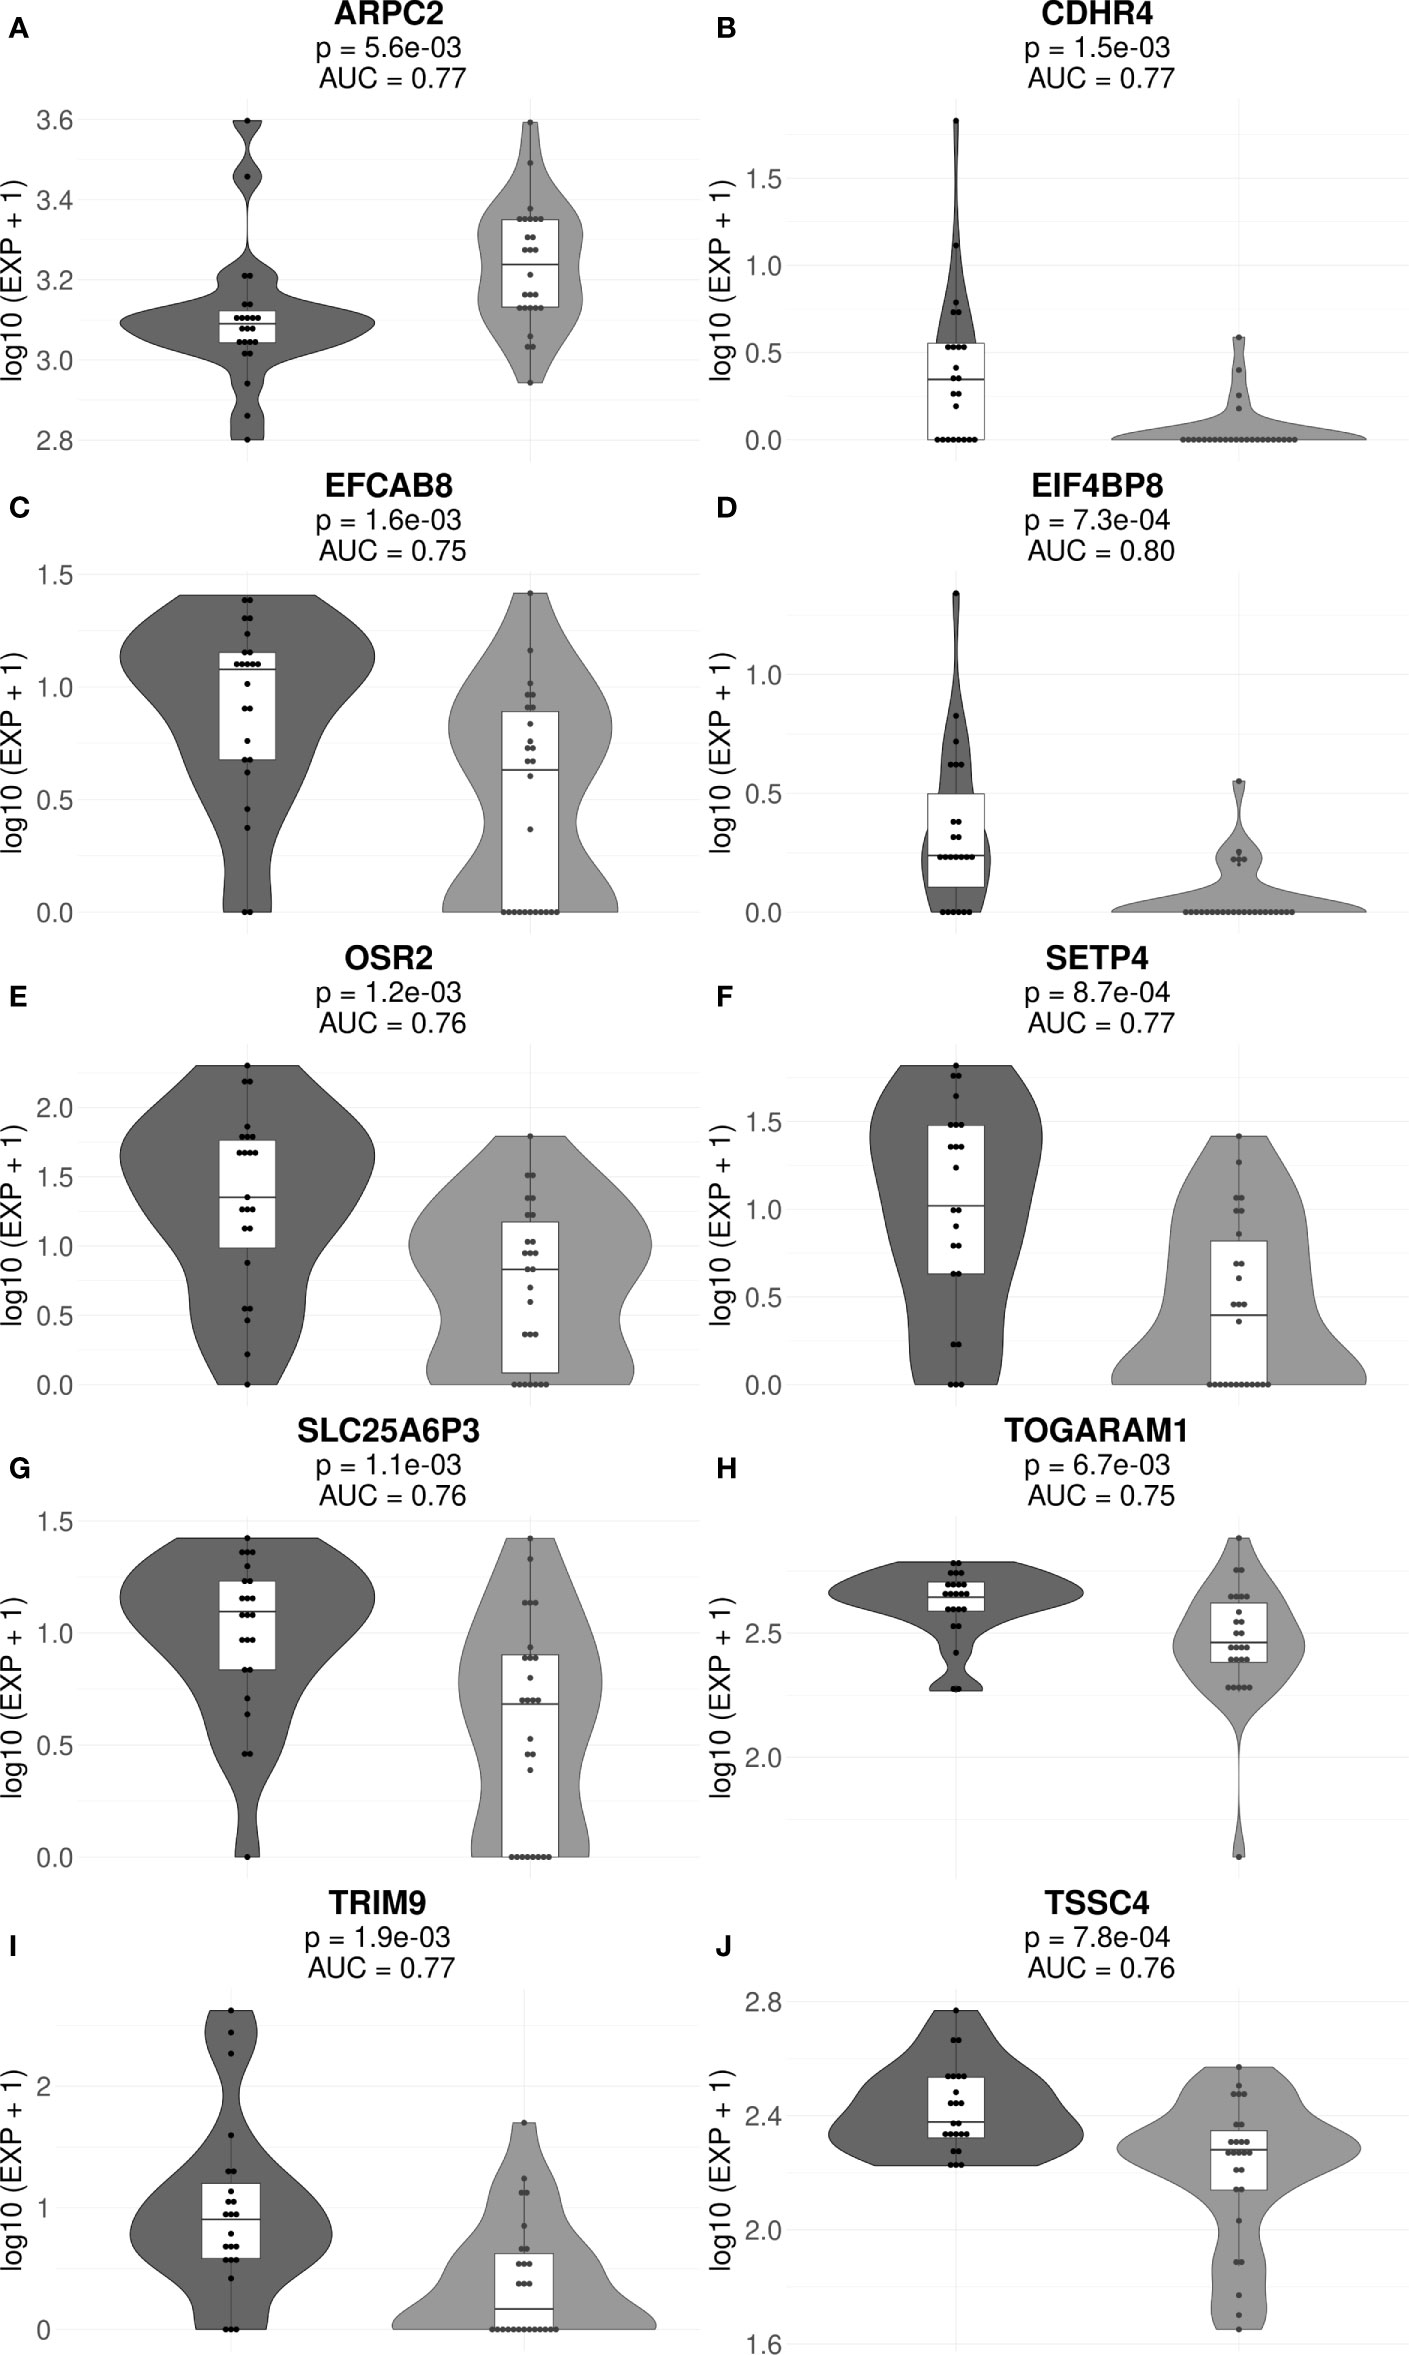
Figure 4 Gene expression levels of genes ARPC2 (A), CDHR4 (B), EFCAB8 (C), EIF4BP8 (D), OSR2 (E), SETP4 (F), SLC25A6P3 (G), TOGARAM1 (H), TRIM9 (I), and TSSC4 (J) in the cohorts of MM responders and poor responders to VCD therapy. For every gene, paired t-test p-values and AUC values are shown. Each dot on the graph represents single MM sample. Grey indicates good treatment responders, black—poor responders.
Table 2 Core marker genes for the current PAD/VCD MM dataset (full cohort/VCD cohort).
Interestingly, many of those genes were previously reported as cancer biomarkers. For example, gene ARPC2 is prognostic biomarker in ovarian carcinomas (65). Gene KLHDC7B is regulated by interferon signaling pathway (66) and was previously published as the methylation marker in breast cancer (67) and also poor prognosis biomarker in triple negative breast cancer (68) and laryngeal cancer (69). OSR2 gene is methylation marker in gastric cancer (70) and TRIM9 was reported as cell-free DNA methylation marker of metastatic breast cancer (71). Finally, TSSC4 gene is located in 11p15.5 locus, an important tumor-suppressor gene region which alterations are linked with the Beckwith–Wiedemann syndrome, Wilms tumor, rhabdomyosarcoma, adrenocortical carcinoma, and lung, ovarian, and breast cancer (https://www.genecards.org/cgi-bin/carddisp.pl?gene=TSSC4).
To improve performance of ML, we used a recent data preprocessing/trimming technique termed floating-window projective separator (FloWPS). This method increases AUC for most of ML methods in most of the clinically annotated gene expression datasets investigated (26, 48, 49). FloWPS improves the classifier robustness by performing dynamic data trimming and selecting sample-specific sets of relevant genes to prevent extrapolation in the feature space (described in detail in Supplementary Text 1). It prevents extrapolation in the feature space by excluding the features that cause such extrapolation. Second, it selects only k nearest neighbors for the training dataset to build a ML model similarly to the kNN method (72) to avoid confusing interference from too distant points from the training dataset in the feature space.
We then built binary classifiers of MM response on PAD and VCD regimens using five ML methods: linear support vectors machine (SVM) (50, 73, 74), random forests (RF) (75), ridge regression (RR) (76), binomial naïve Bayes (BNB) (77), and multi-layer perceptron (MLP) (52, 74, 78). We checked performance of these methods with and without FloWPS. Cross-validation of the results for every method was done using the leave-one-out approach to calculate quality metrics such as AUC, sensitivity and specificity. The results are shown in Figures 5, 6 depending on different values of B, a relative balance factor for false positive and false negative errors. For all ML methods, application of FloWPS increased quality of the classifiers built as reflected by AUC metric (Figures 5, 6). Taking together the three criteria of AUC, sensitivity (Sn) and specificity (Sp), the optimal solution was provided by the BNB method with FloWPS (AUC = 0.84) for the full cohort, and by MLP method with FloWPS (AUC = 0.89) for the VCD cohort.
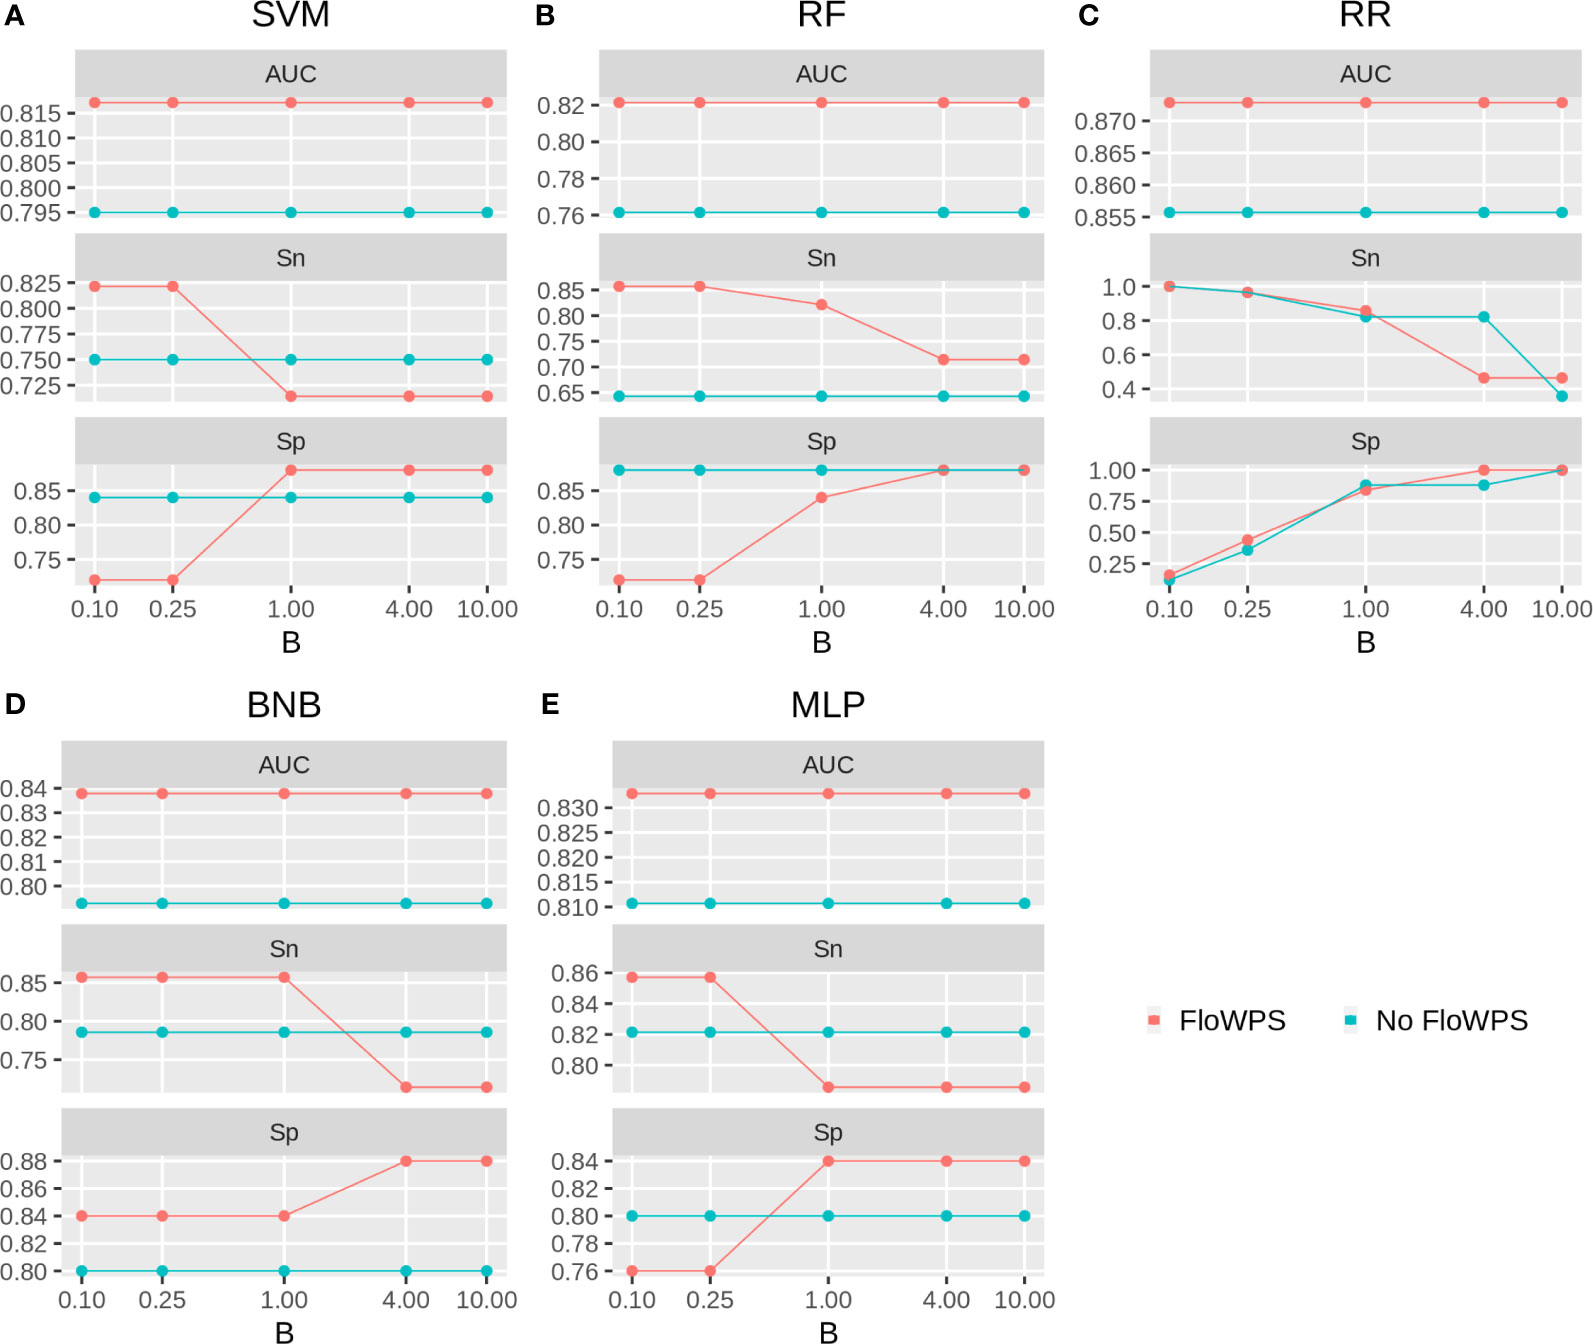
Figure 5 Area under receiver-operator curve (AUC), sensitivity (Sn) and Specificity (Sp) for five ML methods (A) linear SVM, (B) RF, (C) RR, (D) BNB, (E) MLP during classification of response to PAD/VCD treatment of 53 MM patients (full cohort). Parameter B is false positive vs. false negative balance factor.
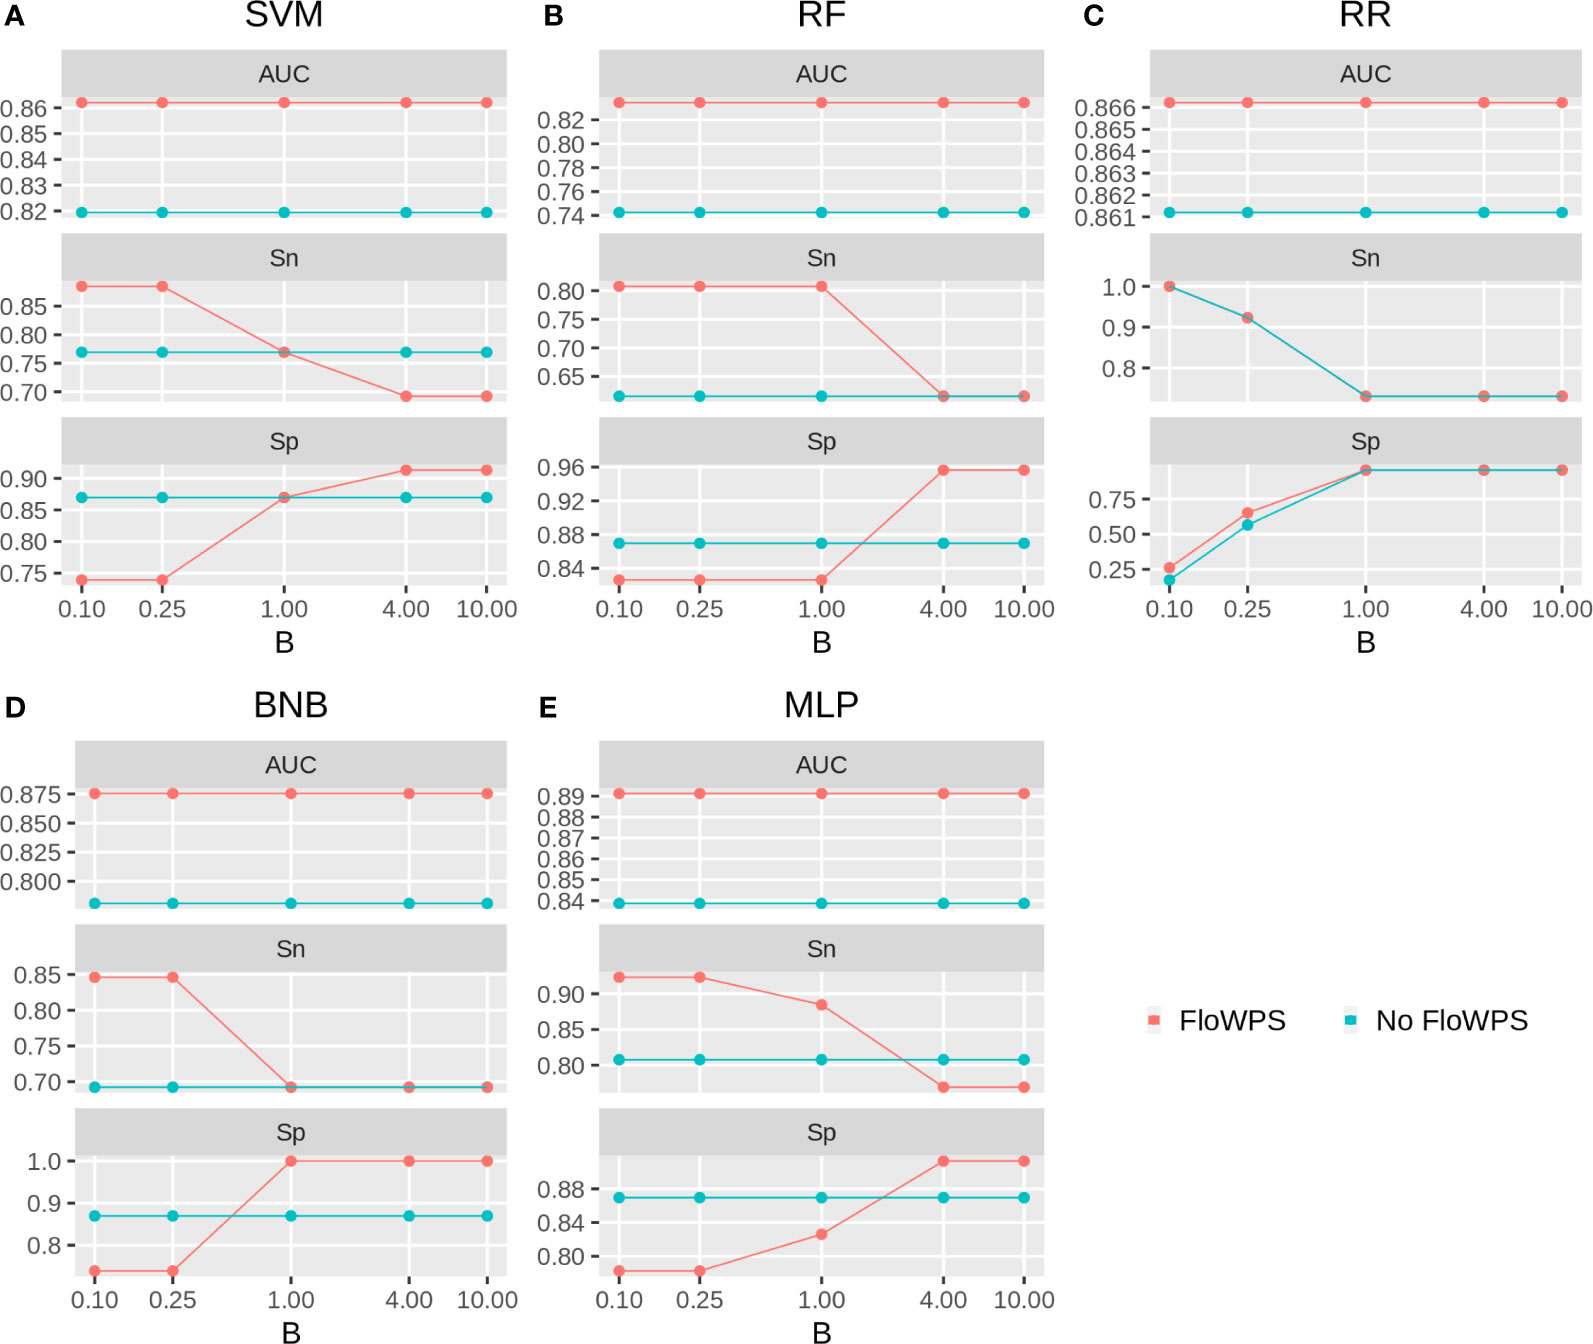
Figure 6 Area under receiver-operator curve (AUC), sensitivity (Sn) and Specificity (Sp) for five ML methods (A) linear SVM, (B) RF, (C) RR, (D) BNB, (E) MLP during classification of response to VCD treatment of 47 MM patients (VCD cohort). Parameter B is false positive vs. false negative balance factor.
Comparison With Other Publicly Available Gene Expression Datasets With Known MM Response to Bortezomib-Containing Chemotherapy Regimens
We found seven publicly available MM datasets containing gene expression profiles annotated by clinical responses to the different bortezomib containing treatment schemes (25, 27–29, 32) summarized here on Table 3. Among them, only two chemotherapy scheme (bortezomib + thalidomide + dexamethasone) and PAD are currently accepted by the NCCN guidelines (79). All those alternative datasets were obtained by using expression microarrays whereas RNA sequencing that can be considered gold standard of cancer transcriptomic analyses (80) was used here for the first time to characterize PAD and VCD treatment efficiencies.
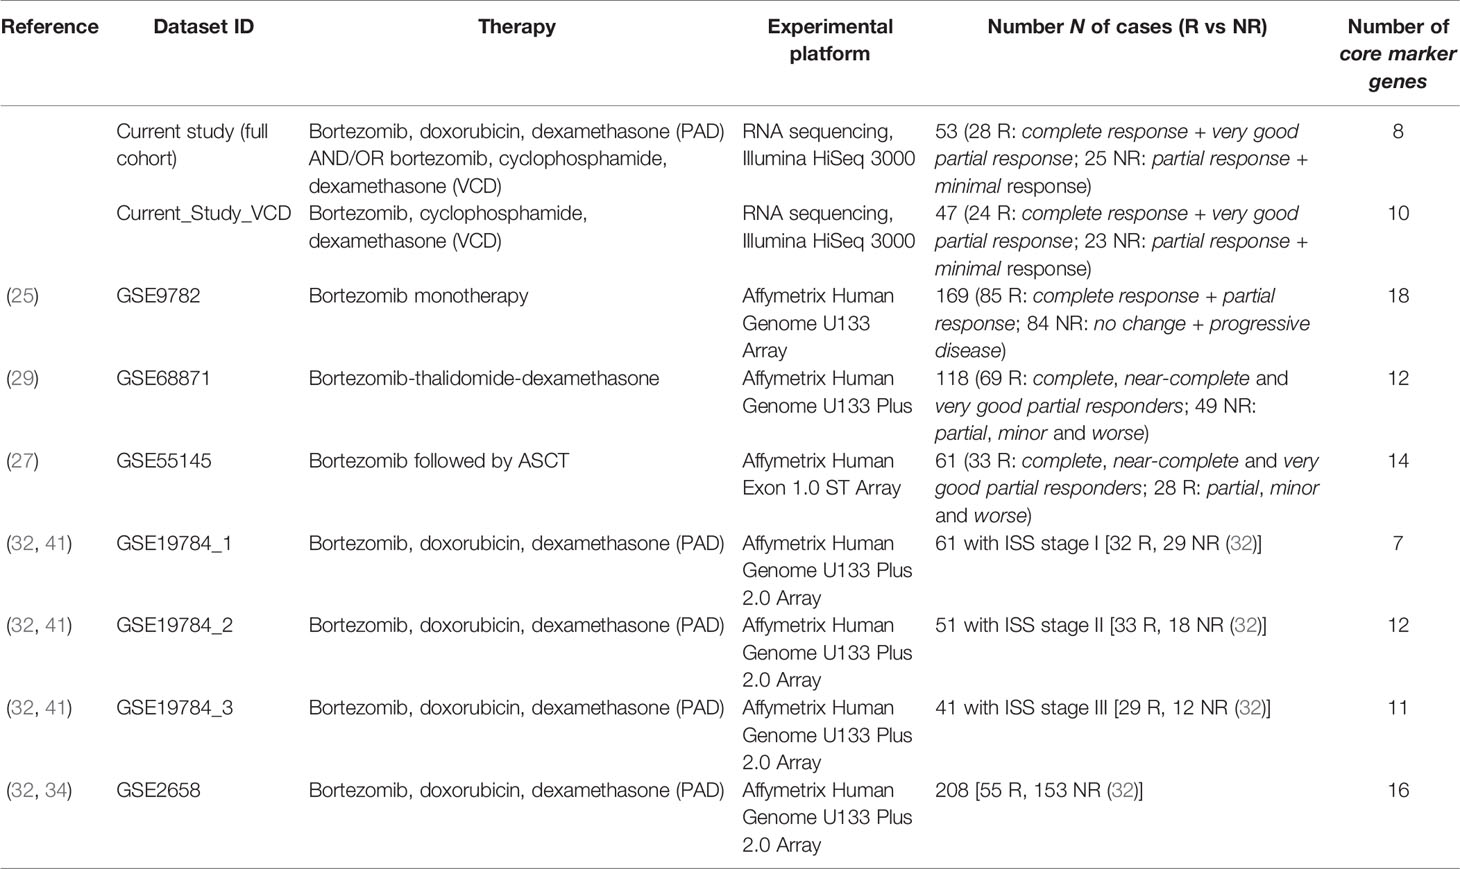
Table 3 General characteristics of bortezomib chemotherapy response-annotated MM datasets.
When processed in the same way as the current experimental dataset to apply different ML methods, 7–18 core marker genes distinguishing good and poor responders were obtained for these literature datasets (26). We found no intersections between the core marker genes corresponding to these and current experimental datasets (Table 4). Moreover, using the current experimental set of 8/10 core marker genes (for the full/VCD cohorts, respectively) couldn’t be used for building robust classifiers with the same repertoire of ML methods (data not shown). This can be due to differences in both gene expression interrogation methods, MM heterogeneity, and the composition of MM treatment schemes. Similarly, findings of Intergroupe Francophone du Myélome (IFM) suggest the absence of a robust gene signature associated with the treatment response (14, 81, 82).
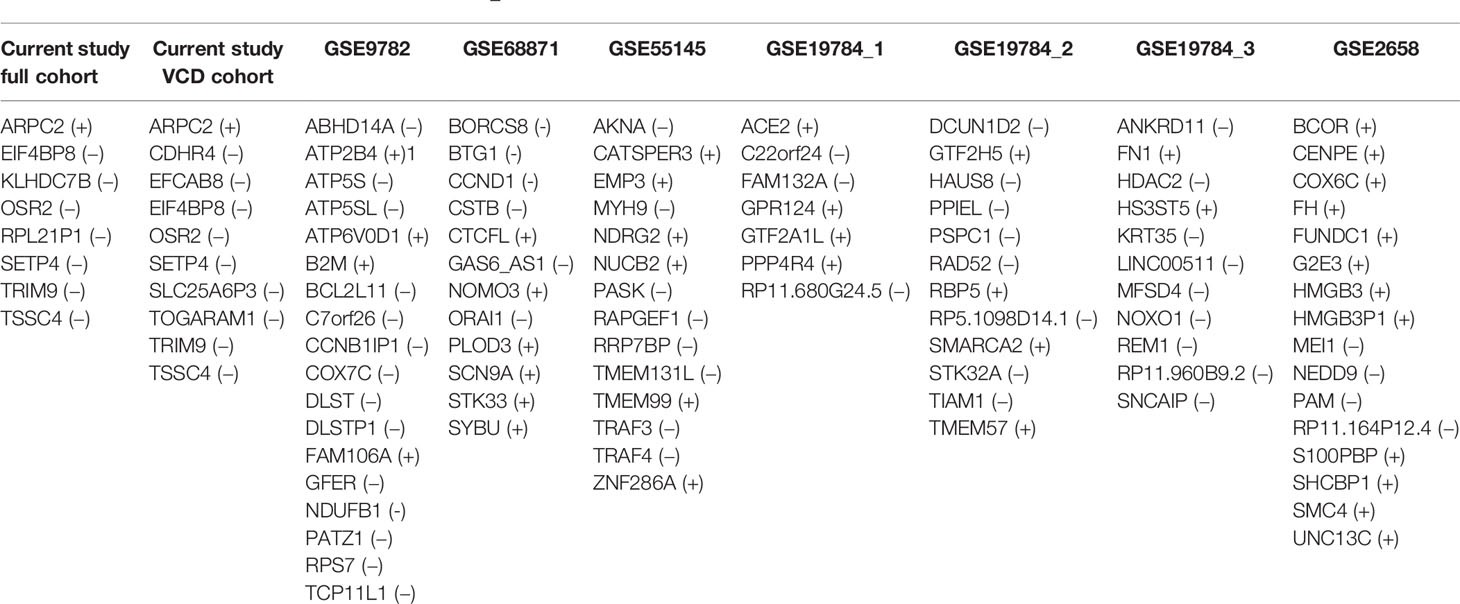
Table 4 Core marker genes identified for bortezomib chemotherapy response-annotated MM datasets; genes that are overexpressed in the treatment responders are marked by (+), downregulated in the responders by (−).
However, for all the literature datasets investigated utilization of best ML methods enhanced by FloWPS using their own core biomarker genes resulted in high-quality classifiers with ROC AUC varying in the range 0.79–0.96 (Table 5). Interestingly, one of those previous MM datasets (25) for bortezomib monotherapy (best AUC = 0.8) was previously characterized as “inconvenient” for ML because other attempts to build a response classifier without using core marker gene approach and FloWPS were unsuccessful resulting in AUC <0.66 (83–87).
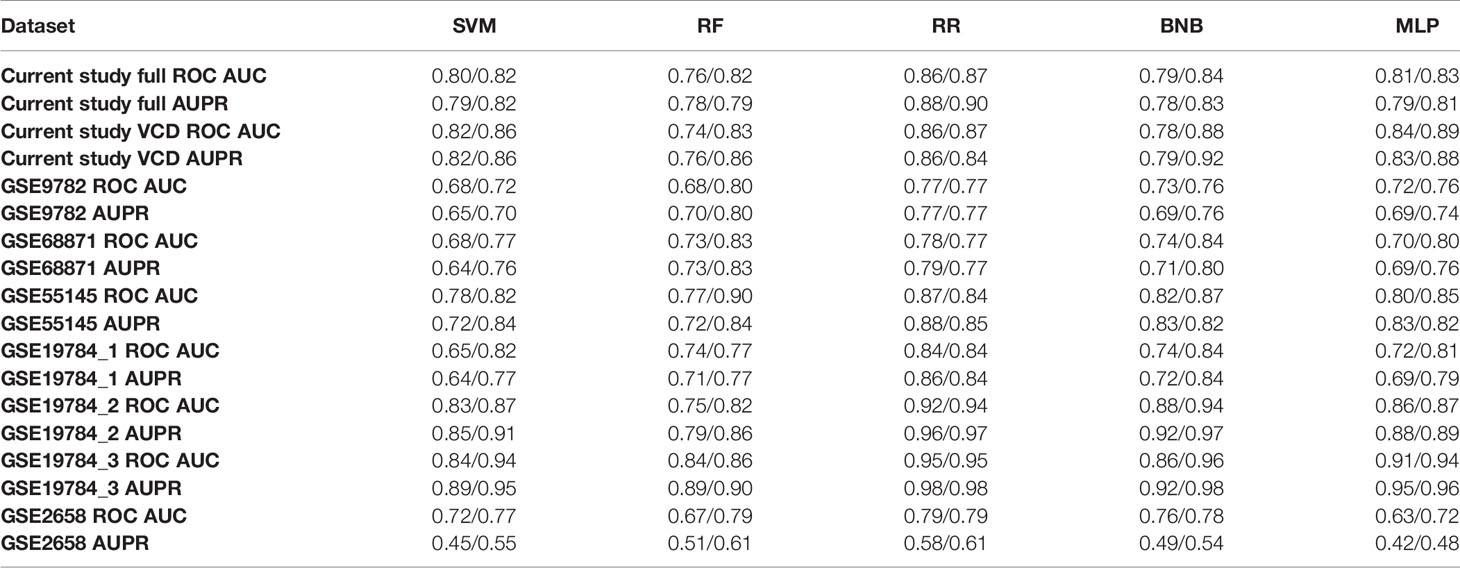
Table 5 Best ROC AUC and AUPR (precision-recall AUC) values obtained for good versus poor responder classifiers built using different ML methods without/with FloWPS for different MM annotated expression datasets.
For ROC AUC metric, FloWPS enhancement was beneficial for all global ML methods such as SVM, RF, BNB, and MLP. Likewise, it increased the precision-recall AUC (AUPR) metric for global ML methods in most datasets (Table 5). This was also in line with the previous findings where it could improve accuracy and Matthews correlation coefficient metrics (48).
Differentially Expressed Gene Analysis
We performed the analysis for differentially expressed genes that distinguish responders from non-responders using the DESeq2 (51) method with the criteria pAdjusted <0.05, |LFC2| >0.5 (Supplementary Figure 2). Interestingly, we found no marker role of bortezomib molecular target genes PSMB1 and PSMB5 for neither dataset, as reflected by AUC levels of less than 0.7 (Supplementary Figure 1).
Despite the lack of intersection between core marker genes that served for ML model creation, there were several differential genes that were regulated similarly among the good vs poor responders in the different datasets, and the intersection pattern was not random (Figure 7).
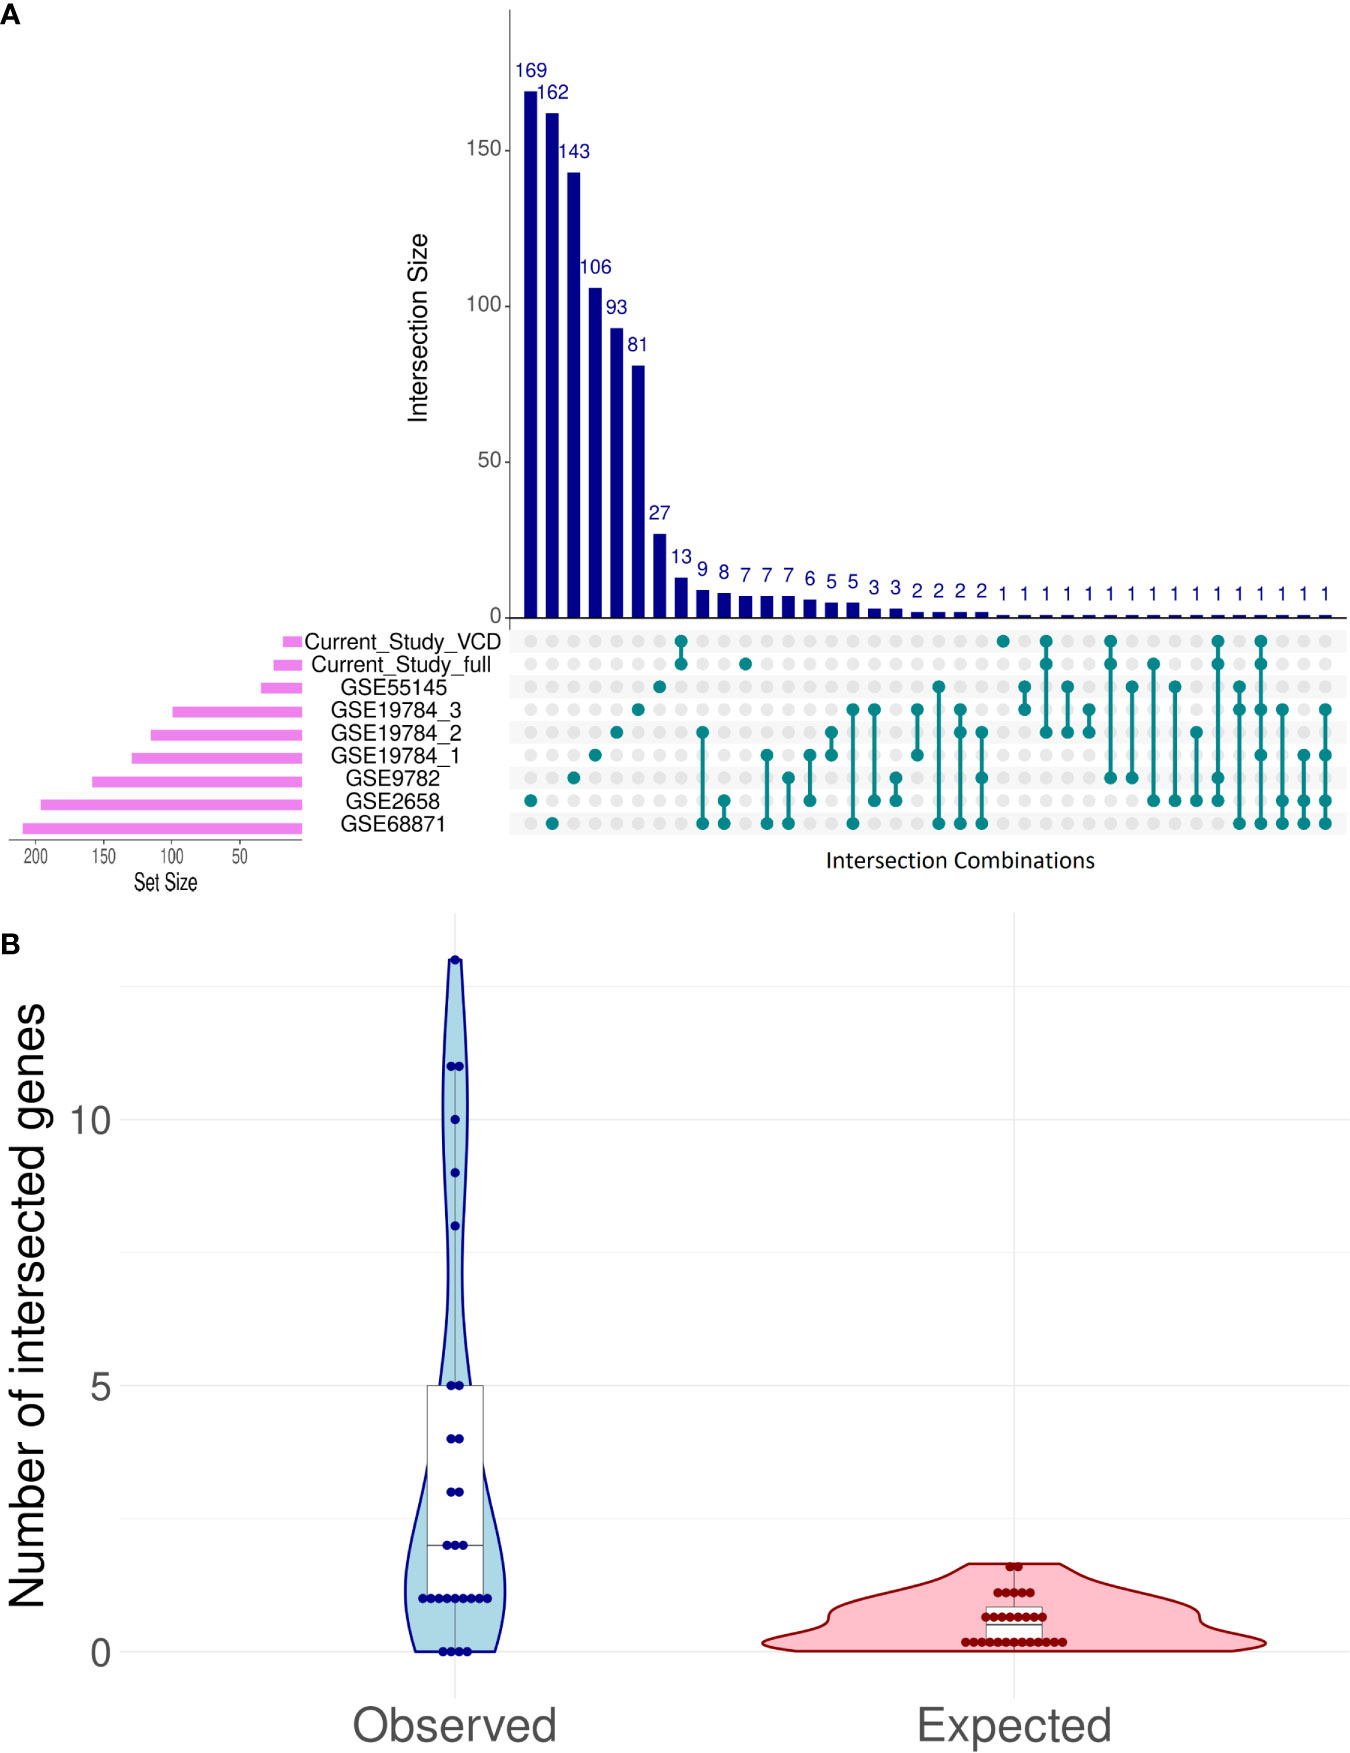
Figure 7 Intersection analysis for differentially expressed genes (DEG) distinguishing good and poor treatment responders in eight bortezomib MM datasets (A). Observed vs expected (under the hypothesis of random DEG distribution) numbers of intersection events in all possible pairwise comparisons (B).
The intersections between differential genes for all datasets were analyzed using UpSetR method (88); Figure 7A. To assess randomness of differential genes in the MM datasets, we used the following test. Differential gene sets for all MM datasets can form 7·8/2 = 28 pair intersections. For each of these paired intersections the number of observed intersected genes was calculated and compared with the random expectation model (Figure 7B). For random expectations, in each dataset we picked 1,000 times randomly the observed number of differential genes, and modeled all 28 possible intersections (Figure 7B).
The maximum similarities were observed between the datasets GSE68871 and GSE19784_1 (Jaccard coefficient J = 0.042), GSE68871 and GSE19784_2 (J = 0.037), GSE68871 and GSE1978_4 (J = 0.030), and GSE68871 and GSE2658 (J = 0.028); Supplementary Table 5.
Interestingly, we found several common differential genes in the current experimental RNAseq and in the previous microarray datasets (Table 6). All these common differential genes were overexpressed in the good vs poor treatment responders. Among them, the fibroblast growth factor receptor 3 gene (FGFR3) was found three times, and the transcription factor MAF gene was detected twice. Other differential genes (IGHA2, IGHV1-69, GRB14) were detected once. Among them, GRB14 was found only for the full (PAD+VCD) dataset, but not in the reduced VCD dataset. Other abovementioned differential genes were shared for the PAD + VCD and VCD datasets.
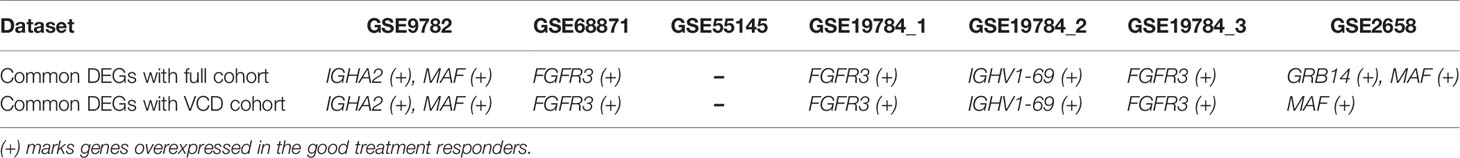
Table 6 Common differentially expressed genes (DEGs) in the current experimental dataset (full or VCD only cohorts) and in seven previously published MM datasets.
Four out of these five differential genes (FGFR3, MAF, IGHA2, IGHV1-69) are associated with translocation of immunoglobulin locus on 14q32 region that frequently occurs in MM (89), which clearly connects our results with the MM biology. Differential genes IGHA2 and IGHV1-69 are both located on the above 14q32 locus and encode for immunoglobulin heavy chain constant region alpha 2, and immunoglobulin heavy chain variable regions 1–69, respectively. To our knowledge, they were never associated before with bortezomib effectiveness in MM and in other tumors. We also found no known associations for GRB14 with MM.
Our results on FGFR3 are congruent with the previous findings. Fibroblast growth factor receptor 3 (FGFR3) is receptor tyrosine kinase which prevents apoptosis in MM cells and promotes adhesion to bone marrow stromal cells (90). It is overexpressed in ~20% of MM cases (91). High expression of FGFR3 was reported as the positive clinical response prognostic factor for bortezomib monotherapy (92), and for the bortezomib + thalidomide + dexamethasone (VTD) regimen (93). In parallel with FGFR3 activating mutations (94), it was also shown a factor mediating and positively correlating with bortezomib-related apoptosis in cultured MM (91) and lymphoma (95) cells. Interestingly, at the same time FGFR3 overexpression was reported as a negative factor for treatment with thalidomide, another targeted MM therapeutic (96).
However, for transcriptional factor MAF contradictory reports have been published that its expression is either positive (97), neutral (98–100) or negative (101) prognostic factor for response on bortezomib containing treatments. MAF is a transcriptional activator of many genes, including cyclinD2 and Integrin-β7 (102). Translocation of MAF into immunoglobulin locus is initiating oncogenic event in 5–10% of MM cases, and it was estimated to be up-regulated in 40–50% of all multiple myelomas (103, 104).
To further functionally characterize the differential gene sets, we performed Gene Ontology (GO) analysis (105), Supplementary Figure 3. We identified enrichment clusters only for four datasets investigated: for the current study, GSE9782, GSE19784_1, and GSE2658. Those clusters corresponded predominantly to the various immune cell-specific processes (Supplementary Figure 3).
We also considered 20 experimental MM cases treated with PAD regimen and found four differential genes between the good and poor responders (Supplementary Figure 2C), including gene SEZ6L2 which was common with the literature dataset GSE9782. We found no previous mentions of the association of this gene with MM.
Gene Expression Changes in MM After PAD/VCD Treatment
To our knowledge, MM gene expression profiles before and after relapse on PAD/VCD regimens had never been reported in the literature. For two MM patients included in this study, we were able to isolate CD138+ fraction of MM cells for the bone marrow biopsies taken after recurrence of the disease (Table 7). The patient 111 sequentially had four courses of first-line PAD and two courses of VCD chemotherapy regimens and showed partial response before relapse. In turn, the patient 115 also had four courses of first-line PAD and two courses of VCD chemotherapy regimens but demonstrated only minimal response before relapse (Supplementary Table 1).
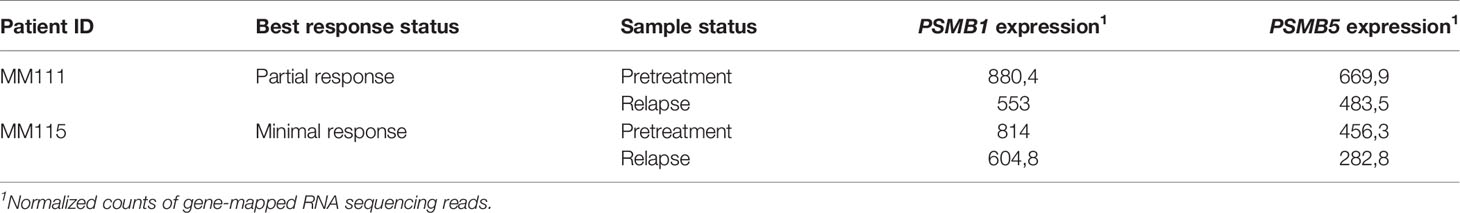
Table 7 Normalized expression levels of bortezomib targeting genes in MM patients before and after PAD/VCD treatment.
We compared expressions of bortezomib targeted genes in those patient biosamples before and after PAD/VCD treatment (Table 7). Interestingly, genes for both molecular targets of bortezomib (PSMB1, PSMB5) were downregulated after PAD/VCD treatment in both patients. This can represent tumor adaptation to the chemotherapy regimens used. However, it should be mentioned that those genes couldn’t serve as the bortezomib response prognostic biomarkers in all datasets investigated here (Supplementary Figure 1).
Data Availability Statement
The datasets presented in this study can be found in online repositories. The names of the repository/repositories and accession number(s) can be found in the article/Supplementary Material.
Ethics Statement
The studies involving human participants were reviewed and approved by the ethical committees of the Sechenov Moscow First Medical University, of the Clinical Center Vitamed (Moscow), and of the National Research Center for Hematology (Moscow, Russia). The patients/participants provided their written informed consent to participate in this study.
Author Contributions
NB, MSu, VS, AS, MN, NG, MSo, and AB contributed conception and design of the study. NG performed autopsies. MN, LM, and AS isolated and prepared blood tissue samples. MSu and XL performed molecular analyses. NB, MR, MSu, NG, MSo, AGu, AGa, VT, and AB analyzed the data. NB, MR, MSo, VS, and AB wrote the paper. All authors contributed to the article and approved the submitted version.
Funding
The study was supported by the Oncobox research program in oncology, by OmicsWay Corp., by Amazon and Microsoft Azure grants for cloud-based computational facilities, by Russian Foundation for Basic Research grant 19-29-01108 to AB (algorithmic implementation) and by Russian Scientific Foundation grant to MS 20-75-10071 (cancer RNA sequencing). The funder bodies were not involved in the study design, collection, analysis, interpretation of data, the writing of this article or the decision to submit it for publication.
Conflict of Interest
The AG, VT and MS were employed by Omicsway Corp. and Oncobox Ltd. AB was employed by Omicsway Corp.
The remaining authors declare that the research was conducted in the absence of any commercial or financial relationships that could be construed as a potential conflict of interest.
Supplementary Material
The Supplementary Material for this article can be found online at: https://www.frontiersin.org/articles/10.3389/fonc.2021.652063/full#supplementary-material
Supplementary Table 1 | Clinical information.
Supplementary Table 2 | Quality control metrics.
Supplementary Table 3 | Core marker genes for full MM cohort.
Supplementary Table 4 | Core marker genes for VCD MM cohort.
Supplementary Table 5 | Jaccard similarity, observed and expected (under the hypothesis of random DEG distribution) number of common DEGs between different pairs of datasets.
Supplementary Text 1 | FloWPS data trimming method.
Supplementary Figure 1 | Gene expression levels of target bortezomib genes PSMB1 and PSMB5. Gene expression levels in the cohorts of MM responders and poor responders to therapy. For every gene, paired t-test p-values and AUC values are shown. Each dot on the graph represents single MM sample. Grey indicates good treatment responders, black – poor responders.
Supplementary Figure 2 | Volcano pots for DEGs distinguishing good and poor responders in eight MM datasets: Current Study full (A) Current Study VCD (B) Current Study PAD (C) GSE9782 (D) GSE68871 (E) GSE55145 (F) GSE19784_1 (G) GSE19784_3 (H) GSE19784_3 (I) GSE2658 (J).
Supplementary Figure 3 | Gene Ontology enrichment analysis using the clusterProfile package (105) for the following datasets: Current Study full (A) Current Study VCD (B) GSE9782 (C) GSE19784_1 (D) and GSE2658 (E). Other datasets had no GO terms enriched with DEGs.
References
1. Raab MS, Podar K, Breitkreutz I, Richardson PG, Anderson KC. Multiple myeloma. Lancet (2009) 374:324–39. doi: 10.1016/S0140-6736(09)60221-X
2. Wang H, Naghavi M, Allen C, Barber RM, Carter A, Casey DC, et al. Global, regional, and national life expectancy, all-cause mortality, and cause-specific mortality for 249 causes of death, 1980–2015: a systematic analysis for the Global Burden of Disease Study 2015. Lancet (2016) 388:1459–544. doi: 10.1016/S0140-6736(16)31012-1
3. Vos T, Allen C, Arora M, Barber RM, Brown A, Carter A, et al. Global, regional, and national incidence, prevalence, and years lived with disability for 310 diseases and injuries, 1990–2015: a systematic analysis for the Global Burden of Disease Study 2015. Lancet (2016) 388:1545–602. doi: 10.1016/S0140-6736(16)31678-6
4. Maples KT, Joseph NS, Harvey RD. Current developments in the combination therapy of relapsed/refractory multiple myeloma. Expert Rev Anticancer Ther (2020) 20:1021–35. doi: 10.1080/14737140.2020.1828071
5. Poh C, Keegan T, Rosenberg AS. Second primary malignancies in multiple myeloma: A review. Blood Rev (2021) 46:100757. doi: 10.1016/j.blre.2020.100757
7. Sonneveld P, Schmidt-Wolf IGH, Van Der Holt B, El Jarari L, Bertsch U, Salwender H, et al. Bortezomib induction and maintenance treatment in patients with newly diagnosed multiple myeloma: Results of the randomized phase III HOVON-65/ GMMG-HD4 trial. J Clin Oncol (2012) 30:2946–55. doi: 10.1200/JCO.2011.39.6820
8. Kumar S, Flinn I, Richardson PG, Hari P, Callander N, Noga SJ, et al. Randomized, multicenter, phase 2 study (EVOLUTION) of combinations of bortezomib, dexamethasone, cyclophosphamide, and lenalidomide in previously untreated multiple myeloma. Blood (2012) 119:4375–82. doi: 10.1182/blood-2011-11-395749
9. Reeder CB, Reece DE, Kukreti V, Chen C, Trudel S, Hentz J, et al. Cyclophosphamide, bortezomib and dexamethasone induction for newly diagnosed multiple myeloma: High response rates in a phase II clinical trial. Leukemia (2009) 23:1337–41. doi: 10.1038/leu.2009.26
10. Jimenez Zepeda VH, Duggan P, Neri PE, Bahlis NJ. Cyclophosphamide, Bortezomib and Dexamethasone (CyBORD) Is a Feasible and Active Regimen for Non-Transplant Eligible Multiple Myeloma Patients. Blood (2014) 124:5751–1. doi: 10.1182/blood.v124.21.5751.5751
11. Punke AP, Waddell JA, Solimando DA. Lenalidomide, bortezomib, and dexamethasone (RVD) regimen for multiple myeloma. Hosp Pharm (2017) 52:27–32. doi: 10.1310/hpj5201-27
12. Durie BGM, Hoering A, Abidi MH, Rajkumar SV, Epstein J, Kahanic SP, et al. Bortezomib with lenalidomide and dexamethasone versus lenalidomide and dexamethasone alone in patients with newly diagnosed myeloma without intent for immediate autologous stem-cell transplant (SWOG S0777): a randomised, open-label, phase 3 trial. Lancet (2017) 389:519–27. doi: 10.1016/S0140-6736(16)31594-X
13. Voorhees PM, Kaufman JL, Laubach J, Sborov DW, Reeves B, Rodriguez C, et al. Daratumumab, lenalidomide, bortezomib, and dexamethasone for transplant-eligible newly diagnosed multiple myeloma: the GRIFFIN trial. Blood (2020) 136:936–45. doi: 10.1182/blood.2020005288
14. Moreau P, Avet-Loiseau H, Facon T, Attal M, Tiab M, Hulin C, et al. Bortezomib plus dexamethasone versus reduced-dose bortezomib, thalidomide plus dexamethasone as induction treatment before autologous stem cell transplantation in newly diagnosed multiple myeloma. Blood (2011) 118:5752–8. doi: 10.1182/blood-2011-05-355081
15. Yimer H, Melear J, Faber E, Bensinger WI, Burke JM, Narang M, et al. Daratumumab, bortezomib, cyclophosphamide and dexamethasone in newly diagnosed and relapsed multiple myeloma: LYRA study. Br J Haematol (2019) 185:492–502. doi: 10.1111/bjh.15806
16. Moreau P, Attal M, Hulin C, Arnulf B, Belhadj K, Benboubker L, et al. Bortezomib, thalidomide, and dexamethasone with or without daratumumab before and after autologous stem-cell transplantation for newly diagnosed multiple myeloma (CASSIOPEIA): a randomised, open-label, phase 3 study. Lancet (2019) 394:29–38. doi: 10.1016/S0140-6736(19)31240-1
17. Barlogie B, Anaissie E, Van Rhee F, Haessler J, Hollmig K, Pineda-Roman M, et al. Incorporating bortezomib into upfront treatment for multiple myeloma: Early results of total therapy 3. Br J Haematol (2007) 138:176–85. doi: 10.1111/j.1365-2141.2007.06639.x
18. Mateos MV, Dimopoulos MA, Cavo M, Suzuki K, Jakubowiak A, Knop S, et al. Daratumumab plus bortezomib, melphalan, and prednisone for untreated myeloma. N Engl J Med (2018) 378:518–28. doi: 10.1056/NEJMoa1714678
19. Niesvizky R, Flinn IW, Rifkin R, Gabrail N, Charu V, Clowney B, et al. Community-based phase IIIB trial of three UPFRONT bortezomib-based myeloma regimens. J Clin Oncol (2015) 33:3921–9. doi: 10.1200/JCO.2014.58.7618
20. Bonvini P, Zorzi E, Basso G, Rosolen A. Bortezomib-mediated 26S proteasome inhibition causes cell-cycle arrest and induces apoptosis in CD-30+ anaplastic large cell lymphoma [16]. Leukemia (2007) 21:838–42. doi: 10.1038/sj.leu.2404528
21. Maekawa K, Ri M, Nakajima M, Sekine A, Ueda R, Tohkin M, et al. Serum lipidomics for exploring biomarkers of bortezomib therapy in patients with multiple myeloma. Cancer Sci (2019) 110:3267–74. doi: 10.1111/cas.14178
22. Pancheri E, Guglielmi V, Wilczynski GM, Malatesta M, Tonin P, Tomelleri G, et al. Non-hematologic toxicity of bortezomib in multiple myeloma: The neuromuscular and cardiovascular adverse effects. Cancers (2020) 12:1–21. doi: 10.3390/cancers12092540
23. Borisov NM, Terekhanova NV, Aliper AM, Venkova LS, Smirnov PY, Roumiantsev S, et al. Signaling pathways activation profiles make better markers of cancer than expression of individual genes. Oncotarget (2014) 5:10198–205. doi: 10.18632/oncotarget.2548
24. Khagi Y, Kurzrock R, Patel SP. Next generation predictive biomarkers for immune checkpoint inhibition. Cancer Metastasis Rev (2017) 36:179–90. doi: 10.1007/s10555-016-9652-y
25. Mulligan G, Mitsiades C, Bryant B, Zhan F, Chng WJ, Roels S, et al. Gene expression profiling and correlation with outcome in clinical trials of the proteasome inhibitor bortezomib. Blood (2007) 109:3177–88. doi: 10.1182/blood-2006-09-044974
26. Tkachev V, Sorokin M, Borisov C, Garazha A, Buzdin A, Borisov N. Flexible data trimming improves performance of global machine learning methods in omics- based personalized oncology. Int J Mol Sci (2020) 21(3):713. doi: 10.3390/ijms21030713
27. Amin SB, Yip WK, Minvielle S, Broyl A, Li Y, Hanlon B, et al. Gene expression profile alone is inadequate in predicting complete response in multiple myeloma. Leukemia (2014) 28:2229–34. doi: 10.1038/leu.2014.140
28. Borisov N, Sorokin M, Tkachev V, Garazha A, Buzdin A. Cancer gene expression profiles associated with clinical outcomes to chemotherapy treatments. BMC Med Genomics (2020) 13:111. doi: 10.1186/s12920-020-00759-0
29. Terragna C, Remondini D, Martello M, Zamagni E, Pantani L, Patriarca F, et al. The genetic and genomic background of multiple myeloma patients achieving complete response after induction therapy with bortezomib, thalidomide and dexamethasone (VTD). Oncotarget (2016) 7:9666–79. doi: 10.18632/oncotarget.5718
30. Went M, Sud A, Speedy H, Sunter NJ, Försti A, Law PJ, et al. Genetic correlation between multiple myeloma and chronic lymphocytic leukaemia provides evidence for shared aetiology. Blood Cancer J (2018) 9:1. doi: 10.1038/s41408-018-0162-8
31. Went M, Sud A, Försti A, Halvarsson B-M, Weinhold N, Kimber S, et al. Identification of multiple risk loci and regulatory mechanisms influencing susceptibility to multiple myeloma. Nat Commun (2018) 9:3707. doi: 10.1038/s41467-018-04989-w
32. Ubels J, Sonneveld P, van Beers EH, Broijl A, van Vliet MH, de Ridder J. Predicting treatment benefit in multiple myeloma through simulation of alternative treatment effects. Nat Commun (2018) 9:2943. doi: 10.1038/s41467-018-05348-5
33. Hanamura I, Huang Y, Zhan F, Barlogie B, Shaughnessy J. Prognostic value of cyclin D2 mRNA expression in newly diagnosed multiple myeloma treated with high-dose chemotherapy and tandem autologous stem cell transplantations. Leukemia (2006) 20:1288–90. doi: 10.1038/sj.leu.2404253
34. Zhan F, Huang Y, Colla S, Stewart JP, Hanamura I, Gupta S, et al. The molecular classification of multiple myeloma. Blood (2006) 108:2020–8. doi: 10.1182/blood-2005-11-013458
35. Zhan F, Barlogie B, Arzoumanian V, Huang Y, Williams DR, Hollmig K, et al. Gene-expression signature of benign monoclonal gammopathy evident in multiple myeloma is linked to good prognosis. Blood (2007) 109:1692–700. doi: 10.1182/blood-2006-07-037077
36. Chen L, Wang S, Zhou Y, Wu X, Entin I, Epstein J, et al. Identification of early growth response protein 1 (EGR-1) as a novel target for JUN-induced apoptosis in multiple myeloma. Blood (2010) 115:61–70. doi: 10.1182/blood-2009-03-210526
37. Qiang Y-W, Ye S, Huang Y, Chen Y, Van Rhee F, Epstein J, et al. MAFb protein confers intrinsic resistance to proteasome inhibitors in multiple myeloma. BMC Cancer (2018) 18:724. doi: 10.1186/s12885-018-4602-4
38. Papanikolaou X, Alapat D, Rosenthal A, Stein C, Epstein J, Owens R, et al. The flow cytometry-defined light chain cytoplasmic immunoglobulin index and an associated 12-gene expression signature are independent prognostic factors in multiple myeloma. Leukemia (2015) 29:1713–20. doi: 10.1038/leu.2015.65
39. Bam R, Ling W, Khan S, Pennisi A, Venkateshaiah SU, Li X, et al. Role of Bruton’s tyrosine kinase in myeloma cell migration and induction of bone disease. Am J Hematol (2013) 88:463–71. doi: 10.1002/ajh.23433
40. Xiong W, Wu X, Starnes S, Johnson SK, Haessler J, Wang S, et al. An analysis of the clinical and biologic significance of TP53 loss and the identification of potential novel transcriptional targets of TP53 in multiple myeloma. Blood (2008) 112:4235–46. doi: 10.1182/blood-2007-10-119123
41. Broyl A, Hose D, Lokhorst H, de Knegt Y, Peeters J, Jauch A, et al. Gene expression profiling for molecular classification of multiple myeloma in newly diagnosed patients. Blood (2010) 116:2543–53. doi: 10.1182/blood-2009-12-261032
42. Chattopadhyay S, Thomsen H, Yadav P, da Silva Filho MI, Weinhold N, Nöthen MM, et al. Genome-wide interaction and pathway-based identification of key regulators in multiple myeloma. Commun Biol (2019) 2:89. doi: 10.1038/s42003-019-0329-2
43. Meißner T, Seckinger A, Hemminki K, Bertsch U, Foersti A, Haenel M, et al. Profound impact of sample processing delay on gene expression of multiple myeloma plasma cells. BMC Med Genomics (2015) 8:85. doi: 10.1186/s12920-015-0161-6
44. Mitchell JS, Li N, Weinhold N, Försti A, Ali M, van Duin M, et al. Genome-wide association study identifies multiple susceptibility loci for multiple myeloma. Nat Commun (2016) 7:12050. doi: 10.1038/ncomms12050
45. Tacar O, Sriamornsak P, Dass CR. Doxorubicin: An update on anticancer molecular action, toxicity and novel drug delivery systems. J Pharm Pharmacol (2013) 65:157–70. doi: 10.1111/j.2042-7158.2012.01567.x
46. Emadi A, Jones RJ, Brodsky RA. Cyclophosphamide and cancer: Golden anniversary. Nat Rev Clin Oncol (2009) 6:638–47. doi: 10.1038/nrclinonc.2009.146
47. Suntsova M, Gaifullin N, Allina D, Reshetun A, Li X, Mendeleeva L, et al. Atlas of RNA sequencing profiles for normal human tissues. Sci Data (2019) 6:36. doi: 10.1038/s41597-019-0043-4
48. Tkachev V, Sorokin M, Mescheryakov A, Simonov A, Garazha A, Buzdin A, et al. FLOating-Window Projective Separator (FloWPS): A Data Trimming Tool for Support Vector Machines (SVM) to Improve Robustness of the Classifier. Front Genet (2019) 9:717. doi: 10.3389/fgene.2018.00717
49. Borisov N, Buzdin A. New Paradigm of Machine Learning (ML) in Personalized Oncology: Data Trimming for Squeezing More Biomarkers From Clinical Datasets. Front Oncol (2019) 9:658. doi: 10.3389/fonc.2019.00658
50. Bartlett P, Shawe-taylor J. Generalization Performance of Support Vector Machines and Other Pattern Classifiers. In: Advances in Kernel Methods: Support Vector Learning. Cambridge, MA: The MIT Press (1999). p. 43–54.
51. Love MI, Huber W, Anders S. Moderated estimation of fold change and dispersion for RNA-seq data with DESeq2. Genome Biol (2014) 15:550. doi: 10.1186/s13059-014-0550-8
52. Minsky M, Papert SA. Perceptrons. In: . Expanded Edition: An Introduction to Computational Geometry. MA: MIT press Boston (1987).
53. Yuan Y, Shi Y, Li C, Kim J, Cai W, Han Z, et al. DeepGene: an advanced cancer type classifier based on deep learning and somatic point mutations. BMC Bioinformatics (2016) 17:476. doi: 10.1186/s12859-016-1334-9
54. Yuan Y, Shi Y, Su X, Zou X, Luo Q, Feng DD, et al. Cancer type prediction based on copy number aberration and chromatin 3D structure with convolutional neural networks. BMC Genomics (2018) 19:565. doi: 10.1186/s12864-018-4919-z
55. Huang Z, Johnson TS, Han Z, Helm B, Cao S, Zhang C, et al. Deep learning-based cancer survival prognosis from RNA-seq data: approaches and evaluations. BMC Med Genomics (2020) 13:41. doi: 10.1186/s12920-020-0686-1
56. Pedregosa F, Varoquaux G, Gramfort A, Michel V, Thirion B, Grisel O, et al. Scikit-learn: Machine learning in Python. J Mach Learn Res (2011) 12:2825–30.
57. Boratyn GM, Thierry-Mieg J, Thierry-Mieg D, Busby B, Madden TL. Magic-BLAST, an accurate RNA-seq aligner for long and short reads. BMC Bioinformatics (2019) 20:405. doi: 10.1186/s12859-019-2996-x
58. Boyd JC. Mathematical tools for demonstrating the clinical usefulness of biochemical markers. Scand J Clin Lab Invest Suppl (1997) 227:46–63. doi: 10.1080/00365519709168308
59. Chen L, Zhou Y, Tang X, Yang C, Tian Y, Xie R, et al. EGFR mutation decreases FDG uptake in non-small cell lung cancer via the NOX4/ROS/GLUT1 axis. Int J Oncol (2019) 54:370–80. doi: 10.3892/ijo.2018.4626
60. Liu T, Cheng G, Kang X, Xi Y, Zhu Y, Wang K, et al. Noninvasively evaluating the grading and IDH1 mutation status of diffuse gliomas by three-dimensional pseudo-continuous arterial spin labeling and diffusion-weighted imaging. Neuroradiology (2018) 60:693–702. doi: 10.1007/s00234-018-2021-5
61. Tanioka M, Fan C, Parker JS, Hoadley KA, Hu Z, Li Y, et al. Integrated Analysis of RNA and DNA from the Phase III Trial CALGB 40601 Identifies Predictors of Response to Trastuzumab-Based Neoadjuvant Chemotherapy in HER2-Positive Breast Cancer. Clin Cancer Res (2018) 24:5292–304. doi: 10.1158/1078-0432.CCR-17-3431
62. Zolotovskaia MA, Sorokin MI, Roumiantsev SA, Borisov NM, Buzdin AA. Pathway Instability Is an Effective New Mutation-Based Type of Cancer Biomarkers. Front Oncol (2018) 8:658. doi: 10.3389/fonc.2018.00658
63. Yates B, Braschi B, Gray KA, Seal RL, Tweedie S, Bruford EA. Genenames.org: the HGNC and VGNC resources in 2017. Nucleic Acids Res (2017) 45:D619–25. doi: 10.1093/nar/gkw1033
65. Engqvist H, Parris TZ, Kovács A, Rönnerman EW, Sundfeldt K, Karlsson P, et al. Validation of Novel Prognostic Biomarkers for Early-Stage Clear-Cell, Endometrioid and Mucinous Ovarian Carcinomas Using Immunohistochemistry. Front Oncol (2020) 10:162. doi: 10.3389/fonc.2020.00162
66. Jeong G, Bae H, Jeong D, Ham J, Park S, Kim HW, et al. Kelch domain-containing KLHDC7B and a long non-coding RNA ST8SIA6-AS1 act oppositely on breast cancer cell proliferation via the interferon signaling pathway. Sci Rep (2018) 8(1):12922. doi: 10.1038/s41598-018-31306-8
67. Martín-Pardillos A, Ramón Y Cajal S. Characterization of Kelch domain-containing protein 7B in breast tumours and breast cancer cell lines. Oncol Lett (2019) 18:2853–60. doi: 10.3892/ol.2019.10672
68. Beltrán-Anaya FO, Romero-Córdoba S, Rebollar-Vega R, Arrieta O, Bautista-Piña V, Dominguez-Reyes C, et al. Expression of long non-coding RNA ENSG00000226738 (LncKLHDC7B) is enriched in the immunomodulatory triple-negative breast cancer subtype and its alteration promotes cell migration, invasion, and resistance to cell death. Mol Oncol (2019) 13:909–27. doi: 10.1002/1878-0261.12446
69. Zhang G, Fan E, Yue G, Zhong Q, Shuai Y, Wu M, et al. Five genes as a novel signature for predicting the prognosis of patients with laryngeal cancer. J Cell Biochem (2020) 121:3804–13. doi: 10.1002/jcb.29535
70. Zong L, Hattori N, Yoda Y, Yamashita S, Takeshima H, Takahashi T, et al. Establishment of a DNA methylation marker to evaluate cancer cell fraction in gastric cancer. Gastric Cancer (2016) 19:361–9. doi: 10.1007/s10120-015-0475-2
71. Mishima C, Kagara N, Matsui S, Tanei T, Naoi Y, Shimoda M, et al. Promoter methylation of TRIM9 as a marker for detection of circulating tumor DNA in breast cancer patients. SpringerPlus (2015) 4:635. doi: 10.1186/s40064-015-1423-7
72. Altman NS. An Introduction to Kernel and Nearest-Neighbor Nonparametric Regression. Am Statist (1992) 46:175. doi: 10.2307/2685209
73. Osuna E, Freund R, Girosi F. Improved training algorithm for support vector machines. In: Neural Networks for Signal Processing. Proceedings of the IEEE Workshop. New York: IEEE. (1997) p. 276–85. doi: 10.1109/nnsp.1997.622408
74. Robin X, Turck N, Hainard A, Lisacek F, Sanchez J-C, Müller M. Bioinformatics for protein biomarker panel classification: what is needed to bring biomarker panels into in vitro diagnostics? Expert Rev Proteomics (2009) 6:675–89. doi: 10.1586/epr.09.83
75. Toloşi L, Lengauer T. Classification with correlated features: Unreliability of feature ranking and solutions. Bioinformatics (2011) 27:1986–94. doi: 10.1093/bioinformatics/btr300
76. Tikhonov AN, Arsenin VY. Solutions of ill-posed problems. Scripta series in mathematics. Hoboken, NJ: John Wiley & Sons Inc (1977).
77. Webb GI, Boughton JR, Wang Z. Not So Naive Bayes: Aggregating One-Dependence Estimators. Mach Learn (2005) 58:5–24. doi: 10.1007/s10994-005-4258-6
78. Prados J, Kalousis A, Sanchez J-C, Allard L, Carrette O, Hilario M. Mining mass spectra for diagnosis and biomarker discovery of cerebral accidents. PROTEOMICS (2004) 4:2320–32. doi: 10.1002/pmic.200400857
79. Anderson KC, Alsina M, Bensinger W, Biermann JS, Cohen AD, Devine S, et al. Multiple Myeloma, Version 1.2013. J Natl Compr Canc Netw (2013) 11:11–7. doi: 10.6004/jnccn.2013.0004
80. Buzdin A, Sorokin M, Garazha A, Glusker A, Aleshin A, Poddubskaya E, et al. RNA sequencing for research and diagnostics in clinical oncology. Semin Cancer Biol (2019) 60:311–23. doi: 10.1016/j.semcancer.2019.07.010
81. Decaux O, Lodé L, Magrangeas F, Charbonnel C, Gouraud W, Jézéquel P, et al. Prediction of Survival in Multiple Myeloma Based on Gene Expression Profiles Reveals Cell Cycle and Chromosomal Instability Signatures in High-Risk Patients and Hyperdiploid Signatures in Low-Risk Patients: A Study of the Intergroupe Francophone du Myélome. JCO (2008) 26:4798–805. doi: 10.1200/JCO.2007.13.8545
82. Harousseau J-L, Shaughnessy J, Richardson P. Multiple Myeloma. Hematology (2004) 2004:237–56. doi: 10.1182/asheducation-2004.1.237
83. Turki T, Wang JTL. Clinical intelligence: New machine learning techniques for predicting clinical drug response. Comput Biol Med (2019) 107:302–22. doi: 10.1016/j.compbiomed.2018.12.017
84. Turki T, Wei Z. A link prediction approach to cancer drug sensitivity prediction. BMC Syst Biol (2017) 11(Suppl 5):94. doi: 10.1186/s12918-017-0463-8
85. Turki T, Wei Z. Learning approaches to improve prediction of drug sensitivity in breast cancer patients. In: 2016 38th Annual International Conference of the IEEE Engineering In Medicine and Biology Society (EMBC). Orlando, FL, USA: IEEE. (2016) pp. 3314–20. doi: 10.1109/EMBC.2016.7591437
86. Turki T, Wei Z, Wang JTL. Transfer Learning Approaches to Improve Drug Sensitivity Prediction in Multiple Myeloma Patients. IEEE Access (2017) 5:7381–93. doi: 10.1109/ACCESS.2017.2696523
87. Turki T, Wei Z, Wang JTL. A transfer learning approach via procrustes analysis and mean shift for cancer drug sensitivity prediction. J Bioinform Comput Biol (2018) 16:1840014. doi: 10.1142/S0219720018400140
88. Conway JR, Lex A, Gehlenborg N. UpSetR: an R package for the visualization of intersecting sets and their properties. Bioinformatics (2017) 33:2938–40. doi: 10.1093/bioinformatics/btx364
89. Chesi M, Bergsagel PL. Molecular pathogenesis of multiple myeloma: basic and clinical updates. Int J Hematol (2013) 97:313–23. doi: 10.1007/s12185-013-1291-2
90. Bisping G, Wenning D, Kropff M, Gustavus D, Müller-Tidow C, Stelljes M, et al. Bortezomib, dexamethasone, and fibroblast growth factor receptor 3-specific tyrosine kinase inhibitor in t(4;14) myeloma. Clin Cancer Res (2009) 15:520–31. doi: 10.1158/1078-0432.CCR-08-1612
91. Guan M, Zhu L, Somlo G, Hughes A, Zhou B, Yen Y. Bortezomib therapeutic effect is associated with expression of FGFR3 in multiple myeloma cells. Anticancer Res (2009) 29:1–9.
92. Pineda-Roman M, Zangari M, Haessler J, Anaissie E, Tricot G, van Rhee F, et al. Sustained complete remissions in multiple myeloma linked to bortezomib in total therapy 3: comparison with total therapy 2. Br J Haematol (2008) 140:625–34. doi: 10.1111/j.1365-2141.2007.06921.x
93. Pineda-Roman M, Zangari M, van Rhee F, Anaissie E, Szymonifka J, Hoering A, et al. VTD combination therapy with bortezomib-thalidomide-dexamethasone is highly effective in advanced and refractory multiple myeloma. Leukemia (2008) 22:1419–27. doi: 10.1038/leu.2008.99
94. Otsuka M, Mizuki M, Fujita J, Kang S, Kanakura Y. Constitutively active FGFR3 with Lys650Glu mutation enhances bortezomib sensitivity in plasma cell malignancy. Anticancer Res (2011) 31:113–22.
95. Zheng W, Guan M, Zhu L, Cai Z, Chung V, Huang H, et al. Bortezomib therapeutic effect is associated with expression and mutation of FGFR3 in human lymphoma cells. Anticancer Res (2010) 30:1921–30.
96. Ho PJ, Brown RD, Spencer A, Jeffels M, Daniher D, Gibson J, et al. Thalidomide consolidation improves progression-free survival in myeloma with normal but not up-regulated expression of fibroblast growth factor receptor 3: analysis from the Australasian Leukaemia and Lymphoma Group MM6 clinical trial. Leuk Lymphoma (2012) 53:1728–34. doi: 10.3109/10428194.2012.664842
97. Inagaki A, Tajima E, Uranishi M, Totani H, Asao Y, Ogura H, et al. Global real-time quantitative reverse transcription-polymerase chain reaction detecting proto-oncogenes associated with 14q32 chromosomal translocation as a valuable marker for predicting survival in multiple myeloma. Leuk Res (2013) 37:1648–55. doi: 10.1016/j.leukres.2013.09.026
98. Wang Y, Li Q, Xing S, Zhang H, Li D. Clinical Characteristics and Prognosis of MAF Deletion in Chinese Patients With Multiple Myeloma. Clin Lymphoma Myeloma Leuk (2019) 19:e545–50. doi: 10.1016/j.clml.2019.05.016
99. Weinhold N, Heuck CJ, Rosenthal A, Thanendrarajan S, Stein CK, Van Rhee F, et al. Clinical value of molecular subtyping multiple myeloma using gene expression profiling. Leukemia (2016) 30:423–30. doi: 10.1038/leu.2015.309
100. Wei G, Wang L, Yang H, Han X, Zheng G, Zheng W, et al. Clinical implications of c-maf expression in plasma cells from patients with multiple myeloma. Exp Hematol Oncol (2017) 6:16. doi: 10.1186/s40164-017-0076-3
101. Nair B, van Rhee F, Shaughnessy JD, Anaissie E, Szymonifka J, Hoering A, et al. Superior results of Total Therapy 3 (2003-33) in gene expression profiling-defined low-risk multiple myeloma confirmed in subsequent trial 2006-66 with VRD maintenance. Blood (2010) 115:4168–73. doi: 10.1182/blood-2009-11-255620
102. Neri P, Ren L, Azab AK, Brentnall M, Gratton K, Klimowicz AC, et al. Integrin β7-mediated regulation of multiple myeloma cell adhesion, migration, and invasion. Blood (2011) 117:6202–13. doi: 10.1182/blood-2010-06-292243
103. Annunziata CM, Hernandez L, Davis RE, Zingone A, Lamy L, Lam LT, et al. A mechanistic rationale for MEK inhibitor therapy in myeloma based on blockade of MAF oncogene expression. Blood (2011) 117:2396–404. doi: 10.1182/blood-2010-04-278788
104. Herath NI, Rocques N, Garancher A, Eychène A, Pouponnot C. GSK3-mediated MAF phosphorylation in multiple myeloma as a potential therapeutic target. Blood Cancer J (2014) 4:e175. doi: 10.1038/bcj.2013.67
Keywords: multiple myeloma, bortezomib, gene expression, machine learning, treatment response, fibroblast growth factor receptor 3, PAD, VCD
Citation: Borisov N, Sergeeva A, Suntsova M, Raevskiy M, Gaifullin N, Mendeleeva L, Gudkov A, Nareiko M, Garazha A, Tkachev V, Li X, Sorokin M, Surin V and Buzdin A (2021) Machine Learning Applicability for Classification of PAD/VCD Chemotherapy Response Using 53 Multiple Myeloma RNA Sequencing Profiles. Front. Oncol. 11:652063. doi: 10.3389/fonc.2021.652063
Received: 11 January 2021; Accepted: 19 March 2021;
Published: 15 April 2021.
Edited by:
Jiayi Wang, Shanghai Jiaotong University, ChinaReviewed by:
Yi Shi, Shanghai Jiao Tong University, ChinaXiao Zhang, Shanghai Jiaotong University, China
Copyright © 2021 Borisov, Sergeeva, Suntsova, Raevskiy, Gaifullin, Mendeleeva, Gudkov, Nareiko, Garazha, Tkachev, Li, Sorokin, Surin and Buzdin. This is an open-access article distributed under the terms of the Creative Commons Attribution License (CC BY). The use, distribution or reproduction in other forums is permitted, provided the original author(s) and the copyright owner(s) are credited and that the original publication in this journal is cited, in accordance with accepted academic practice. No use, distribution or reproduction is permitted which does not comply with these terms.
*Correspondence: Anton Buzdin, buzdin@oncobox.com