 Xin Wu†
 Wenjie Xie
 Binbin Gong
 Bin Fu
 Libo Zhou
 Lianmin Luo
- Department of Urology, The First Affiliated Hospital of Nanchang University, Nanchang, Jiangxi, China
Background: Transforming growth factor (TGF)-β signaling is strongly related to the development and progression of tumor. We aimed to construct a prognostic gene signature based on TGF-β signaling-related genes for predicting clinical prognosis and immunotherapy responses of patients with clear cell renal cell carcinoma (ccRCC).
Methods: The gene expression profiles and corresponding clinical information of ccRCC were collected from the TCGA and the ArrayExpress (E-MTAB-1980) databases. LASSO, univariate and multivariate Cox regression analyses were conducted to construct a prognostic signature in the TCGA cohort. The E-MTAB-1980 cohort were used for validation. Kaplan-Meier (K-M) survival and time-dependent receiver operating characteristic (ROC) were conducted to assess effectiveness and reliability of the signature. The differences in gene enrichments, immune cell infiltration, and expression of immune checkpoints in ccRCC patients showing different risks were investigated.
Results: We constructed a seven gene (PML, CDKN2B, COL1A2, CHRDL1, HPGD, CGN and TGFBR3) signature, which divided the ccRCC patients into high risk group and low risk group. The K-M analysis indicated that patients in the high risk group had a significantly shorter overall survival (OS) time than that in the low risk group in the TCGA (p < 0.001) and E-MTAB-1980 (p = 0.012). The AUC of the signature reached 0.77 at 1 year, 0.7 at 3 years, and 0.71 at 5 years in the TCGA, respectively, and reached 0.69 at 1 year, 0.72 at 3 years, and 0.75 at 5 years in the E-MTAB-1980, respectively. Further analyses confirmed the risk score as an independent prognostic factor for ccRCC (p < 0.001). The results of ssGSEA that immune cell infiltration degree and the scores of immune-related functions were significantly increased in the high risk group. The CIBERSORT analysis indicated that the abundance of immune cell were significantly different between two risk groups. Furthermore, The risk score was positively related to the expression of PD-1, CTLA4 and LAG3.These results indicated that patients in the high risk group benefit more from immunotherapy.
Conclusion: We constructed a novel TGF-β signaling-related genes signature that could serve as an promising independent factor for predicting clinical prognosis and immunotherapy responses in ccRCC patients.
Introduction
Renal cell carcinoma (RCC) ranked third in aspect of new cases of the genitourinary cancer, and its mortality rate also ranked third among genitourinary cancer. In 2020, there were approximately 431,288 newly diagnosed cases and 179,368 deaths in the world (1). Clear cell renal cell carcinoma (ccRCC) is the most frequently diagnosed histologic type, accounting for approximately 80% of primary RCC (2). At present, the main treatment for localized ccRCC are nephrectomy partially and radically and show favorable efficacy. However, approximately 20-30% of patients are advanced RCC at first visit, with extremely poor overall prognosis (3). Moreover, 20-30% of diagnosed RCC with T1-2 stage would experience tumor metastasis within 1 to 2 years after surgery (4). In recent years, the clinical treatment strategies for advanced ccRCC has evolved greatly, with the emergence of molecule targeted therapy and immune checkpoint therapy (5, 6). In addition, there remains a significant number of the patients with no response or resistance to molecule targeted therapy or immune checkpoint therapy (7, 8). Indeed, it is a huge challenge of clinical work to identify risk stratification in ccRCC patients and optimize individualized therapeutic strategies. Some studies indicated that prognostic models can be used for optimizing risk stratification, providing more accurate clinical treatment and predicting clinical outcome (9, 10). Therefore, identification of reliable prognostic models are especially important to predict clinical outcome and better guide the treatment for ccRCC.
The transforming growth factor (TGF)-β signaling pathway induces a dual role during the development of tumorigenesis. In early stage tumors, TGF-β signaling pathway could induce cell arrest and promote apoptosis, thus serving as a tumor-suppressor. In contrast, in advanced cancer, TGF-β signaling pathway activation could promote tumor progression through inducing cancer cell migration, invasion, epithelial-mesenchymal transition (EMT), and chemical resistance, thus acting as a carcinogenesis factor (11, 12). Several studies have reported that targeting TGF-β pathway could inhibit ccRCC invasion and metastasis in vitro and vivo (13, 14). In recent years, with the increasing development of bioinformatics, the use of TGF-β signaling pathway-related genes signature as biomarker and prognostic models in malignant tumor has attracted wide attention. Liao et al. established 8-gene signature as a risk model based on TGF-β signaling pathway-related genes to predict prognosis and immunotherapy of liver hepatocellular carcinoma (15). In addition, Yu et al. developed a 5-gene prognostic model based on TGF-β signaling-related genes to evaluate the clinical outcomes, immunotherapy response and targeted therapy of lung adenocarcinoma (16). However, the TGF-β signaling pathway-related genes prognostic model for ccRCC is still lacking and needs to be further addressed.
In this study, TGF-β signaling-related genes were used to investigate the clinical value of these genes expression profile in ccRCC. A novel risk model based on TGF-β signaling-related genes was constructed using TCGA database and validated in the E-MTAB-1980 database. Then, the risk model effectively divided ccRCC patients into high risk and low risk groups. Overall survival (OS) time was significantly reduced in the high risk group than in the low risk group. Moreover, we investigated the differences between different risk groups among clinicopathological features, immune cell infiltration, and expression of immune checkpoints.
Material and methods
The flow chart of our study is presented in Figure 1.
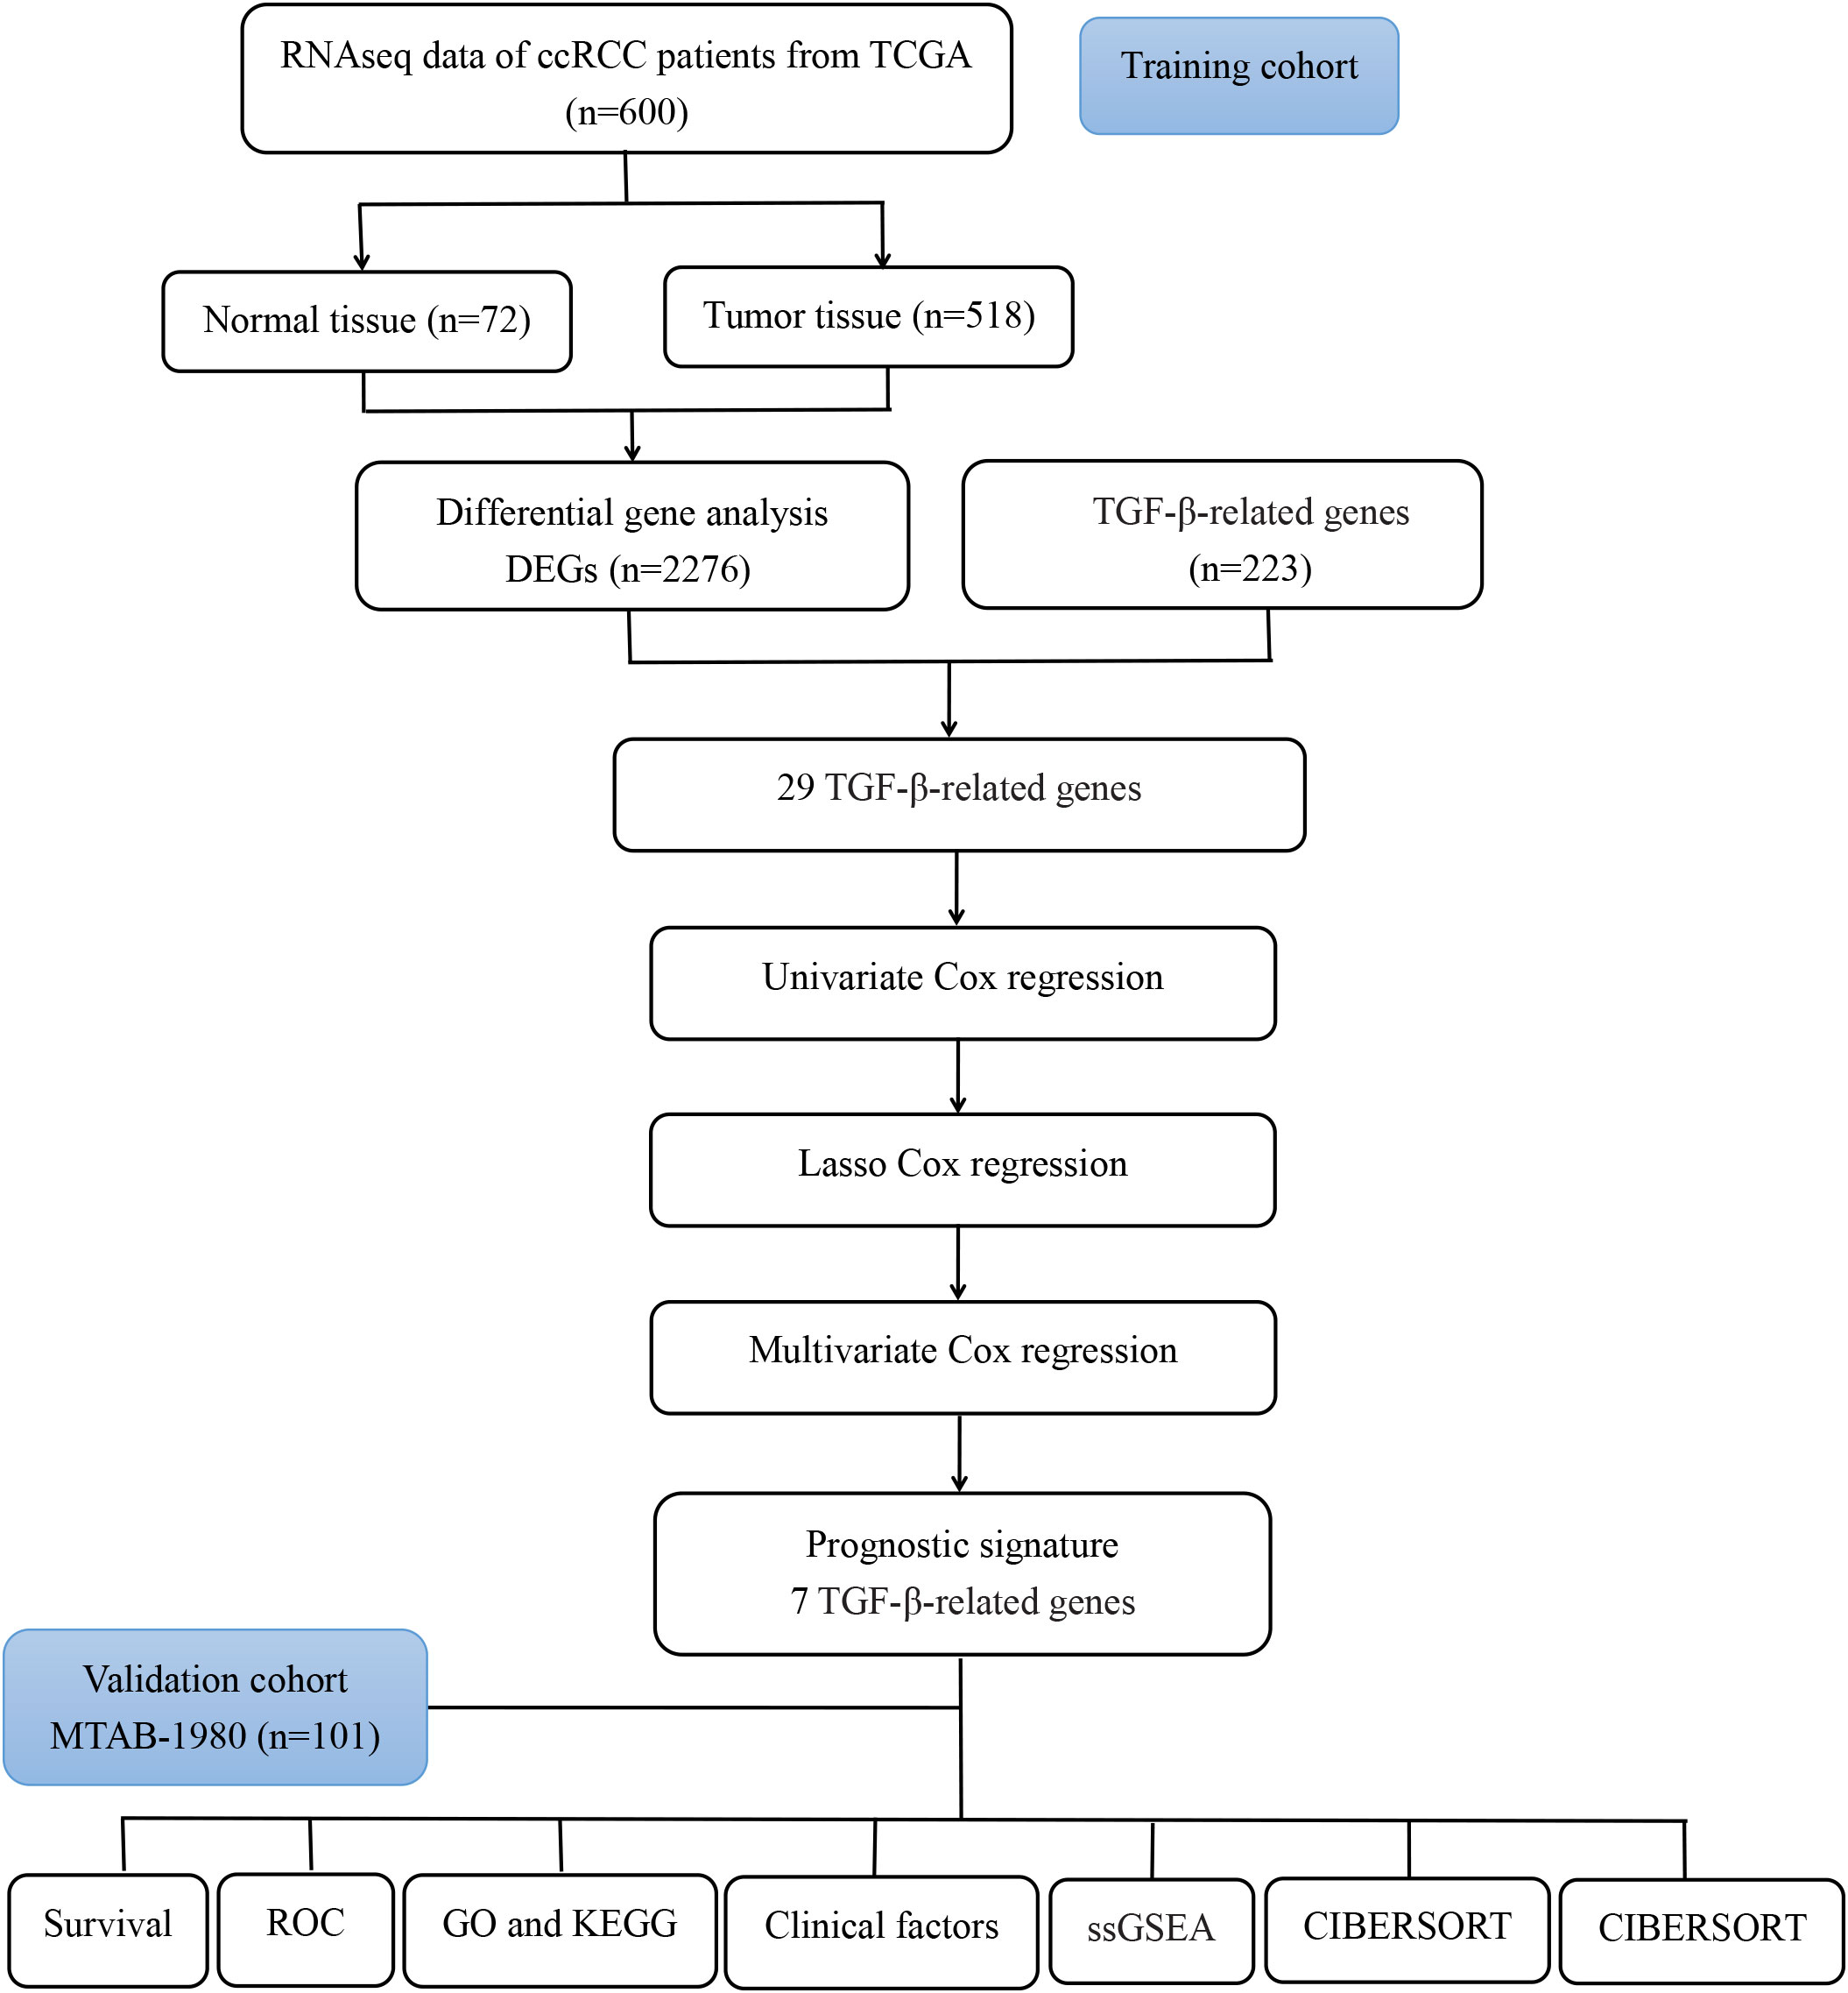
Figure 1 Flow chart of the analysis process in our study.
Data acquisition
For training cohort, RNA expression data of ccRCC and the corresponding clinical data were collected from TCGA (https://genomecancer.ucsc.edu). For validation cohort, E-MTAB-1980 dataset was collected from ArrayExpress database (https://www.ebi.ac.uk/arrayexpress/). For clinical data, patients who survived less than one month were excluded for subsequent study.
Identification of TGF-β signaling-related genes
Currently, TGF-β signaling-related genes is lack of comprehensive summary. Thus, TGF-β signaling-related genes were systematically searched from the following databases: AmiGO 2 (http://amigo.geneontology.org/amigo/landing), Ensembl Genome Brower (http://grch37.ensembl.org/index.html) and GSEA (http://www.gsea-msigdb.org/gsea/index.jsp). Finally, a total of 223 TGF-β signaling-related genes were identified in this study (Supplementary Table 1).
Screening for TGF-β signaling-related differentially expressed genes
The Package “limma” was applied to find TGF-β signaling-related differentially expressed genes (DEGs) between tumor tissues and normal tissues according to the threshold set at |log2FC| > 1 and adjusted P < 0.05.
Prognostic gene signature construction and validation
Firstly, we preliminarily determined the TGF-β signaling-related genes affecting OS in TCGA database by univariate Cox analysis. Then, the prognostic genes get from univariate Cox analysis were identified with the Least Absolute Shrinkage and Selection Operator (LASSO) regression in order to avoid overfitting. After that, the candidate genes identified from LASSO analysis were further determined by multivariate Cox regression analysis in order to develop prediction model. The risk model was established based on the following equation: risk score =βmRNA1×ExpressionmRNA1+βmRNA2×ExpressionmRNA2+βmRNA3×ExpressionmRNA3+…+ βmRNAn×ExpressionmRNAn.
Next, the risk score of patients was obtained, and patients were assigned to high risk group and low risk group according to the medium value of risk score. K-M method was used to determine the difference of OS between high risk and low risk groups. Finally, ROC curve analysis was used to identify the effectiveness of the risk model.
Development and evaluation of a predictive nomogram
Based on TGF-β risk score and clinicopathologic features, the univariate and multivariate Cox regression analyses were performed to identify the independent prognostic factors. Then, we integrated the independent prognostic factors to develop a comprehensive nomogram. Furthermore, the effectiveness performance of the nomogram was assessed by calibration curves with “rms” R package.
Comprehensive analysis of the prognostic model
The relationship between the risk score and clinicopathological features were determined to further evaluate the statistical performance of the prognostic model during the ccRCC development.
GO and KEGG enrichment analysis
Based on the threshold set at |log2FC| > 0.8 and adjusted P < 0.05, the Package “limma” was used to identify the risk score-related DEGs. Gene Ontology (GO) analysis and Kyoto Encyclopedia of Genes and Genomes (KEGG) pathway analysis were applied for investigating the biological function of DEGs.
Evaluation of tumor immune microenvironment
To investigate the difference of infiltrating score between high risk and low risk groups, the single-sample gene set enrichment analysis (ssGSEA) was used to calculate the infiltrating scores of 16 immune cells and 13 immune-related pathways. Then, CIBERSORT algorithm was used to assess the relevance among risk score and 22 immune cells abundance. Subsequently, the differences in expression of immune checkpoints, including PD-1, PD-L1, CTLA4 and LAG3, in ccRCC patients showing different risks were investigated.
Statistical analysis
All statistical analyses and graphing were performed with the R software (version R-4.1.2) or GraphPad Prism (version 8.0.2). The Student’s t test was adopted to investigate the differences in gene expression between tumor tissues and normal tissues. Spearman correlation analysis was applied to evaluate the relevance between the risk score and the expression of immune checkpoints. P value < 0.05 was considered significant. P values were showed as: ns, not significant; *, P< 0.05; **,P< 0.01; ***, P< 0.001.
Results
Screening of prognostic TGF-β signaling-related genes of ccRCC in the TCGA cohort
We summarized the flow diagram of this study in Figure 1. Among 223 TGF-β signaling-related genes, 29 DEGs were screened in tumor tissues and tumor-adjacent tissues (Figures 2A, B). The univariate Cox regression method suggested that 16 of the 29 genes were significantly associated with OS (Figure 2C). These 16 TGF-β signaling-related genes were uploaded to STRING to better visualize the interaction network among these genes (Figure 2D).
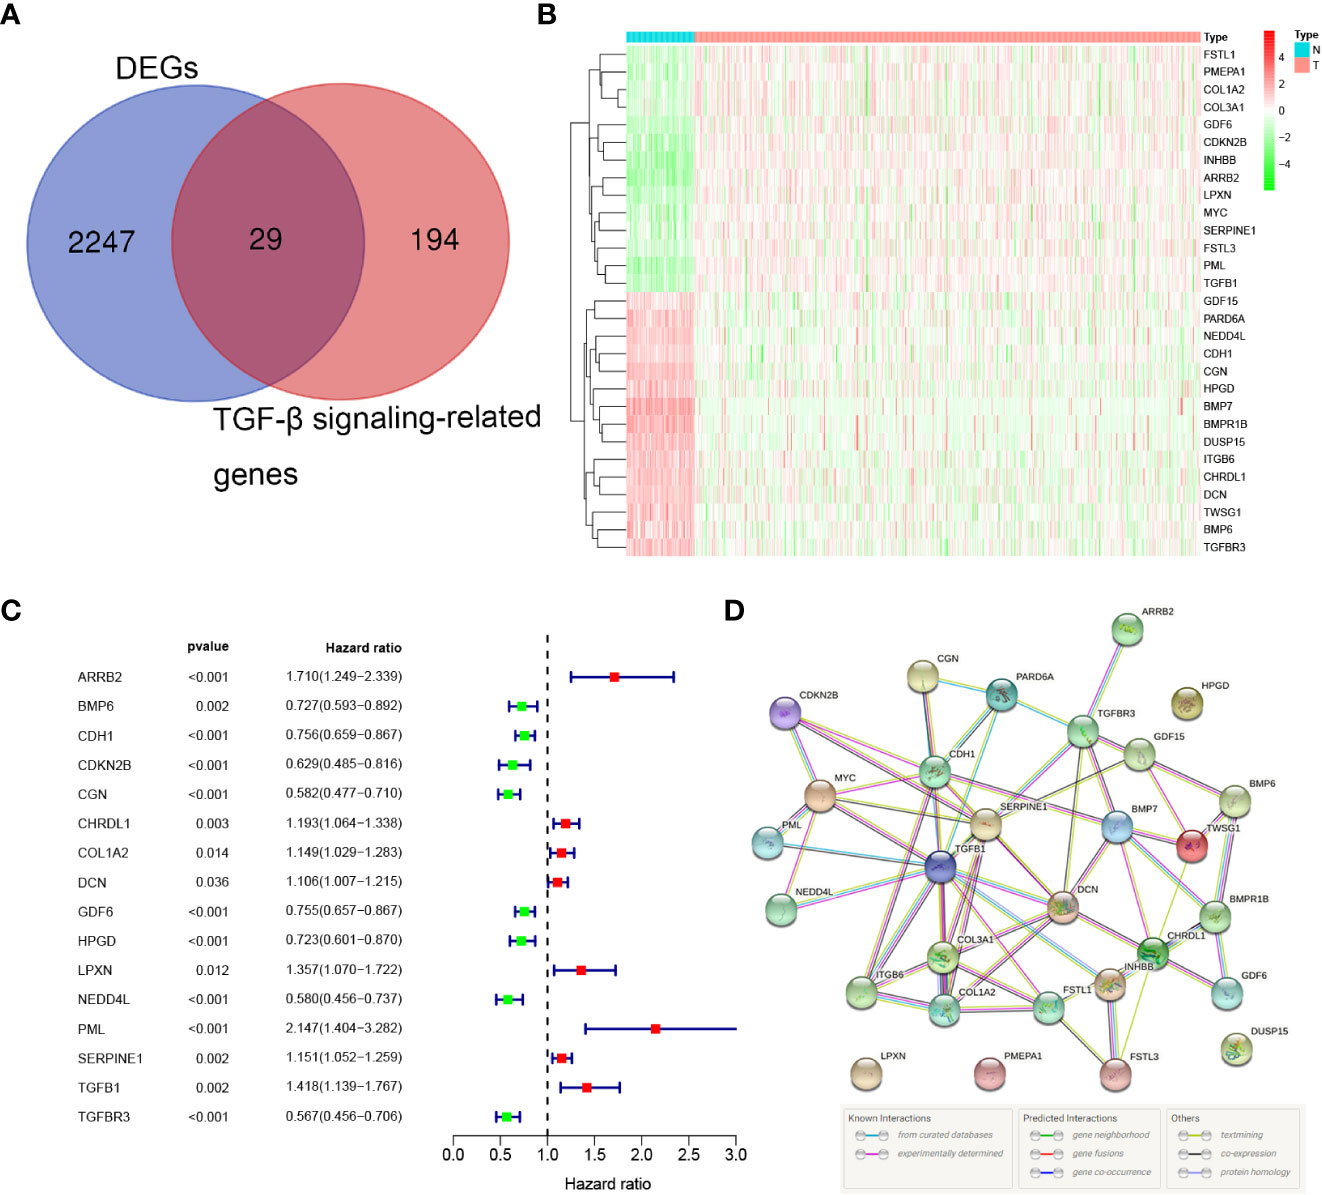
Figure 2 Identification of the prognostic TGF-β signaling-related genes in the TCGA cohort. (A) Venn diagram to identify DEGs between normal and tumor tissue. (B) The 29 overlapping genes were differently expressed in normal and tumor tissue. (C) Forest plots showing the significantly prognostic genes identified with univariate Cox regression analysis based on OS. (D) The PPI network downloaded from the STRING database indicated the interactions among candidate genes.
Development of a prognostic model in the TCGA cohort
LASSO Cox regression analysis was conducted to filter out the key genes (Figures 3A, B). Then, the multivariate Cox regression method was performed to further screen candidate genes. Finally, 7 genes, PML, CDKN2B, COL1A2, CHRDL1, HPGD, CGN and TGFBR3, were identified as prognostic signature genes. The risk score was measured as follows: risk score = (0.417 × the expression level of PML) + (-0.373 × the expression level of CDKN2B) + (0.109 × the expression level of COL1A2) + (0.104 × the expression level of CHRDL1) + (-0.195 × the expression level of HPGD) + (-0.399 × the expression level of CGN) + (-0.340 × the expression level of TGFBR3). According to the median cut-off value, patients were classified into low risk and high risk groups (Figure 3C). Compared with the low risk group, a significantly higher mortality rate were observed in the high risk group (Figure 3D). The heatmap result indicated that patients with high risk exhibited high expression levels of PML, COL1A2, and CHRDL1 but low expression of CDKN2B, HPGD, CGN and TGFBR3 (Figure 3E). K-M curves suggested that compared with patients with low risk, patients with high risk had a worse OS (p < 0.001). (Figure 3F). Additionally, the area under the ROC curve (AUC) of the 7-gene signature reached 0.77 at 1 year, 0.7 at 3 years, and 0.71 at 5 years, indicating a favorable predictive efficacy of the prognostic model (Figure 3G).
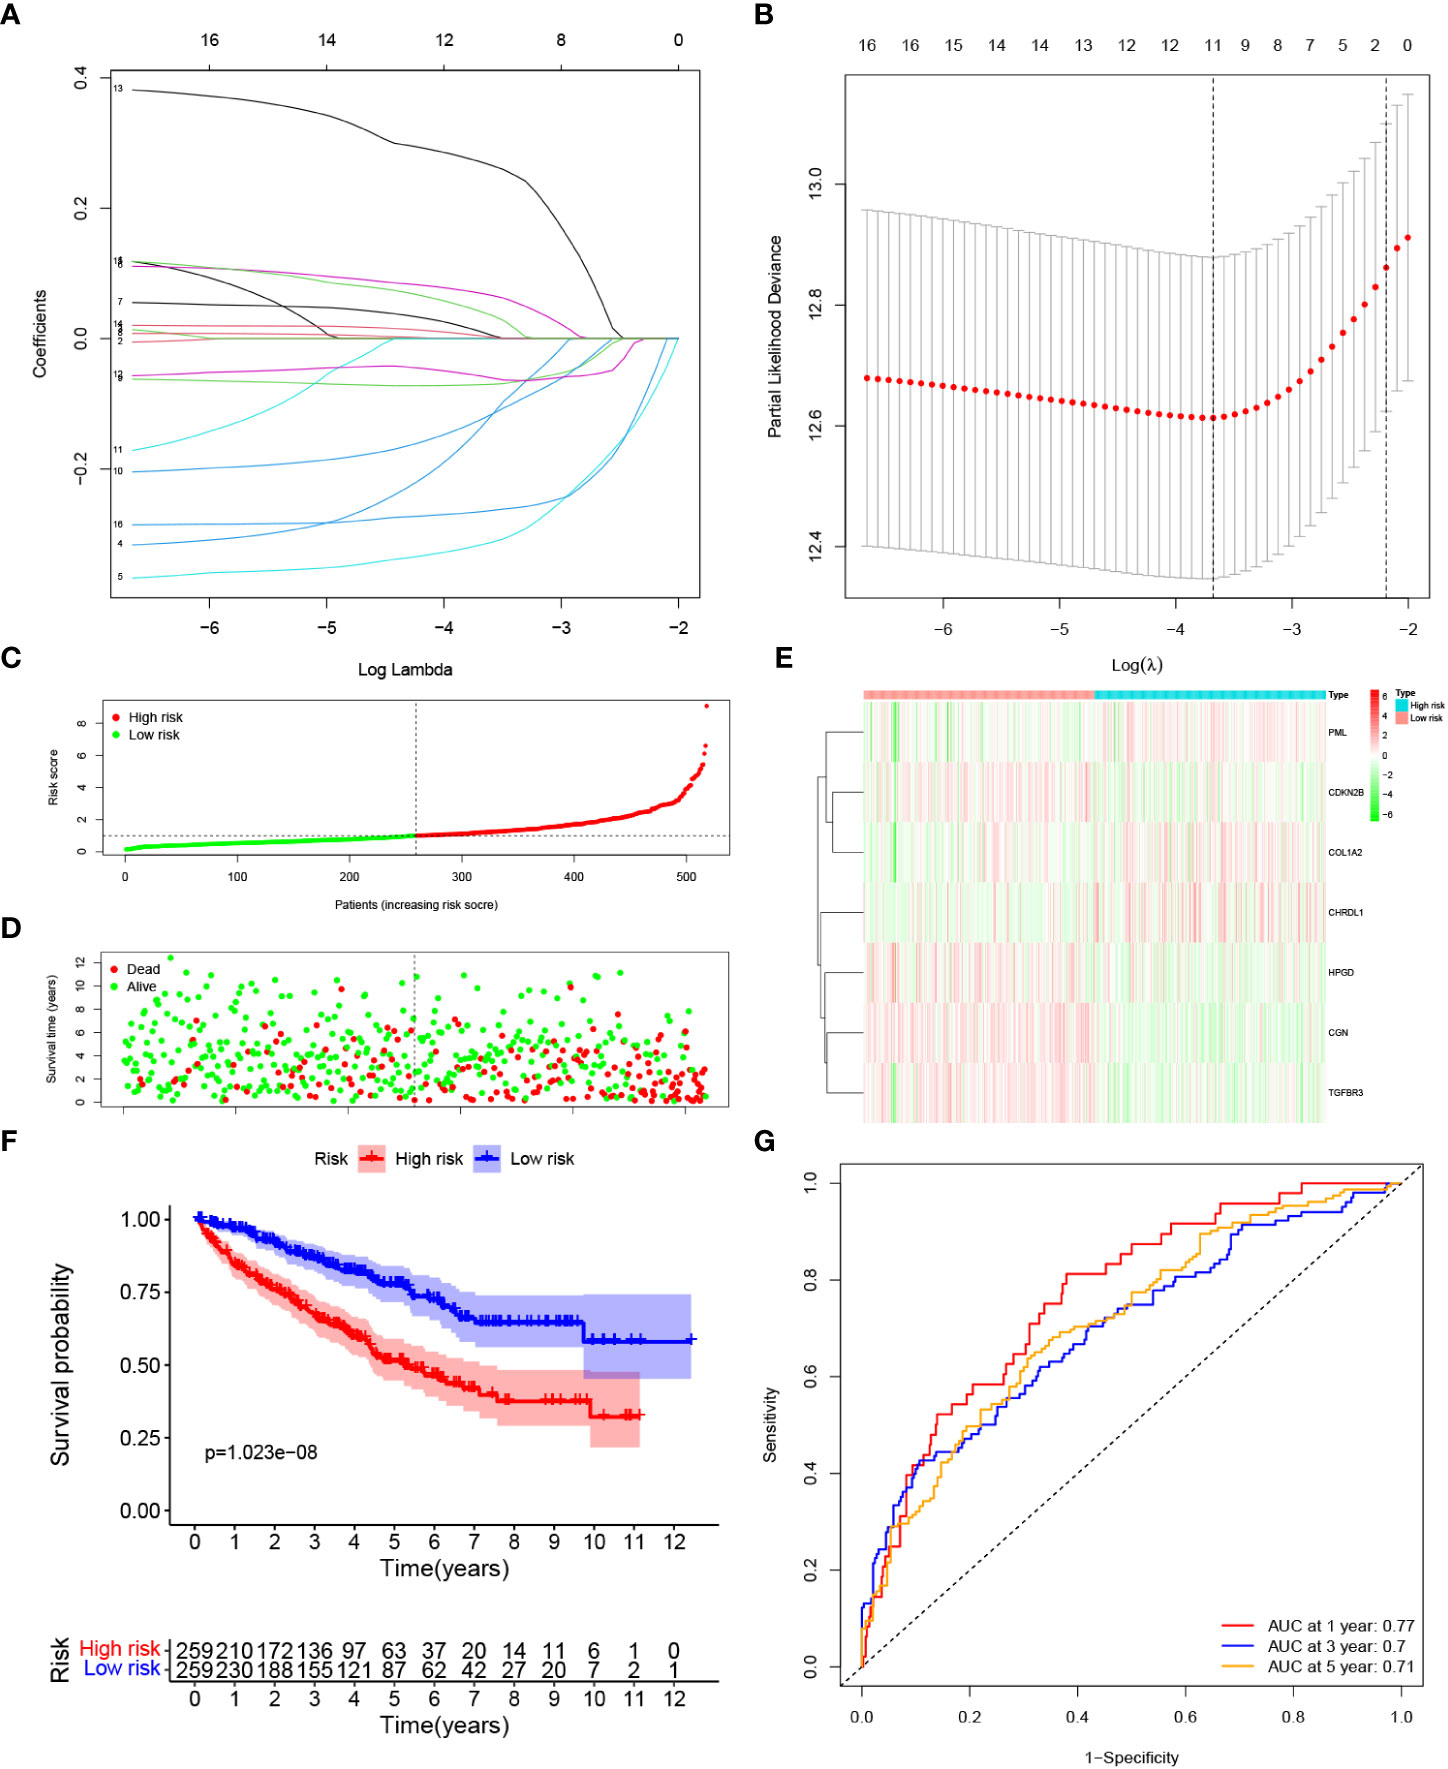
Figure 3 Construction of a prognostic model based on TGF-β signaling-related genes in the TCGA cohort. (A, B) LASSO Cox regression analysis was applied to screen the key genes. (C) The median value and distribution of the risk score. (D) The distribution of survival status. (E) Expression of seven prognostic genes. (F) K-M curves for the OS. (G) ROC curve of the prognostic signature.
Validation of the prognostic signature in the E-MTAB-1980 cohort
To evaluate the robustness of the risk model constructed from the TCGA cohort, we categorized patients from E-MTAB-1980 cohort as either high risk group or low risk groups based on the median value calculated by the same risk formula as the TCGA cohort (Figure 4A). Patients categorized as high risk group were more likely to die earlier (Figure 4B). The expression pattern of the risk model genes were similar to TCGA cohort (Figure 4C). The OS of patients in the high risk group was significantly lower than patients in the low risk group (p = 0.012). (Figure 4D). Additionally, as shown in Figure 4E, the AUC of the signature reached 0.69 at 1 year, 0.72 at 3 years, and 0.75 at 5 years, suggesting a better prediction efficacy.
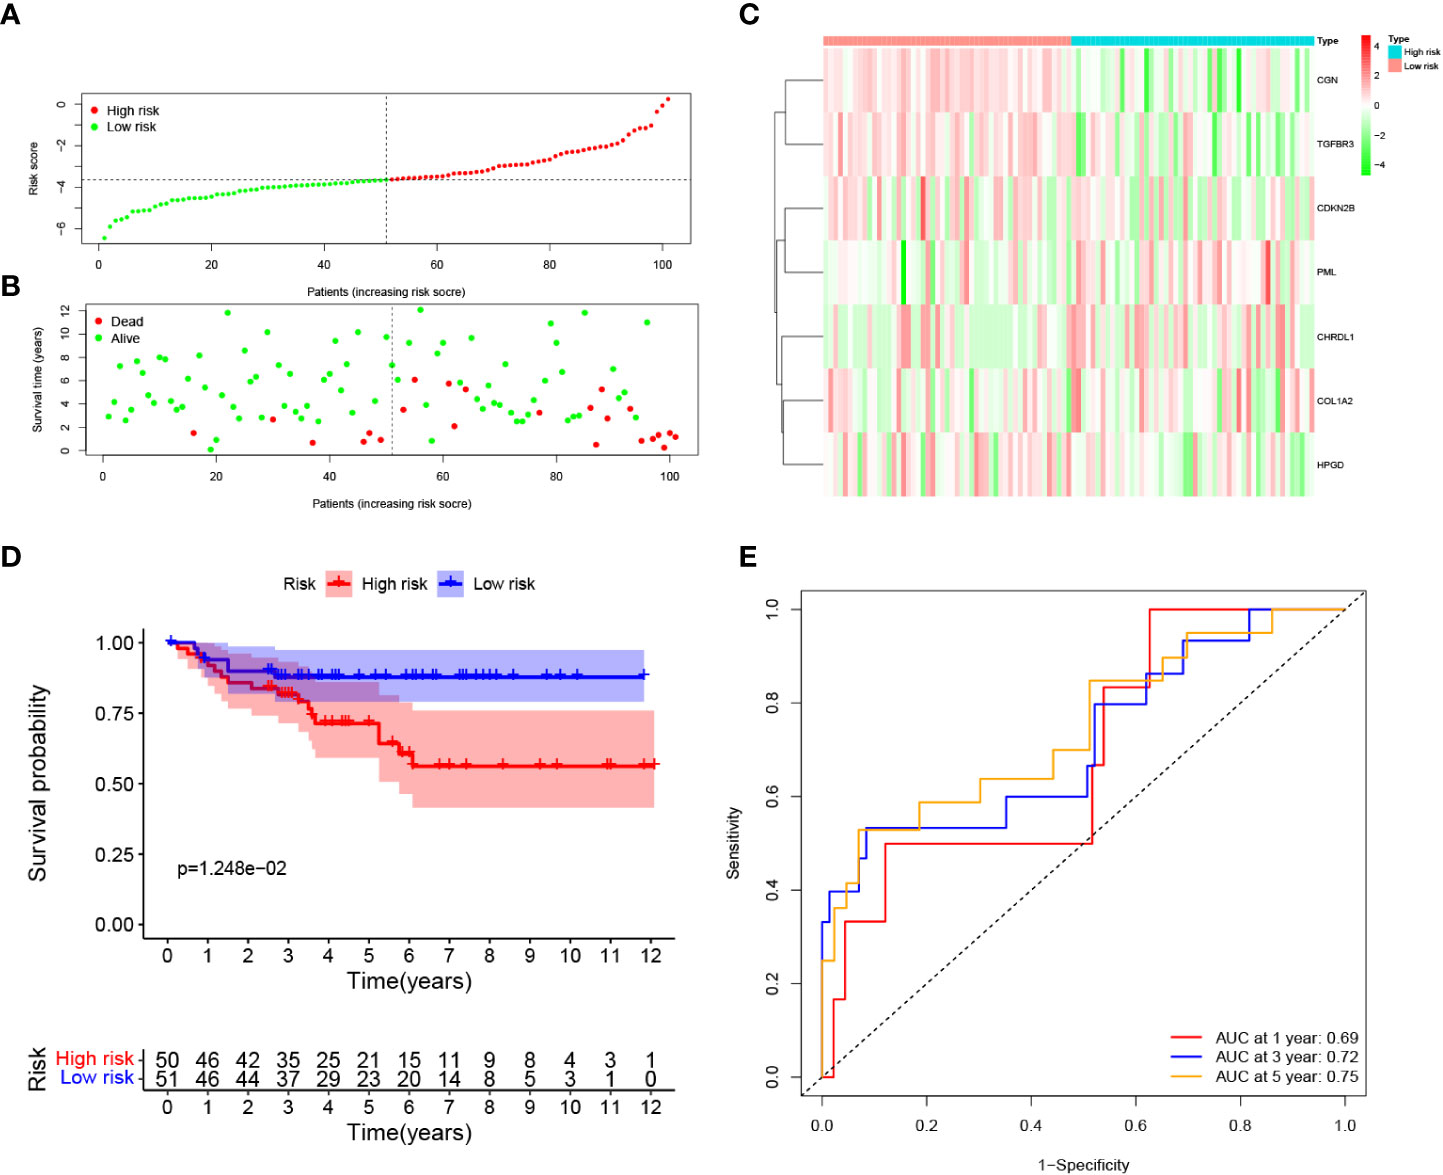
Figure 4 Validation of the prognostic signature in the E-MTAB-1980 dataset. (A) Distribution of patients’ risk score, (B) Survival status, (C) Expression of seven prognostic genes, (D) K-M curves for the OS, and (E). ROC curve for evaluating the performance of the prognostic signature in the E-MTAB-1980 dataset.
Independence of the prognostic model and nomogram construction
To clarify whether the signature could serve as an independent prognostic variable for OS, univariate and multivariate Cox regression analyses were performed. Univariate analysis shown that risk score was proven to be strong OS-related factors (TCGA cohort: HR = 1.597, 95% CI =1.441–1.770, p < 0.001, Figure 5A; E-MTAB-1980 cohort: HR = 2.255, 95% CI= 1.618–3.143, p < 0.001, Figure 5C). Multivariate analyses revealed that risk score was still a significantly prognostic variable for OS (TCGA cohort: HR = 1.422, 95% CI =1.265–1.598, p < 0.001, Figure 5B; E-MTAB-1980 cohort: HR = 1.892, 95% CI= 1.338–2.676, p < 0.001, Figure 5D). Therefore, risk score was confirmed as an independent prognostic factor for OS of ccRCC patients. The independent prognostic factors, namely age, stage and risk score, were utilized to construct a nomogram (Figure 5E). The calibration curve revealed that the nomogram presented better predictive performances at 1, 3, and 5 years of survival. (Figures 5F–H).
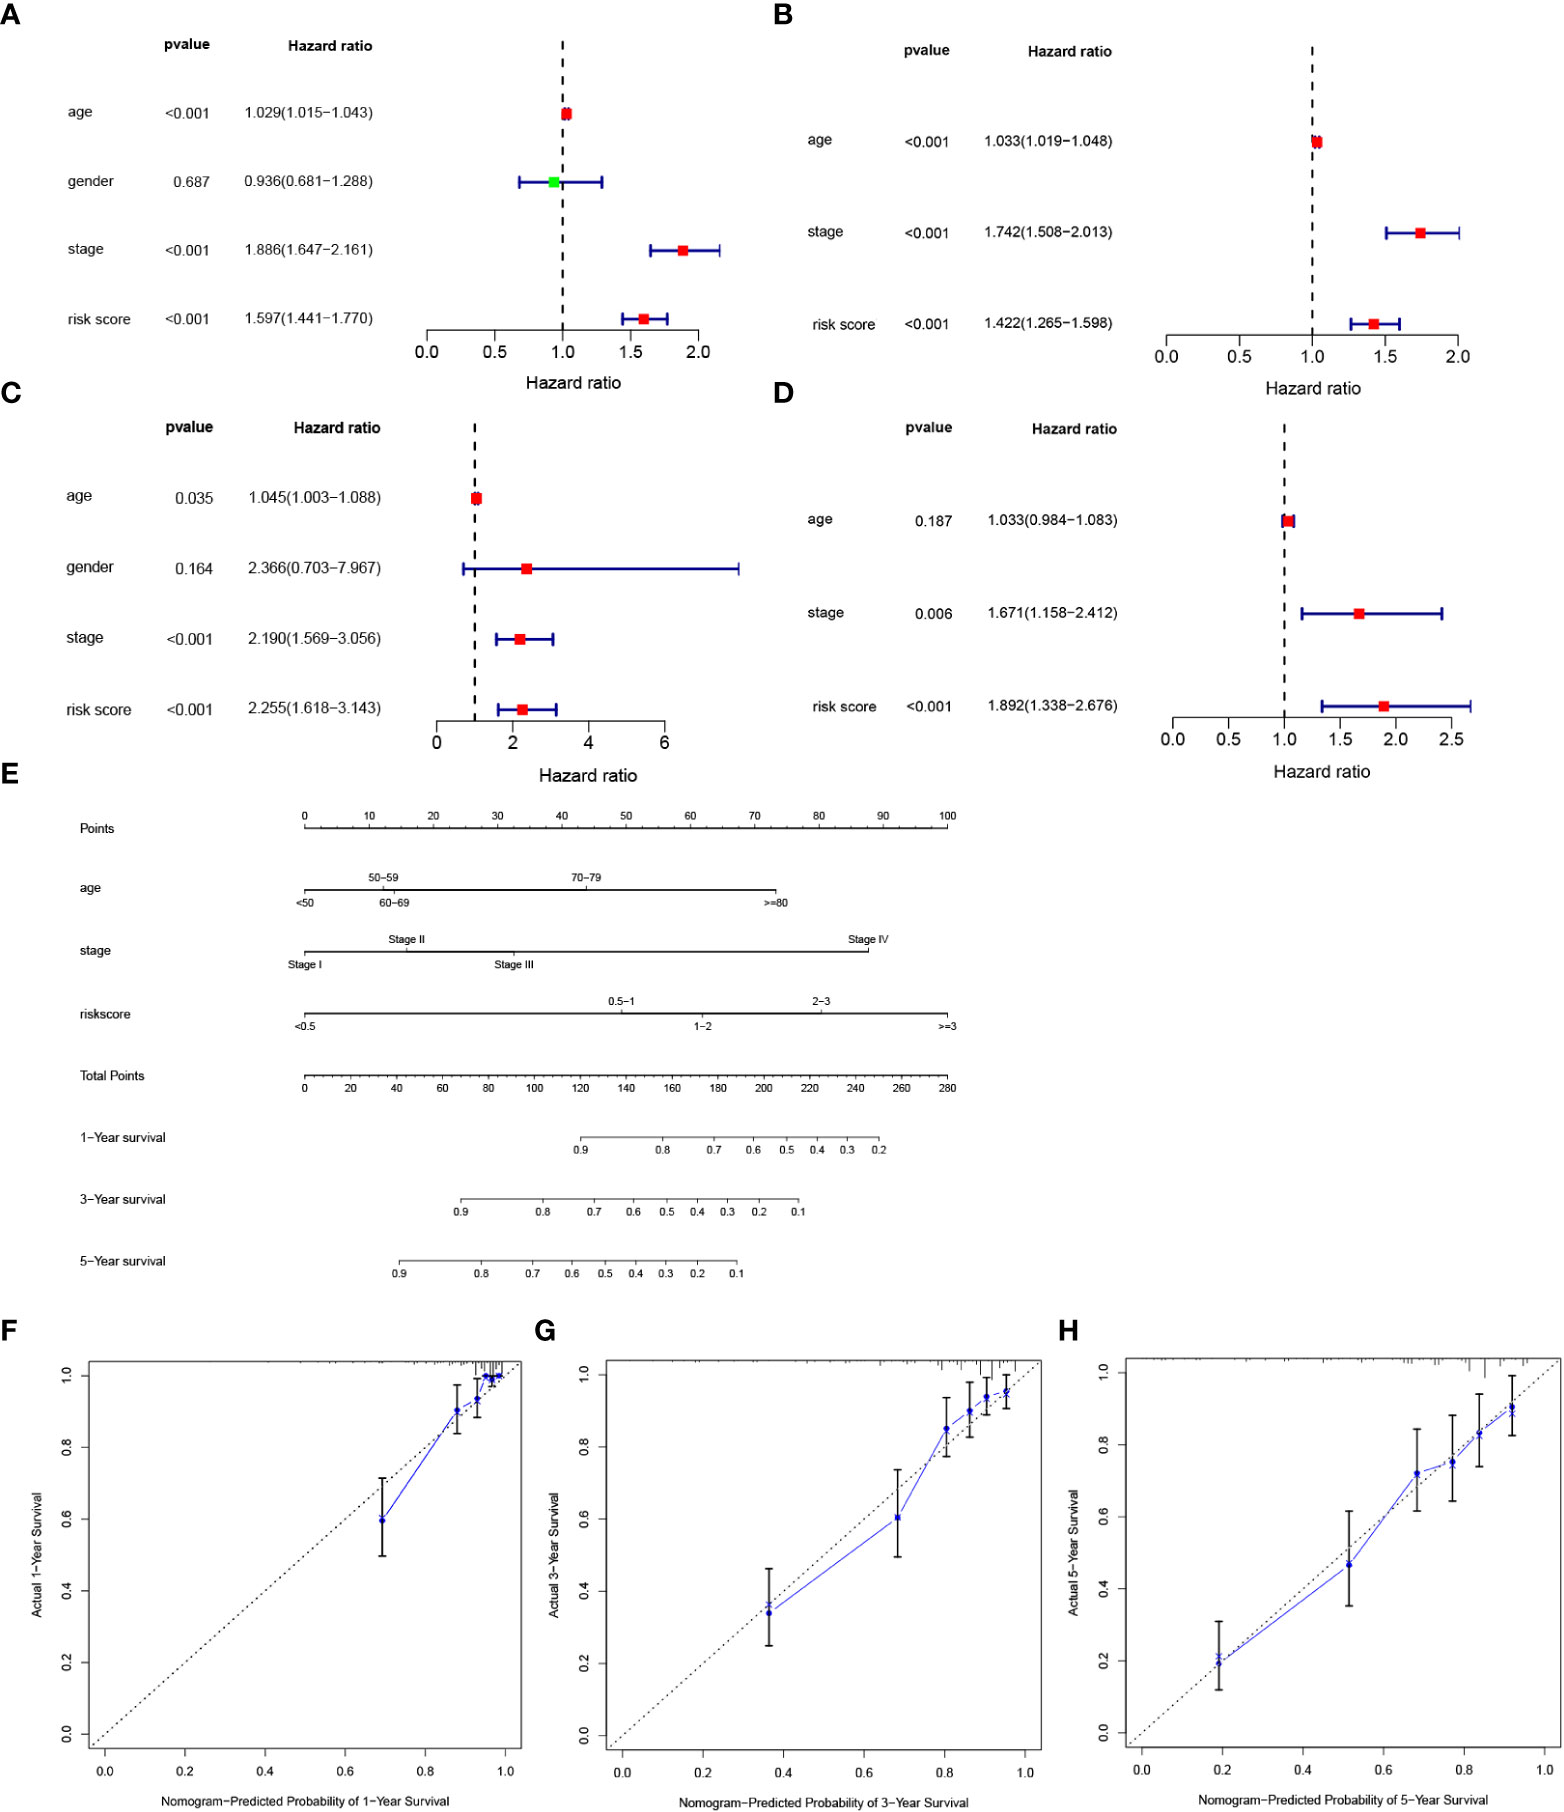
Figure 5 Development of a nomogram predicting OS in ccRCC. (A, B) Univariate and multivariate cox regression for risk score and clinical features, including age, gender, stage, and risk score in the TCGA cohort. (C, D) Univariate and multivariate cox regression for risk score and clinical features, including age, gender, stage, and risk score in the E-MTAB-1980 cohort. (E) Nomogram integrated age, stage, and riskscore. (F, H) Calibration curve for predicting OS at 1, 3 and 5 years.
Prognostic model risk score and clinical features
To investigate the correlation of risk score and clinical features, we analyzed the distribution of risk score values after stratification based on clinicopathological features. As shown in Figures 6A, B, the TCGA cohort patients with worse pathological features, including high grade, advanced T stage, metastasis, and advanced TMN stage had an obviously higher risk score. In addition, the E-MTAB-1980 cohort patients with metastasis or advanced TMN stage had an significantly higher risk score (Figures 6C, D). In sum, higher risk score were related to higher malignancy in ccRCC.
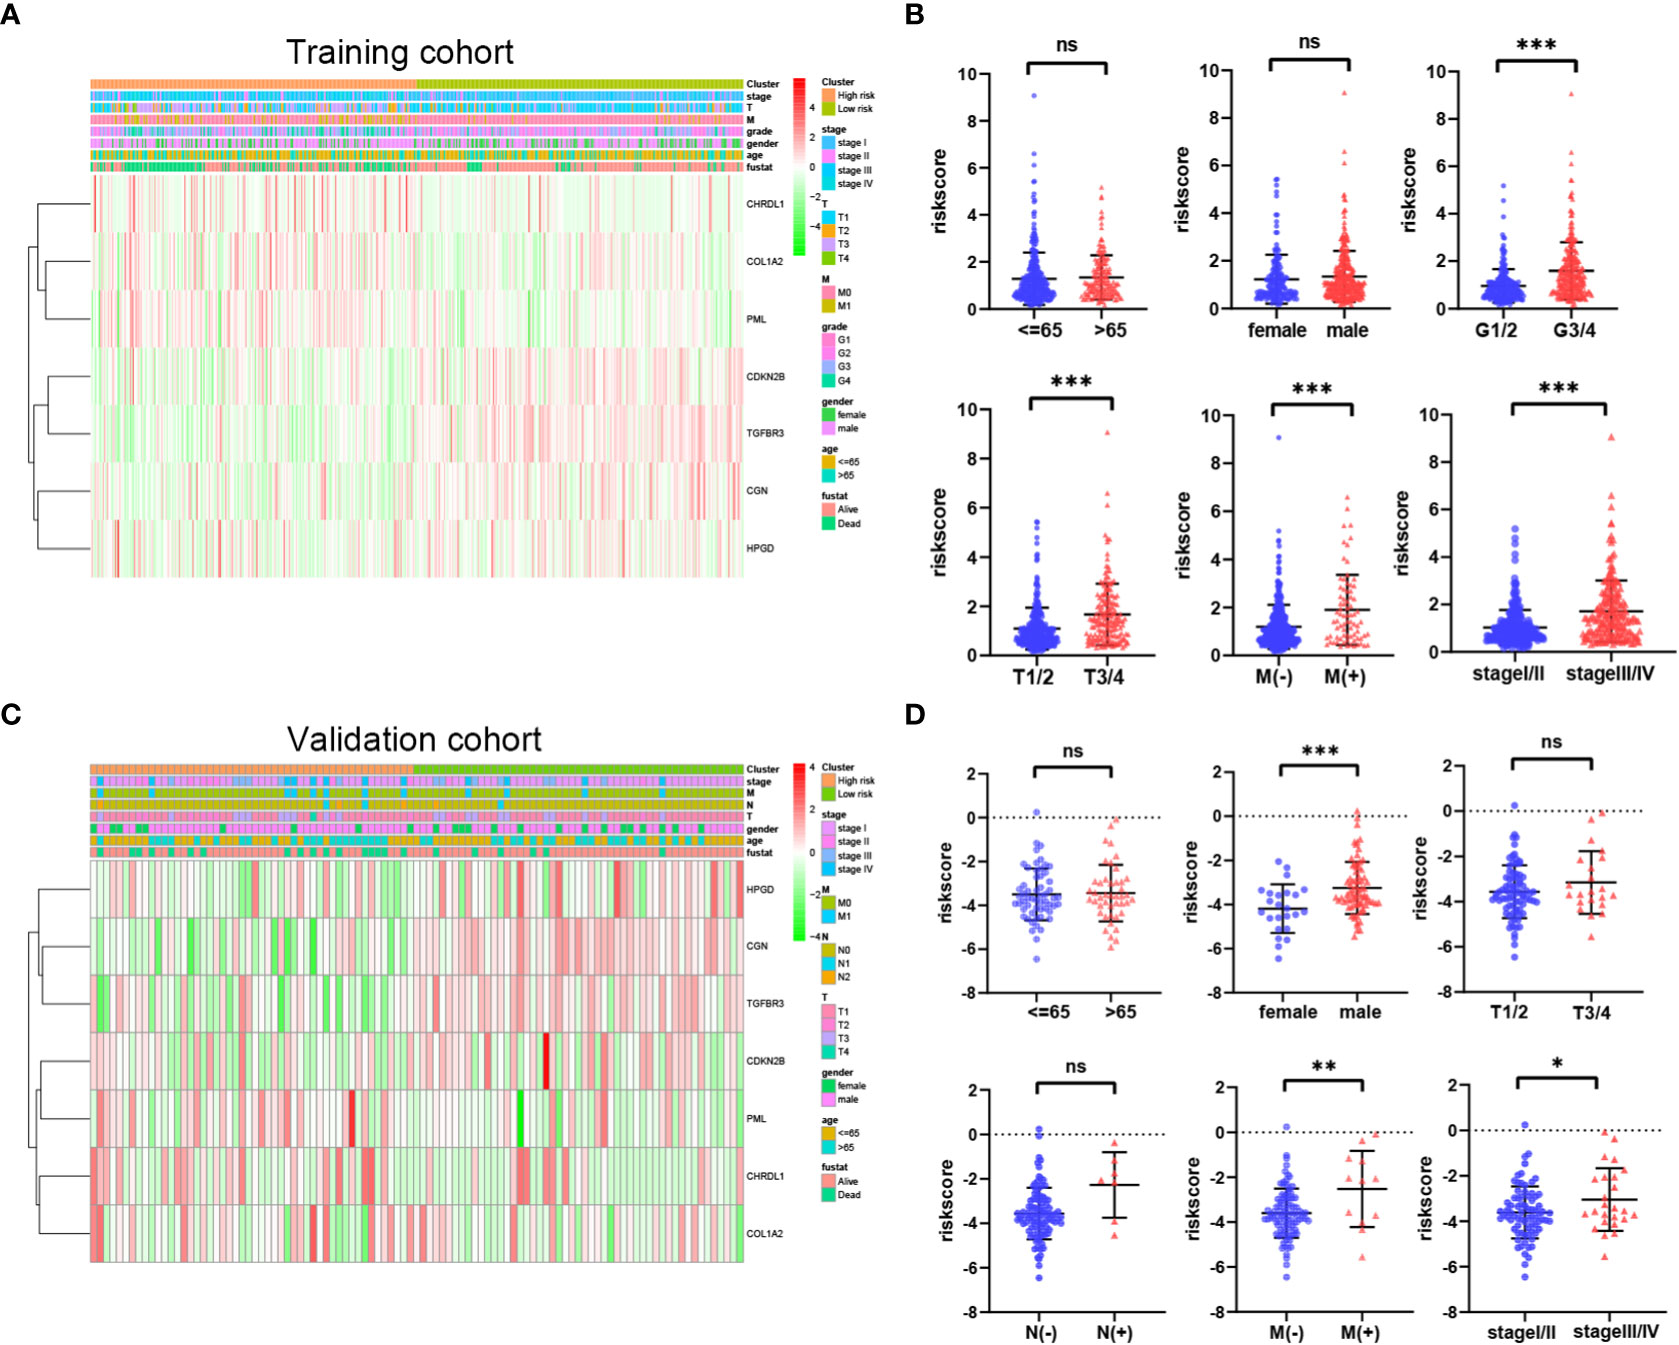
Figure 6 Relationship between riskscore and clinicopathological parameters in the TCGA cohort (A, B) and E-MTAB-1980 cohort (C, D). P values were shown as: ns, not significant; *P< 0.05; **P< 0.01; ***P< 0.001.
Functional enrichment analyses in the TCGA cohort
GO enrichment and KEGG pathway analyses were utilized to analyze the underlying biological functions and pathways of risk score-related genes. The DEGs between high-risk and low-risk groups was analyzed, and then these DEGs were used for GO enrichment and KEGG pathway analysis. GO analysis revealed that DEGs were enriched in biological processes of the immune responses, including complement activation, humoral immune responses mediated by circulating immunoglobulin, humoral immune responses, B cell mediated immunity (Figures 7A, B). KEGG analysis shown that DEGs were correlated with complement and coagulation cascades and PPAR signaling pathway (Figures 7C, D).
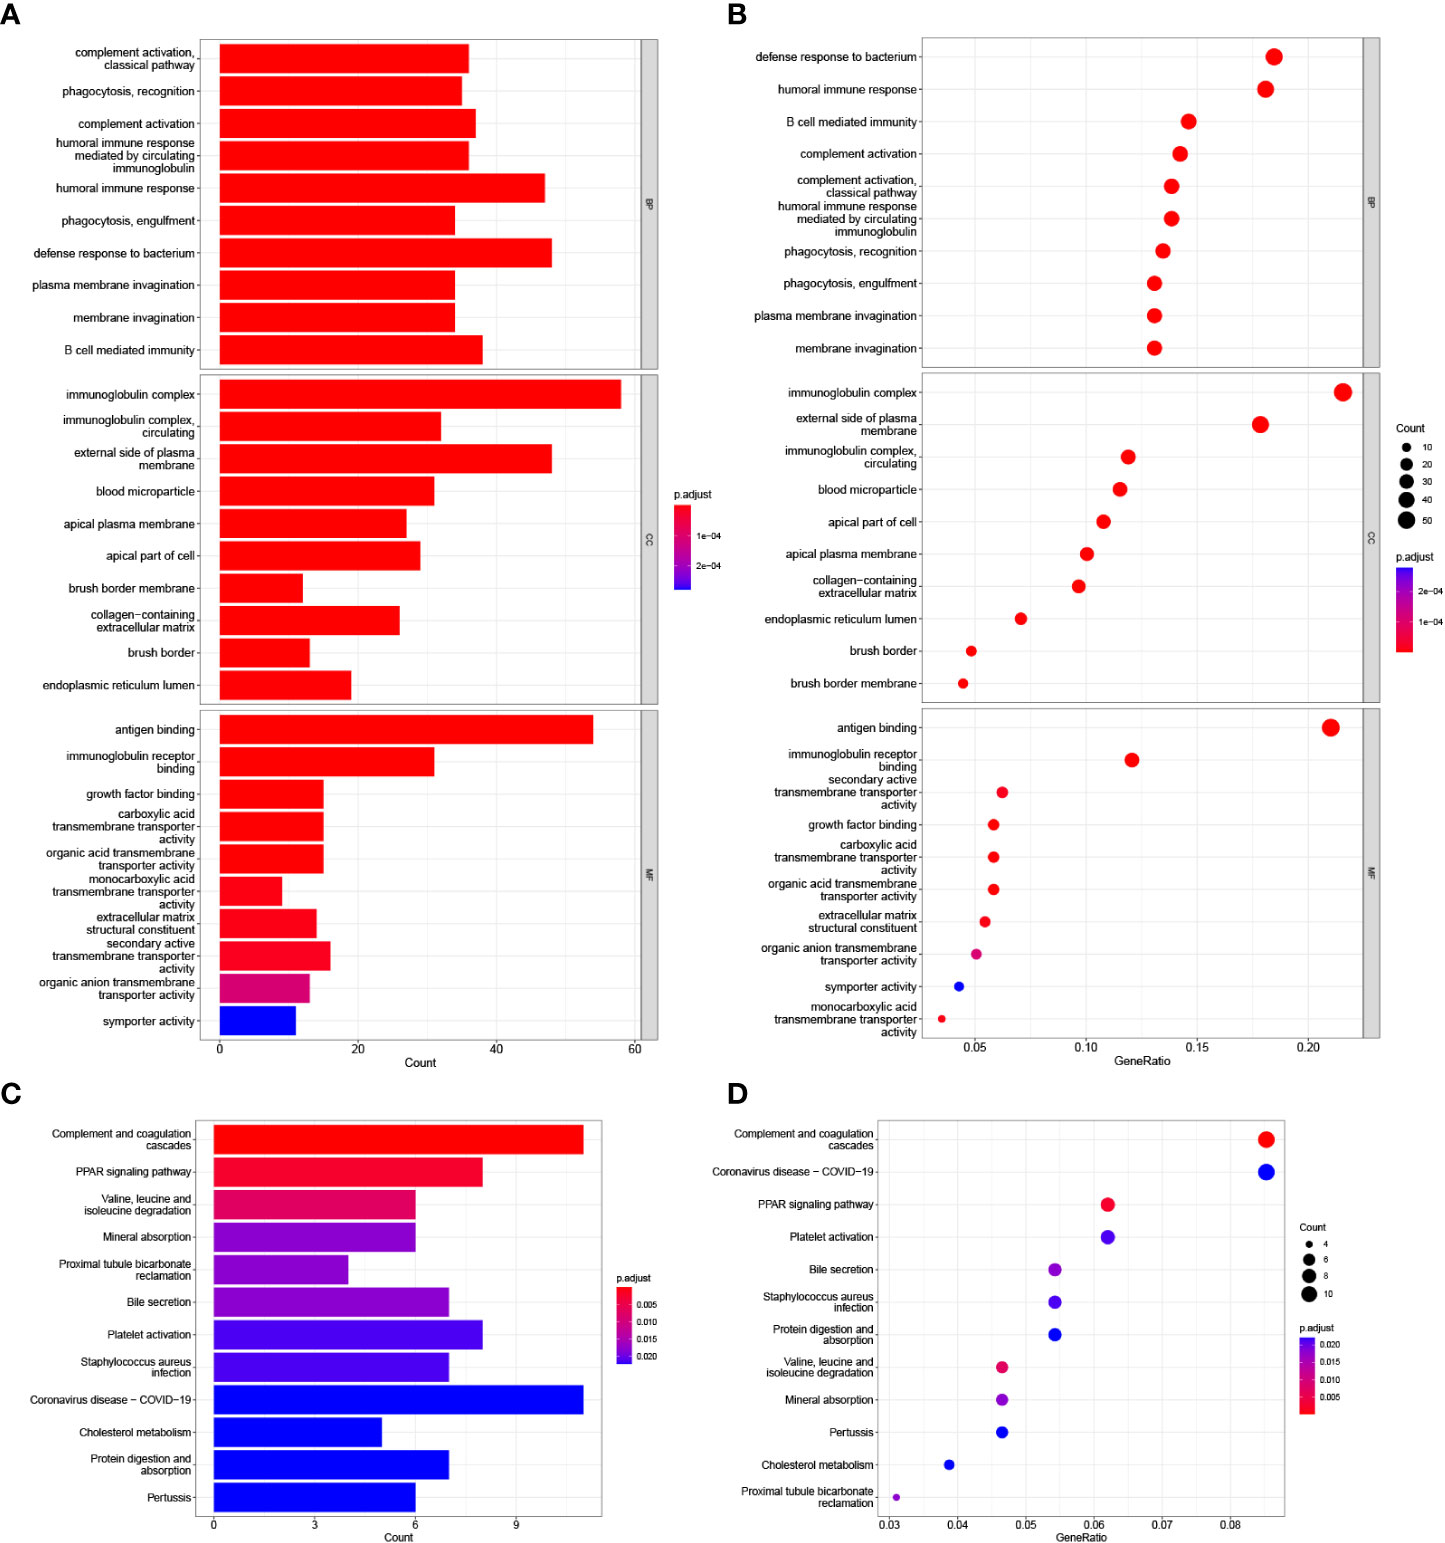
Figure 7 GO and KEGG analysis in the TCGA cohort. (A, B) GO enrichment analysis. (C, D) KEGG enrichment analysis.
Relationship between risk score and immune infiltration landscape in the TCGA cohort
The ssGSEA algorithm was performed to determine the difference of immune activity between the high risk group and low risk group. Immune cell abundance, including CD8+_T_cells, DCs, Macrophages, Mast_cells, pDCs, T_helper_cells, Tfh, Th1_cell, Th2_cells, TIL, B-cells, aDCs, and Treg, were significantly higher in the high risk group (Figures 8A, B). Immune function scores, including Type_I_IFN_Reponse, Type_II_IFN_Reponse, T_cell_co-stimulation, T_cell_co-inhibition, Parainflammation, MHC_class_I, Inflammation-promoting, HLA, Cytolytic_activity, check-point, CCR and APC_co_stimulation were stronger in the high risk group than those of in the low risk group (Figure 8C). To determine the proportion difference of 22 types of immune cells in the tumor microenvironment between high risk and low risk groups, CIBERSORT algorithm was carried out. Correlations of 22 types of immune cells types are presented in Figure 8D. As shown in Figure 8E, B cells naive, T cells CD4 memory resting, NK cells resting, Monocytes, macrophages M1, Macrophages M2 and Mast cells resting were significantly higher in the low risk group, while Plasma cells, T cells CD8, T cells CD4 memory activated, T cells regulatory, NK cells activated, and Macrophages M0 were significantly higher in the high risk group.
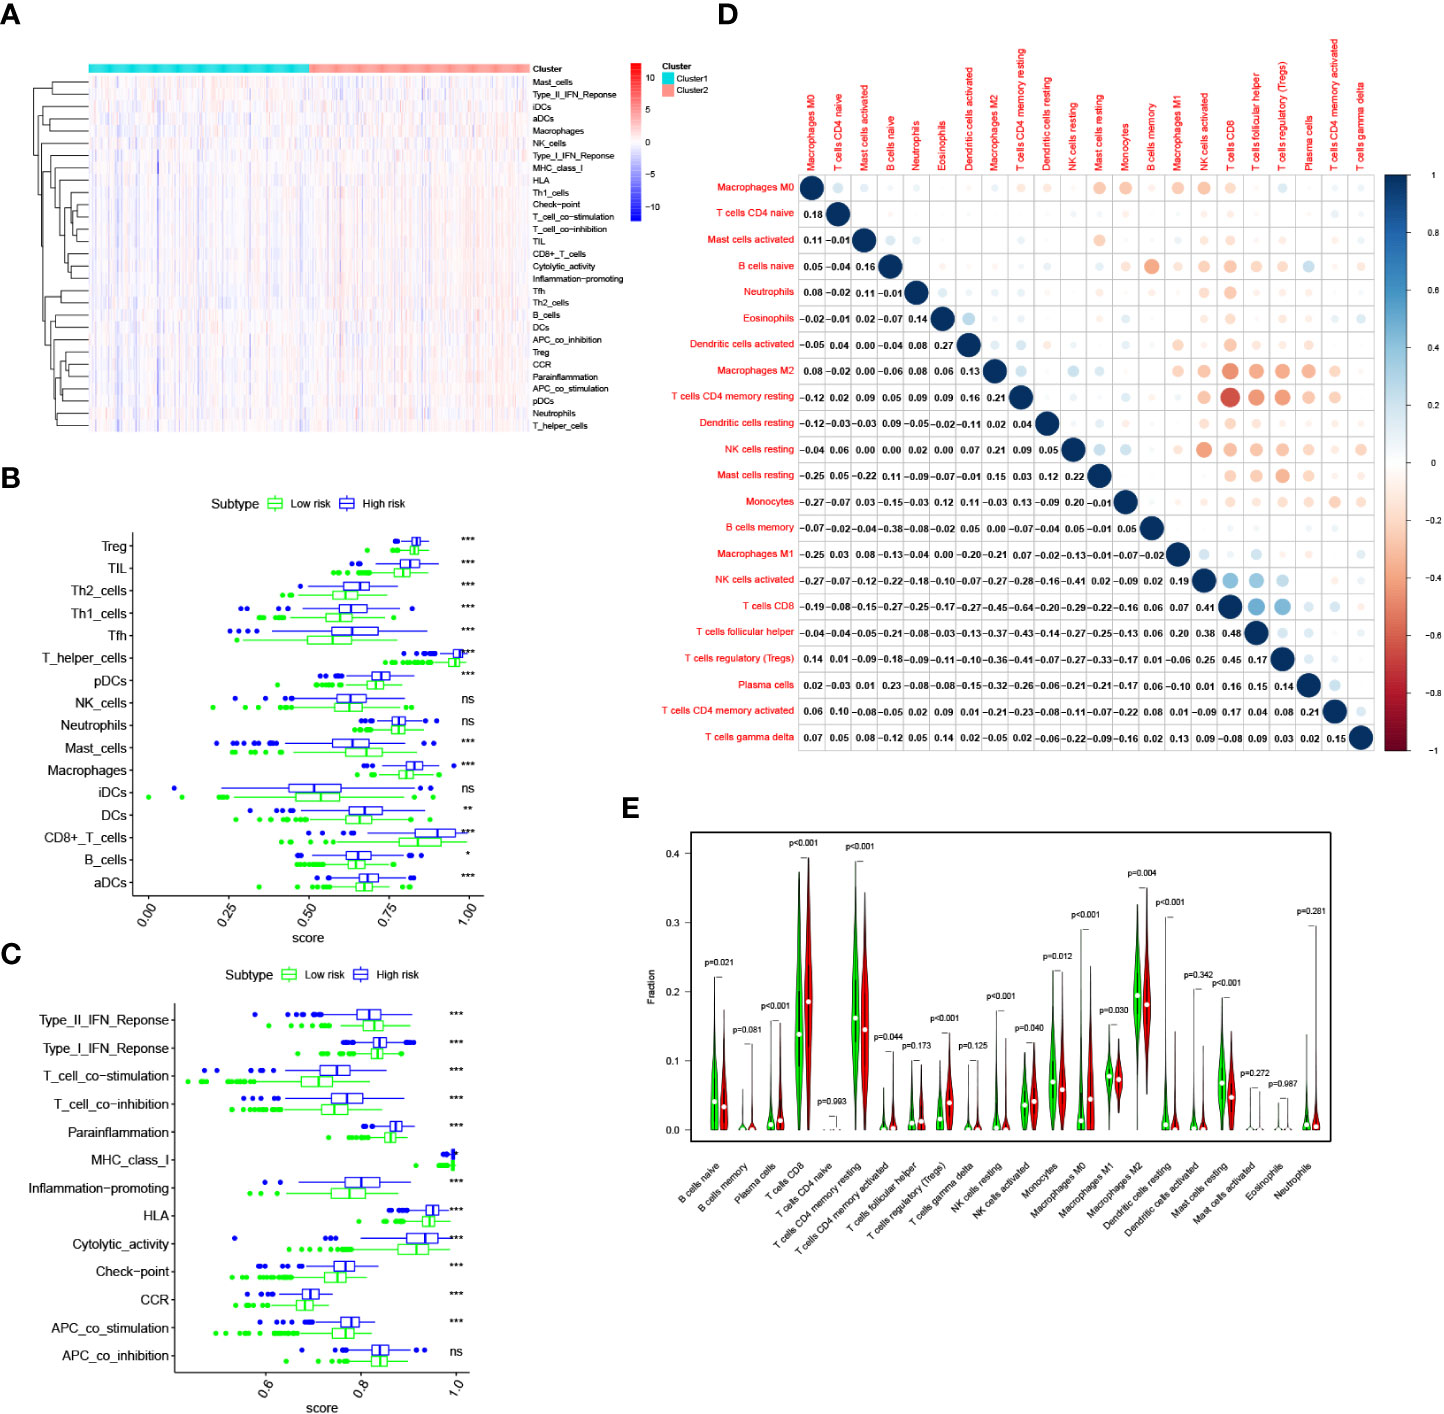
Figure 8 Immune infiltration pattern analysis in the TCGA cohort. (A) Relationship heatmap of the riskscore and ssGSEA scores. (B) Box plots presenting the scores of immune cells. (C) Box plots presenting the scores of immune function. (D) CIBERSORT algorithm analysis on correlations between 22 immune cell types. (E) CIBERSORT algorithm analysis the distribution of the abundance of immune cell infiltration between the high and low risk score groups. P values were shown as: ns, not significant; *P< 0.05; **P< 0.01; ***P< 0.001.
Risk model based on TGF-β signaling-related gene could predict the clinical response of immunotherapy
At present, immunotherapy therapy are the main treatment option for advanced ccRCC after targeted therapy failure (6, 17). The difference in the score of immune infiltration landscape in tumor microenvironment between the two risk groups indicated that the difference of immunotherapy effectiveness between the two groups. Common immune molecules, such as PD-1, PD-L1, CTLA4 and LAG3 are essential markers for personalized treatment. In this study, patients in the high risk group had significantly higher expressions of PD-1, CTLA-4, as well as LAG3 and greatly lower expressions of PD-L1 (Figure 9A). Further, the Spearman correlation test was used to evaluate the relationship between the risk score and expression of immune checkpoints. We found that the expression of PD-1, CTLA4 and LAG3 were positively correlated with risk score (Figures 9B–D), while the expression of PD-L1 were not substantially related to risk score (Figure 9E). Combining these results, patients in the high risk group would significantly benefit more after taking immunotherapy than those in the low risk group.
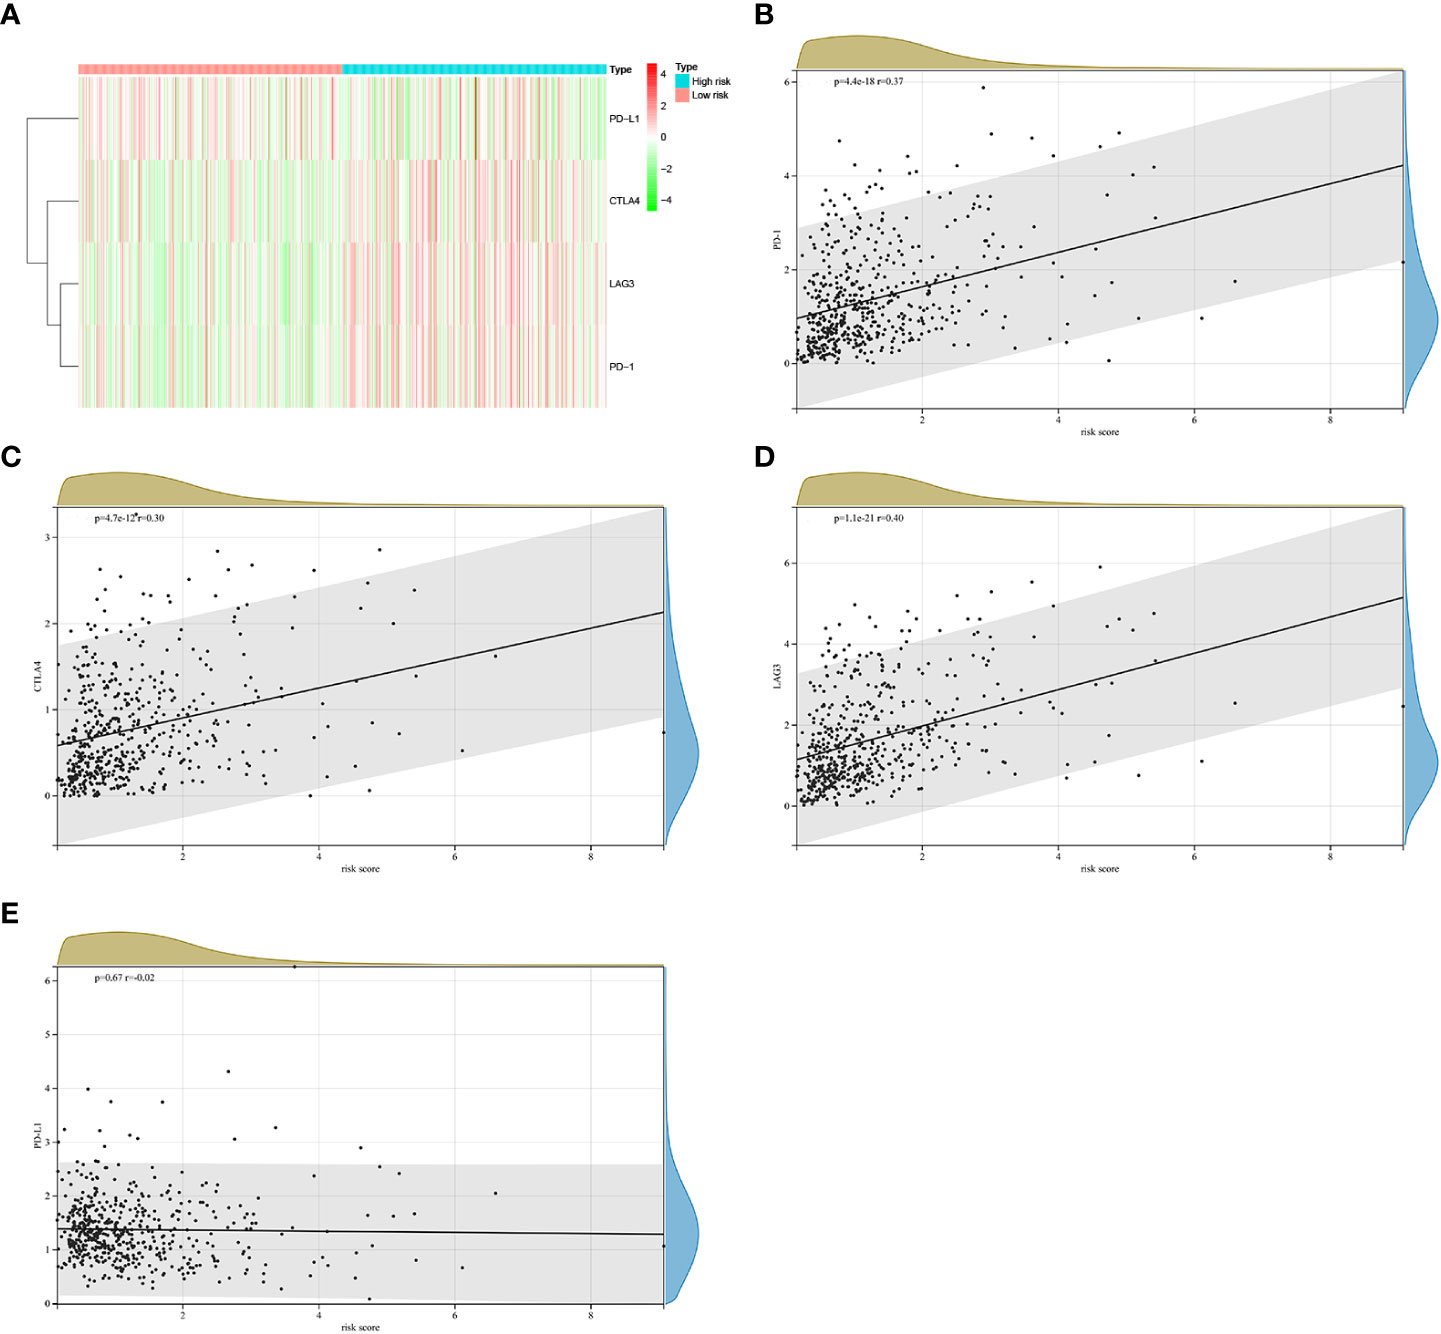
Figure 9 The correlations between riskscore and expression of immune checkpoint molecules in the TCGA cohort. (A) Heatmap of immune checkpoint molecules expression, including PD-1, PD-L1, LAG3 and CTLA4. (B–E)The relevance between the risk score and the expression of immune checkpoints.
Discussion
TGF-β signal is a crucial pathway involved in many malignancies initiation and progression. TGF-β signal activation stimulates EMT, facilitating metastasis and chemical resistance (11, 18). In recent years, many studies shown that TGF-β signal gene signature have a favorable capacities for predicting prognosis and responses to treatment of cancer (15, 16, 19). Several studies have reported that TGF-β pathway transduction disorder is very common in ccRCC and that inhibition of TGF-β pathway is considered to be a promising forms of treatment for ccRCC (20, 21). Therefore, a comprehensive exploration of the expression levels of TGF-β signaling-related genes in ccRCC may predict and improve the efficacy of therapy and prognosis of patients.
In this study, we identified and validated a TGF-β signaling-related genes signature in ccRCC and systematically analyzed the signature relationship with risk stratification and prognosis. The OS times of patients with high risk scores was significantly shorter than counterpart with low risk scores. The AUC for OS shown better predictive performance of the gene signature. Independent prognostic analysis confirmed that the risk score had an independent predictive capacity for OS of ccRCC patients. In addition, we found that the high risk scores was significantly associated with unfavorable clinicopathological characteristics, such as higher tumor grade, advanced TMN stage and metastasis.
Our signature consisted of seven TGF-β signaling-related genes, including PML, CDKN2B, COL1A2, CHRDL1, HPGD, CGN and TGFBR3. PML, also known as TRIM19, which was originally found in Acute Promyelocytic Leukemia (22). Cytoplasmic PML can stimulate TGF-β signaling by regulating the signal transduction of the phosphorylation of transcription factors SMAD2/3 (23). Previous study reported that PML act dual roles as oncogenic drivers and tumor suppressors in various malignant tumor (24). A recent study verified that PML was upregulated in triple negative breast cancer and knockdown PML suppressed tumor growth in vitro and in vivo (25). CDKN2B, also known as P15, belongs to the INK4 family, which has been identified as an inhibitor of cyclin-dependent kinase 4, thus inhibiting cell cycle progression and facilitating cell apoptosis in a variety of human cancers (26, 27). Tu et al. found that CDKN2B inactivation is essential for pancreatic carcinogenesis (28). Previous study revealed that mutation of CDKN2B lead to an increased incidence of renal cell carcinoma (29). COL1A2 (collagen type I alpha 2 chain) is a member of Type I collagen which is the important fibrillary component of extracellular matrix (30). Previous studies suggested that COL1A2 expression was up-regulated in multiple human carcinomas and abnormal increasing expression of COL12A1 was associated with a poor prognosis (31, 32). Dong et al. found that compared with normal tissues, COL1A2 was significantly upregulated in RCC (33). CHRDL1, also known as Chordin-like 1, is an antagonist of bone morphogenetic proteins (BMPs), and BMP signaling involve in several physiological and pathological processes, including cell proliferation, migration and invasion in malignant tumor (34). Wu et al. found that CHRDL1 expression was significantly downregulated in oral squamous cell carcinoma (OSCC). Overexpression of CHRDL1 suppressed OSCC cell metastasis in vitro and vivo (35). In breast cancer, CHRDL1 could suppress cell migration and invasion by inhibiting BMP signaling (36). HPGD (15-Hydroxyprostaglandin dehydrogenase), an important enzyme regulating the metabolism of prostaglandins, has been confirmed as a tumor suppressor in many malignancies (37–40). Yao et al. found that HPGD was significant down-regulation in cervical cancer tissues, and overexpression of HPGD suppressed proliferation and migration of cervical cancer cells (41). However, Lehtinen et al. reported that HPGD was significant up-regulation in breast cancers tissues, and high HPGD expression were associated with a poor clinical prognosis of breast cancer (42). CGN (cingulin), a transmembrane protein localized on the cytoplasmic surface of epithelial tight junctions, has been reported as a tumor inhibitor in ovarian cancer and osteosarcoma (43–44). TGFBR3 (transforming growth factor beta receptor 3) is a co‐receptor that bind multiple cytokines of the TGF‐β superfamily (45). TGFBR3 has been confirmed as a tumor suppressor in lung cancer (46), pancreatic cancer (47), prostate cancer (48), and breast cancer (49). Nishida et al. reported that TGFBR3 expression was significantly downregulated in ccRCC, and decreased expression of TGFBR3 was associated with poor clinical prognosis in patients with ccRCC. In addition, silencing TGFBR3 facilitated ccRCC cells growth and metastasis in vitro and in vivo (50). The above evidence indicated that all the seven TGF-β signaling-related genes correlated with malignant processes of multiple human cancer.
A previous study suggested that TGF-β signaling modulates immune cell infiltration in the tumor microenvironment (51). Immune cell infiltration is closely related to the clinical prognosis of ccRCC (52). According to the ssGSEA algorithm, we found differences in immune infiltration among patients with ccRCC with different risk scores not only in infiltrating scores of immune-cell, but also in infiltrating scores of immunity-related pathways. Patients in high risk group had significantly high infiltrating scores of immune-cell and immunity-related pathways. According to the CIBERSORT algorithm, we found that patients in low risk group had increased infiltration of B cells naive, T cells CD4 memory resting, NK cells resting, Monocytes, macrophages M1, Macrophages M2 and Mast cells resting, while patients in high risk group had increased infiltration Plasma cells, T cells CD8, T cells CD4 memory activated, T cells regulatory, NK cells activated, and Macrophages M0. Previous studies found that T cells regulatory infiltration was associated with poor prognosis in the ccRCC patients (53, 54). High T cells CD8 infiltration level is a poor prognostic factor in the ccRCC patients (55). M1 macrophages play an important role in inflammation induction, antigen presentation and antitumor reactions (56). A study reported that higher Mast cells resting density was associated with favorable outcomes in ccRCC (57). In addition, Zhang et al. reported that compared with high risk group, low risk group had higher abundance of B cells naive, T cells CD4 memory resting, NK cells resting, monocytes and macrophages M2 in the ccRCC patients (58). Therefore, dysregulation of the abundance of immune cell infiltration endowed high risk group an immunosuppressive tumor microenvironment, leading to a poor prognosis.
Cancer immunotherapies significantly improved the clinical prognosis of patients with advanced ccRCC (6, 59). In the TCGA cohort, a significantly distinction in the expression levels of immune checkpoints was found between the two groups. Compared with low risk group, high risk group had significantly higher expression levels of PD-1, CTLA-4, as well as LAG3 and greatly lower expressions of PD-L1. Besides, risk score was positively related to the expression of PD-1, CTLA4 and LAG3. These results indicated that patients in the high risk group would significantly benefit more from immunotherapy. Therefore, this prognostic signature model could be used for predicting the expression level of immune checkpoints and guiding immunotherapy decisions.
Several limitations should be recognized. First, a multi-center prospective study validation should be conducted to increase the evidence level of the prognostic signature model. Second, further experiment are needed to investigate the specific function and mechanisms of the seven genes in future work. Third, constructing a prognostic signature risk model via considering a single hallmark datasets might cause the regrettable deletion of several other promising prognostic genes.
Conclusion
We identified seven prognostic TGF-β signaling-related genes in ccRCC and constructed a robust prognostic signature model that can independently predict the survival outcome. In addition, this prognostic signature was related to the immune cell infiltration and expression of immune checkpoints, which can be used to predict the prognosis and guide immunotherapy decisions.
Data availability statement
Publicly available datasets were analyzed in this study. This data can be found here: TCGA and the ArrayExpress (E-MTAB-1980) databases.
Author contributions
LL and XW were responsible for the study design and writing; WX and BG were mainly responsible for data analysis. BF, WC, and LZ were mainly responsible for data collection. LL and XW were responsible for manuscript review and providing constructive comments. All authors contributed to the article and approved the submitted version.
Acknowledgments
We thank for using TCGA and ArrayExpress database for free.
Conflict of interest
The authors declare that the research was conducted in the absence of any commercial or financial relationships that could be construed as a potential conflict of interest.
Publisher’s note
All claims expressed in this article are solely those of the authors and do not necessarily represent those of their affiliated organizations, or those of the publisher, the editors and the reviewers. Any product that may be evaluated in this article, or claim that may be made by its manufacturer, is not guaranteed or endorsed by the publisher.
Supplementary material
The Supplementary Material for this article can be found online at: https://www.frontiersin.org/articles/10.3389/fonc.2023.1124080/full#supplementary-material
Supplementary Table 1 | A total of 223 TGF-β signaling-related genes were obtained from the following databases: AmiGO 2 (http://amigo.geneontology.org/amigo/landing), Ensembl Genome Brower (http://grch37.ensembl.org/index.html) and GSEA (http://www.gsea-msigdb.org/gsea/index.jsp).
References
1. Sung H, Ferlay J, Siegel RL, Laversanne M, Soerjomataram I, Jemal A, et al. Global cancer statistics 2020: GLOBOCAN estimates of incidence and mortality worldwide for 36 cancers in 185 countries. CA Cancer J Clin (2021) 71(3):209–49. doi: 10.3322/caac.21660
2. Ricketts CJ, De Cubas AA, Fan H, Smith CC, Lang M, Reznik E, et al. The cancer genome atlas comprehensive molecular characterization of renal cell carcinoma. Cell Rep (2018) 23:313–326.e5. doi: 10.1016/j.celrep.2018.03.075
3. Gupta K, Miller JD, Li JZ, Russell MW, Charbonneau C. Epidemiologic and socioeconomic burden of metastatic renal cell carcinoma (mRCC): a literature review. Cancer Treat Rev (2008) 34:193–205. doi: 10.1016/j.ctrv.2007.12.001
4. Gray RE, Harris GT. Renal cell carcinoma: Diagnosis and management. Am Fam Physician (2019) 99:179–84.
5. Choueiri TK, Powles T, Burotto M, Escudier B, Bourlon MT, Zurawski B, et al. Nivolumab plus cabozantinib versus sunitinib for advanced renal-cell carcinoma. N Engl J Med (2021) 384(9):829–41. doi: 10.1056/NEJMoa2026982
6. Rini BI, Plimack ER, Stus V, Gafanov R, Hawkins R, NOsov D, et al. Pembrolizumab plus axitinib versus sunitinib for advanced renal-cell carcinoma. N Engl J Med (2019) 380:1116–27. doi: 10.1056/NEJMoa1816714
7. Peng Q, Wang L, Zhao D, Lv Y, Wang H, Chen G, et al. Overexpression of FZD1 is associated with a good prognosis and resistance of sunitinib in clear cell renal cell carcinoma. J Cancer (2019) 10(5):1237–51. doi: 10.7150/jca.28662
8. Roviello G, Corona SP, Nesi G, Mini E. Results from a meta-analysis of immune checkpoint inhibitors in first-line renal cancer patients: does PD-L1 matter? Ther Adv Med Oncol (2019) 11:1758835919861905. doi: 10.1177/1758835919861905
9. Shen S, Wang G, Zhang R, Zhao Y, Yu H, Wei Y, et al. Development and validation of an immune gene-set based prognostic signature in ovarian cancer. EBioMedicine (2019) 40:318–26. doi: 10.1016/j.ebiom.2018.12.054
10. Chen RL, Zhou JX, Cao Y, Sun LL, Su S, Deng XJ, et al. Construction of a prognostic immune signature for squamous-cell lung cancer to predict survival. Front Immunol (2020) 11:1933. doi: 10.3389/fimmu.2020.01933
11. Colak S, Ten Dijke P. Targeting TGF-beta signaling in cancer. Trends Cancer (2017) 3(1):56–71. doi: 10.1016/j.trecan.2016.11.008
12. Seoane J, Gomis RR. TGF-beta family signaling in tumor suppression and cancer progression. Cold Spring Harb Perspect Biol (2017) 9(12):a022277.
13. Wang P, Chen W, Ma T, Lin Z, Liu C, Liu Y, et al. lncRNA lnc-TSI inhibits metastasis of clear cell renal cell carcinoma by suppressing TGF-β-Induced epithelial-mesenchymal transition. Mol Ther Nucleic Acids (2020) 22:1–16. doi: 10.1016/j.omtn.2020.08.003
14. Zhou Q, Li J, Ge C, Chen J, Tian W, Tian H. SNX5 suppresses clear cell renal cell carcinoma progression by inducing CD44 internalization and epithelial-to-mesenchymal transition. Mol Ther Oncolytics (2021) 24:87–100. doi: 10.1016/j.omto.2021.12.002
15. Liao J, Liu Q, Chen J, Lu Z, Mo H, Jia J. A risk score model based on TGF-β pathway-related genes predicts survival, tumor microenvironment and immunotherapy for liver hepatocellular carcinoma. Proteome Sci (2022) 20(1):11. doi: 10.1186/s12953-022-00192-4
16. Yu Q, Zhao L, Yan XX, Li Y, Chen XY, Hu XH, et al. Identification of a TGF-β signaling-related gene signature for prediction of immunotherapy and targeted therapy for lung adenocarcinoma. World J Surg Oncol (2022) 20(1):183. doi: 10.1186/s12957-022-02595-1
17. Motzer RJ, Escudier B, McDermott DF, George S, Hammers HJ, Srinivas S, et al. Nivolumab versus everolimus in advanced renal-cell carcinoma. N Engl J Med (2015) 373(19):1803–13. doi: 10.1056/NEJMoa1510665
18. Derynck R, Turley SJ, Akhurst RJ. Tgfb biology in cancer progression and immunotherapy. Nat Rev Clin Oncol (2021) 18(1):9–34. doi: 10.1038/s41571-020-0403-1
19. Liu Z, Qi T, Li X, Yao Y, Othmane B, Chen J, et al. A novel TGF-β risk score predicts the clinical outcomes and tumour microenvironment phenotypes in bladder cancer. Front Immunol (2021) 12:791924. doi: 10.3389/fimmu.2021.791924
20. Taguchi L, Miyakuni K, Morishita Y, Morikawa T, Fukayama M, Miyazono K, et al. C-ski accelerates renal cancer progression by attenuating transforming growth factor β signaling. Cancer Sci (2019) 110(6):2063–74. doi: 10.1111/cas.14018
21. Cui H, Yi H, Bao H, Tan Y, Tian C, Shi X, et al. The SWI/SNF chromatin remodeling factor DPF3 regulates metastasis of ccRCC by modulating TGF-β signaling. Nat Commun (2022) 13(1):4680. doi: 10.1038/s41467-022-32472-0
22. Chen D, Feng C, Tian X, Zheng N, Wu Z. Promyelocytic leukemia restricts enterovirus 71 replication by inhibiting autophagy. Front Immunol (2018) 9:1268. doi: 10.3389/fimmu.2018.01268
23. El-Asmi F, Chelbi-Alix MK. PML isoforms and TGF-β response. Med Sci (Paris) (2020) 36(1):50–6. doi: 10.1051/medsci/2019269
24. Li Y, Ma X, Wu W, Chen Z, Meng G. PML nuclear body biogenesis, carcinogenesis, and targeted therapy. Trends Cancer (2020) 6(10):889–906. doi: 10.1016/j.trecan.2020.05.005
25. Arreal L, Piva M, Fernández S, Revandkar A, Schaub-Clerigué A, Villanueva J, et al. Targeting PML in triple negative breast cancer elicits growth suppression and senescence. Cell Death Differ (2020) 27(4):1186–99. doi: 10.1038/s41418-019-0407-5
26. Kim WY, Sharpless NE. The regulation of INK4/ARF in cancer and aging. Cell (2006) 127:265–75. doi: 10.1016/j.cell.2006.10.003
27. Gil J, Peters G. Regulation of the INK4b-ARF-INK4a tumour suppressor locus: all for one or one for all. Nat Rev Mol Cell Biol (2006) 7:667–77. doi: 10.1038/nrm1987
28. Tu Q, Hao J, Zhou X, Yan L, Dai H, Sun B, et al. CDKN2B deletion is essential for pancreatic cancer development instead of unmeaningful co-deletion due to juxtaposition to CDKN2A. Oncogene (2018) 37(1):128–38. doi: 10.1038/onc.2017.316
29. Jafri M, Wake NC, Ascher DB, Pires DE, Gentle D, Morris MR, et al. Germline mutations in the CDKN2B tumor suppressor gene predispose to renal cell carcinoma. Cancer Discovery (2015) 5(7):723–9. doi: 10.1158/2159-8290.CD-14-1096
30. Yu Y, Liu D, Liu Z, Li S, Ge Y, Sun W, et al. The inhibitory effects of COL1A2 on colorectal cancer cell proliferation, migration, and invasion. J Cancer (2018) 9(16):2953–62. doi: 10.7150/jca.25542
31. Ji J, Zhao L, Budhu A, Forgues M, Jia HL, Qin LX, et al. Let-7g targets collagen type I alpha2 and inhibits cell migration in hepatocellular carcinoma. J hepatology (2010) 52:690–7. doi: 10.1016/j.jhep.2009.12.025
32. Shintani Y, Hollingsworth MA, Wheelock MJ, Johnson KR. Collagen I promotes metastasis in pancreatic cancer by activating c-jun NH(2)-terminal kinase 1 and up-regulating n-cadherin expression. Cancer Res (2006) 66:11745–53. doi: 10.1158/0008-5472.CAN-06-2322
33. Dong Y, Zhai W, Xu Y. Bioinformatic gene analysis for potential biomarkers and therapeutic targets of diabetic nephropathy associated renal cell carcinoma. Transl Androl Urol (2020) 9(6):2555–71. doi: 10.21037/tau-19-911
34. Ren J, Wang Y, Ware T, Iaria J, Ten Dijke P, Zhu HJ. Reactivation of BMP signaling by suboptimal concentrations of MEK inhibitor and FK506 reduces organ-specific breast cancer metastasis. Cancer Lett (2020) 493:41–54. doi: 10.1016/j.canlet.2020.07.042
35. Wu Q, Zheng Z, Zhang J, Piao Z, Xin M, Xiang X, et al. Chordin-like 1 regulates epithelial-to-Mesenchymal transition and metastasis The MAPK signaling pathway in oral squamous cell carcinoma. Front Oncol (2022) 12:862751. doi: 10.3389/fonc.2022.862751
36. Cyr-Depauw C, Northey JJ, Tabariès S, Annis MG, Dong Z, Cory S, et al. Chordin-like 1 suppresses bone morphogenetic protein 4-induced breast cancer cell migration and invasion. Mol Cell Biol (2016) 36(10):1509–25. doi: 10.1128/MCB.00600-15
37. Tai HH, Cho H, Tong M, Ding Y. NAD + -linked 15-hydroxyprostaglandin dehydrogenase: structure and biological functions. Curr Pharm Des (2006) 12:955–62. doi: 10.2174/138161206776055958
38. Yan M, Rerko RM, Platzer P, Dawson D, Willis J, Tong M, et al. 15-hydroxyprostaglandin dehydrogenase, a COX-2 oncogene antagonist, is a TGF-beta-induced suppressor of human gastrointestinal cancers. Proc Natl Acad Sci U S A (2004) 101:17468–73. doi: 10.1073/pnas.0406142101
39. Gee JR, Montoya RG, Khaled HM, Sabichi AL, Grossman HB. Cytokeratin 20, AN43, PGDH, and COX-2 expression in transitional and squamous cell carcinoma of the bladder. Urol Oncol (2003) 21:266–70. doi: 10.1016/S1078-1439(02)00271-5
40. Ding Y, Tong M, Liu S, Moscow JA, Tai HH. NAD + -linked 15-hydroxyprostaglandin dehydrogenase (15-PGDH) behaves as a tumor suppressor in lung cancer. Carcinogenesis (2005) 26:65–72. doi: 10.1093/carcin/bgh277
41. Yao S, Xu J, Zhao K, Song P, Yan Q, Fan W, et al. Down-regulation of HPGD by miR-146b-3p promotes cervical cancer cell proliferation, migration and anchorage-independent growth through activation of STAT3 and AKT pathways. Cell Death Dis (2018) 9(11):1055. doi: 10.1038/s41419-018-1059-y
42. Lehtinen L, Vainio P, Wikman H, Reemts J, Hilvo M, Issa R, et al. 15- hydroxyprostaglandin dehydrogenase associates with poor prognosis in breast cancer, induces epithelial-mesenchymal transition, and promotes cell migration in cultured breast cancer cells. J Pathol (2012) 226(4):674–86. doi: 10.1002/path.3956
43. Zhang L, Feng T, Spicer LJ. The role of tight junction proteins in ovarian follicular development and ovarian cancer. Reproduction (2018) 155:R183–98. doi: 10.1530/REP-17-0503
44. Liu Y, Guo W, Fang S, He B, Li X, Fan L. miR-1270 enhances the proliferation, migration, and invasion of osteosarcoma via targeting cingulin. Eur J Histochem (2021) 65(4):3237. doi: 10.4081/ejh.2021.3237
45. Gatza CE, Oh SY. Roles for the type III TGF-beta receptor in human cancer. Cell Signal (2010) 22:1163–74. doi: 10.1016/j.cellsig.2010.01.016
46. Finger EC, Turley RS, Dong M, How T, Fields TA, Blobe GC, et al. TbetaR III suppresses non-small cell lung cancer invasiveness and tumorigenicity. Carcinogenesis (2008) 29:528–35. doi: 10.1093/carcin/bgm289
47. Gordon KJ, Dong M, Chislock EM, Fields TA, Blobe GC. Loss of type III transforming growth factor beta receptor expression increases motility and invasiveness associated with epithelial to mesenchymal transition during pancreatic cancer progression. Carcinogenesis (2008) 29:252–62. doi: 10.1093/carcin/bgm249
48. Turley RS, Finger EC, Hempel N, How T, Fields TA, Blobe GC. The type III transforming growth factor-beta receptor as a novel tumor suppressor gene in prostate cancer. Cancer Res (2007) 67:1090–8. doi: 10.1158/0008-5472.CAN-06-3117
49. Lee JD, Hempel N, Lee NY, Blobe GC. The type III TGF-beta receptor suppresses breast cancer progression through GIPC-mediated inhibition of TGF-beta signaling. Carcinogenesis (2010) 31:175–83. doi: 10.1093/carcin/bgp271
50. Nishida J, Miyazono K, Ehata S. Decreased TGFBR3/betaglycan expression enhances the metastatic abilities of renal cell carcinoma cells through TGF-β-dependent and -independent mechanisms. Oncogene (2018) 37(16):2197–212. doi: 10.1038/s41388-017-0084-0
51. Yang L, Pang Y, Moses HL. TGF-beta and immune cells: an important regulatory axis in the tumor microenvironment and progression. Trends Immunol (2010) 31(6):220–7. doi: 10.1016/j.it.2010.04.002
52. Bai D, Feng H, Yang J, Yin A, Qian A, Sugiyama H. Landscape of immune cell infiltration in clear cell renal cell carcinoma to aid immunotherapy. Cancer Sci (2021) 112(6):2126–39. doi: 10.1111/cas.14887
53. Nakayama T, Saito K, Kumagai J, Nakajima Y, Kijima T, Yoshida S, et al. Higher serum c-reactive protein level represents the immunosuppressive tumor microenvironment in patients with clear cell renal cell carcinoma. Clin Genitourin cancer (2018) 16(6):e1151–e8. doi: 10.1016/j.clgc.2018.07.027
54. Li JF, Chu YW, Wang GM, Zhu TY, Rong RM, Hou J, et al. The prognostic value of peritumoral regulatory T cells and its correlation with intratumoral cyclooxygenase-2 expression in clear cell renal cell carcinoma. BJU Int (2009) 103(3):399–405. doi: 10.1111/j.1464-410X.2008.08151.x
55. Bruni D, Angell HK, Galon J. The immune contexture and immunoscore in cancer prognosis and therapeutic efficacy. Nat Rev Cancer (2020) 20(11):662–80. doi: 10.1038/s41568-020-0285-7
56. Evrard D, Szturz P, Tijeras-Raballand A, Astorgues-Xerri L, Abitbol C, Paradis V, et al. Macrophages in the microenvironment of head and neck cancer: potential targets for cancer therapy. Oral Oncol (2019) 88:29–38. doi: 10.1016/j.oraloncology.2018.10.040
57. Pan Q, Wang L, Chai S, Zhang H, Li B. The immune infiltration in clear cell renal cell carcinoma and their clinical implications: A study based on TCGA and GEO databases. J Cancer (2020) 11(11):3207–15. doi: 10.7150/jca.37285
58. Zhang Y, Chen X, Fu Q, Wang F, Zhou X, Xiang J, et al. Comprehensive analysis of pyroptosis regulators and tumor immune microenvironment in clear cell renal cell carcinoma. Cancer Cell Int (2021) 21(1):667. doi: 10.1186/s12935-021-02384-y
59. Powles T, Plimack ER, Soulières D, Waddell T, Stus V, Gafanov R, et al. Pembrolizumab plus axitinib versus sunitinib monotherapy as first-line treatment of advanced renal cell carcinoma (KEYNOTE-426): extended follow-up from a randomised, open-label, phase 3 trial. Lancet Oncol (2020) 21(12):1563–73. doi: 10.1016/S1470-2045(20)30436-8
Keywords: TGF-β signaling, clear cell renal cell carcinoma, prognosis signature, immune infiltration, biomarkers
Citation: Wu X, Xie W, Gong B, Fu B, Chen W, Zhou L and Luo L (2023) Development of a TGF-β signaling-related genes signature to predict clinical prognosis and immunotherapy responses in clear cell renal cell carcinoma. Front. Oncol. 13:1124080. doi: 10.3389/fonc.2023.1124080
Received: 14 December 2022; Accepted: 16 January 2023;
Published: 27 January 2023.
Edited by:
Shafiq Khan, Clark Atlanta University, United StatesCopyright © 2023 Wu, Xie, Gong, Fu, Chen, Zhou and Luo. This is an open-access article distributed under the terms of the Creative Commons Attribution License (CC BY). The use, distribution or reproduction in other forums is permitted, provided the original author(s) and the copyright owner(s) are credited and that the original publication in this journal is cited, in accordance with accepted academic practice. No use, distribution or reproduction is permitted which does not comply with these terms.
*Correspondence: Lianmin Luo, 372912527@qq.com
†These authors have contributed equally to this work