 Chongfeng Duan1
 Xuejun Liu
 Wenjian Xu
- 1Department of Radiology, The Affiliated Hospital of Qingdao University, Qingdao, China
- 2Department of Information Management, The Affiliated Hospital of Qingdao University, Qingdao, China
Objectives: The objective of this study was to compare the predictive performance of 2D and 3D radiomics features in meningioma grade based on enhanced T1 WI images.
Methods: There were 170 high grade meningioma and 170 low grade meningioma were selected randomly. The 2D and 3D features were extracted from 2D and 3D ROI of each meningioma. The Spearman correlation analysis and least absolute shrinkage and selection operator (LASSO) regression were used to select the valuable features. The 2D and 3D predictive models were constructed by naive Bayes (NB), gradient boosting decision tree (GBDT), and support vector machine (SVM). The ROC curve was drawn and AUC was calculated. The 2D and 3D models were compared by Delong test of AUCs and decision curve analysis (DCA) curve.
Results: There were 1143 features extracted from each ROI. Six and seven features were selected. The AUC of 2D and 3D model in NB, GBDT, and SVM was 0.773 and 0.771, 0.722 and 0.717, 0.733 and 0.743. There was no significant difference in two AUCs (p=0.960, 0.913, 0.830) between 2D and 3D model. The 2D features had a better performance than 3D features in NB models and the 3D features had a better performance than 2D features in GBDT models. The 2D features and 3D features had an equal performance in SVM models.
Conclusions: The 2D and 3D features had a comparable performance in predicting meningioma grade. Considering the issue of time and labor, 2D features could be selected for radiomics study in meningioma.
Key points: There was a comparable performance between 2D and 3D features in meningioma grade prediction. The 2D features was a proper selection in meningioma radiomics study because of its time and labor saving.
Introduction
According to the World Health Organization (WHO) classification of tumors of the central nervous system published in 2021 (1), meningioma can be classified into three subtypes: grade 1, grade 2 and grade 3. Grade 1 is low-grade tumors, while grades 2 and 3 are high-grade tumors. The selection of therapy strategy and prognosis are different for low- and high-grade meningioma because of their different biological characteristics (2–4). High-grade meningioma grows aggressively and invades the surrounding structures. Therefore, there is a poor prognosis for patients with high-grade meningioma. As its main treatment, surgical resection is essential for high-grade meningioma (2). Other therapies, such as hormone therapy, cytotoxic chemotherapy or targeted therapy, are complementary choices for tumors that cannot be resected completely (5). Low-grade meningioma grows slowly and rarely shows invasion. Thus, patients with low-grade meningioma usually have a better outcome. Regular follow-up or radiotherapy can be better choices than surgery (6). Given this clinical context, a clear preoperative diagnosis of meningioma and establishing its grade have crucial roles in guiding treatment decisions.
Radiomics has been used widely in recent years (7–9). Many researchers have applied radiomics in the study of meningioma, especially the prediction of meningioma grade (10–15) (Table 1). In previous studies, there were two different methods applied to feature extraction: two-dimensional (2D) radiomics features (10, 11) and three-dimensional (3D) radiomics features (12–15). To the best of our knowledge, no study has directly compared the performance of 2D and 3D radiomics features in predicting meningioma grade. In our opinion, this is a very important issue due to the wide use of radiomics in clinical practice.
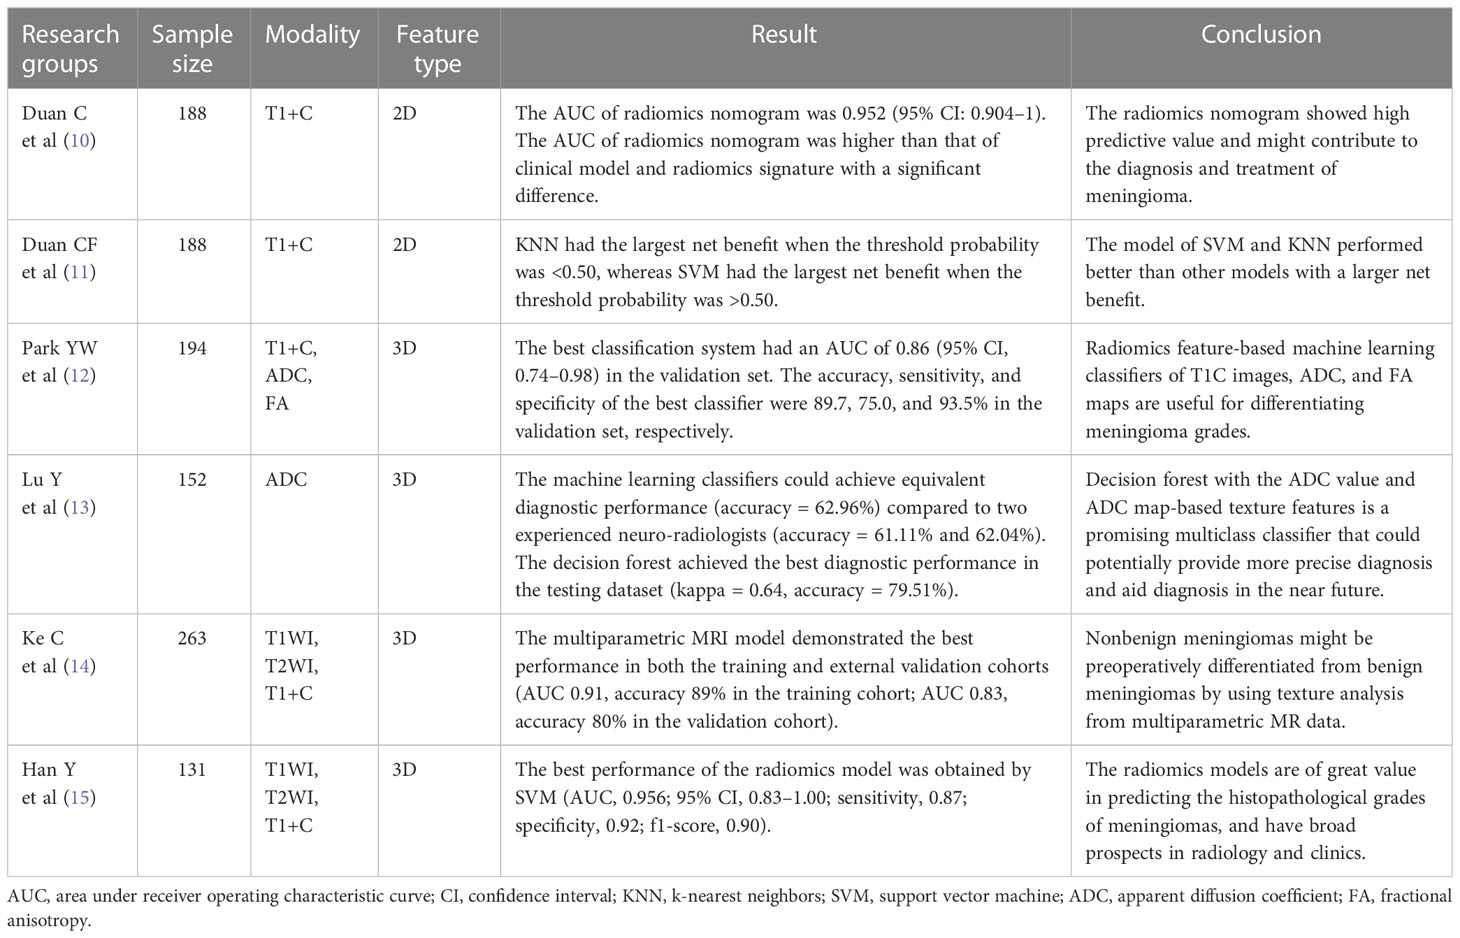
Table 1 Summary of previous studies of radiomics in predicting meningioma grade.
The purpose of this study was to compare the performance between 2D and 3D features to predict meningioma grade based on enhanced T1-weighted imaging (T1WI). Our aim was to identify the best method and provide a reference for future meningioma radiomics research.
Materials and methods
Patients
The ethics review board of our institution approved this retrospective study and waived the requirement for informed consent. We searched for meningioma patients treated at our hospital who accepted surgical resection from January 2012 to January 2022 and selected those meeting the criteria. The inclusion criteria were: (1) the enhanced T1 WI examination was performed one week before surgery, (2) the patients did not receive any treatment before MRI examination, (3) a clear pathology diagnosis and grade of the meningioma was made after surgery, and (4) the image quality was satisfactory for further analysis. The exclusion criteria were: (1) the pathological grade of the meningioma was unclear and (2) the artifacts on the MRI images were severe and they were not suitable for further analysis.
There were 170 high-grade meningiomas meeting the inclusion criteria, including 144 cases of WHO grade 2 meningiomas and 26 cases of WHO grade 3 meningiomas. These 170 cases formed the high-grade group. The number of low-grade meningiomas was more than 1000 cases and far greater than that of high-grade meningiomas. To avoid statistical bias, we randomly selected 170 cases of low-grade meningioma to form the low-grade group to match the high-grade group. Finally, our study included 340 cases of meningioma.
MRI examination
All patients received enhanced T1 WI examination before surgery. The magnetic resonance imaging (MRI) machines included GE Signa 1.5T/3.0T MRI and Siemens Prisma/Skyra 3.0T MRI. The scan parameters were: TR=1800 ms, TE=10 ms, FOV=25 cm, and slice thickness=5 mm. Every patient was administered 0.1 ml/kg Gd-DTPA before the MRI examination.
Image preprocessing and tumor segmentation
The images were downloaded as Digital Imaging and Communications in Medicine (DICOM) files from the picture archiving and communications system (PACS) workstation and uploaded to 3D Slicer software (version 4.11, https://www.slicer.org/). Image preprocessing was performed with 3D Slicer to standardize the data across the patients. The “N4ITK MRI bias correction” was performed to remove unwanted low-frequency intensity nonuniformity (16). We used the same “bin width” of 25 to normalize the image intensities from different MRI machines or acquisition protocols. The image was resampled with a 1 × 1 × 1 mm3 voxel size to ensure the conservation of scales and directions (17).
The ROI of the tumor was drawn with two methods. The 2D ROI was drawn with the largest cross-sectional area of the tumor, while the 3D ROI was drawn with all of the slices of the tumor (Figure 1). A 2D ROI and a 3D ROI were made in each tumor.
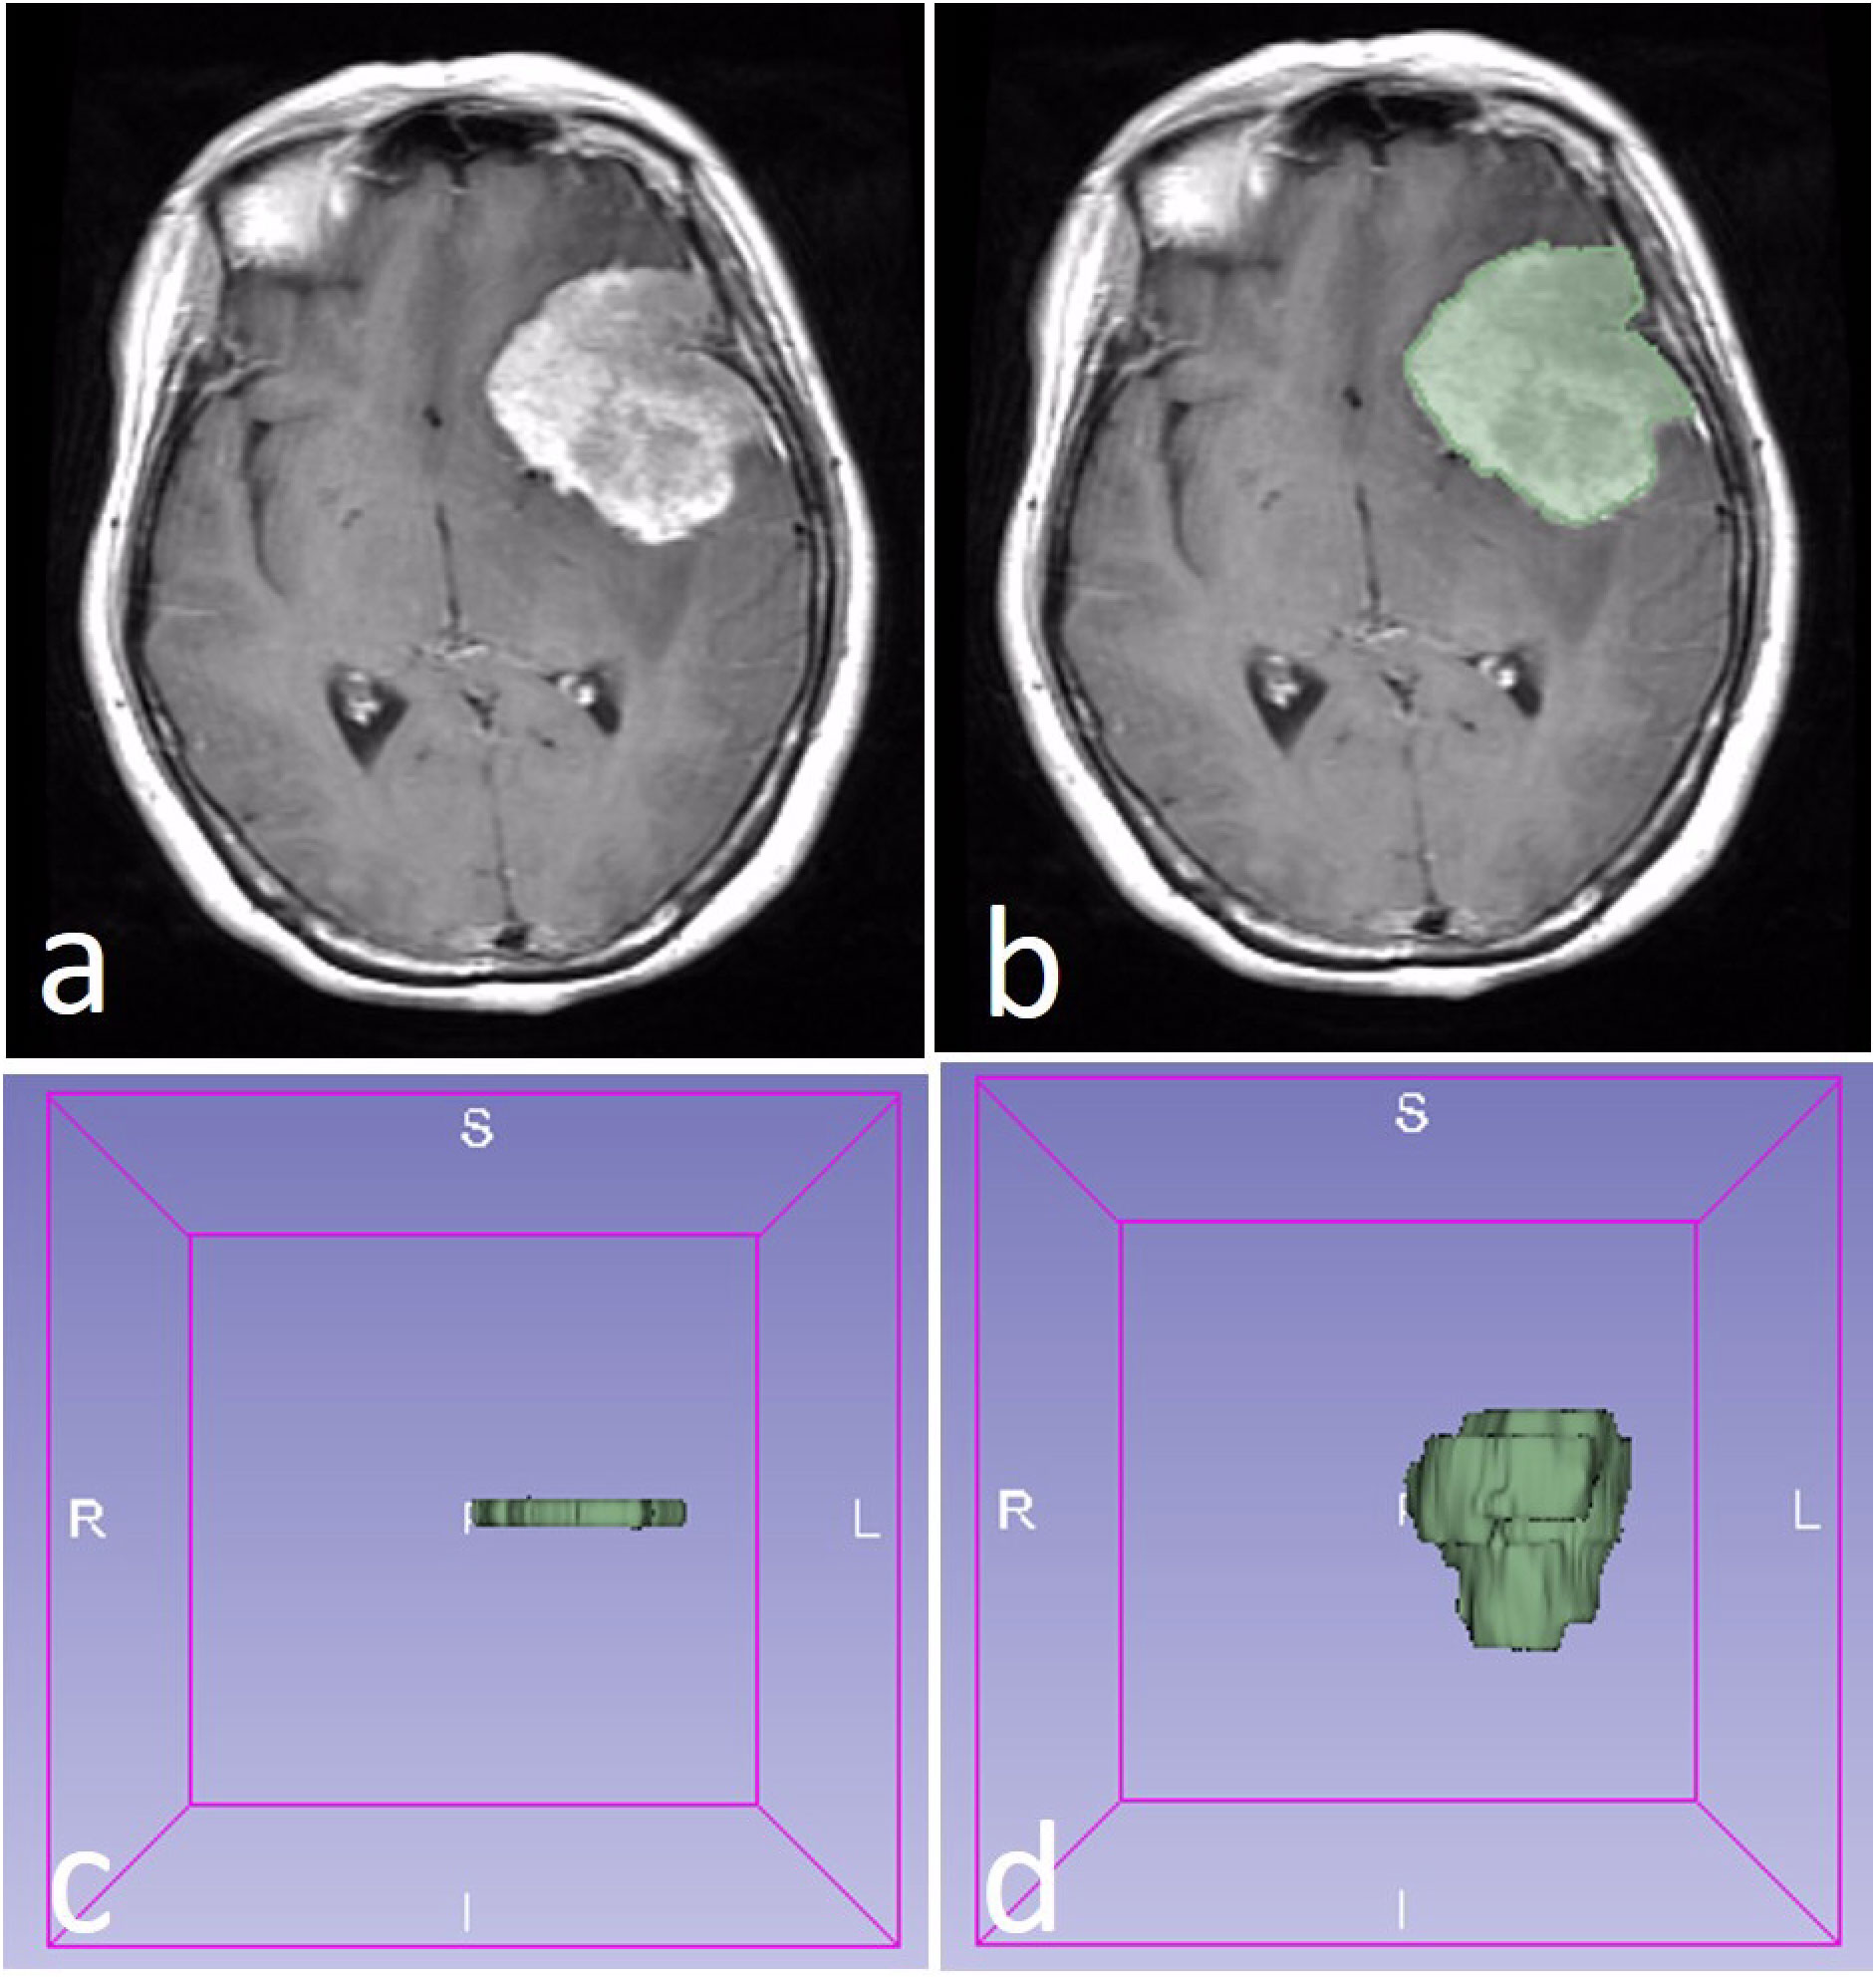
Figure 1 A WHO 2 grade meningioma in a 58-year-old female patient (A). The region of interest (ROI) was drawn along with the edge of the tumor (B). The 2D ROI (C) and 3D ROI (D) were performed in the tumor.
Radiomics feature extraction
Radiomics in 3D Slicer was used to extract features for each ROI. There were eight feature groups: first-order, gray-level co-occurrence matrix (GLCM), gray-level dependence matrix (GLDM), gray-level run length matrix (GLRLM), gray-level size zone matrix (GLSZM), neighboring gray-tone difference matrix (NGTDM), shape and wavelet. Finally, we obtained the 2D features and 3D features.
The intraclass correlation coefficient (ICC) was calculated to select the stable features. Forty meningiomas (20 low-grade and 20 high-grade) were selected randomly for ICC calculation. Two neuroradiologists drew the ROI of 40 cases independently. The ICC calculation model was a single rater, absolute agreement, two-way random-effects model (18). We selected the features with high stability (ICC≥0.8) for further analysis.
Spearman’s rank correlation coefficient was analyzed for the selected features to evaluate the relativity with meningioma grade. The features showing relativity (P<0.05) were retained for the next step.
Least absolute shrinkage and selection operator (LASSO) regression was applied to reduce the dimensions of the features after ICC calculation and Spearman correlation analysis. The valuable features were selected for model construction.
Model construction
The selected features after LASSO were used to construct a predictive model with naive Bayes (NB), gradient boosting decision tree (GBDT), and support vector machine (SVM). The data were divided randomly into a training set (accounting for 70%; 238 cases) and a validation set (accounting for 30%; 102 cases) in each model. Then, 10-fold cross-validation was applied. The model constructed by 2D features and 3D features were defined as the 2D model and 3D model. The ROC curve was drawn, and the AUC of each model was calculated. The Delong text of AUC in each machine learning method was used to evaluate the performance of the two models. The clinical usefulness of the two models was evaluated by calculating the net benefits with decision curve analysis (DCA) (19). The radiomics workflow was shown in Figure 2.
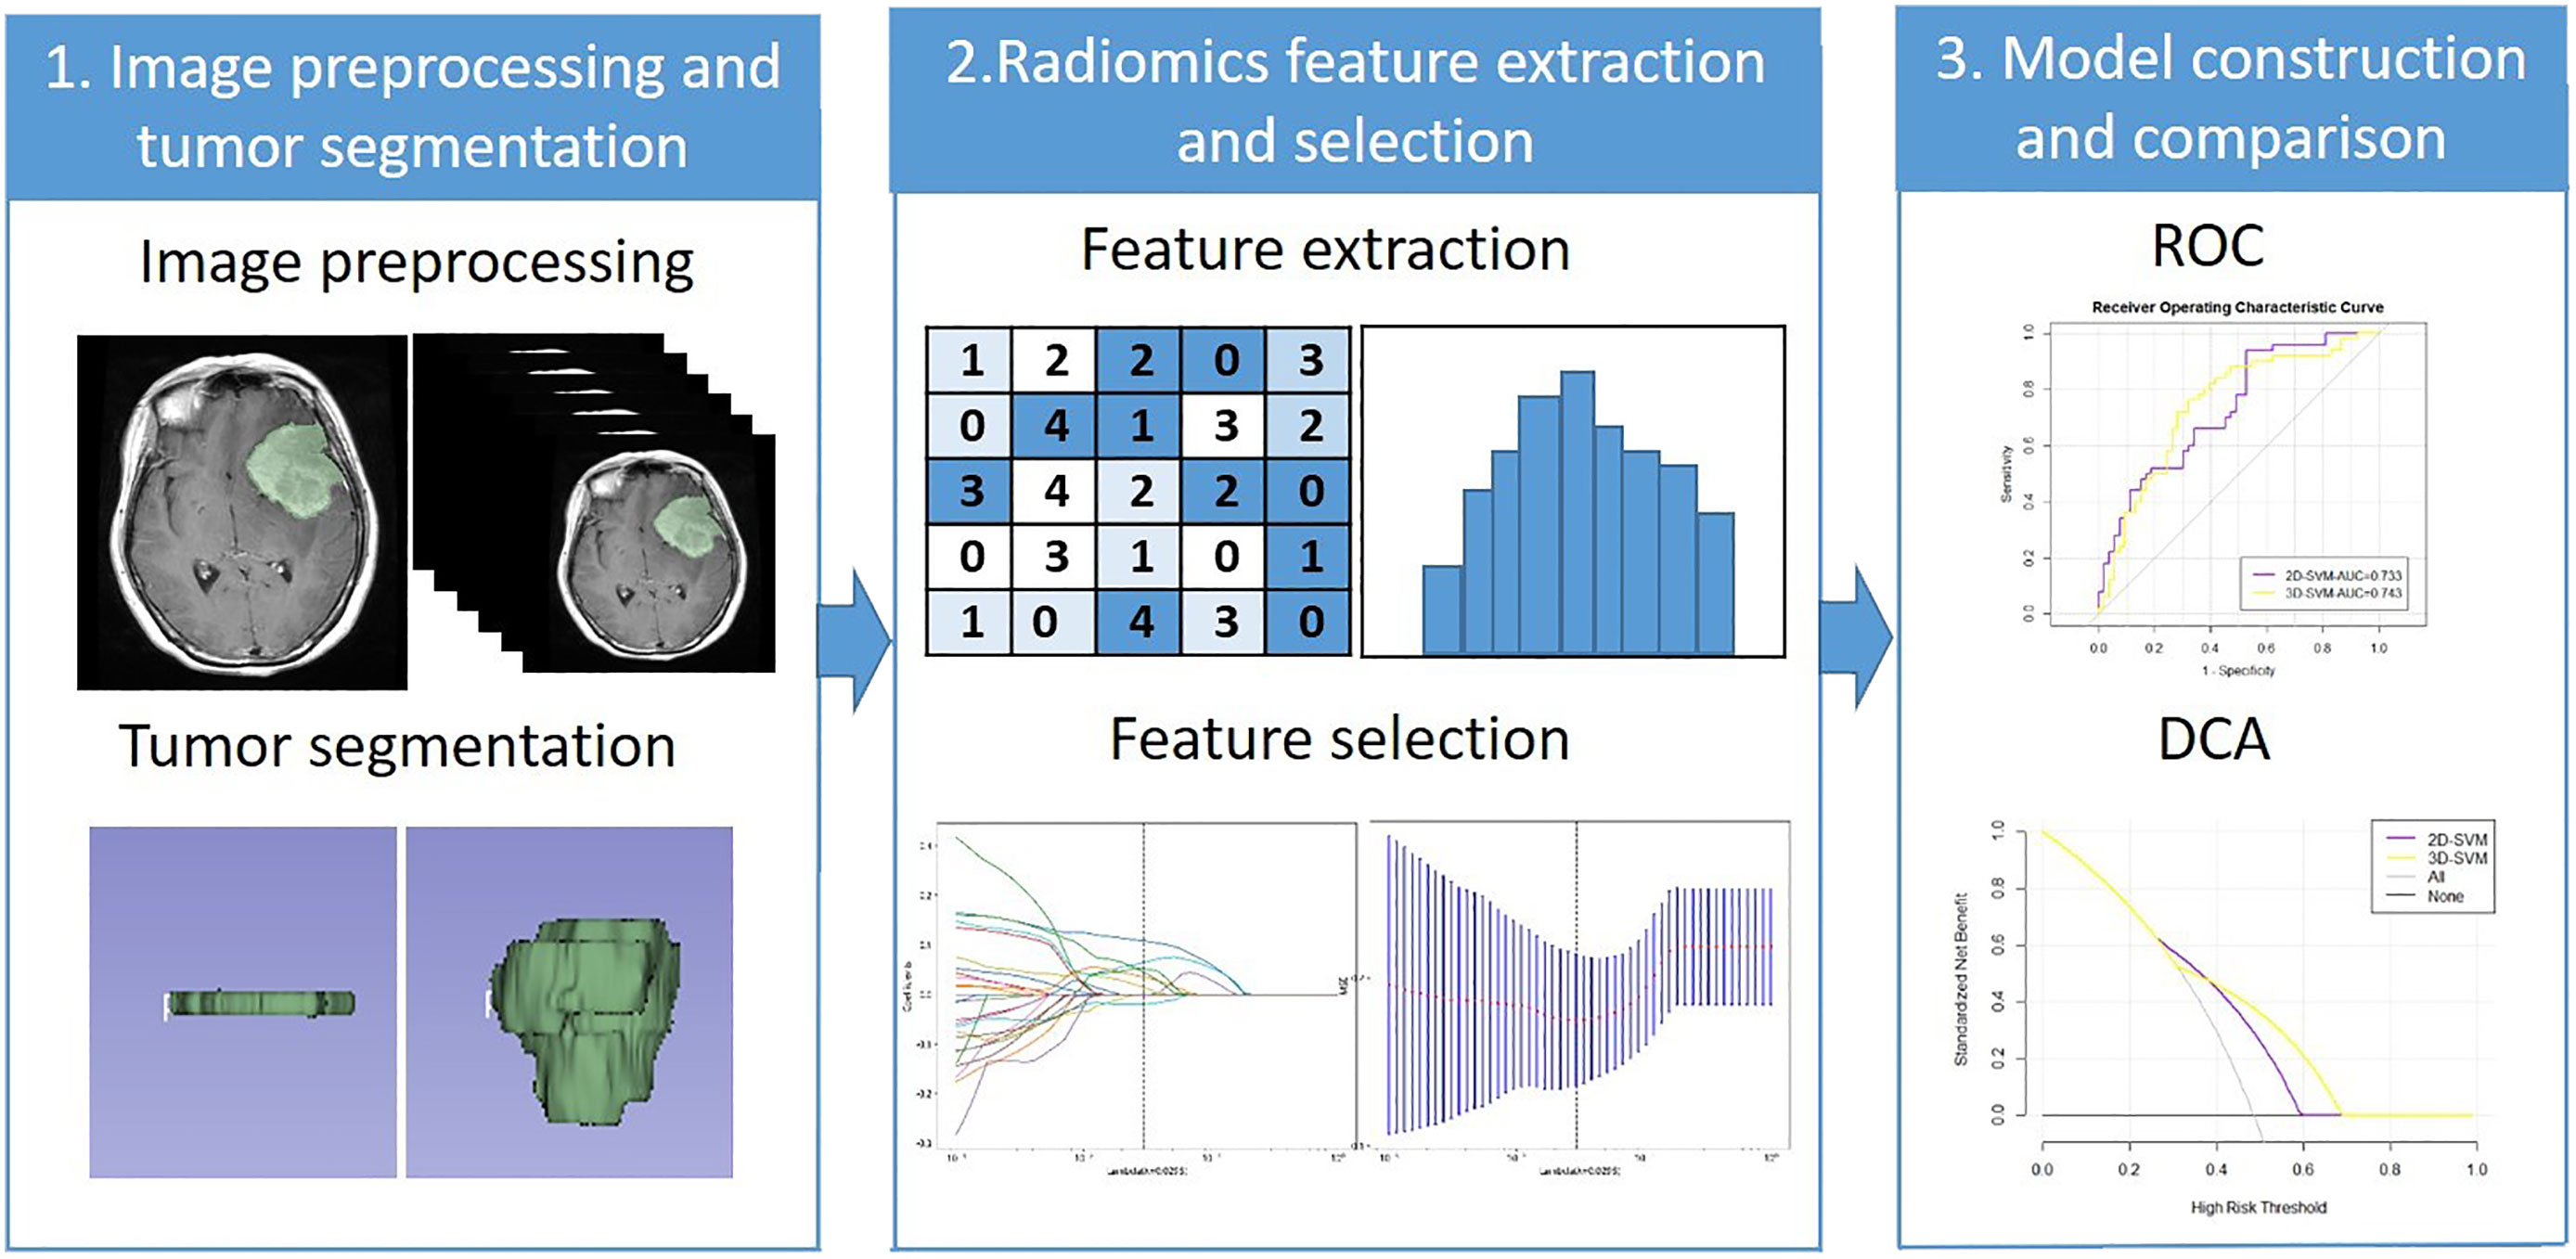
Figure 2 The radiomics workflow. ROC, Receiver operating characteristic; DCA, Decision curve analysis.
Statistical analysis
R software (https://www.r-project.org/) was used for statistical analysis. The “irr” package, “tidyr and dplyr” package, and “lars” package were applied for ICC calculation, Spearman correlation analysis and LASSO regression. The “e1071” “gbm” package was applied for the NB, GBDT, and SVM model construction. The “pROC” package and “rmda” package were applied for the ROC curve and DCA curve drawing. p<0.05 was considered statistically significant.
Results
The number of 2D and 3D features was 1143 in total. There were 1068 2D features that showed high stability (ICC≥0.8) and 986 3D features. Among these features, 294 features and 393 features were found with relativity (P<0.05) in the 2D and 3D features. A total of 6 and 7 features were selected by LASSO regression as the 2D and 3D features, respectively. The selected features and their groups are shown in Table 2.
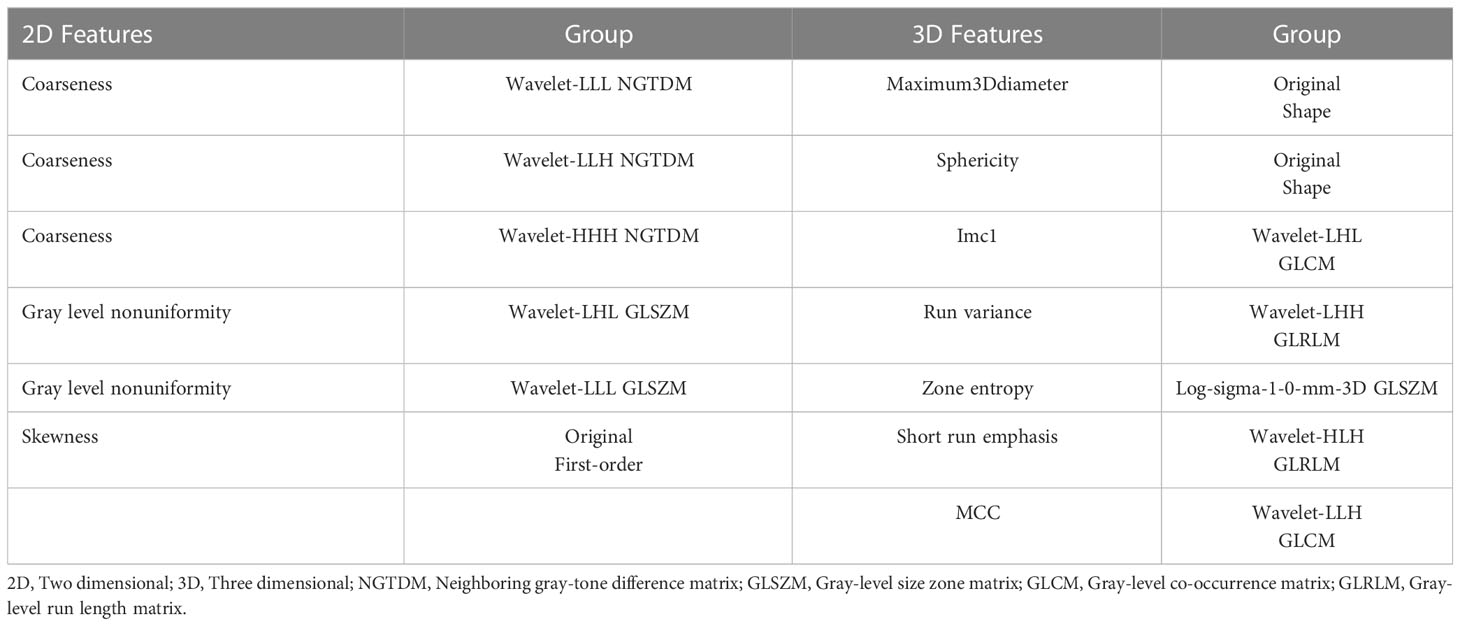
Table 2 The selected features and their group.
The ROC curve and AUC of the 2D and 3D models in each machine learning method are shown in Table 3 and Figure 3. The AUCs of the 2D and 3D models were 0.773 and 0.771, respectively, in NB; were 0.722 and 0.717, respectively, in GBDT; and were 0.733 and 0.743, respectively, in the SVM. There were no significant differences in the AUCs (p=0.960, 0.913, 0.830) between the two models for NB, GBDT, or SVM by Delong text (Table 3).
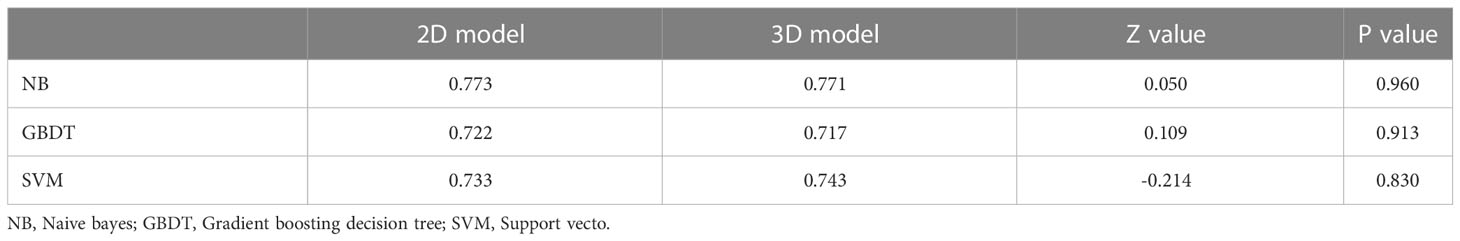
Table 3 The AUCs of different methods and results of Delong text.
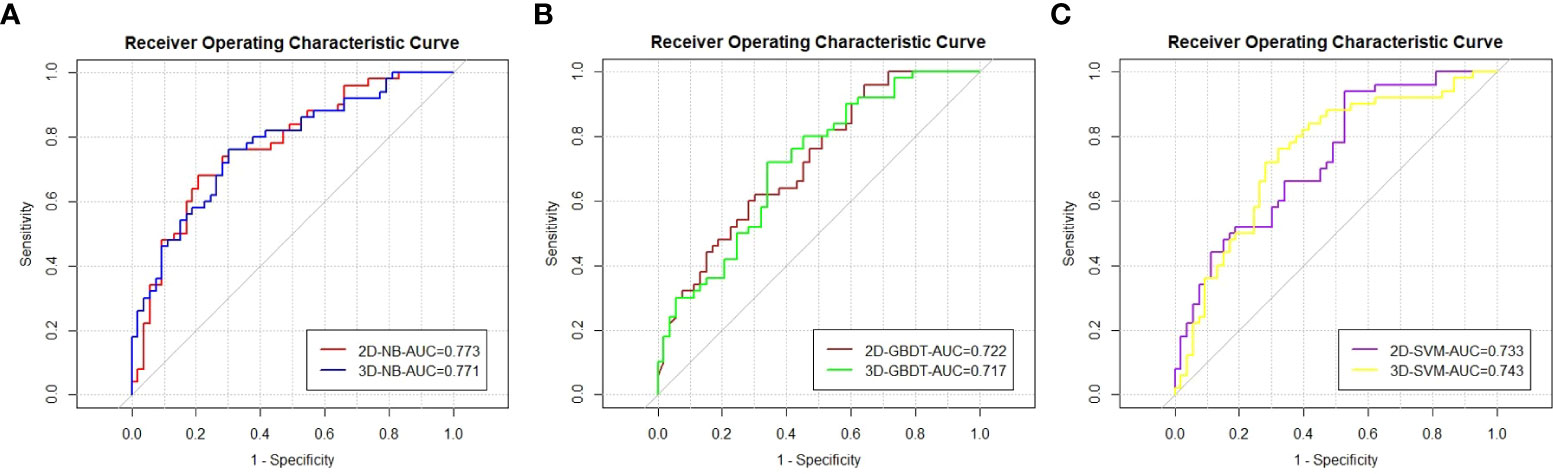
Figure 3 The ROC curves and AUC values of the models by the Naive bayes (A), Gradient boosting decision tree (B), and Support vector machine (C).
The DCA curve is represented in Figure 4. The two models had different performances. The 2D model had a better performance than the 3D model in NB because the 2D model had a larger net benefit than the 3D model across most ranges of the threshold probability. In contrast, the 3D model performed better than the 2D model in GBDT due to its larger net benefit in all threshold probabilities. An intersection of two models at the point of nearly 0.4 can be found in SVM. The 2D model had a better performance to the left of the intersection, while the 3D model had a better performance to the right of the intersection. The models constructed by NB, GBDT, and SVM with 2D and 3D features performed equally well.
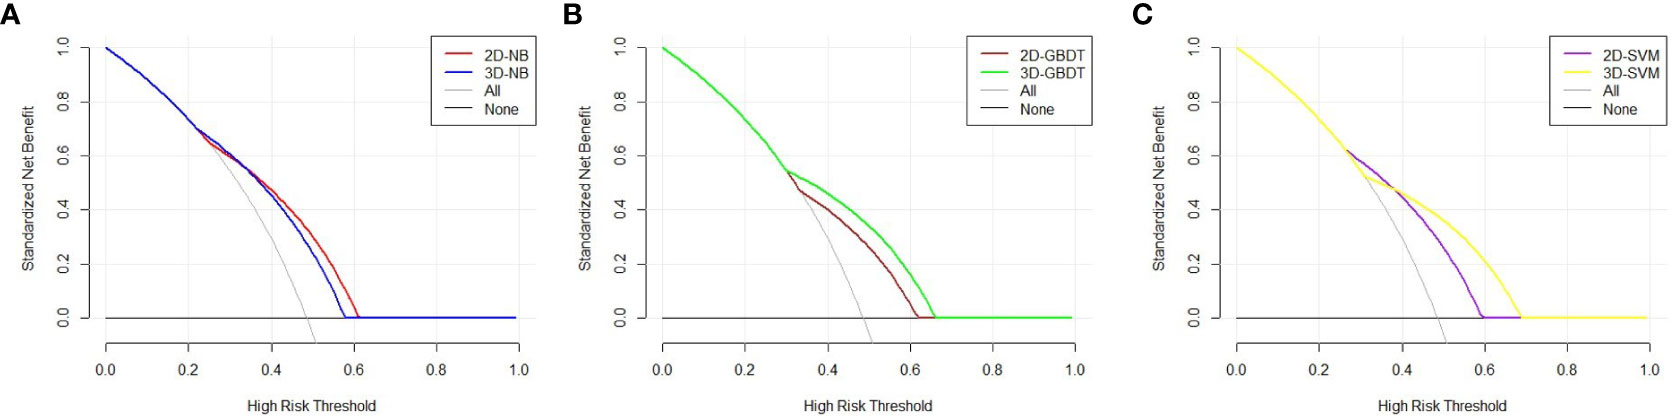
Figure 4 Decision curve analysis of the two models in each machine learning classify. The X axis represents the threshold probability, and the Y axis represents the net benefit. The 2D model has a better performance than 3D model in NB, because 2D model has a larger net benefit than 3D model across most range of the threshold probability (A). The 3D model performs better than 2D model in GBDT due to its larger net benefit in all the threshold probability (B). An intersection of two models at the point of nearly 0.4 can be found in SVM. The 2D model has a better performance at the left of the intersection, while 3D model has a better performance at the right of the intersection (C).
Discussion
In the present study, we compared the performance of 2D and 3D features for meningioma grade prediction. We found that there was no significant difference in AUC, and they performed equally in DCA by different machine learning methods. To the best of our knowledge, this is the first study to compare the performance of 2D and 3D features for meningioma grade prediction.
Previous studies aiming to predict meningioma grade applied different methods for feature extraction. Either 2D or 3D features were used in the previous studies. Duan CF et al. (11) used 2D features to compare different models for predicting meningioma grade. In their study, seven models constructed by 2D features performed well with a high AUC (all>0.80), and SVM and KNN performed better than the other models with an AUC of 0.88 and a larger net benefit in the DCA curve. Duan C et al. (10) first constructed a radiomics nomogram to predict meningioma grade with 2D features. Their radiomics nomogram had a good predictive value. The AUC (0.95) of the radiomics nomogram was significantly higher than that of the other models (p<0.05).
Compared to 2D features, 3D features may be used more widely in meningioma studies. Park YW et al. (12) applied 3D features to machine learning classifiers for meningioma grade and subtype prediction. The most valuable predictive classifier had an AUC of 0.86. Hu J et al. (20) found that a radiomic model based on multiparametric MRI 3D features efficiently predicted meningioma grade. The best model achieved AUCs of 0.84 and 0.81 without or with subsampling, respectively. There were also other studies using 3D features (21, 22). Ugga L et al. (23) argued that adequate standardization of radiomics in meningioma was necessary in future study. Although 2D or 3D features were used in previous studies, their relative performances remained unknown before this study.
Some studies have compared the performance of 2D and 3D features in other diseases (24–27). Shen C et al. (24) found that 2D features (AUC=0.755, validation cohort) had a better performance than 3D features (AUC=0.663, validation cohort) in the prognostic ability of non-small cell lung cancer. Yang G et al. (25) showed that 2D CT texture analysis signature performed better than 3D in predicting lymphovascular invasion in lung adenocarcinoma patients. The AUC of the 2D signature (0.938) was significantly higher than that of the 3D signature (0.753) (P < 0.001). Arefan D et al. (26) reported that the AUC difference between 2D and 3D analysis was not statistically significant when they used MRI radiomics to distinguish axillary lymph node status breast cancer patients. Meng L et al. (27) found that 2D radiomics features had a comparable performance compared with 3D features in characterizing preoperative gastric cancer. In these previous studies, 2D features had a better or equal performance than 3D features.
Researchers have tried to explain the possible mechanisms for the results of the above studies. Shen C et al. (24) gave two reasons for their result. First, it was difficult to conform the consistent resolutions of the CT images and the same transverse plane resolutions in retrospective studies. Second, there may be a slight deviation of the original definition of 3D feature calculation, especially in MRI or PET images because of their thicker layers. Yang G et al. (25) explained that it was mainly related to the technical method of feature calculation. Arefan D et al. (26) considered that a representative slice in 2D features could capture most of the characteristics of the tumor conveyed in the 3D features. Meng L et al. (27) argued that there was more noise in 3D features than 2D features, although 3D features were considered to contain more information. The noise suffered from two aspects: multiple vague lesion boundaries and the higher susceptibility to different thicknesses in 3D features.
In the present study, we found that 2D features had a comparable performance with 3D features. In our opinion, the reasons were similar to those in previous studies. We used the largest cross-sectional area of the tumor to draw the ROI and extracted 2D features. The largest cross-section slice could represent most of the information of the tumor, including size, shape, signal intensity, homogeneous or heterogeneous enhancement, and so on.
The 3D features did not present a better performance than 2D features for several reasons. The routine slice thickness was 5 mm, which is widely used clinically. This slice thickness is relatively high. Therefore, it was difficult to ensure that the ROI was 3D in the true sense. Generally, the so-called 3D ROI might just be a composite of multi2D ROIs. On the other hand, 3D features could suffer from more noise with the increase in slices, especially in tumors with indistinct edges. For example, if a 3D ROI had ten slices, the radiologist would have to draw the tumor edge ten times. However, the radiologist merely drew the edge one time in the 2D ROI. There was more interference from the surrounding structures in the 3D ROI.
This study had some limitations. First, the nature of a retrospective study could lead to selection bias and accuracy overestimation of the performance. Second, the sample capacity of high-grade meningioma was larger than that in most previous studies. The results of the present study need further validation in a larger sample. Third, there was no external validation because of the lack of data from other research centers or hospitals. We will add external validation and a multicenter study in the future.
Conclusion
The present study compared the predictive value of 2D and 3D radiomics features for meningioma grade. The 2D features had a comparable performance with 3D features. Given the time and labor savings, 2D features can be used in meningioma radiomics studies. Our results provide a reference for future radiomics studies of meningioma.
Data availability statement
The raw data supporting the conclusions of this article will be made available by the authors, without undue reservation.
Ethics statement
The studies involving human participants were reviewed and approved by The Affiliated Hospital of Qingdao University. Written informed consent for participation was not required for this study in accordance with the national legislation and the institutional requirements.
Author contributions
CD: Conceptualization, methodology, software. NL: Data curation, writing- original draft preparation. XL: Software, validation. JC: Supervision. GW: Visualization, investigation. WX: Writing- reviewing and editing. All authors contributed to the article and approved the submitted version.
Conflict of interest
The authors declare that the research was conducted in the absence of any commercial or financial relationships that could be construed as a potential conflict of interest.
Publisher’s note
All claims expressed in this article are solely those of the authors and do not necessarily represent those of their affiliated organizations, or those of the publisher, the editors and the reviewers. Any product that may be evaluated in this article, or claim that may be made by its manufacturer, is not guaranteed or endorsed by the publisher.
Abbreviations
2D, Two dimensional; 3D, Three dimensional; AUC, Area under the receiver operating characteristic curve; DCA, Decision curve analysis; DICOM, Digital imaging and communications in medicine; GBDT, Gradient boosting decision tree; GLCM, Gray-level co-occurrence matrix; GLDM, Gray-level dependence matrix; GLRLM, Gray-level run length matrix; GLSZM, Gray-level size zone matrix; ICC, Intraclass correlation coefficient; LASSO, Least absolute shrinkage and selection operator; NB, Naive bayes; NGTDM, Neighboring gray-tone difference matrix; PACS, Picture archiving and communications system; ROC, Receiver operating characteristic; ROI, Region of interest; SVM, Support vector machine; T1 WI T1, weighted image; WHO, World health organization.
References
1. WHO Classification of Tumours Editorial Board. World health organization classification of tumours of the central nervous system. 5th ed. Lyon: International Agency for Research on Cancer (2021).
2. Rogers L, Barani I, Chamberlain M, Kaley TJ, McDermott M, Raizer J, et al. Meningiomas: knowledge base, treatment outcomes, and uncertainties. a RANO review. J Neurosurg (2015) 122(1):4–23. doi: 10.3171/2014.7.JNS131644
3. Goldbrunner R, Minniti G, Preusser M, Jenkinson MD, Sallabanda K, Houdart E, et al. EANO guidelines for the diagnosis and treatment of meningiomas. Lancet Oncol (2016) 17(9):e383–91. doi: 10.1016/S1470-2045(16)30321-7
4. Whittle IR, Smith C, Navoo P, Collie D. Meningiomas. Lancet. (2004) 363(9420):1535–43. doi: 10.1016/S0140-6736(04)16153-9
5. Li D, Jiang P, Xu S, Li C, Xi S, Zhang J, et al. Survival impacts of extent of resection and adjuvant radiotherapy for the modern management of high-grade meningiomas. J Neurooncol (2019) 145(1):125–34. doi: 10.1007/s11060-019-03278-w
6. Black PM, Villavicencio AT, Rhouddou C, Loeffler JS. Aggressive surgery and focal radiation in the management of meningiomas of the skull base: preservation of function with maintenance of local control. Acta Neurochir (Wien) (2001) 143(6):555–62. doi: 10.1007/s007010170060
7. Gillies RJ, Kinahan PE, Hricak H. Radiomics: Images are more than pictures, they are data. Radiology. (2016) 278(2):563–77. doi: 10.1148/radiol.2015151169
8. Kumar V, Gu Y, Basu S, Berglund A, Eschrich SA, Schabath MB, et al. Radiomics: the process and the challenges. Magn Reson Imaging (2012) 30(9):1234–48. doi: 10.1016/j.mri.2012.06.010
9. Lambin P, Rios-Velazquez E, Leijenaar R, Rios-Velazquez E, Leijenaar R, Carvalho S, van Stiphout RG, Granton P, et al. Radiomics: extracting more information from medical images using advanced feature analysis. Eur J Cancer (2012) 48(4):441–6. doi: 10.1016/j.ejca.2011.11.036
10. Duan C, Zhou X, Wang J, Li N, Liu F, Gao S, et al. A radiomics nomogram for predicting the meningioma grade based on enhanced T1WI images. Br J Radiol (2022) 95(1137):20220141. doi: 10.1259/bjr.20220141
11. Duan CF, Li N, Li Y, Liu F, Wang JC, Liu XJ, et al. Comparison of different radiomic models based on enhanced T1-weighted images to predict the meningioma grade. Clin Radiol (2022) 77(4):e302–7. doi: 10.1016/j.crad.2022.01.039
12. Park YW, Oh J, You SC, Han K, Ahn SS, Choi YS, et al. Radiomics and machine learning may accurately predict the grade and histological subtype in meningiomas using conventional and diffusion tensor imaging. Eur Radiol (2019) 29(8):4068–76. doi: 10.1007/s00330-018-5830-3
13. Lu Y, Liu L, Luan S, Xiong J, Geng D, Yin B. The diagnostic value of texture analysis in predicting WHO grades of meningiomas based on ADC maps: an attempt using decision tree and decision forest. Eur Radiol (2019) 29(3):1318–28. doi: 10.1007/s00330-018-5632-7
14. Ke C, Chen H, Lv X, Li H, Zhang Y, Chen M, et al. Differentiation between benign and nonbenign meningiomas by using texture analysis from multiparametric MRI. J Magn Reson Imaging (2020) 51(6):1810–20. doi: 10.1002/jmri.26976
15. Han Y, Wang T, Wu P, Zhang H, Chen H, Yang C. Meningiomas: Preoperative predictive histopathological grading based on radiomics of MRI. Magn Reson Imaging (2021) 77:36–43. doi: 10.1016/j.mri.2020.11.009
16. Tustison NJ, Avants BB, Cook PA, Zheng Y, Egan A, Yushkevich PA, et al. N4ITK: improved N3 bias correction. IEEE Trans Med Imaging (2010) 29:1310–20. doi: 10.1109/TMI.2010.2046908
17. Depeursinge A, Foncubierta-Rodriguez A, Van De Ville D, Muller H. Three-dimensional solid texture analysis in biomedical imaging: review and opportunities. Med Image Anal (2014) 18:176–96. doi: 10.1016/j.media.2013.10.005
18. Koo TK, Li MY. A guideline of selecting and reporting intraclass correlation coefficients for reliability research. J Chiropr Med (2016) 15:155–63. doi: 10.1016/j.jcm.2016.02.012
19. Vickers AJ, Elkin EB. Decision curve analysis: a novel method for evaluating prediction models. Med Decis Making (2006) 26:565–74. doi: 10.1177/0272989X06295361
20. Hu J, Zhao Y, Li M, Liu J, Wang F, Weng Q, et al. Machine learning-based radiomics analysis in predicting the meningioma grade using multiparametric MRI. Eur J Radiol (2020) 131:109251. doi: 10.1016/j.ejrad.2020.109251
21. Chen C, Guo X, Wang J, Guo W, Ma X, Xu J. The diagnostic value of radiomics-based machine learning in predicting the grade of meningiomas using conventional magnetic resonance imaging: A preliminary study. Front Oncol (2019) 9:1338. doi: 10.3389/fonc.2019.01338
22. Chu H, Lin X, He J, Pang P, Fan B, Lei P, et al. Value of MRI radiomics based on enhanced T1WI images in prediction of meningiomas grade. Acad Radiol (2021) 28(5):687–93. doi: 10.1016/j.acra.2020.03.034
23. Ugga L, Perillo T, Cuocolo R, Stanzione A, Romeo V, Green R, et al. Meningioma MRI radiomics and machine learning: systematic review, quality score assessment, and meta-analysis. Neuroradiology. (2021) 63(8):1293–304. doi: 10.1007/s00234-021-02668-0
24. Shen C, Liu Z, Guan M, Song J, Lian Y, Wang S, et al. 2D and 3D CT radiomics features prognostic performance comparison in non-small cell lung cancer. Transl Oncol (2017) 10(6):886–94. doi: 10.1016/j.tranon.2017.08.007
25. Yang G, Nie P, Zhao L, Guo J, Xue W, Yan L, et al. 2D and 3D texture analysis to predict lymphovascular invasion in lung adenocarcinoma. Eur J Radiol (2020) 129:109111. doi: 10.1016/j.ejrad.2020.109111
26. Arefan D, Chai R, Sun M, Zuley ML, Wu S. Machine learning prediction of axillary lymph node metastasis in breast cancer: 2D versus 3D radiomic features. Med Phys (2020) 47(12):6334–42. doi: 10.1002/mp.14538
Keywords: meningioma, radiomics, magnetic resonance imaging, 2D features, 3D features
Citation: Duan C, Li N, Liu X, Cui J, Wang G and Xu W (2023) Performance comparison of 2D and 3D MRI radiomics features in meningioma grade prediction: A preliminary study. Front. Oncol. 13:1157379. doi: 10.3389/fonc.2023.1157379
Received: 02 February 2023; Accepted: 10 March 2023;
Published: 23 March 2023.
Edited by:
Domenico Solari, Federico II University Hospital, ItalyReviewed by:
Edoardo Agosti, University of Brescia, ItalyLorenzo Ugga, University of Naples Federico II, Italy
Copyright © 2023 Duan, Li, Liu, Cui, Wang and Xu. This is an open-access article distributed under the terms of the Creative Commons Attribution License (CC BY). The use, distribution or reproduction in other forums is permitted, provided the original author(s) and the copyright owner(s) are credited and that the original publication in this journal is cited, in accordance with accepted academic practice. No use, distribution or reproduction is permitted which does not comply with these terms.
*Correspondence: Wenjian Xu, wjxu2021@qdu.edu.cn