 Yi Wang
 Ruoling Han
- Department of Ultrasound, The Fourth Hospital of Hebei Medical University, Shijiazhuang, Hebei, China
Objective: The pathological classification and imaging manifestation of parotid gland tumors are complex, while accurate preoperative identification plays a crucial role in clinical management and prognosis assessment. This study aims to construct and compare the performance of clinical models, traditional radiomics models, deep learning (DL) models, and deep learning radiomics (DLR) models based on ultrasound (US) images in differentiating between benign parotid gland tumors (BPGTs) and malignant parotid gland tumors (MPGTs).
Methods: Retrospective analysis was conducted on 526 patients with confirmed PGTs after surgery, who were randomly divided into a training set and a testing set in the ratio of 7:3. Traditional radiomics and three DL models (DenseNet121, VGG19, ResNet50) were employed to extract handcrafted radiomics (HCR) features and DL features followed by feature fusion. Seven machine learning classifiers including logistic regression (LR), support vector machine (SVM), RandomForest, ExtraTrees, XGBoost, LightGBM and multi-layer perceptron (MLP) were combined to construct predictive models. The most optimal model was integrated with clinical and US features to develop a nomogram. Receiver operating characteristic (ROC) curve was employed for assessing performance of various models while the clinical utility was assessed by decision curve analysis (DCA).
Results: The DLR model based on ExtraTrees demonstrated superior performance with AUC values of 0.943 (95% CI: 0.918-0.969) and 0.916 (95% CI: 0.861-0.971) for the training and testing set, respectively. The combined model DLR nomogram (DLRN) further enhanced the performance, resulting in AUC values of 0.960 (95% CI: 0.940- 0.979) and 0.934 (95% CI: 0.876-0.991) for the training and testing sets, respectively. DCA analysis indicated that DLRN provided greater clinical benefits compared to other models.
Conclusion: DLRN based on US images shows exceptional performance in distinguishing BPGTs and MPGTs, providing more reliable information for personalized diagnosis and treatment plans in clinical practice.
1 Introduction
The parotid gland is a vital exocrine organ and the primary site for salivary gland tumors. Parotid gland tumors (PGTs) account for approximately 3-12% of head and neck neoplasms, with 80% of all salivary gland tumors occurring in this location (1, 2). The majority of these tumors are benign, comprising around 75% to 80%,with pleomorphic adenomas (PA) and Warthin tumors being the most common types, followed by basal cell adenomas (BCA). Mucoepidermoid carcinoma (MEC) is the most frequent malignant parotid gland tumor (MPGTs), followed by adenoid cystic carcinoma (ACC) and acinar cell carcinoma (3, 4). The pathological subtypes of PGTs are complex. Accurate discrimination between benign and malignant PGTs is crucial for clinical management and prognosis assessment. For most benign parotid gland tumors (BPGTs), partial gland or simple tumor resection suffices (5). However, MPGTs often require more aggressive interventions such as total parotidectomy along with potential lymph node dissection, complemented by radiotherapy if deemed necessary (6).
Preoperative auxiliary diagnosis of PGTs primarily involves two methods: fine-needle aspiration cytology (FNAC) and imaging examination. FNAC is currently widely utilized as an adjunctive diagnostic tool, exhibiting an accuracy rate ranging from 85% to 97% in distinguishing between BPGTs and MPGTs (7). However, due to the limited sample size, it may not fully represent the overall characteristics of the tumor, leading to inconclusive diagnoses (8). Furthermore, FNAC is an invasive procedure that carries risks of tumor cell implantation metastasis and inducing parotitis (9). Currently employed imaging techniques for parotid examination include ultrasound (US), computed tomography (CT),and magnetic resonance imaging (MRI). CT can effectively illustrate the relationship between the tumor and surrounding tissue structures. MRI offers high soft tissue resolution enabling assessment of nerve invasion by tumors. Nevertheless, their clinical application is restricted by ionizing radiation exposure, high costs, and various contraindications (10, 11). In comparison, US possesses non-invasive features with real-time capability at a lower cost. It provides comprehensive information regarding the location, size, shape, margin, and blood supply of tumors; hence, it is considered as the preferred preoperative imaging method for evaluating PGTs (12). Nonetheless, the US features of PGTs partially overlap, and interpretation of US findings may vary depending on operator experience, resulting in discrepancies in diagnostic outcomes (13).
Radiomics is a field emerged from the convergence of artificial intelligence (AI) and medical imaging. It enables the extraction of potential features from medical images that are imperceptible to the human eye in a high-throughput manner, which can be transformed into visual data for quantitative analysis (14). By utilizing machine learning models, radiomics facilitates non-invasive assessment of various biological behaviors associated with tumors, making it widely applicable in early diagnosis, prognosis prediction, and treatment evaluation (15–17). While several scholars have conducted radiomics research on PGTs using CT and MRI images (18–20), there is limited literature based on US images (21).
In recent years, the rapid development of AI has led to the widespread application of deep learning (DL) in various medical fields. Among different types of DL architectures, convolutional neural networks (CNNs) have emerged as the most commonly used approach (22). Compared to traditional radiomics, DL neural networks with their multi-layer structure can automatically learn semantic and spatial features from hidden layers, enabling end-to-end mapping from input to output. This capability has shown promise in improving tumor classification performance (23–25). Yu et al. (26) developed multiple DL models based on multi-center CT images to assist in diagnosing BPGTs and MPGTs, and it was found that MobileNet V3 exhibited the best predictive performance. When compared to the traditional radiomic SVM model, MobileNet V3 demonstrated a significant increase in sensitivity by 0.111 and 0.207 for internal and external test sets respectively (P < 0.05). The utilization of these models resulted in notable improvements in clinical benefits and overall efficiency for less experienced radiologists.
The traditional radiomics methods have complex workflows and primarily rely on manually defined features, which may not fully capture the inherent heterogeneity within lesions. Although DL has the potential to automatically learn more comprehensive features, its algorithms are abstract and less interpretable. While radiomics and DL features have their own distinct advantages and limitations, their integration offers complementary information, making it a prominent research direction in recent years. To our knowledge, there is currently no existing research that utilizes fusion models of radiomics and DL features for characterizing the differentiation of BPGTs and MPGTs including US, CT, and MRI. We hypothesize that fused features can offer additional valuable information to enhance the efficacy of US radiomics in distinguishing between BPGTs and MPGTs. In this study, we compared the diagnostic performance of multiple radiomics classifier models with various DL models. Additionally, we developed a feature fusion model and integrated clinical and US features to construct a nomogram, aiming to enhance the visual classification of preoperative diagnosis for PGTs and facilitate personalized precision diagnosis and treatment for patients.
2 Materials and methods
2.1 Patients
The present study has obtained approval from the hospital ethics committee (protocol code 2024KS002). Given its retrospective nature, patient informed consent was waived.
A retrospective analysis was conducted on US images obtained from January 2017 to December 2023, involving a consecutive cohort of 608 patients with PGTs who received treatment at our hospital. The inclusion criteria consisted of: (1) either BPGTs or MPGTs confirmed by postoperative pathology, (2) preoperative US examination, and (3) complete clinical data. Exclusion criteria included: (1) previous history of surgery or treatment in the parotid gland region, (2) maximum tumor diameter less than 0.5cm,and (3) poor image quality, including blurred images or incomplete visualization of lesions. In cases with multiple lesions, the largest or most representative malignant lesion was selected for analysis. Detailed recruitment methods can be found in Figure 1. Relevant clinical information including age, gender, smoking and drinking history, along with postoperative pathological results were retrieved from the Electronic Health Records (EHR) system.
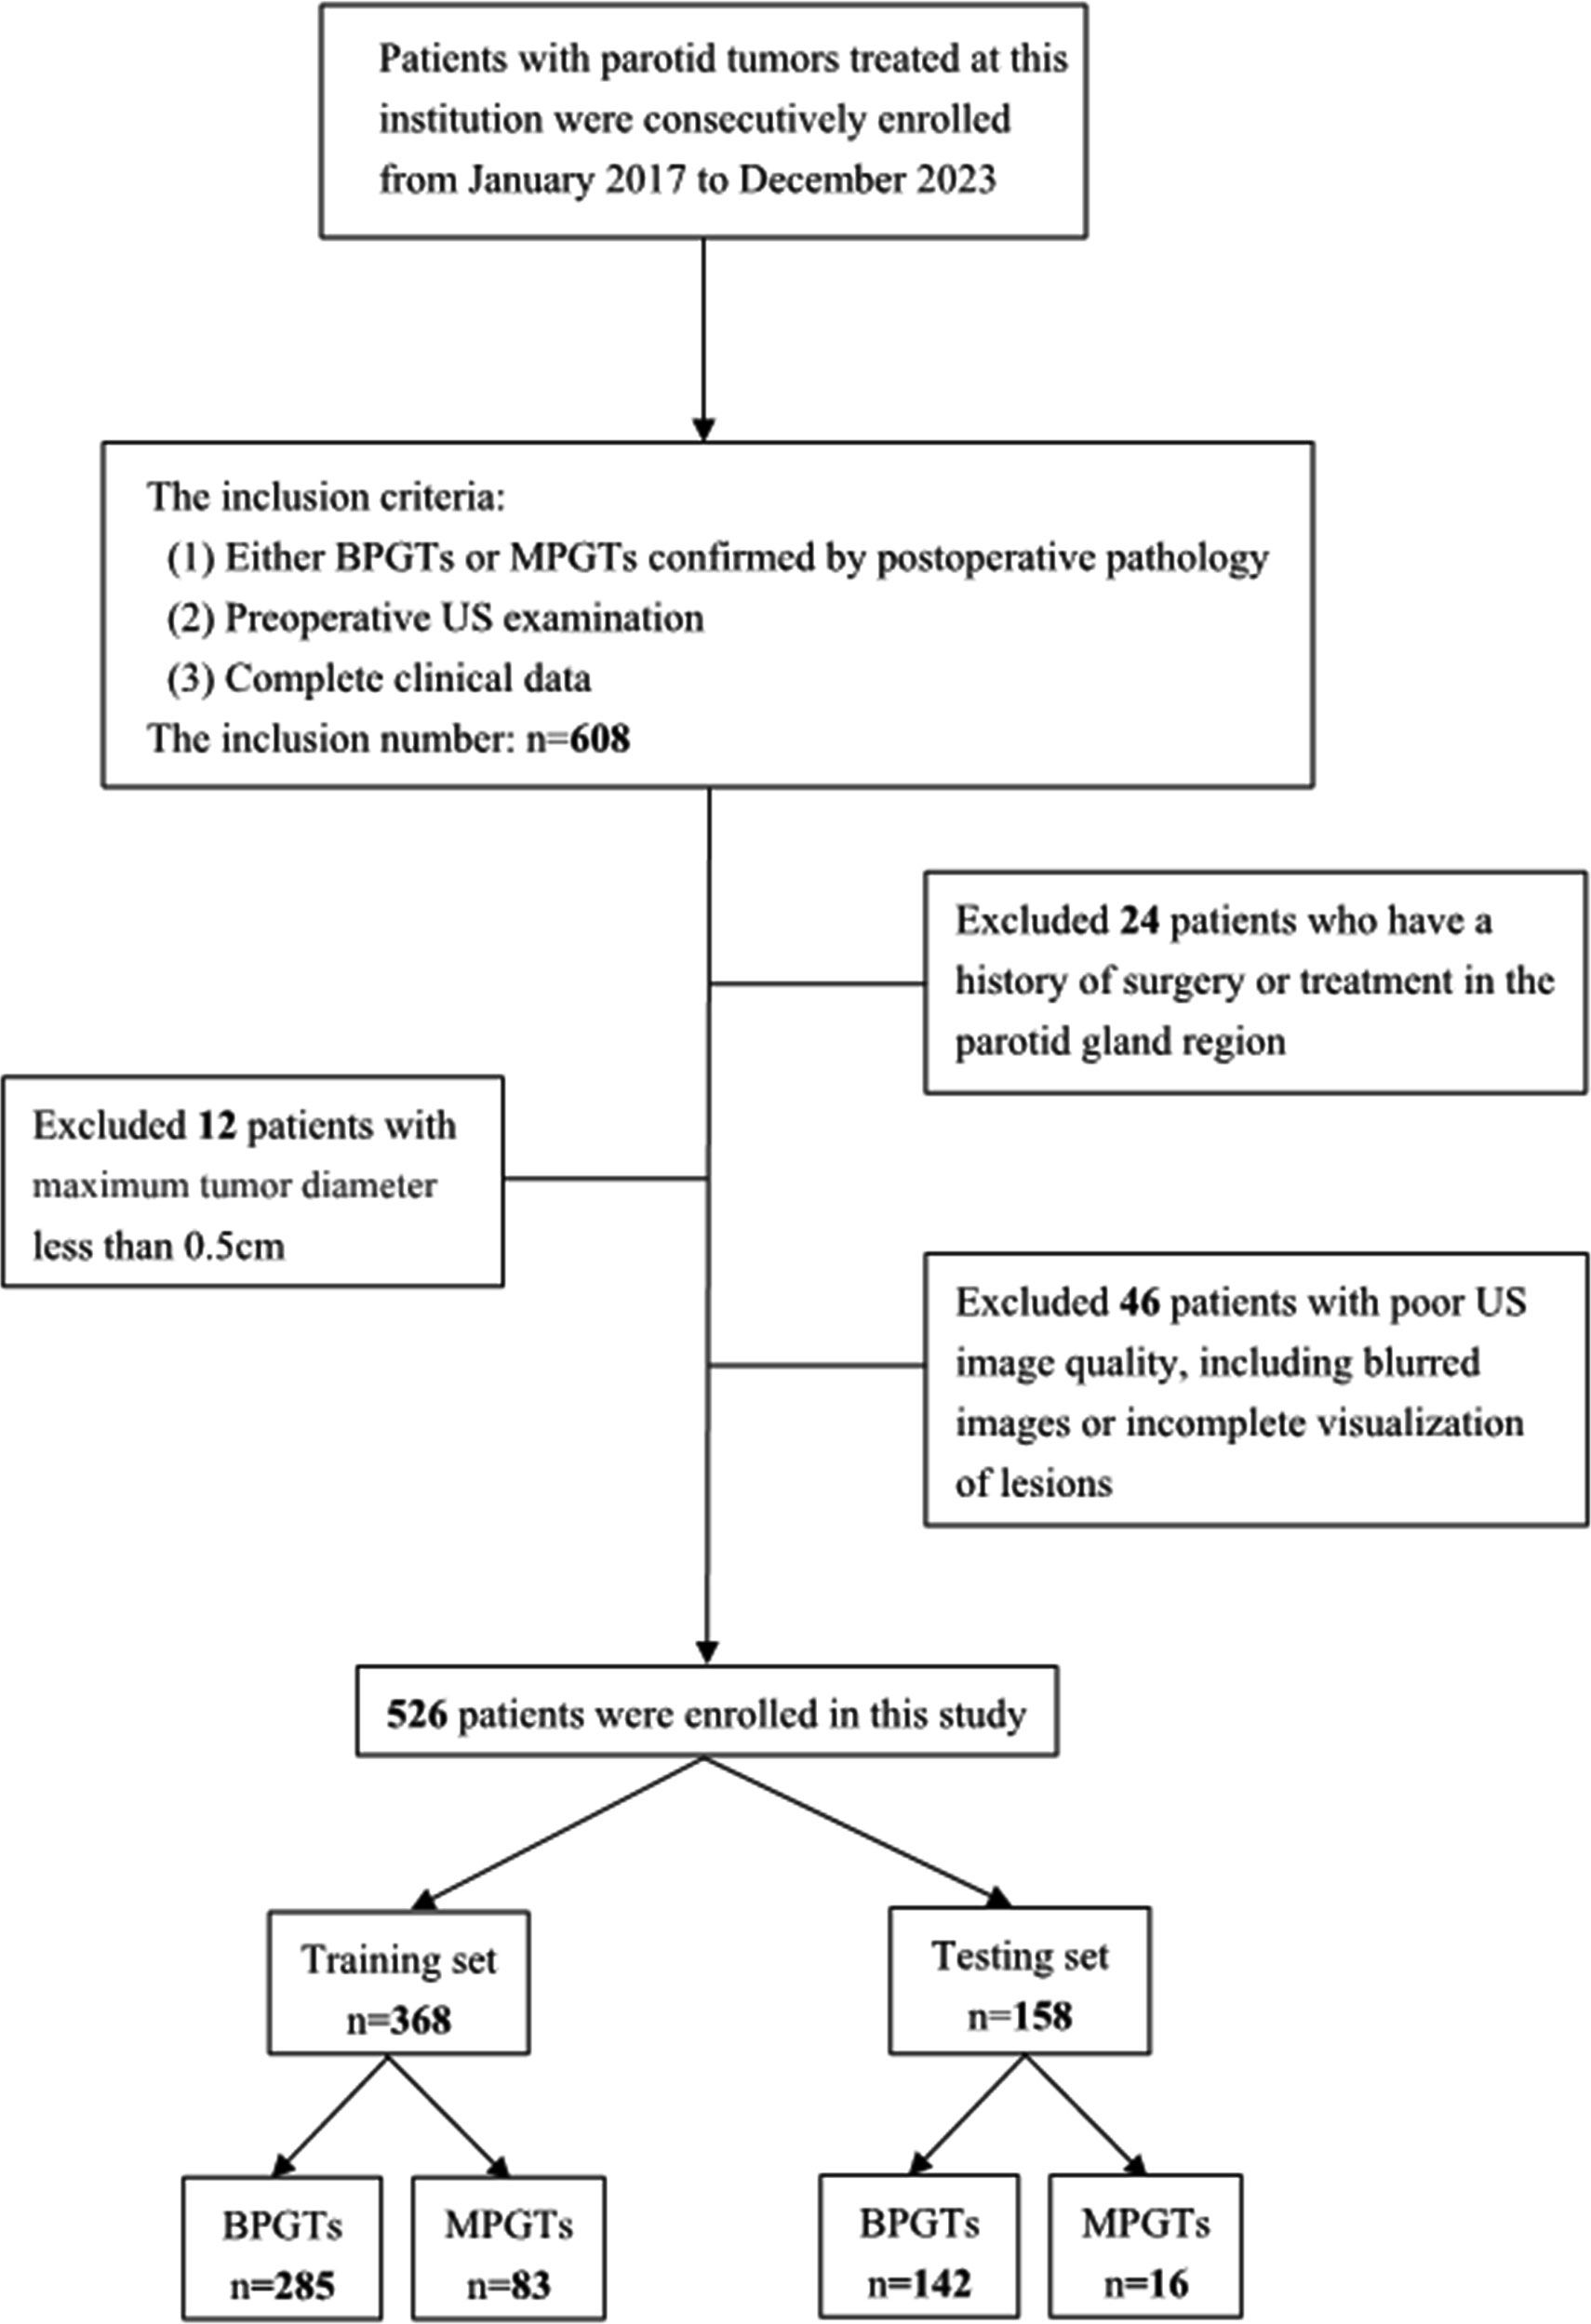
Figure 1 The patient recruitment process and distribution in the training and testing sets.
The study enrolled a total of 526 patients, including 427 cases of BPGTs and 99 cases of MPGTs. These patients were randomly allocated to a training and testing set in a ratio of 7:3. The study design and workflow are illustrated in Figure 2.
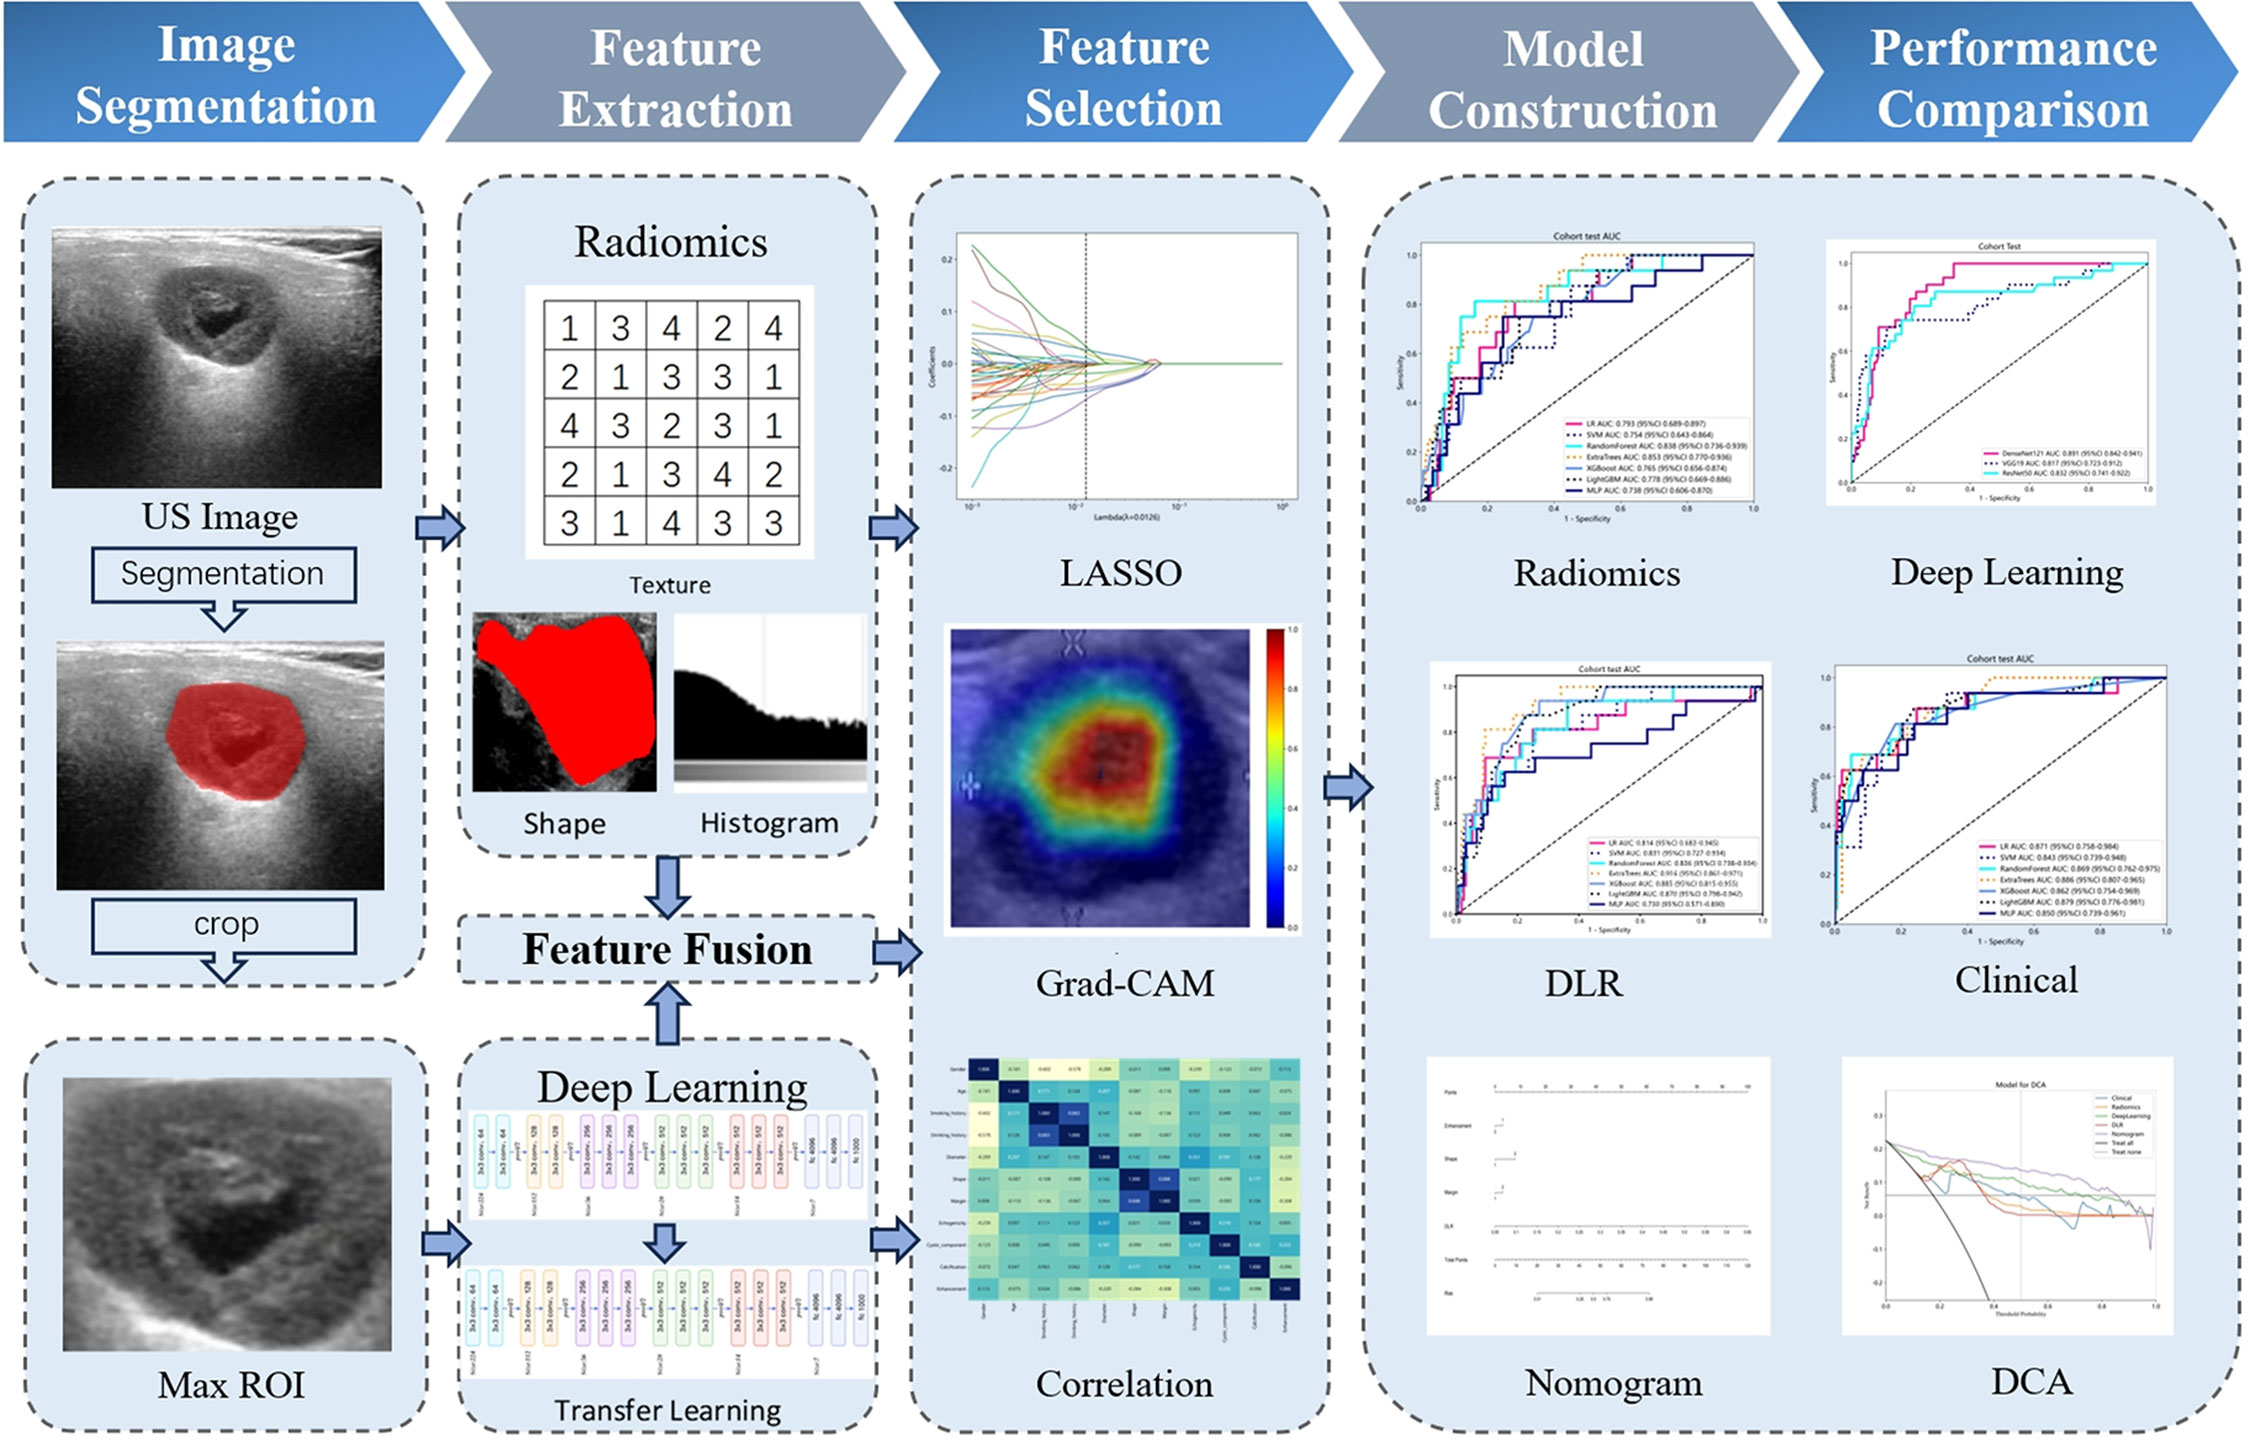
Figure 2 The overall workflow of this study.
2.2 Image acquisition and analysis
Preoperative US examination of the parotid gland region was performed using iU22 (PHILIPS), EPIQ7 (PHILIPS),S2000 (SIEMENS), and ACUSON Sequoia (SIEMENS) ultrasound diagnostic devices, equipped with corresponding high-frequency linear array probes. Two-dimensional US images of PGTs were acquired from the Picture Archiving and Communication System (PACS), capturing essential characteristics including maximum diameter, shape (regular/irregular), margin (well/poorly-defined),echogenicity (homogeneous/hetero-geneous), cystic component (absent/present), calcification (absent/present), and posterior acoustic enhancement (absent/present). The analysis of US images was independently conducted in a blinded manner by two experienced ultrasound physicians A and B (with over 5 years and 10 years of experience in superficial organ diagnosis respectively) without access to clinical information or pathological results. In case of discrepancies, consensus was reached through discussion.
2.3 Image segmentation
The ITK-SNAP software (version 3.8.0) was utilized for manual delineation of the region of interest (ROI) along the tumor periphery on images displaying the maximum lesion diameter. Initially, ultrasound physician A performed the ROI delineation, and subsequently, a subset of 100 patients were randomly selected after a two-week interval for independent ROI delineation by both ultrasound physicians A and B, aiming to assess the selected features with high reproducibility and robustness in terms of intra-observer and inter-observer agreement.
2.4 HCR feature extraction
Handcrafted radiomic (HCR) feature extraction was performed with the Pyradiomics (version 3.0.1), adhering to the Imaging Biomarker Standardization Initiative (IBSI) guidelines. The documentation for this program can be accessed at https://pyradiomics.readthedocs.io. HCR features are classified into three primary groups: (1) Geometry, (2) Intensity, (3) Texture. Geometry features are designed to characterize the spatial structure and contour of lesion; Intensity features analyze voxel intensity-related information using first-order statistical methods; and Texture features capture subtle variations in lesions through more intricate second- and higher-order analyses. Various techniques were utilized to extract texture features, including gray-level co-occurrence matrix (GLCM), gray-level dependence matrix (GLDM),gray-level run length matrix (GLRLM),gray-level size zone matrix (GLSZM),and neighborhood gray-tone difference matrix (NGTDM).
2.5 DL feature extraction
In order to ascertain the most suitable algorithm for our specific research requirements, we explored the performance of prominent networks including DenseNet121, VGG19, and ResNet50. To improve the generalization capability across diverse datasets, transfer learning was implemented by initializing the models with pre-trained weights from the ImageNet database and fine-tuning the learning rate using the cosine decay learning rate strategy. Further details regarding the specific definition and methodology can be found in Supplementary Material 1.
Prior to training, the input images underwent cropping and Z-score normalization, retaining only the minimum bounding rectangle that encompasses the ROI. This simplified complexity and reduces background noise in algorithmic analysis. During training, we employed real-time data augmentation techniques such as random cropping, horizontal flipping, and vertical flipping. For testing set images, only normalization was performed during processing.
The classification performance of three DL models was compared, and DL features were extracted from the penultimate layer (average pooling layer) of the most effective model for subsequent analysis.
2.6 Feature selection and fusion
For HCR features, the initial step involves calculating the intraclass correlation coefficient (ICC) between HCR features and retaining those with an ICC value ≥ 0.85, indicating a high level of stability. Subsequently, feature standardization is performed using Z-scores, complemented by intergroup comparisons based on t-test. Features exhibiting p-values < 0.05 were selected for further analysis. Furthermore, we examined repeatable features using Pearson’s correlation coefficient and opted to retain only one feature in cases where the correlation between feature pairs exceeded 0.9. To reduce redundancy further, a greedy recursive deletion strategy is employed for feature filtering. Finally, least absolute shrinkage and selection operator (LASSO) regression with cross-validation utilizing a minimum criterion of 10 folds is applied to adjust the penalty parameter (λ), aiming to identify HCR features among non-zero coefficients that possess superior predictive value.
For DL features, we applied principal component analysis (PCA) to reduce the dimensionality of these transfer learning features from 50,176 to 512, in order to enhance the model’s generalization ability and mitigate the risks of overfitting.
In the stage of feature fusion, we employed a pre-fusion algorithm that integrated HCR features with DL features to form a comprehensive feature set. Subsequently, we followed the similar process as that for HCR features for fusion feature selection.
2.7 Model construction and validation
HCR features and fused features obtained through feature selection are combined with several machine learning classifiers to construct traditional radiomics models and deep learning radiomics (DLR) models for discriminating BPGTs and MPGTs. Seven mainstream classifiers, including linear models (logistic regression (LR), support vector machine (SVM)),tree-based models (RandomForest, ExtraTrees, XGBoost, LightGBM), as well as a deep learning-based multi-layer perceptron (MLP) model were selected. For model hyperparameter tuning, we applied 5-fold cross-validation on the training set and utilized the Gridsearch algorithm. The model parameters that exhibited superior median performance were chosen for final model training.
Through a comprehensive analysis of relevant clinical data and US characteristics, we conducted univariate r followed by multivariate logistic regression analysis to identify significant features for constructing clinical models. Furthermore, these selected features were integrated with the most optimal predictive machine learning model to develop a nomogram.
The receiver operating characteristic (ROC) curve was employed for assessing the diagnostic performance of various models, while the Delong test was utilized to compare the area under the curves (AUC) of each model. Calibration curves and Hosmer-Lemeshow (HL) analysis were plotted to evaluate the concordance between predicted probabilities and actual outcomes. Decision curve analysis (DCA) was applied to assess the clinical utility of these models.
2.8 Statistical analysis
The analyses were performed using Python (version 3.7.12) and statsmodels (version 0.13.2). The development of our machine learning models utilized the scikit-learn (version 1.0.2) interface. DL training was conducted on an NVIDIA 4090 GPU, with MONAI 0.8.1 and PyTorch 1.8.1 frameworks.
For quantitative data, normality and homogeneity of variance tests were conducted. If the data followed a normal distribution, it was represented as mean ± standard deviation and an independent samples t-test was used for comparison. If the data did not follow a normal distribution, median and interquartile range (IQR) were used for representation, and a non-parametric Mann-Whitney U test was employed for comparison. For categorical data, a chi-square test was utilized for comparison. A significance level of P<0.05 indicated statistical significance.
3 Results
3.1 Clinical and US characteristics
Ultimately, a total of 526 patients were enrolled in the study, including 283 males and 243 females, with ages ranging from 12 to 87 years (mean age: 51.73 ± 15.17 years). Among the cohort of BPGTs (n=427), PA was the most prevalent subtype (207 cases; accounting for 48.48%), followed by Warthin tumor (133 cases; accounting for 31.15%). Of the MPGTs (n=99),MEC exhibited the highest proportion (28 cases; accounting for 28.28%). The distribution of tumors is presented in Table 1.
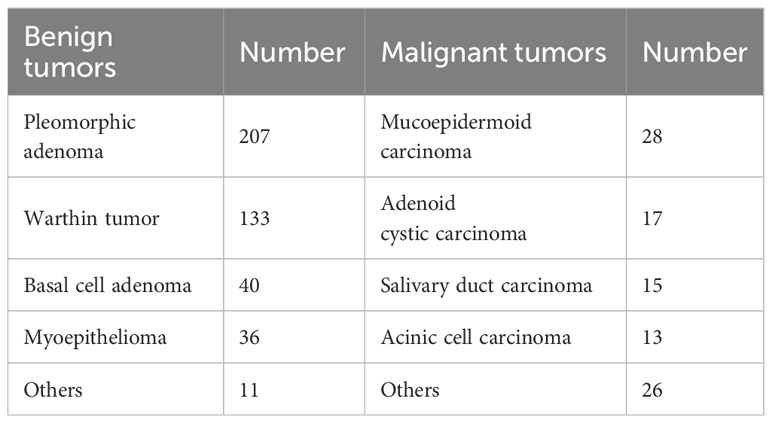
Table 1 Distribution of tumors confirmed by histologic results in the whole cohort.
The baseline characteristics of the training and testing sets were compared in Table 2, and no statistically significant differences (P>0.05) were observed between the clinical and US characteristics of the two groups, ensuring an unbiased data partition. Extensive univariate and multivariate analyses were conducted on the baseline characteristics BPGTs and MPGTs to determine odds ratios (ORs) for each feature along with their corresponding p-values (Supplementary Table 1). Univariate analysis revealed significant differences (P < 0.05) between the two groups regarding smoking history, maximum diameter, shape, margin, calcification, and posterior acoustic enhancement. Multivariate analysis identified only irregular shape (OR=1.257), poorly-defined margin (OR=1.323),and absence of posterior acoustic enhancement (OR=0.807) as independent risk factors for MPGTs.
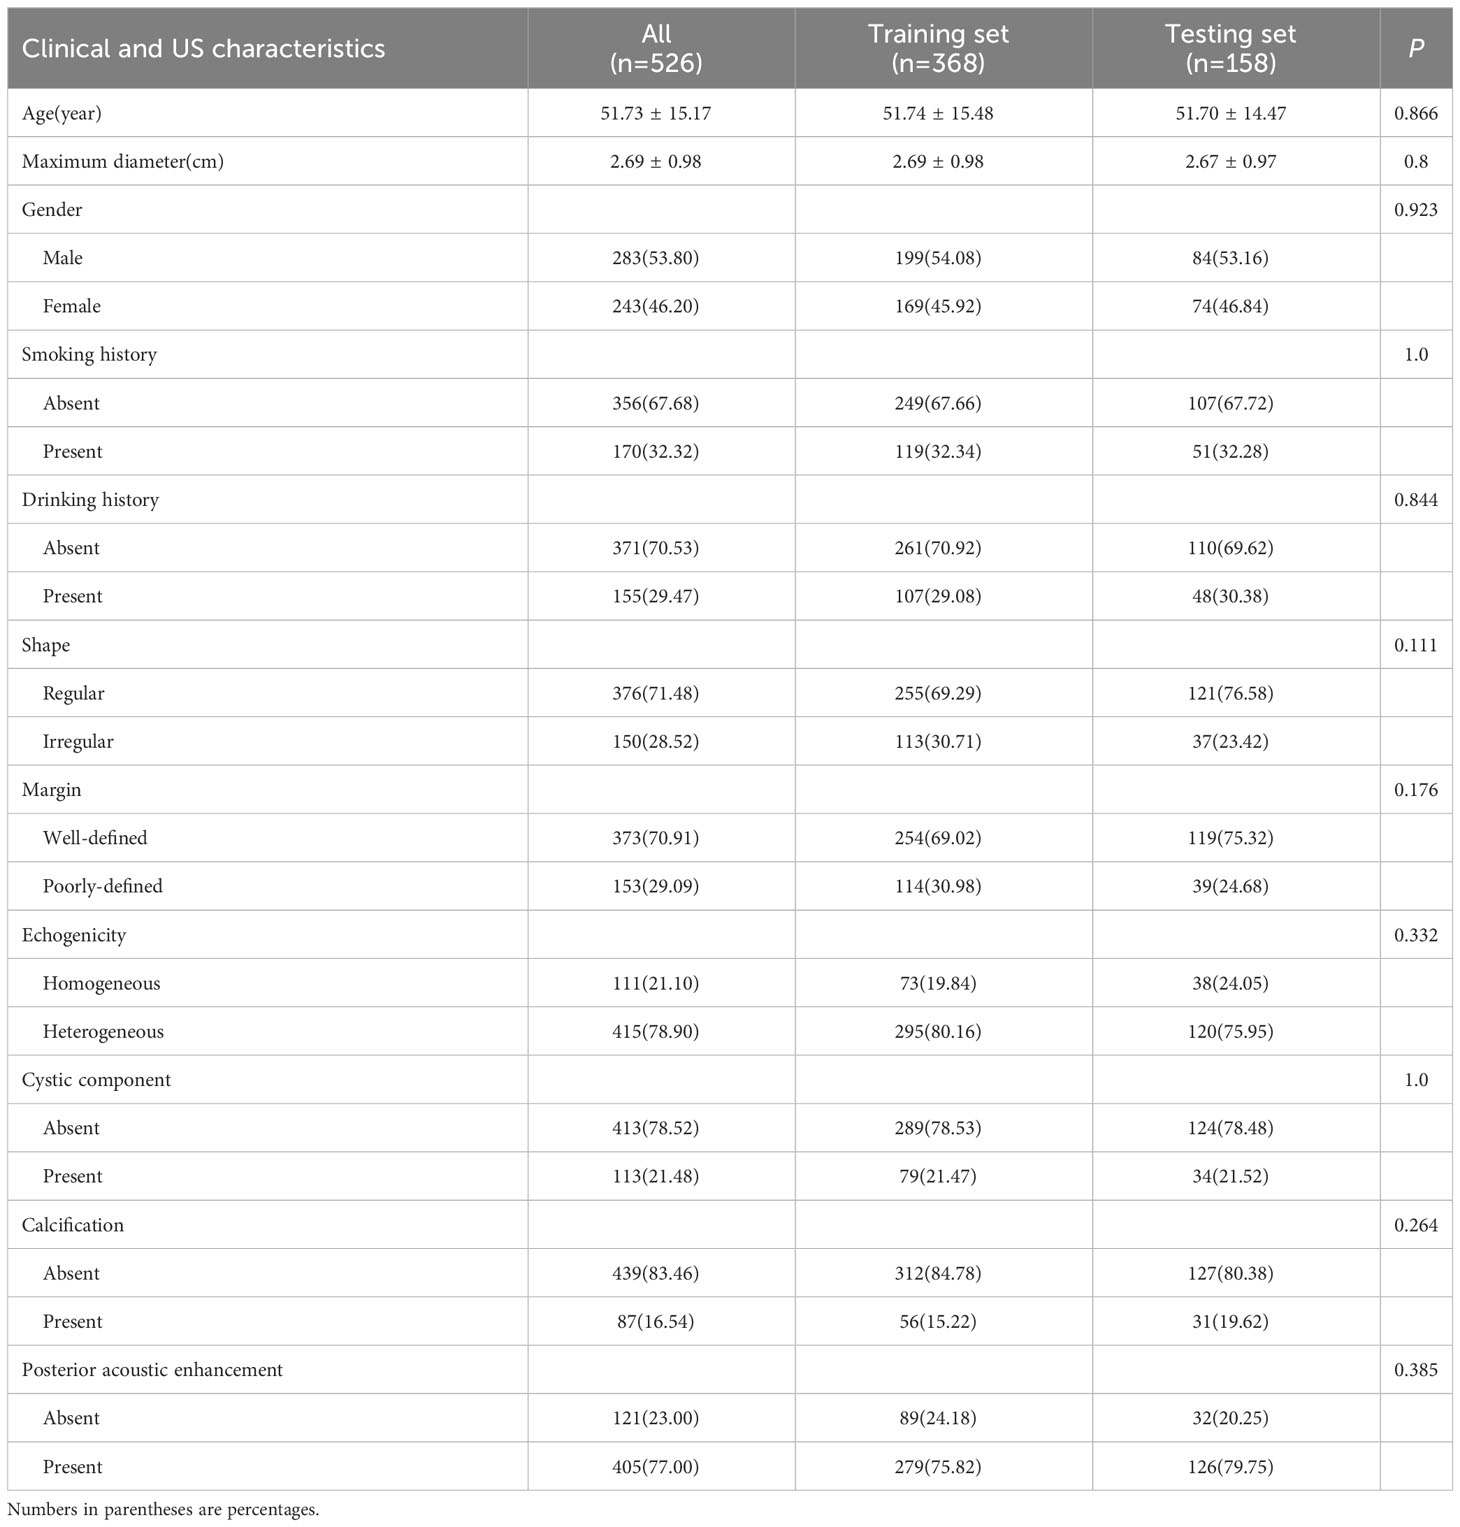
Table 2 Baseline clinical and US characteristics of patients in training and testing sets.
We performed numerical mapping on these features and subsequently modeled them by machine learning algorithms. The diagnostic performance of various clinical models was compared in Table 3 and Supplementary Figure 1. Among all the models, ExtraTrees exhibited superior performance in the test set with an AUC of 0.886 (95% CI: 0.807 - 0.965).
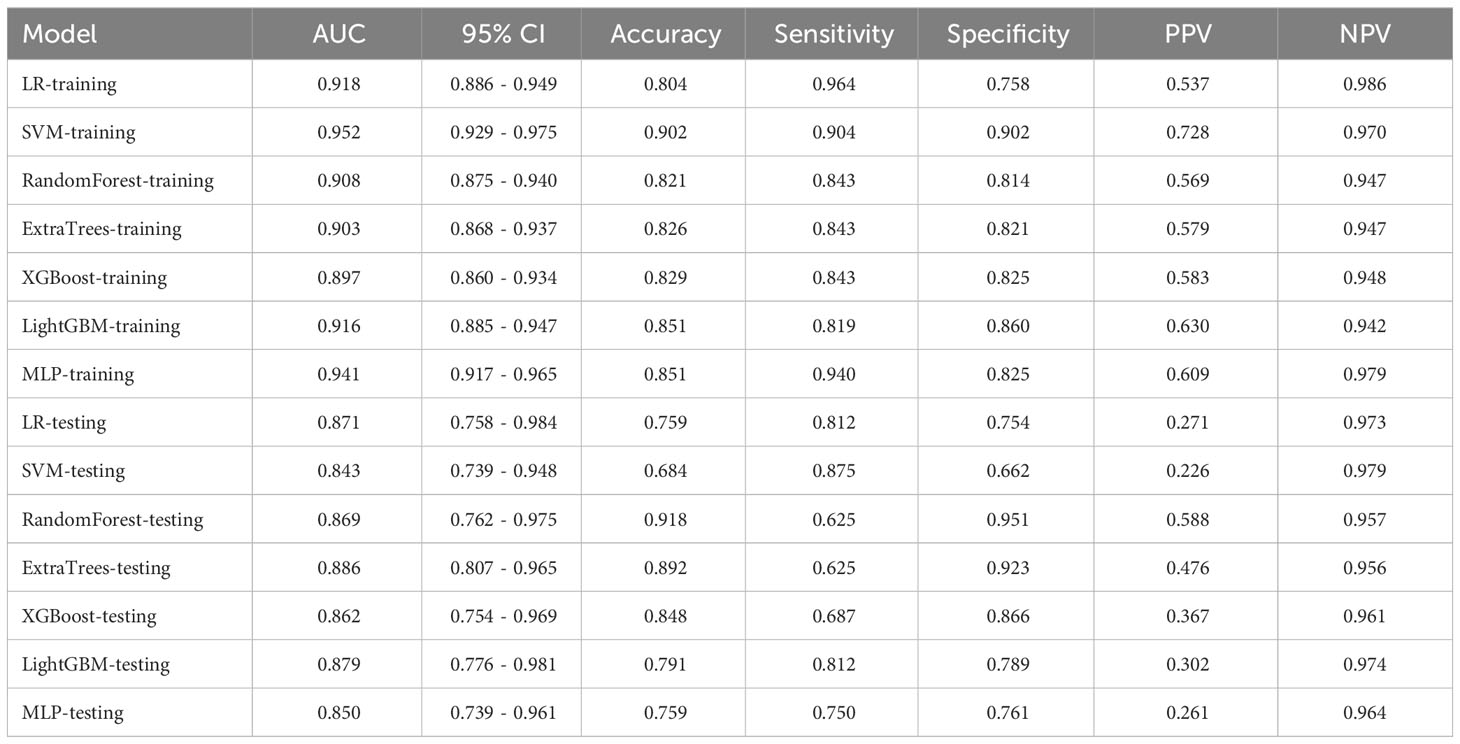
Table 3 Performance comparison of different clinical models.
3.2 Feature selection and model performance
3.2.1 Radiomics models
In this study, a total of 1562 HCR features were extracted and their distribution is presented in Supplementary Figure 2. After feature selection, 16 HCR features were ultimately chosen for further analysis and construction of traditional radiomics models (Supplementary Figure 3). The predictive performance of different classifiers combined is summarized in Table 4. Among these models, the ExtraTrees model demonstrated superior predictive performance in the test set, achieving an AUC of 0.853 (95% CI: 0.770 - 0.936). The ROC curve can be found in Supplementary Figure 4.
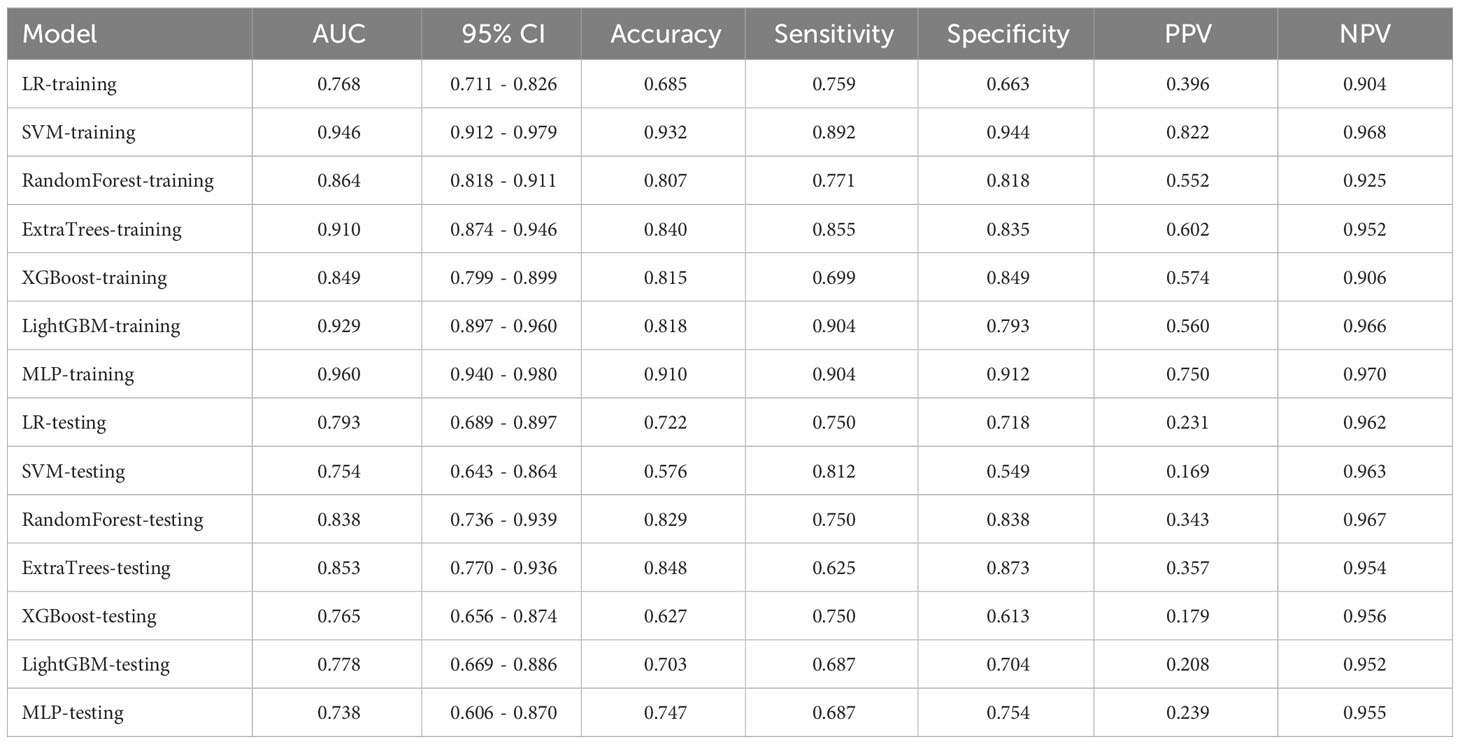
Table 4 Performance comparison of different radiomics models.
3.2.2 DL models
The performance of three DL models is presented in Table 5 and Supplementary Figure 5. The Densenet121 model demonstrated superior performance compared to the ExtraTrees model based on clinical and traditional radiomics, achieving an AUC of 0.883 (95% CI: 0.817 - 0.947) in the testing set.
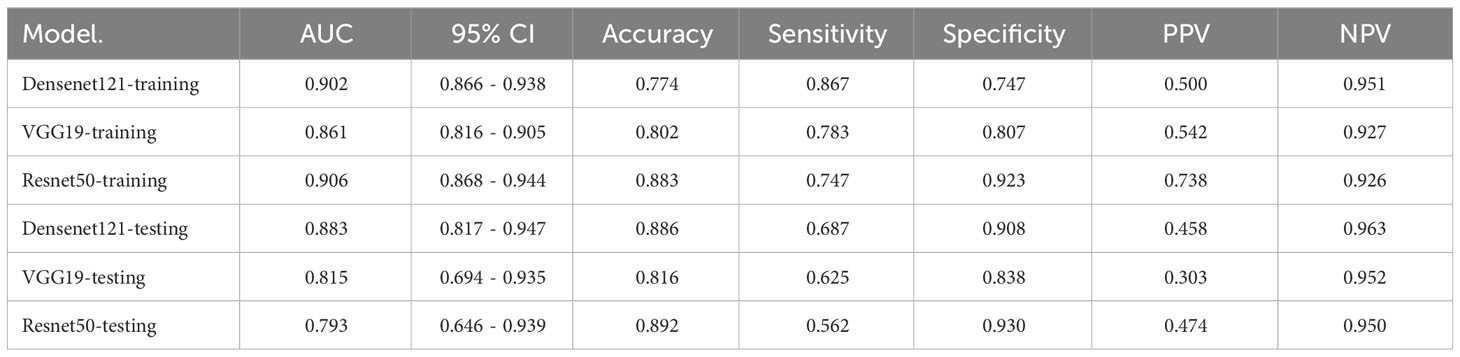
Table 5 Performance comparison of DL models.
To investigate the recognition ability of the Densenet121 model across different samples, we utilized the Gradient-weighted Class Activation Mapping (Grad-CAM) technique for visualization. Figure 3 demonstrates the application of Grad-CAM, effectively highlighting the activation status of the final convolutional layer relevant to cancer type prediction. This approach facilitates identification of image regions that significantly influence model decisions and provides valuable insights into the interpretability.
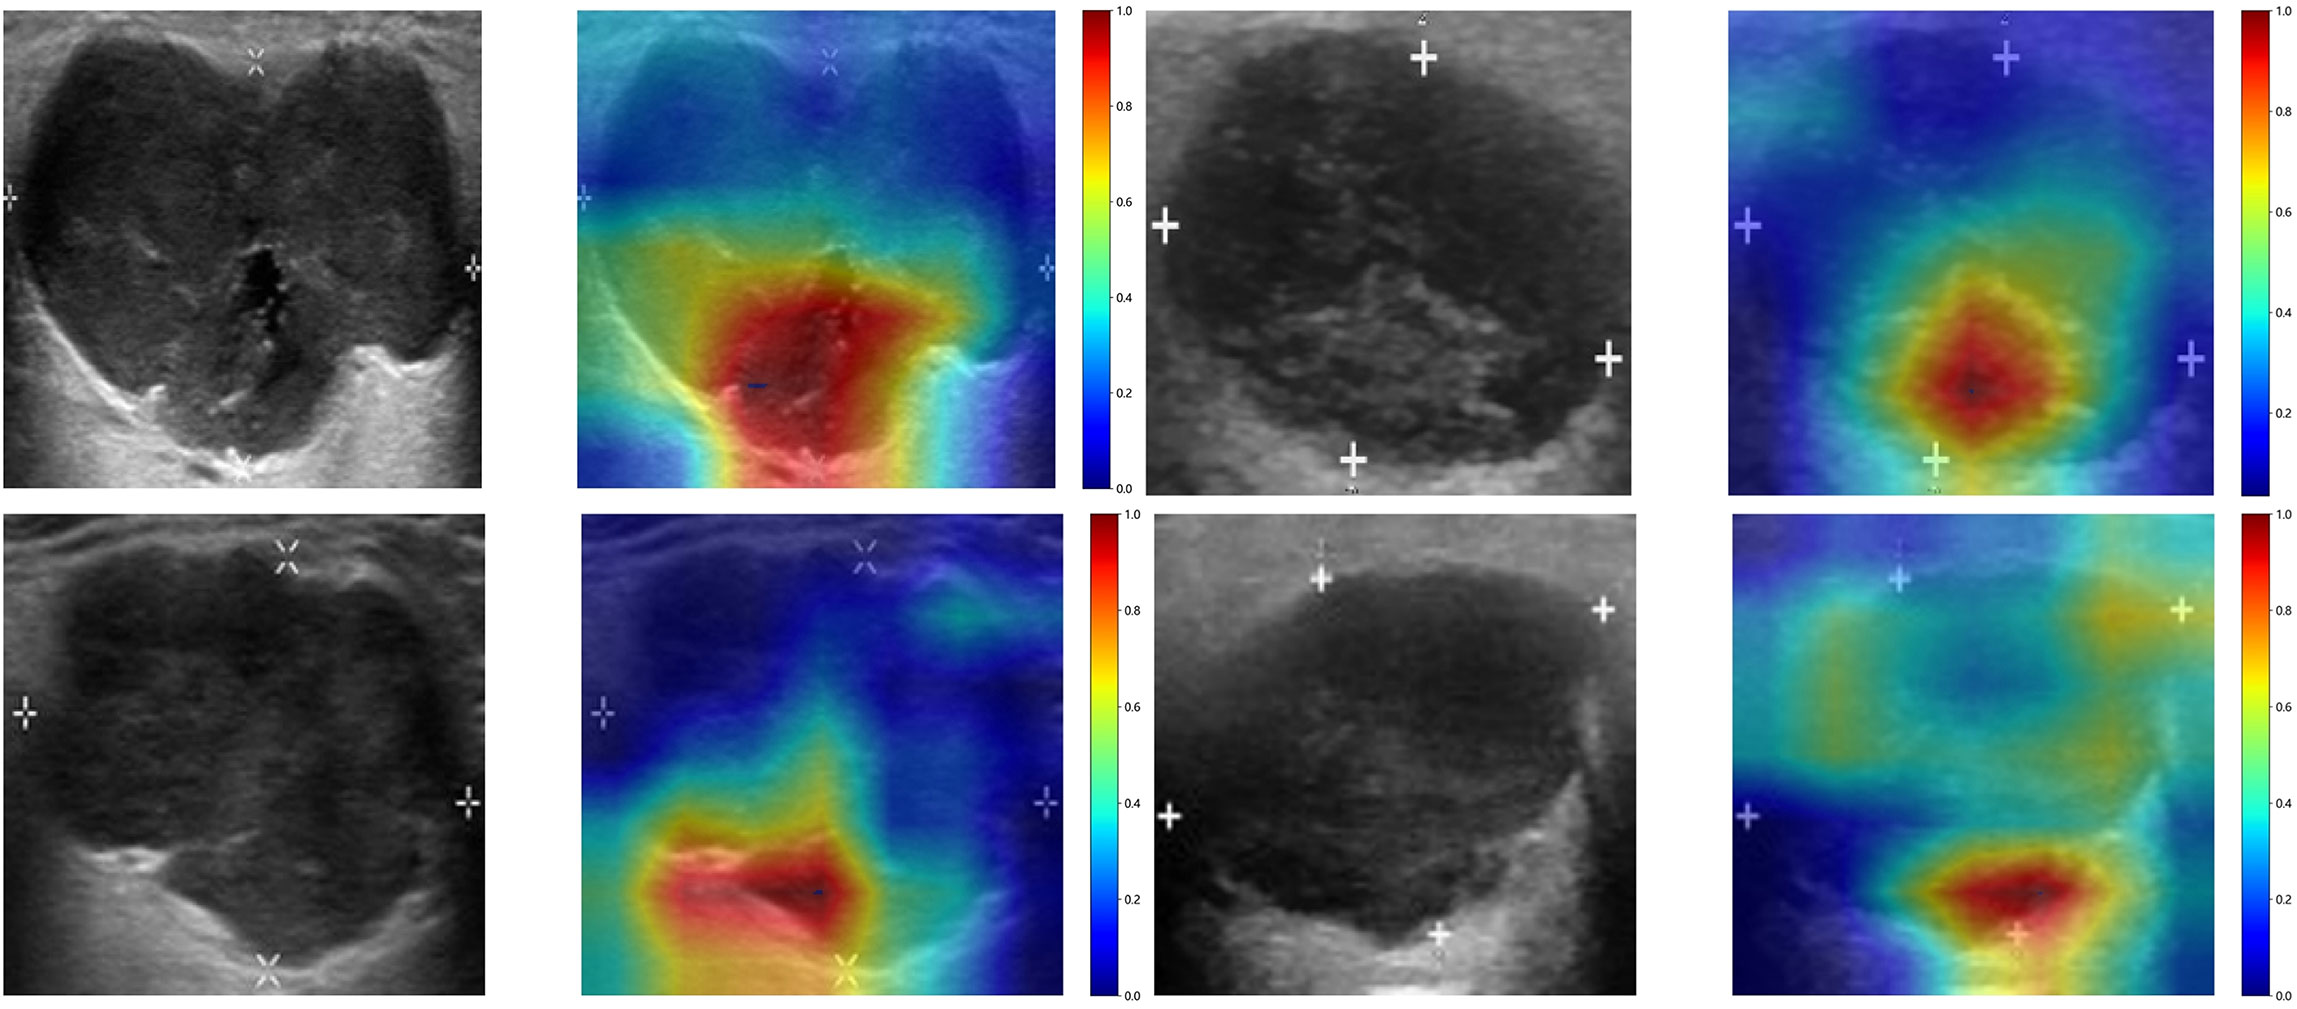
Figure 3 The Grad-CAM visualizations for four typical samples. These visualizations are instrumental in demonstrating how the model focuses on different regions of the images for making its predictions.
3.2.3 Feature fusion models
After feature selection, a total of 31 HCR features and 24 DL features were retained from the fused feature set comprising 2,074 dimensions (Figures 4, 5). Subsequently, DLR feature fusion models were constructed by combining multiple classifiers, and the performance comparison is presented in Table 6 and Supplementary Figure 6. The ExtraTrees model achieved an AUC of 0.916 (95% CI: 0.861 - 0.971) in the testing set, demonstrating further enhancement compared to the Densenet121 model (AUC=0.916 vs 0.891).
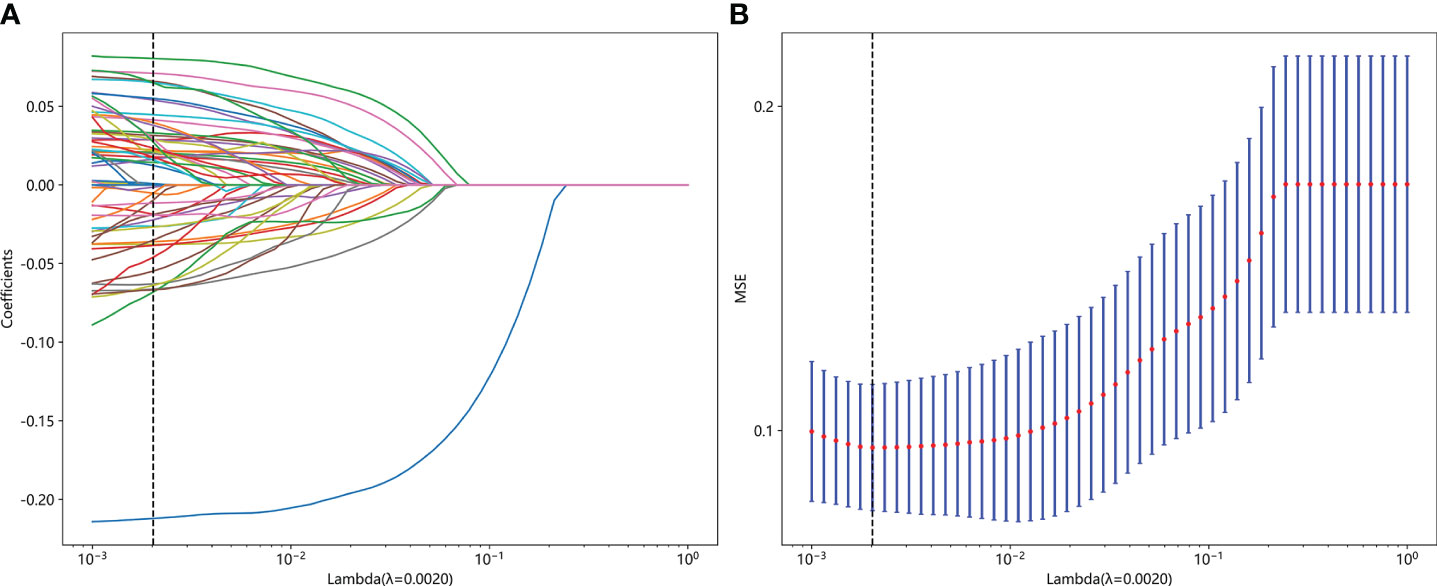
Figure 4 Fusion feature selection using LASSO (A) and the histogram of the feature importance score (B) based on the selected features. The optimal λ value of 0.0020 was selected.
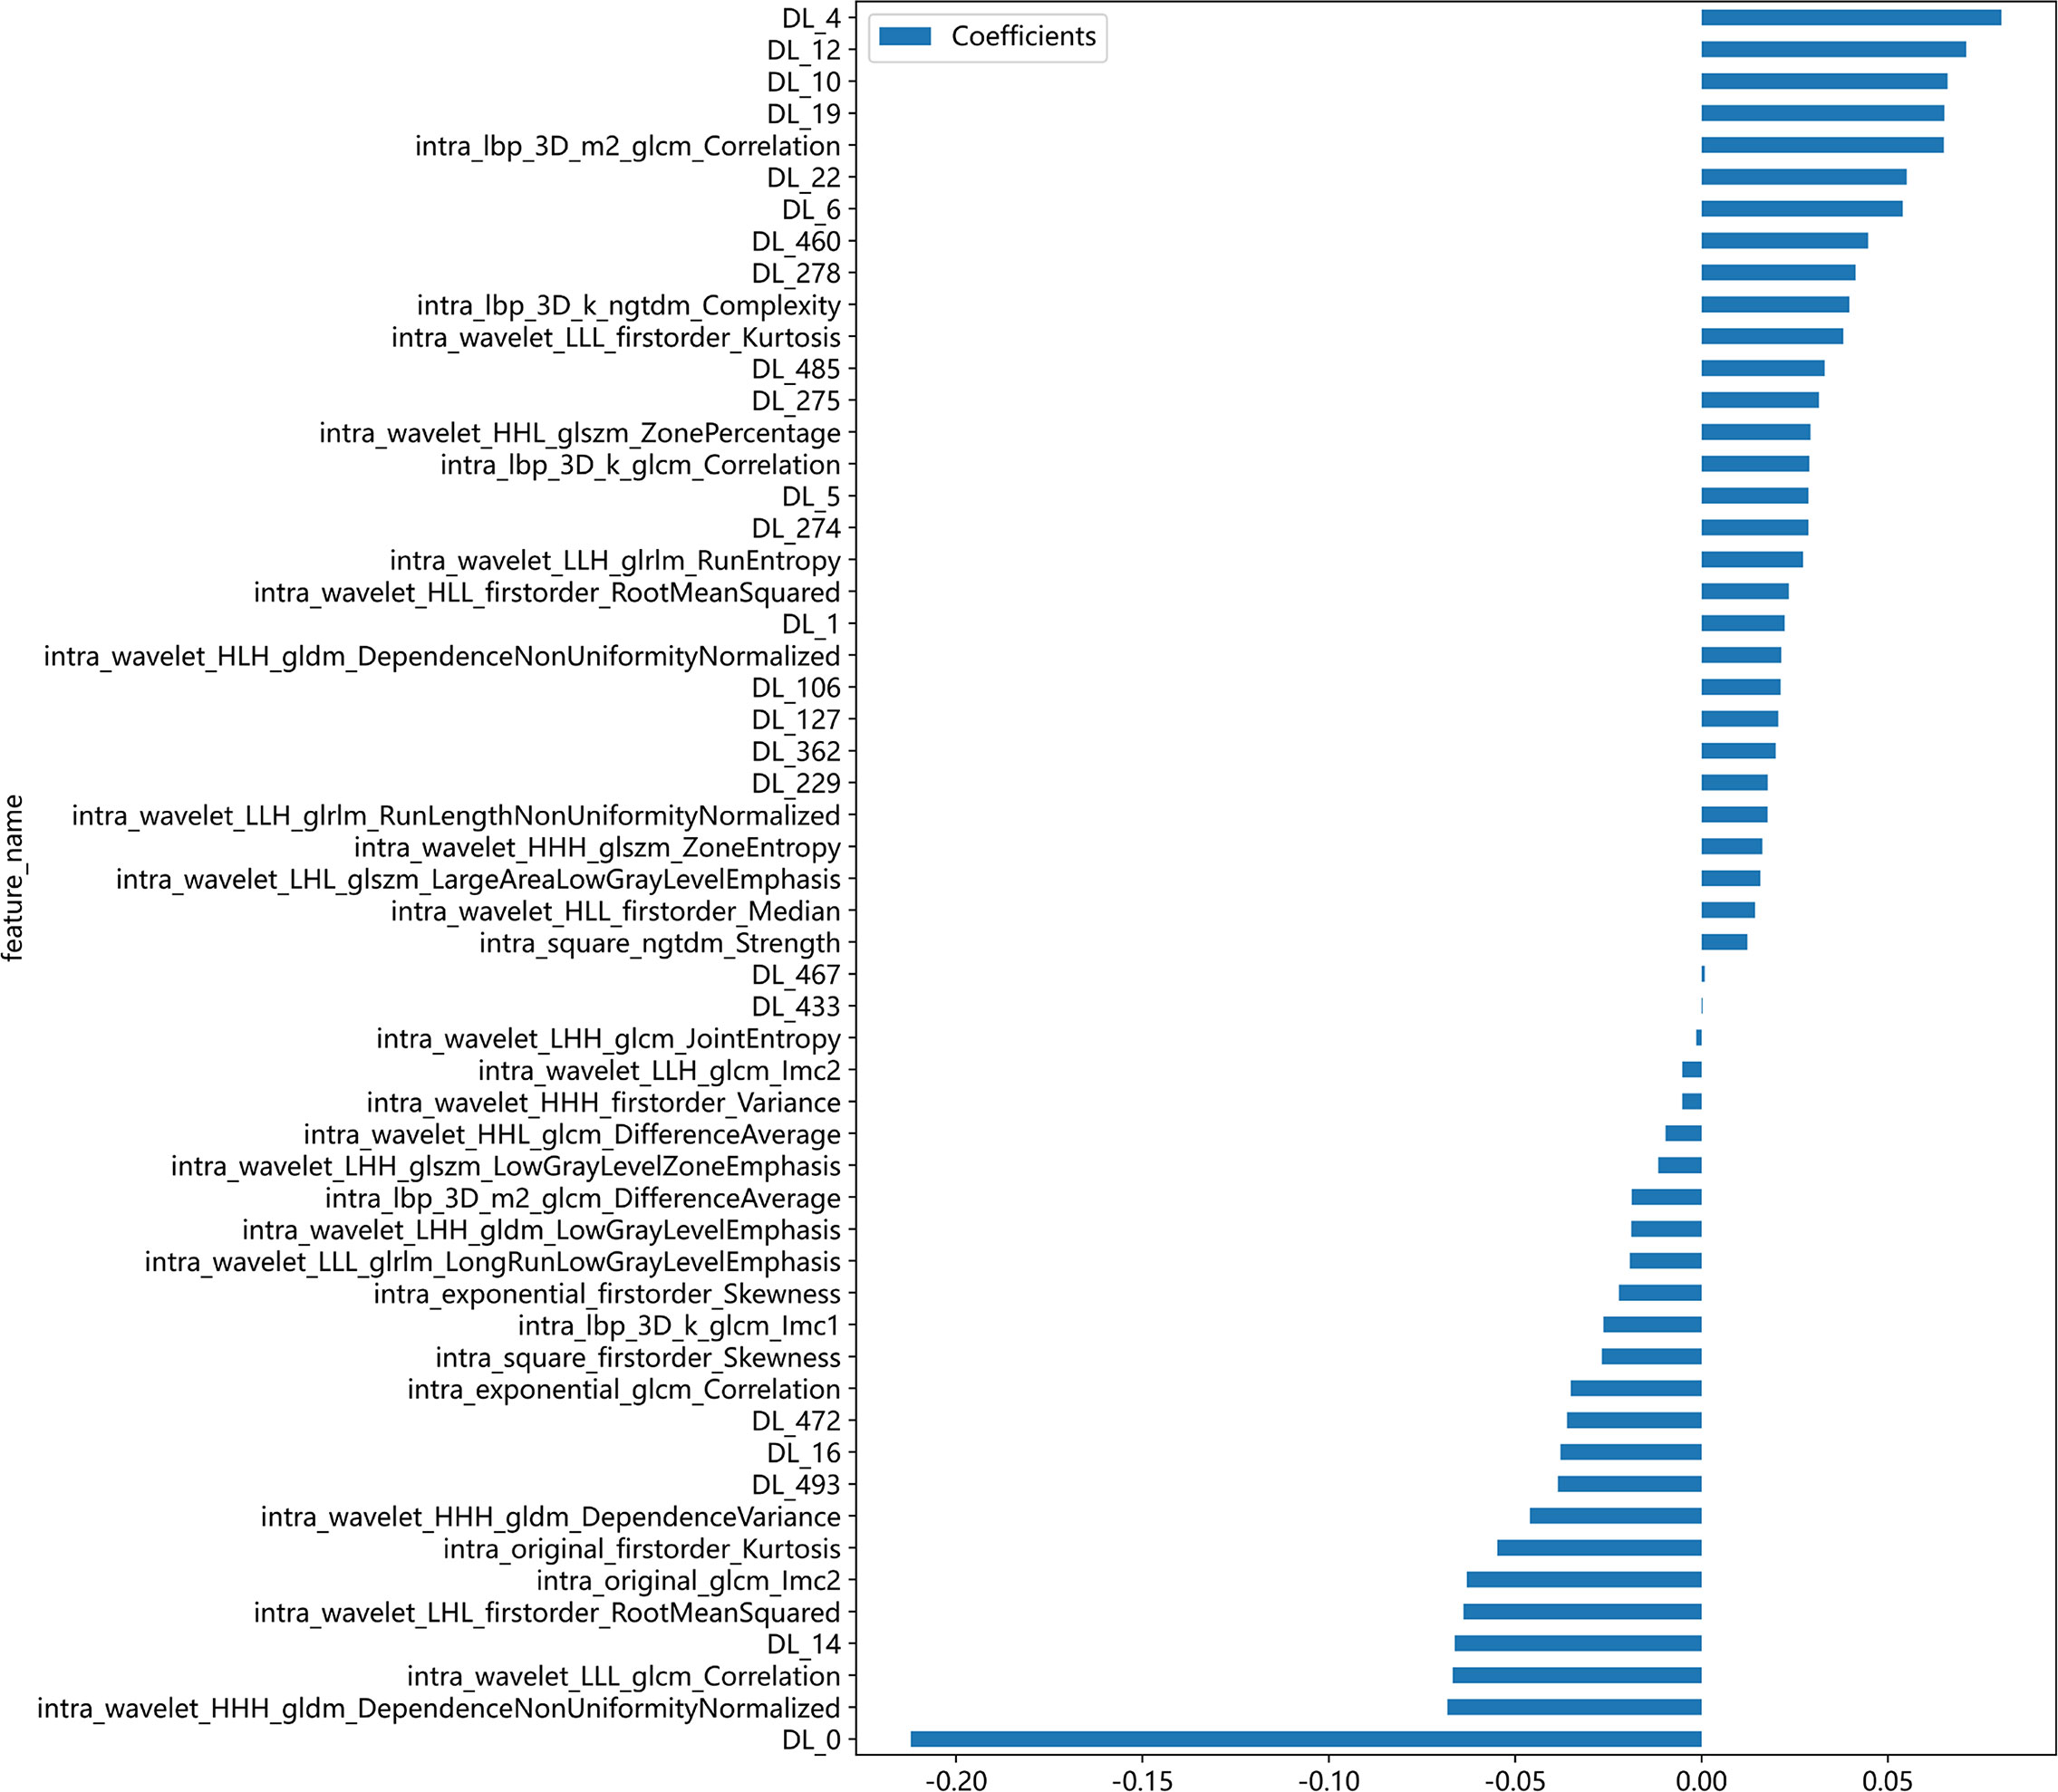
Figure 5 The selected fusion features and corresponding coefficients.
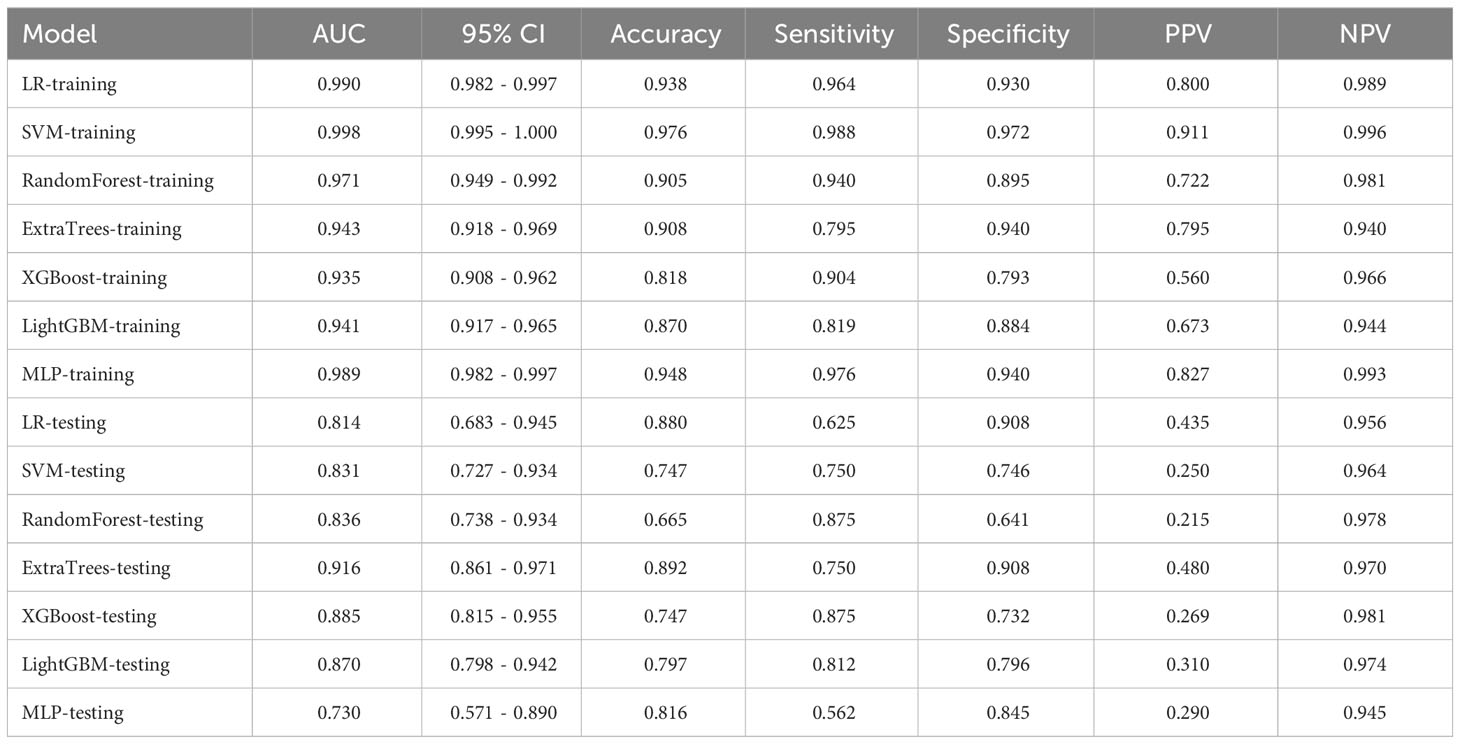
Table 6 Performance comparison of different DLR models.
3.3 Construction of nomogram and comparison of all models
The DLR model demonstrated superior performance compared to alternative models, thereby we integrated meaningful clinical features with the DLR model’s predictions for constructing the final combined model, which was effectively visualized by nomogram (DLRN). Nomogram illustrated that DLR factor played a significant role in predicting the risk level of PGTs (Figure 6).
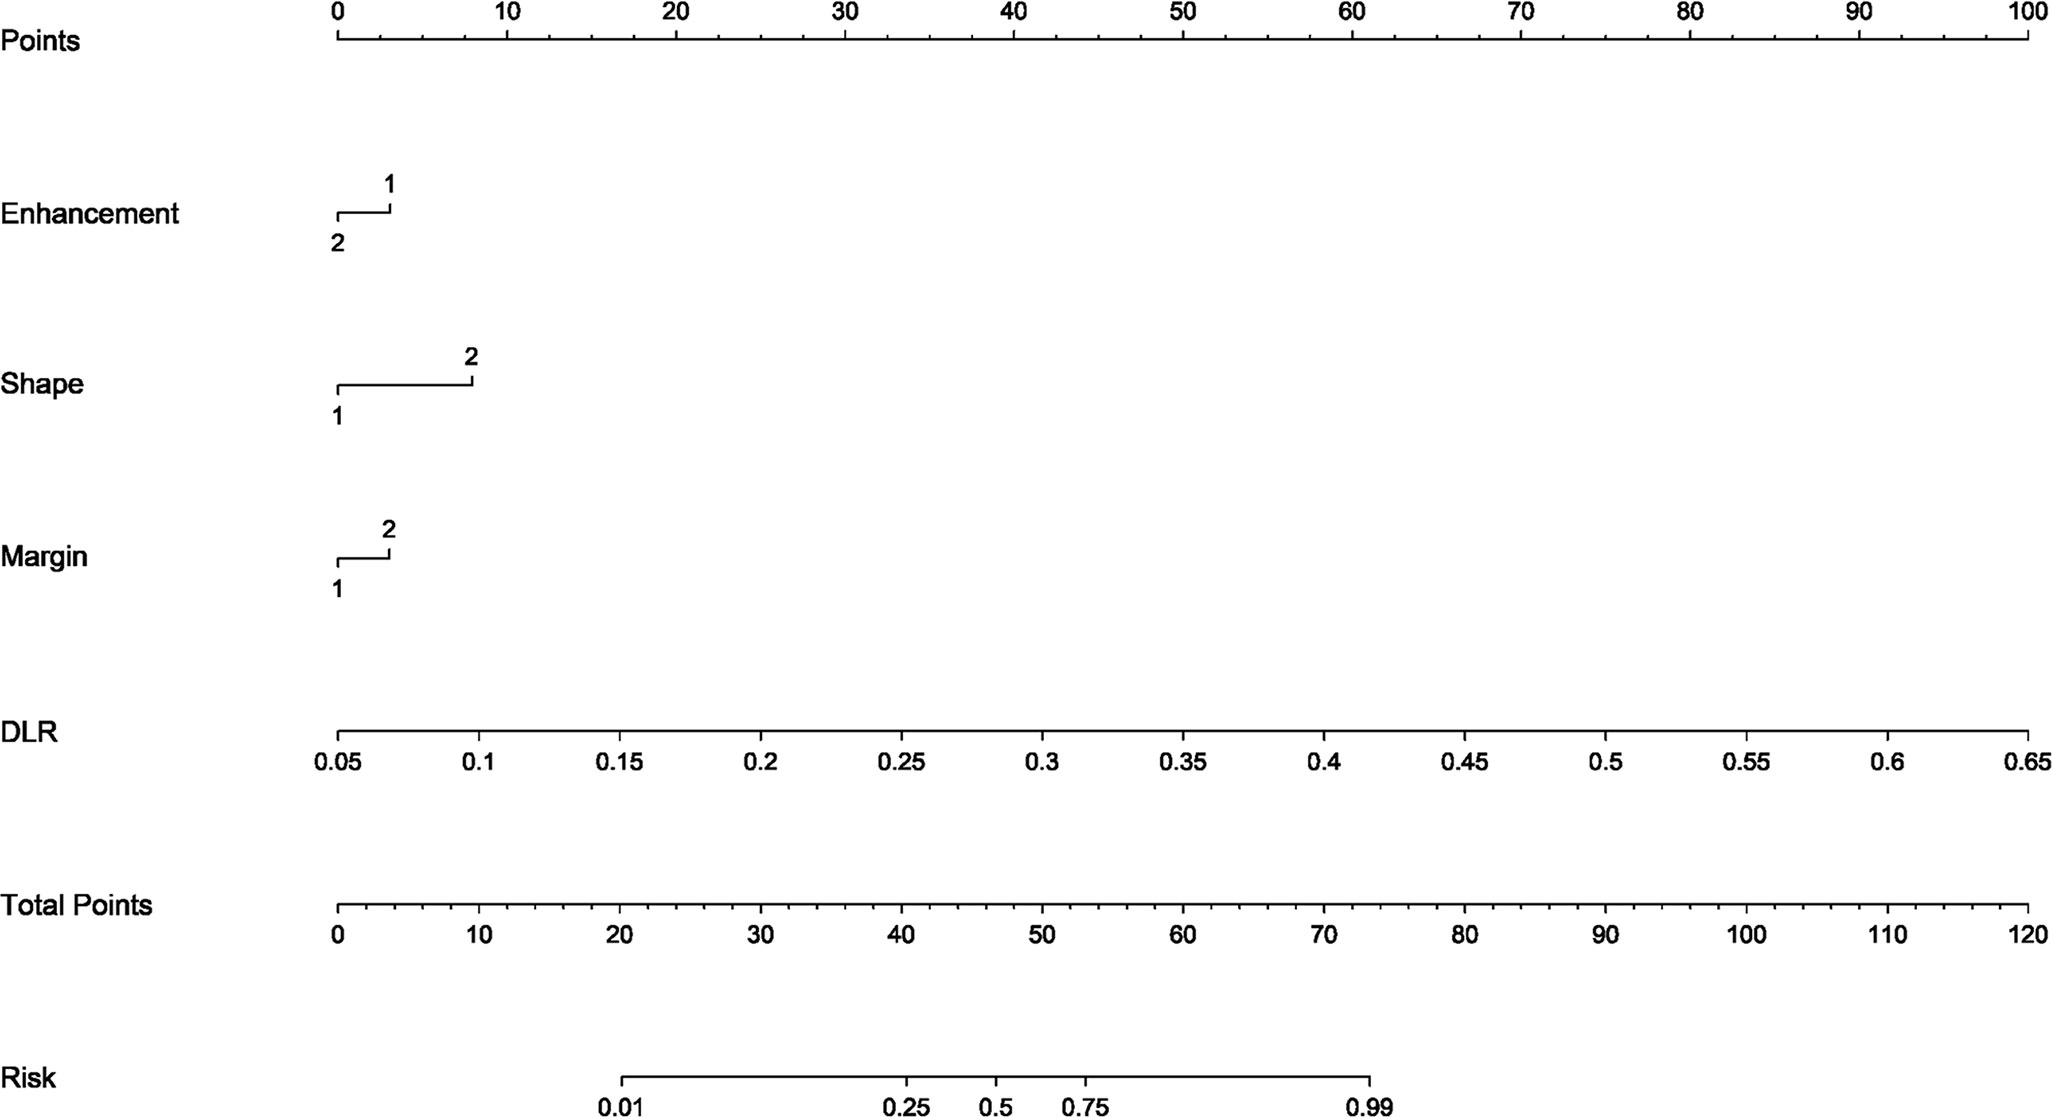
Figure 6 The DLR nomogram for predicting MPGTs. For clinical features in nomogram, 1 means ‘absent’, ’regular’, ’well-defined’, and 2 means ‘present’, ’irregular’, ’poorly-defined’ successively.
The performance of the clinical model, radiomics model, DL model, DLR model, and DLRN was summarized in Table 7. Among all models evaluated (Figure 7), DLRN exhibited superior performance with an AUC of 0.960 (95% CI: 0.940 - 0.979) for the training set and 0.934 (95% CI: 0.876 - 0.991) for the testing set. Delong test (Supplementary Figure 7) revealed statistically significant differences between DLR and DLRN model compared to others in the training set (P < 0.05). However, no statistically significant difference was observed among all models in the testing set (P > 0.05). The calibration curves ((Supplementary Figure 8) demonstrated excellent fit for DLRN with a HL test statistic of 0.327 for the training set and 0.793 for the testing set. Furthermore, based on DCA curves results (Figure 8), it could be concluded that DLRN provided superior clinical benefits compared to other models.
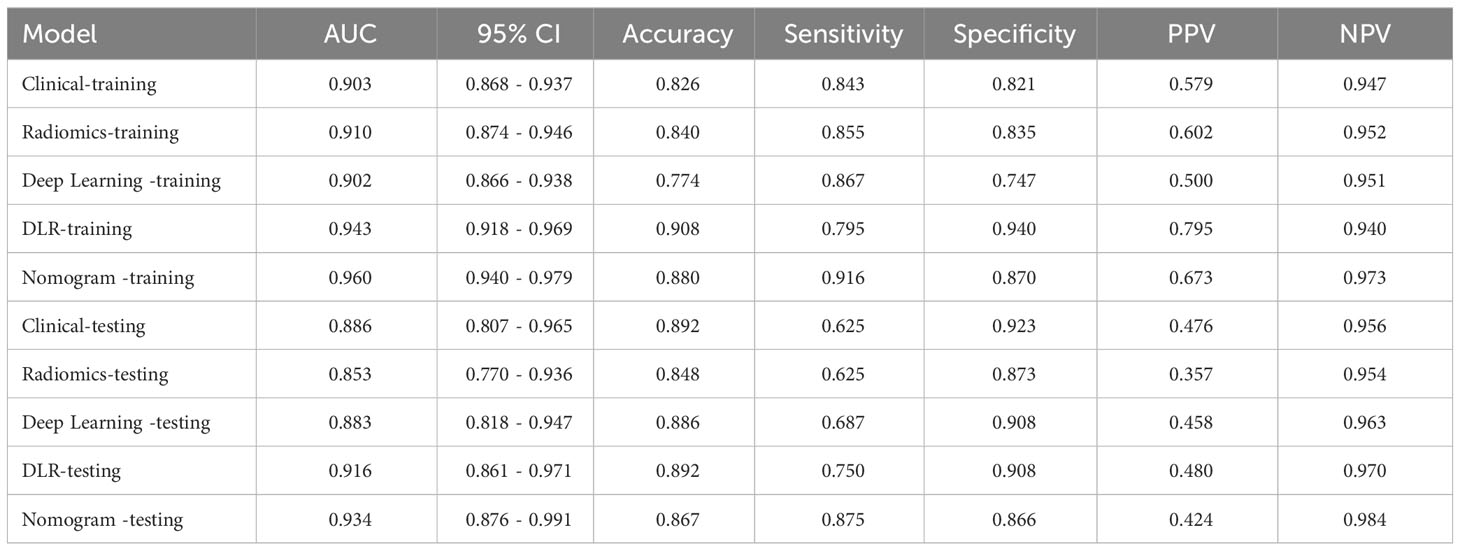
Table 7 Performance comparison of different models.
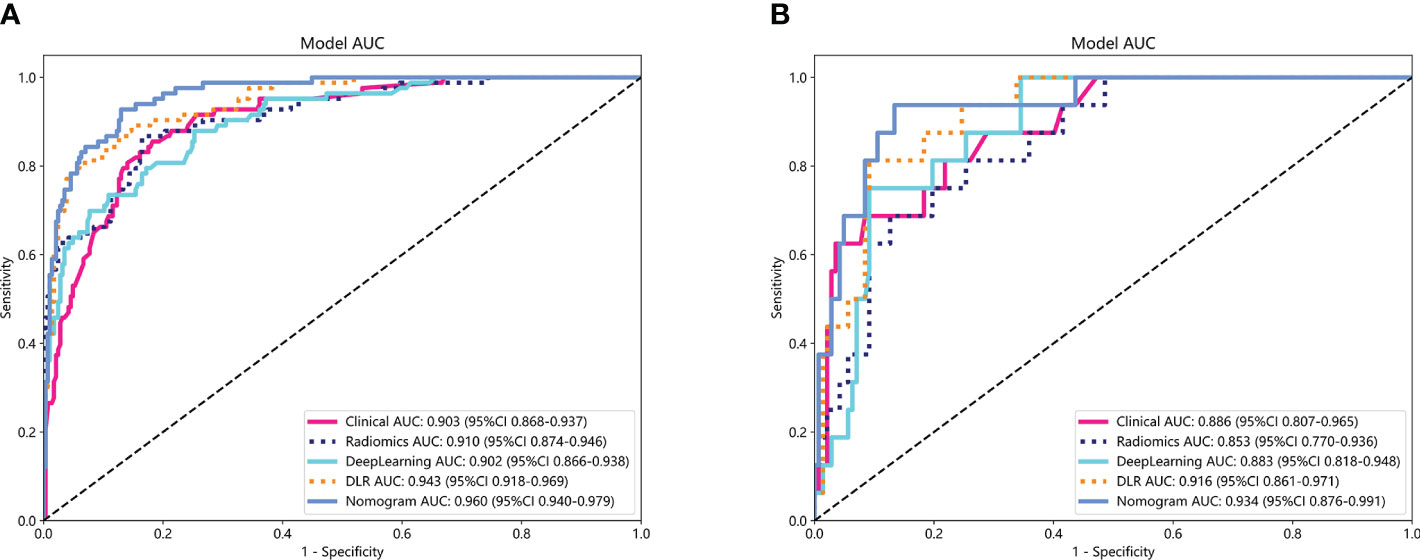
Figure 7 The ROC curves for different models in training set (A) and testing set (B). AUC, area under the curves.
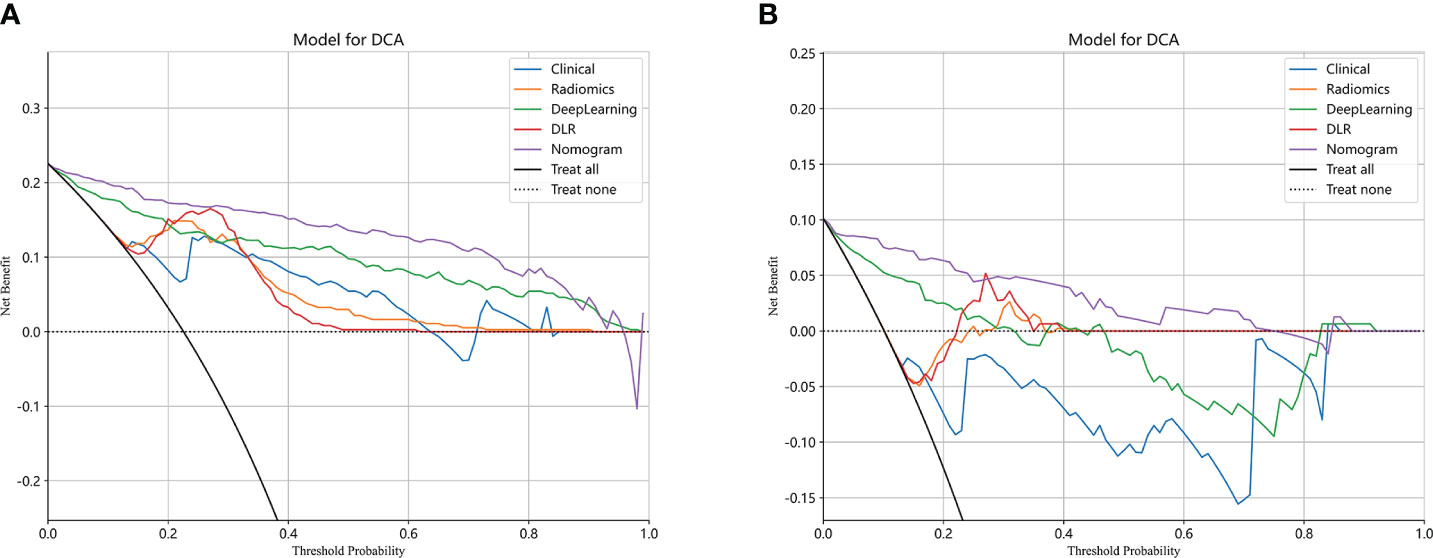
Figure 8 Different models’ DCA curves in training set (A) and testing set (B).
4 Discussion
Our research findings demonstrated that DL models outperformed traditional radiomics models in the classification of PGTs based on US images (AUC=0.883 vs 0.853). Furthermore, the performance of feature fusion DLR model further enhanced (AUC=0.916). Clinical and US characteristics also provide valuable information for model construction, and the DLRN model that integrated all available data demonstrated superior performance (AUC=0.934). The DCA curve illustrated that the adoption of DLRN would yield enhanced benefits for patients.
Controversy surrounds the diagnostic value of clinical data and US characteristics for PGTs. BPGTs typically exhibit well-defined margin, homogeneous echogenicity, and posterior acoustic enhancement in US images. In contrast, high-grade malignant tumors often display heterogeneous echogenicity, poorly-defined margin, and internal calcifications (27). However, PGTs encompass a wide range of histological types with diverse cellular origins or differentiations. Additionally, tumor cells can undergo various forms of metaplasia, resulting in variations or overlaps in the pathological and corresponding radiological manifestations. In this study, through univariate and multivariate logistic regression analysis, irregular shape, poorly-defined margin, and absence of posterior acoustic enhancement were identified as independent factors for MPGTs. These findings were consistent with previous studies. The clinical models demonstrated excellent performance in both the training set and testing set (AUC=0.897~0.952, 0.843~0.886).
Radiomics is the process that converts digital medical images into high-dimensional, mineable data. Numerous domestic and international studies have investigated its application in distinguishing PGTs (18–21). Qi et al. (19) conducted a study to differentiate between BPGTs and MPGTs, as well as different subtypes of benign tumors. The results demonstrated that the multi-sequence radiomics model based on conventional MRI exhibited excellent performance in classifying BPGTs and MPGTs, with further improvement when combined with clinical features (AUC=0.863). Li et al. (21) validated the effectiveness of radiomics analysis using conventional ultrasound (CUS) images for preoperative prediction of the malignant potential of parotid lesions. By combining radiomic features, CUS features, and clinical information in the nomogram, the ability to differentiate between benign and malignant parotid lesions was enhanced (AUC=0.91). The traditional radiomics models, combined with diverse classifiers, showed satisfactory diagnostic performance in our study. The training set had an AUC ranging from 0.768 to 0.960, while the testing set ranged from 0.738 to 0.853.
Feature extraction plays a crucial role in radiomics, but conventional radiomics often generate numerous low-level and predefined features that may not fully capture the heterogeneity of images. This limitation restricts the potential of radiomics models. In recent years, the integration of DL and radiomics has gained momentum due to the unique advantages of DL in computer vision and image recognition tasks. DL networks autonomously learn high-level features specific to research problems, enabling a more comprehensive reflection of information within lesions. However, their performance heavily relies on data volume and entails significant computational costs. Transfer learning can be leveraged by utilizing pre-trained DL networks from large-scale datasets like ImageNet and fine-tuning them for extracting DL features from smaller datasets for radiomics analysis. This approach helps mitigate overfitting issues caused by limited data availability and opens up new avenues for advancing radiomics (28). Existing studies have demonstrated that models combining DL features with radiomics features outperform those using either features alone in various clinical problems such as breast tumors (29), renal cystic lesions (30), meningiomas (31),and tuberculosis (32). In our study, while each individual model demonstrated satisfactory performance in isolation, the integration of DL with clinical and radiomics data yielded a more robust predictive tool, effectively capitalizing on the unique strengths of each individual component.
In a recent study examining the application of deep learning in parotid gland tumors, Liu et al. (33) evaluated five DL models (ResNet50, MobileNetV2, InceptionV1, DenseNet121 and VGG16) based on US images to differentiate PA and WT. DL models are superior to ultrasound and FNAC, the AUC value of these DL models in the test set was from 0.828 to 0.908 and ResNet50 demonstrated the optimal performance. In our study, we attempted to utilize various CNNs including Densenet121, VGG19, and Resnet50. The disparities in performance among different DL models can be attributed to variations in their internal network architectures. Specifically, Densenet121 (34) utilizes a dense connection structure wherein the output of each layer is directly connected to the input of all subsequent layers. This architectural design enhances scalability and parameter efficiency while mitigating gradient vanishing issues and expediting model training processes. Visualization using Grad-CAM demonstrated that model decision-making focused on edge areas of tumors predominantly, which aligned with clinical factors and contributed to interpretability of the models.
Selecting an appropriate and efficient modeling classifier is crucial for developing robust models. In the discrimination of BPGTs and MPGTs, Yu et al. (35) utilized SVM and LR paired with three feature selection methods, to construct distinct radiomics models based on multi-phase CT images. The results demonstrated that the SVM model utilizing a combination of three phases exhibited superior predictive performance, achieving an AUC of 0.936 in the testing set. Lu et al. (20) conducted radiomics analysis of PGTs employing five common machine learning classifiers based on plain CT images and observed variations in optimal classification efficacy among different subtypes of PGTs across these classifiers. Notably, the RandomForest model achieved the highest AUC (0.834) in distinguishing between BPGTs and MPGTs, indicating that model performance may be influenced by key tumor features as well as algorithmic characteristics inherent to each classifier. The ExtraTrees classifier demonstrated superior performance in the testing set of clinical, radiomics, and DLR models in our study. By incorporating additional randomness derived from RandomForest, the ExtraTrees effectively reduces model variance and enhances generalization capabilities, making it highly efficient for handling extensive datasets (36).
The rapid advancement of deep learning in computer vision has led to the emergence of highly competitive approaches in tumor-related domains through the integration of multi-modal and multi-omics features. Zhang et al. (37) proposed two multi-sequence networks (ResFN-Net and FN-Net),based on ResNet and ConvNeXt network respectively, incorporating attention mechanism for the classification of CDKN2A/B homozygous deletion status in IDH-mutant astrocytomas using CE-T1WI and T2WI MRI images. The FN-Net deep learning network based on ConvNeXt demonstrated superior predictive performance with an ACC of 0.9236 and an AUC of 0.9704. ConvNeXt network builds upon ResNet, drawing inspiration from the Swin Transformer and incorporating Spatial Pyramid Pooling (SPP) technology to effectively capture intricate details and global features. It has demonstrated comparable accuracy, scalability, and robustness as Transformer (38). The study conducted by Vanguri et al. (39) published in “Nature cancer” showcased the value of multimodal integration as well. Researchers have developed a multimodal DyAM model that combines histology, radiology, and genomics to accurately predict immunotherapy response in NSCLC patients. The model (AUC = 0.80, 95% CI 0.74-0.86) outperformed unimodal measures, including tumor mutation burden and programmed deathligand-1 immunohistochemistry score. These findings suggest that machine learning techniques combining multiple modalities have complementary and synergistic effects, facilitating oncology decision-making.
The present study is subject to certain limitations. Firstly, the retrospective design employed in this study may introduce potential selection bias. Secondly, patients were recruited from a single-center medical institution and lacked external validation. Future research should involve multi-center participation to expand the sample size and enhance model generalizability. Lastly, our feature extraction and model construction solely relied on conventional two-dimensional US images with manually delineated ROI, without incorporating other modalities such as elastography or contrast-enhanced imaging. Utilizing standardized single-modality images allows for easier acquisition and wider applicability and dissemination of the model. In future studies, we will concentrate on constructing models using multi-modal imaging to extract comprehensive information and integrating deep learning automatic segmentation algorithms to improve delineation accuracy and repeatability, thereby enhancing diagnostic performance.
5 Conclusions
This study demonstrated that the feature fusion DLR model based on US images exhibit superior classification performance in distinguishing between BPGTs and MPGTs, compared to clinical models, traditional radiomics models, and DL models. Moreover, by incorporating clinical and US factors, the performance of DLRN is further enhanced. This model holds immense potential for facilitating individualized diagnosis and treatment plans in clinical settings, thereby contributing to precision medicine.
Data availability statement
The raw data supporting the conclusions of this article will be made available by the authors, without undue reservation.
Ethics statement
The studies involving humans were approved by The Ethics Committee of The Fourth Hospital of Hebei Medical University. The studies were conducted in accordance with the local legislation and institutional requirements. Written informed consent for participation was not required from the participants or the participants’ legal guardians/next of kin in accordance with the national legislation and institutional requirements.
Author contributions
YiW: Conceptualization, Data curation, Investigation, Writing – original draft. JG: Investigation, Writing – original draft. ZY: Resources, Writing – original draft. YuW: Resources, Writing – review & editing. MS: Data curation, Writing – review & editing. RH: Writing – review & editing.
Funding
The author(s) declare that no financial support was received for the research, authorship, and/or publication of this article.
Acknowledgments
We would like to thank the patients who participated in this study. For advice regarding the code used in this revised manuscript, we thank OnekeyAI platform and its developers.
Conflict of interest
The authors declare that the research was conducted in the absence of any commercial or financial relationships that could be construed as a potential conflict of interest.
Publisher’s note
All claims expressed in this article are solely those of the authors and do not necessarily represent those of their affiliated organizations, or those of the publisher, the editors and the reviewers. Any product that may be evaluated in this article, or claim that may be made by its manufacturer, is not guaranteed or endorsed by the publisher.
Supplementary material
The Supplementary Material for this article can be found online at: https://www.frontiersin.org/articles/10.3389/fonc.2024.1384105/full#supplementary-material
References
1. Gao M, Hao Y, Huang M-X, Ma DQ, Chen Y, Luo HY, et al. Salivary gland tumours in a northern Chinese population: a 50-year retrospective study of 7190 cases. Int J Oral Maxillofac Surg. (2017) 46:343–9. doi: 10.1016/j.ijom.2016.09.021
2. Skálová A, Hyrcza M-D, Leivo I. Update from the 5th Edition of the world health organization classification of head and neck tumors: salivary glands. Head Neck Pathol. (2022) 16:40–53. doi: 10.1007/s12105-022-01420-1
3. Tian Z, Li L, Wang L, Hu Y, Li J. Salivary gland neoplasms in oral and maxillofacial regions: a 23-year retrospective study of 6982 cases in an eastern Chinese population. Int J Oral Maxillofac Surg. (2010) 39:235–42. doi: 10.1016/j.ijom.2009.10.016
4. van Herpen C, Vander Poorten V, Skalova A, Terhaard C, Maroldi R, van Engen A, et al. Salivary gland cancer: ESMO-European reference network on rare adult solid cancers (EURACAN) clinical practice guideline for diagnosis, treatment and follow-up. ESMO Open. (2022) 7:100602. doi: 10.1016/j.esmoop.2022.100602
5. Quer M, Vander Poorten V, Takes R-P, Silver C-E, Boedeker C-C, de Bree R, et al. Surgical options in benign parotid tumors: a proposal for classification. Eur Arch Otorhinolaryngol. (2017) 274:3825–36. doi: 10.1007/s00405-017-4650-4
6. Park Y-M, Kang M-S, Kim D-H, Koh Y-W, Kim S-H, Lim J-Y, et al. Surgical extent and role of adjuvant radiotherapy of surgically resectable, low-grade parotid cancer. Oral Oncol. (2020) 107:104780. doi: 10.1016/j.oraloncology.2020.104780
7. Schmidt R-L, Hall B-J, Wilson A-R, Layfield L-J. A systematic review and meta-analysis of the diagnostic accuracy of fine-needle aspiration cytology for parotid gland lesions. Am J Clin Pathol. (2011) 136:45–59. doi: 10.1309/AJCPOIE0CZNAT6SQ
8. Colella G, Cannavale R, Flamminio F, Foschini M-P. Fine-needle aspiration cytology of salivary gland lesions: a systematic review. J Oral Maxillofac Surg. (2010) 68:2146–53. doi: 10.1016/j.joms.2009.09.064
9. Mezei T, Mocan S, Ormenisan A, Baróti B, Iacob A. The value of fine needle aspiration cytology in the clinical management of rare salivary gland tumors. J Appl Oral Sci. (2018) 26:e20170267. doi: 10.1590/1678-7757-2017-0267
10. Zuo H. The clinical characteristics and CT findings of parotid and submandibular gland tumours. J Oncol. (2021) 2021:8874100. doi: 10.1155/2021/8874100
11. Sheikh K, Lee S-H, Cheng Z, Lakshminarayanan P, Peng L, Han P, et al. Predicting acute radiation induced xerostomia in head and neck Cancer using MR and CT Radiomics of parotid and submandibular glands. Radiat Oncol. (2019) 14:131. doi: 10.1186/s13014-019-1339-4
12. Moore M-G, Yueh B, Lin D-T, Bradford C-R, Smith R-V, Khariwala S-S. Controversies in the workup and surgical management of parotid neoplasms. Otolaryngol Head Neck Surg. (2021) 164:27–36. doi: 10.1177/0194599820932512
13. Itani M, Assaker R, Moshiri M, Dubinsky T-J, Dighe M-K. Inter-observer variability in the American college of radiology thyroid imaging reporting and data system: in-depth analysis and areas for improvement. Ultrasound Med Biol. (2019) 45:461–70. doi: 10.1016/j.ultrasmedbio.2018.09.026
14. Lambin P, Rios-Velazquez E, Leijenaar R, Carvalho S, van Stiphout R-G, Granton P, et al. Radiomics: extracting more information from medical images using advanced feature analysis. Eur J Cancer. (2012) 48:441–6. doi: 10.1016/j.ejca.2011.11.036
15. Peng Z, Wang Y, Wang Y, Jiang S, Fan R, Zhang H, et al. Application of radiomics and machine learning in head and neck cancers. Int J Biol Sci. (2021) 17:475–86. doi: 10.7150/ijbs.55716
16. Li M-D, Lu X-Z, Liu J-F, Chen B, Xu M, Xie X-Y, et al. Preoperative survival prediction in intrahepatic cholangiocarcinoma using an ultrasound-based radiographic-radiomics signature. J Ultrasound Med. (2022) 41:1483–95. doi: 10.1002/jum.15833
17. Jiang M, Li C-L, Luo X-M, Chuan Z-R, Chen R-X, Tang S-C, et al. Radiomics model based on shear-wave elastography in the assessment of axillary lymph node status in early-stage breast cancer. Eur Radiol. (2022) 32:2313–25. doi: 10.1007/s00330-021-08330-w
18. Zheng Y-M, Xu W-J, Hao D-P, Liu X-J, Gao C-P, Tang G-Z, et al. A CT-based radiomics nomogram for differentiation of lympho-associated benign and Malignant lesions of the parotid gland. Eur Radiol. (2021) 31:2886–95. doi: 10.1007/s00330-020-07421-4
19. Qi J, Gao A, Ma X, Song Y, Zhao G, Bai J, et al. Differentiation of benign from Malignant parotid gland tumors using conventional MRI based on radiomics nomogram. Front Oncol. (2022) 12:937050. doi: 10.3389/fonc.2022.937050
20. Lu Y, Liu H, Liu Q, Wang S, Zhu Z, Qiu J, et al. CT-based radiomics with various classifiers for histological differentiation of parotid gland tumors. Front Oncol. (2023) 13:1118351. doi: 10.3389/fonc.2023.1118351
21. Li Q, Jiang T, Zhang C, Zhang Y, Huang Z, Zhou H, et al. A nomogram based on clinical information, conventional ultrasound and radiomics improves prediction of Malignant parotid gland lesions. Cancer Lett. (2022) 527:107–14. doi: 10.1016/j.canlet.2021.12.015
22. McBee M-P, Awan O-A, Colucci A-T, Ghobadi C-W, Kadom N, Kansagra A-P, et al. Deep learning in radiology. Acad Radiol. (2018) 25:1472–80. doi: 10.1016/j.acra.2018.02.018
23. Chang Y-J, Huang T-Y, Liu Y-J, Chung H-W, Juan C-J. Classification of parotid gland tumors by using multimodal MRI and deep learning. NMR BioMed. (2021) 34:e4408. doi: 10.1002/nbm.4408
24. Shen X-M, Mao L, Yang Z-Y, Chai Z-K, Sun TG, Xu Y, et al. Deep learning-assisted diagnosis of parotid gland tumors by using contrast-enhanced CT imaging. Oral Dis. (2023) 29:3325–36. doi: 10.1111/odi.14474
25. Wang Y, Xie W, Huang S, Feng M, Ke X, Zhong Z, et al. The diagnostic value of ultrasound-based deep learning in differentiating parotid gland tumors. J Oncol. (2022) 2022:8192999. doi: 10.1155/2022/8192999
26. Yu Q, Ning Y, Wang A, Li S, Gu J, Li Q, et al. Deep learning-assisted diagnosis of benign and Malignant parotid tumors based on contrast-enhanced CT: a multicenter study. Eur Radiol. (2023) 33:6054–65. doi: 10.1007/s00330-023-09568-2
27. Stoia S, Băciuţ G, Lenghel M, Badea R, Băciuţ M, Bran S, et al. Ultrasonography techniques in the preoperative diagnosis of parotid gland tumors-an updated review of the literature. Med Ultrason. (2021) 23:194–202. doi: 10.11152/mu-2652
28. Li J, Dong D, Fang M, Wang R, Tian J, Li H, et al. Dual-energy CT-based deep learning radiomics can improve lymph node metastasis risk prediction for gastric cancer. Eur Radiol. (2020) 30:2324–33. doi: 10.1007/s00330-019-06621-x
29. Whitney H-M, Li H, Ji Y, Liu P, Giger M-L. Comparison of breast MRI tumor classification using human-engineered radiomics, transfer learning from deep convolutional neural networks, and fusion methods. Proc IEEE Inst Electr Electron Eng. (2020) 108:163–77. doi: 10.1109/jproc.2019.2950187
30. He Q-H, Feng J-J, Lv F-J, Jiang Q, Xiao M-Z. Deep learning and radiomic feature-based blending ensemble classifier for Malignancy risk prediction in cystic renal lesions. Insights Imaging. (2023) 14:6. doi: 10.1186/s13244-022-01349-7
31. Zhang J, Zhao Y, Lu Y, Li P, Dang S, Li X, et al. Meningioma consistency assessment based on the fusion of deep learning features and radiomics features. Eur J Radiol. (2024) 170:111250. doi: 10.1016/j.ejrad.2023.111250
32. Nijiati M, Guo L, Abulizi A, Fan S, Wubuli A, Tuersun A, et al. Deep learning and radiomics of longitudinal CT scans for early prediction of tuberculosis treatment outcomes. Eur J Radiol. (2023) 169:111180. doi: 10.1016/j.ejrad.2023.111180
33. Liu XH, Miao YY, Qian L, Shi ZT, Wang Y, Su JL, et al. Deep learning based ultrasound analysis facilitates precise distinction between parotid pleomorphic adenoma and Warthin tumor. Front Oncol. (2024) 14:1337631. doi: 10.3389/fonc.2024.1337631
34. Mastelini S-M, Nakano F-K, Vens C, de Leon Ferreira de Carvalho A-C-P. Online extra trees regressor. IEEE Trans Neural Netw Learn Syst. (2023) 34:6755–67. doi: 10.1109/TNNLS.2022.3212859
35. Yu Q, Wang A, Gu J, Li Q, Ning Y, Peng J, et al. Multiphasic CT-based radiomics analysis for the differentiation of benign and Malignant parotid tumors. Front Oncol. (2022) 12:913898. doi: 10.3389/fonc.2022.913898
36. Mancini T, Calvo-Pardo H, Olmo J. Extremely randomized neural networks for constructing prediction intervals. Neural Netw. (2021) 144:113–28. doi: 10.1016/j.neunet.2021.08.020
37. Zhang L, Wang R, Gao J, Tang Y, Xu X, Kan Y, et al. A novel MRI-based deep learning networks combined with attention mechanism for predicting CDKN2A/B homozygous deletion status in IDH-mutant astrocytoma. Eur Radiol. (2024) 34:391–9. doi: 10.1007/s00330-023-09944-y
38. Liu Z, Mao H, Wu CY, Feichtenhofer C, Darrell T, Xie S. A convnet for the 2020s. arXiv:2201.03545. (2022) 11966–76. doi: 10.1109/CVPR52688.2022.01167
Keywords: radiomics, deep learning, feature fusion, parotid gland tumors, nomogram, ultrasound
Citation: Wang Y, Gao J, Yin Z, Wen Y, Sun M and Han R (2024) Differentiation of benign and malignant parotid gland tumors based on the fusion of radiomics and deep learning features on ultrasound images. Front. Oncol. 14:1384105. doi: 10.3389/fonc.2024.1384105
Received: 08 February 2024; Accepted: 29 April 2024;
Published: 13 May 2024.
Edited by:
Lorenzo Faggioni, University of Pisa, ItalyReviewed by:
Jiawei Li, Fudan University, ChinaSanli Yi, Kunming University of Science and Technology, China
Copyright © 2024 Wang, Gao, Yin, Wen, Sun and Han. This is an open-access article distributed under the terms of the Creative Commons Attribution License (CC BY). The use, distribution or reproduction in other forums is permitted, provided the original author(s) and the copyright owner(s) are credited and that the original publication in this journal is cited, in accordance with accepted academic practice. No use, distribution or reproduction is permitted which does not comply with these terms.
*Correspondence: Ruoling Han, 46300347@hebmu.edu.cn