 Yang Li1,2
 Houlin Xia1Mingquan Wu1,2Jiabo Wang3Xiaohua Lu1,2Shizhang Wei2Kun Li2Lifu Wang3Ruilin Wang3Pan Zhao4Yanling Zhao2*Xiaohe Xiao3
- 1College of Pharmacy, Chengdu University of Traditional Chinese Medicine, Chengdu, China
- 2China Military Institute of Chinese Medicine, 302 Military Hospital of China, Beijing, China
- 3Department of Integrative Medical Center, 302 Military Hospital of China, Beijing, China
- 4Clinical Trial Center, 302 Military Hospital of China, Beijing, China
Skin infectious disease is a common public health problem due to the emergence of drug-resistant bacteria caused by the antibiotic misuse. Dracontomelon dao (Blanco) Merr. et Rolfe, a traditional Chinese medicine, has been used for the treatment of various skin infectious diseases over 1000 of years. Previous reports have demonstrated that the leaves of D. dao present favorable antibacterial activity against Escherichia coli, Pseudomonas aeruginosa, Staphylococcus aureus, and Bacillus subtitles. The flavonoids are the main components of the ethyl acetate extract of D. dao leaf. However, the correlation between flavonoids and antibacterial activities is yet to be determined. In this study, the combined antibacterial activities of these flavonoids were investigated. Three samples with the different concentrations of flavonoids (S1–S3) were obtained. By microcalorimetric measurements, the results showed that the IC50 value of S2 was lower than those of S1 and S3. The contents of main flavonoids (including Luteolin, L-Epicatechin, Cianidanol, and Quercetin) in S1–S3 were various, confirmed by the method of the Ultra High Performance Liquid Chromatography (UPLC). Based on the method of quadratic general rotary unitized design, the antibacterial effect of single flavonoid, and the potential synergistic effects between Luteolin and Quercetin, Luteolin and Cianidanol were calculated, which were also proved by microcalorimetric analysis. The antibacterial activities of main flavonoids were Luteolin > Cianidanol > Quercetin > L-Epicatechin. Meanwhile, the synergistic effects of Luteolin and Cianidanol (PL+C = 1.425), Quercetin and Luteolin (PL+Q = 1.129) on anti-microbial activity were validated. Finally, we found that the contents of Luteolin, L-Epicatechin, Cianidanol, Quercetin were 1061.00–1061.00, 189.14–262.86, 15,990.33–16,973.62, 6799.67–7662.64 ng·ml−1 respectively, with the antibacterial rate over 60.00%. In conclusion, this study could provide reference for quality evaluation and pharmacodynamics research of D. dao.
Introduction
Traditional Chinese medicine has a long history in the treatment of skin infections. The ancient Chinese people treated skin and soft tissue infections (SSTIs) with Kushen (Sophora flavescens Ait.) and Baixianpi (Dictamnus dasycarpus Turcz) 2000 years ago. Dracontomelon dao (Blanco) Merr. et Rolfe belongs to the Anacardiaceae family, a traditional Chinese medicinal material with regional feature, and has been widely used to treat various infectious diseases, such as decubitus and skin ulcers. Previous studies have showed that the ethanol extracts of the leaves of D. dao demonstrate anti-Staphylococcus aureus and anti-Bacillus subtitles activities (Khan and Omoloso, 2002). The subsequent studies from our research team have also indicated that the different extracts from the leaves of D. dao by means of systematic solvent extraction (including petroleum ether, chloroform, ethyl acetate, n-butanol, and water) show anti-Escherichia coli (the greatest IC50 value is 83.93 μg·ml−1) and anti-Staphylococcus aureus (the greatest IC0 value is 98.5 μg·ml−1) activities, especially the ethyl acetate fraction, the main components of which were flavonoids, including Cianidanol, L-Epicatechin, Quercetin, and Luteolin (Liu T. et al., 2013; Zhao et al., 2015), exhibit significant anti-Pseudomonas aeruginosa (IC50 = 18.06 μg·ml−1) activity (Wu et al., 2015). The metabolic power-time (P-t) curves were established (Kong et al., 2009b; Braissant et al., 2010; Ren et al., 2010; Kabanova et al., 2012). Moreover, the essential oil from the leaves of D. dao has been reported to have anti-tumor activity (Su et al., 2008). Taken together, extracts from the leaves of D. dao have possessed a high anti-infectious potential.
Microcalorimetry is a rapid, effective and sensitive technique of biological dection with no invasion and destructiveness to the subjects (Vor et al., 2002; Kong et al., 2009b; Wang et al., 2010), which has been widely used to investigate and evaluate the effect of natural product extracts on the metabolism of bacteria or cells (Baldoni et al., 2009; von et al., 2009; Manneck et al., 2011; Wenzler et al., 2012). The basic principle of microcalorimetry is that the growth or/and metabolism of organism consistent with the change of heat is real-time online recorded and further evaluated. Under a set of growth conditions, unique power—time curves presented by the heat produced in the growth of cells could be analyzed quantitatively and qualitatively by the microcalorimeter (Zhao et al., 2010, 2011; Liu T. et al., 2013; Zheng et al., 2014).
In our present study, three samples with the different concentrations of flavonoids (S1–S3) were obtained, and the combined antibacterial activities of flavonoids from these samples were investigated. The concentrations of these four flavonoids were measured by UPLC, and the parameters were calculated by the quadratic general rotary unitized design to predict the antibacterial effects of single and combined flavonoids with different concentration.
This study is aimed to investigate the main anti-bacterial components of the leaves of D. dao and analyze the interaction of flavonoids from leaf extracts, specifically to provide reference for the future research.
Materials and Methods
Samples, Chemicals, and Reagents
The leaves of D. dao (Blanco) Merr. et Rolfe were purchased from the Chinese herbal medicine market in Guangdong province of China and were authenticated by Professor Xiaohe Xiao (Department of Integrative Medical Center, 302 Military Hospital of China, 100, the 4th Ring Road, Beijing 100039, China.). The leaves were dried in shade and stored at room temperature.
Leaves of D. dao were crushed into powder, and decocted with eight times ultra-pure water by refluxing for 1.5 h with the procedure repeated again. After the combined extract filtered and evaporated, the water decoction was further extracted by ethyl acetate. Then ethyl acetate fraction was eluted by 70% alcohol within column chromatography of polyamide and three samples (S1–S3) were collected in succession by removing the solvent.
Escherichia coli [ATCC 25922] was provided by the American Type Culture Collection, Manassas, Virginia, USA. E. coli was inoculated in Luria-Bertani (LB) culture medium prepared by dissolving 10 g peptone, 5 g yeast extract, and 5 g NaCl in 1,000 ml ultra-pure water (pH 7.0–7.2) and sterilized by autoclaving at 0.1 MPa and 121°C for 30 min and then stored in a refrigerator at 4°C (Zhao et al., 2011). Before microcalorimetric measurements, E. coli was added to a 50 ml sterilized flask containing 30 ml LB culture medium and then incubated in incubator shaker for 2.5 h at 37°C (Liu T. et al., 2013) with the rotation speed at 75 rpm.
Polyamide for chromatography (60–100 mesh) was obtained from Mosu (the batch number: 20160223, Shanghai Mosu Science Equipment Co., Ltd., Shanghai, China). Ninety five percent ethanol was from Lircon (the batch number: 151111A, ShanDong LIRCON Medical Technology Co., Ltd., Shandong, China). Pure water was from Wahaha (the batch number: 201601185200TW, Hangzhou Wahaha Group Co., Ltd., Zhejiang, China). Chromatographic grade methanol was from Sigma Chemicals (the batch number: WXBC2019V, Sigma Scientific Co., L.L.C, USA).
The information of reference substance: Quercetin (prepared by laboratory, the degree of purity ≥98%), L-Epicatechin (the batch number: B-020-140923, the degree of purity ≥98%), Cianidanol (the batch number: E-011-140728, the degree of purity ≥98%), Luteolin (the batch number: M-007-150730, the degree of purity ≥98%). All reference substances but Quercetin were purchased from Chengdu Herbpurify bio-technology Co. Ltd., Chengdu, China.
Instruments
A microcalorimeter of type TAM 3114/3236 Bio-activity monitor (TA, Sweden) was used to determine the metabolic power–time (P–t) curves of E. coli growth. The TAM air microcalorimeter is an eight-channel heat conduction calorimeter for flow measurements under isothermal conditions. This microcalorimeter was thermostated at 37°C with a temperature error of ±0.02°C. The baseline stability was lower than 40 μW over 24 h (Kong et al., 2015). For more details of the performance and construction of the instrument, see the instruction and the report by Xie et al. (1988).
UPLC were performed using a Waters Acquity UPLC™ system (Waters, Milford, MA, USA), including binary solvent delivery pump, auto sampler manager, column compartment, and photo diode array detector, connected to Waters Empower 2 software.
Microcalorimetric Measurements
Sample Preparation
50.0 mg powder of flavonoids from D. dao was dissolved in 10 mL of LB culture medium. After filtration through millipore filter (pore size: 0.45 μm), sample solution was conducted at the concentration of 5.0 mg/mL for microcalorimetric measurements.
Experimental Procedure
This experiment was performed using the ampoule method and the microcalorimeter was thermostated at 37°C. One 20 mL sterilized glass ampoule was filled with 10 mL LB culture medium. while others were filled with 0.5 mL LB culture medium containing E. coli at a cell density of 1 × 10⁶ colony forming units (CFU)/ml (Kong et al., 2011) and different weight of flavonoids were added into each ampoule with a final volume of 10 ml. Eventually, each ampoule was sealed up and put into the eight-channel calorimeter block. When the temperature of ampoules reached 37°C, the P-t curves were recorded at an interval of 1 s until the recorder returned to the baseline. All data were collected continuously using the dedicated software package.
UPLC Analysis
Preparation of Reference Standard Solution
The standard solutions were prepared by accurately weighing. 20.0 mg of Cianidanol, L-Epicatechin, Quercetin, or Luteolin was added respectively into 10 mL of methanol to prepare the solutions with a concentration of 2 mg/ml, and then filtered through millipore filter with the pore size of 0.22 μm.
UPLC Conditions
The chromatographic separation was performed using a Waters Acquity BEH C18 column (50 × 2.1 mm, 1.7 μm) with Column temperature of 30°C. The mobile phase composed of solvent A (Chromatographic grade methanol) and solvent B [water solution of 0.15% (V/V) formic acid] was performed with a linear gradient: 0–3.8 min (5%, A), 3.8–4 min (5–30%, A), 4–14.8 min (30%, A), 14.8–15 min (30–50%, A), 15–18.8 min (50%, A), 18.8–19 min (50–95%, A), 19–20 min (95%, A) at a rate of 0.2 mL/min. The detection wavelength was set at 280, 350, 360 nm and the sample injection volume was designated as 2.0 μl, based on the Chinese Pharmacopoeia 2015 edition.
Statistical Analysis: Principal Component Analysis (PCA)
PCA is a famous technique used for reducing the dimensionality of the data, which can visualize the information of the dataset in a few principal components retaining the maximum possible variation within that set (Yi L. Z. et al., 2007; Yi Z. B. et al., 2007; Chen J. et al., 2008; Chen Y. et al., 2008). Hence, the metabolic P-t curves were analyzed to obtain the key thermodynamic parameters which reduced the dimensionality by PCA statistics (Kong et al., 2009a; Liu S. X. et al., 2013). The SPSS statistics software (SPSS for Windows 17.0, SPSS) was used during this process.
Quaternary Quadratic General Rotary Unitized Design
There are many restrictions on the orthogonal test, for instance, the multiple test numbers should be considered and the contribution of factors to the index is always uncertain and uncontrollable. Although the uniform design test could save test duration, the accuracy of results cannot be guaranteed. The statistical model of quaternary quadratic general rotary unitized design could not only solve the problems above, but also minimize the shortcomings that the variance of the prediction value of quadratic regression heavily depends on the position of the experimental point in factor space and the interference in error. The quaternary quadratic general rotary unitized design is effective and useful to get a better combination because of its high precision and less test times.
Results
Microcalorimetry
Normal Power–Time Curves of E. coli
When the suspensions of E. coli are introduced into the ampoules with LB culture medium, the heat-output signals are recorded to form the normal metabolic P-t curves of E. coli (Figure 1). The heat of bacteria represents its metabolic strength. The curve in Figure 1 shows the typical growth characteristics of E. coli and could be divided into five phases: the lag phase (from point A to point B in Figure 1), the first exponential growth phase (from B to C), the transition phase (from C to D), the second exponential growth phase (from D to E), and the decline phase (from E to F).
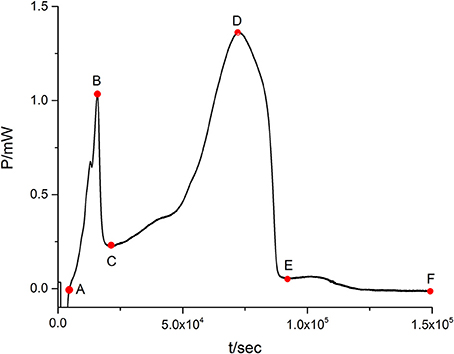
Figure 1. The normal metabolic P-t curve of E. coli. There is a show of five phases: the lag phase (from point A to point B in Figure 1), the first exponential growth phase (from B to C), the transition phase (from C to D), the second exponential growth phase (from D to E), and the decline phase (from E to F).
P-t Curve and Quantitative Thermo-Kinetic Parameters for E. coli Growth with Flavonoids
When the suspensions of E. coli are introduced into the ampoules with different concentrations of flavonoids, there exists corresponding changes in the P-t curve. As could be seen in Figure 2, Table 1, the P-t curves of low concentration flavonoids on E. coli had slight changes compared with control group. The P-t curves and quantitative thermo-kinetic parameters had obvious changes in high concentration, such as the peak of the second exponential growth phase reducing, the time of peak postponing, the slope of curves diminishing and the area of curves lowering. Besides, curves and parameters changed with the concentration increasing. All these demonstrated that the growth of E. coli was influenced by flavonoids in different degrees.
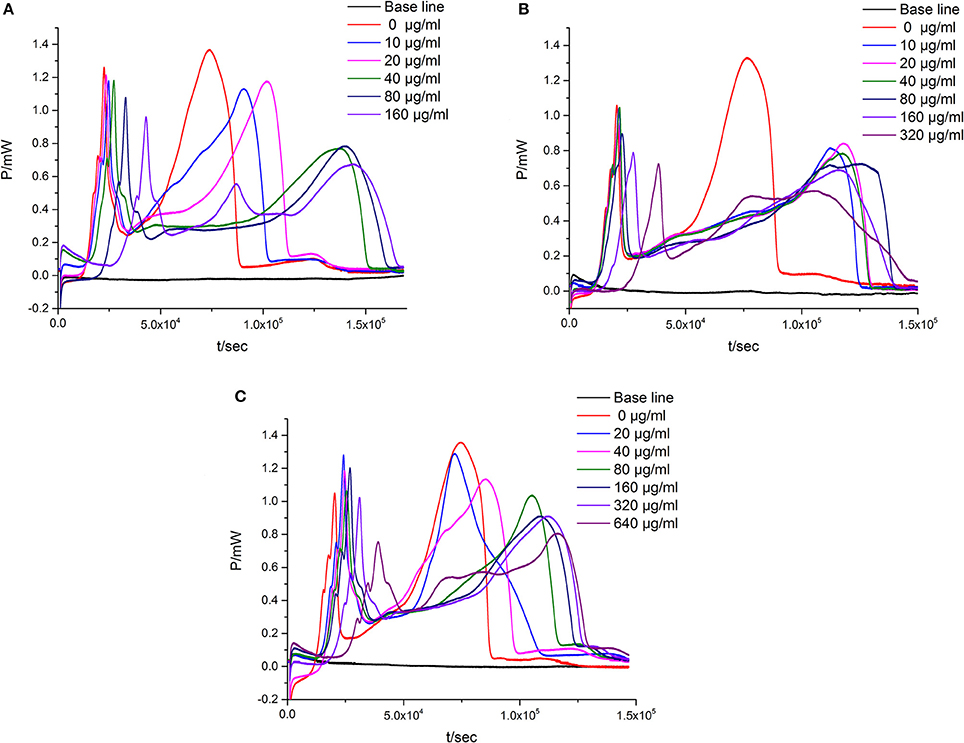
Figure 2. The P-t curves of E. coli intervened by three simples from leaves of Dracontomelon dao. (A) S1 simple, (B) S2 simple, (C) S3 simple.
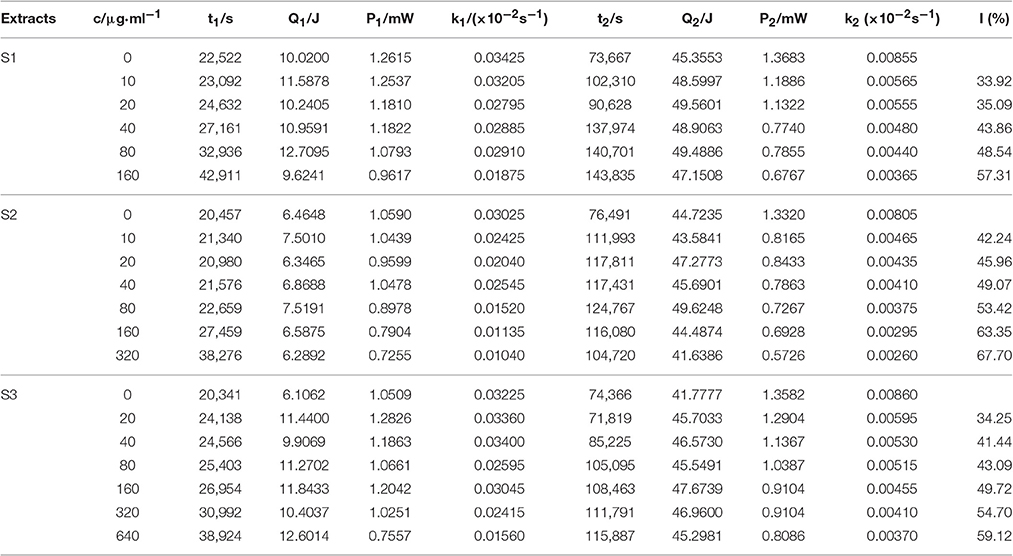
Table 1. The thermo-kinetic parameters from the P-t curves of the growth of E. coli in the presence of flavonoids from leaves of Dracontomelon dao.
Dose—Response Relationship among Thermo-Kinetic Parameters
The influence of flavonoids on the growth of E. coli could be quantitatively reflected from the changes of eight thermo-kinetic parameters in Figure 2. The P-t curve of E. coli growth could be fitted by two exponential functions. They both obey the following equation.
In this equation, P0 and Pt are the power at time 0 and t. Using this equation, the quantitative thermo-kinetic parameters such as the power of the first and second peak (P1 and P2) represent the strength of E. Coli metabolism.
The growth rate constants (k1 and k2) of the first and second exponential phase for E. coli growth at 37°C represent the rate of E. coli metabolism which is always a thermo-kinetic parameter. The heat outputs in stage 1 and stage 2 (Q1 and Q2) are obtained from the P-t curve of E. coli growth affected by different concentrations of flavonoids. The growth rate constant k1 and k2 and the correlation coefficient R (not listed, R > 0.9) are also calculated.
Principal Component Analysis (PCA) of the Eight Thermo-Kinetic Parameters
Eight thermo-kinetic parameters (P1, P2, t1, t2, Q1, Q2, k1, and k2) which profile the metabolism of E. Coli were obtained from the curves (Figure 2). Obviously, these parameters changes were in line with the concentration of flavonoids. It is necessary to find out the main parameter(s) playing crucial role in evaluating the anti-bacterial effects, but the key information reflected from these changes is hard to figure out. Hopefully, PCA could solve these problems well.
The eight quantitative parameters (P1, P2, t1, t2, Q1, Q2, k1, k2) were analyzed by PCA with the results indicating that the two principal components (ZS1−1 and Z S1−2, ZS2−1, and Z S2−2, ZS3−1, and Z S3−2) contained 90.284, 85.777, and 93.387% information of the original parameters in each sample.
A component correlation matrix of the principal components (Table 9) was obtained by PCA analysis. The component correlation of each factor is equivalent to the coefficient of the factor (normalized) in the principal component equation. The equation of main component was formed according to this matrix. Each quantitative parameter is normalized in this equation.
was the arithmetic mean of this quantitative parameter with si the standard deviation in standardized formula.
The equation indicated that P2, k1, and k2 might be the main parameters playing more important role in evaluating the anti-bacterial effects of D. dao leaf extracts.
Inhibition Ratio I of Samples S1–S3 on E. coli
According to the result of PCA, P2, k1, k2, and Q2 might be the main parameters. By further comparison of k1 and k2 from the equation, we found that k2 contributed more than k1 to PCA. So, the growth inhibition ratio I (%) could be calculated on the basis of k2 and can be defined as:
Where k0 refers to the growth rate constant of the control, kc refers to the growth rate constant in the second exponential growth phase at an inhibitor concentration of c.
The Probit regression with SPSS statistical analysis software was conducted to calculate the half-inhibitory concentration (IC50) after antibacterial rate counted. IC50 representing the sensitivity of bacteria to flavonoids was one of the most important indexes in evaluating the anti-bacterial activity of flavonoids. Table 2 showed the 95% confidence limit of IC50 for S1–S3.
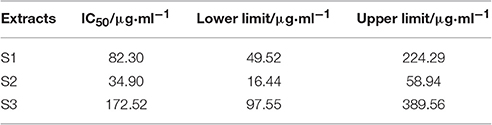
Table 2. Half inhibition rate of S1–S3 (95% confidence limits).
UPLC Analysis
The UPLC method in this research was newly established with main reference to Chinese Pharmacopoeia 2015 edition and the guidelines of the State Food and Drug Administration of China. We carried out the methodology validation of the UPLC method by Quercetin. External standard calibration lines were generated by injection of standard solutions at five concentrations in triplicate, plotting the peak area (y) obtained from the UPLC analysis against the concentration (x) of the standard material displaying a linear regression with correlation coefficient (r) calculated out.
The results of methodology validation showed that accuracy was obtained by 6 detection resulting in relative standard deviation (RSD) value < 0.99%. Repeatability was determined by analyzing six independent prepared solutions which resulted in RSD value < 1.32%, suggesting that this method had high repeatability. Stability was measured by repeating the analysis of the same sample solution at 0, 3, 6, 12, 24, and 48 h at room temperature with RSD value < 0.96%.
As shown in Table 3, the calibration curves displayed strong linearity over the concentration range of 1–100 μg·ml−1 (r = 0.9987) for Luteolin, 20–100 μg·ml−1 (r = 0.9999) for L-Epicatechin, 100–2000 μg·ml−1 (r = 0.9996) for Cianidanol, 20–800 μg·ml−1 (r = 0.9999) for Quercetin.
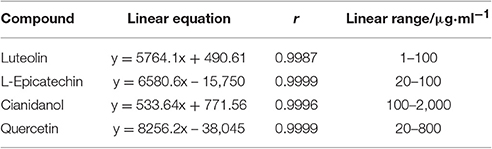
Table 3. the standard curve of four flavonoids.
The content of Luteolin, L-Epicatechin, Cianidanol, and Quercetin in S1–S3 were determined by external standard method. The linear equations of each standard substance were established through the peak area of five concentration gradient (Table 4).
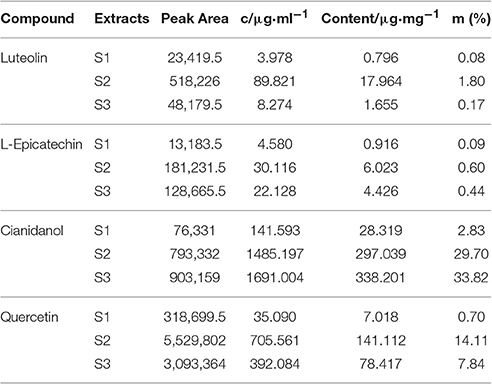
Table 4. The content of four flavonoids for S1–S3.
Figure 3 presented the UPLC characteristic spectrum of S1–S3 from D. dao under the optimized condition. The peak of flavonoids was characterized by large areas and good segregation from consecutive peaks.
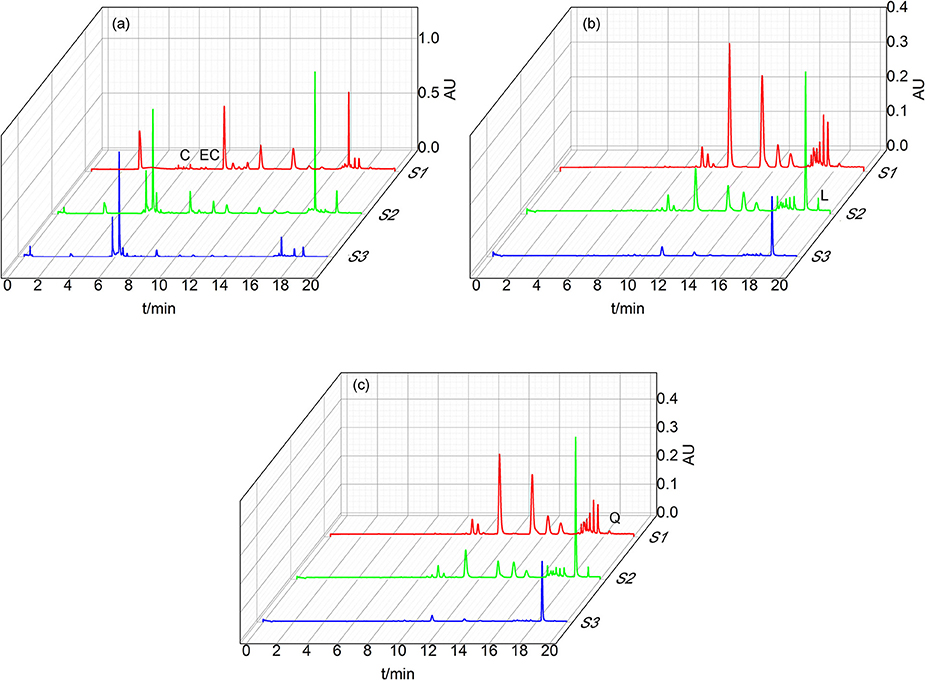
Figure 3. Chromatograms of S1–S3 under different wavelength. (a) is shown that the chromatograms under 280 nm in order to detect the content of L-Epicatechin and Cianidanol. (b) is shown that the chromatograms under 350 nm in order to detect the content of Luteolin. (c) is shown that the chromatograms under 350 nm in order to detect the content of Quercetin. Four peaks were identified by comparison with substances: Cianidanol (C), L-Epicatechin (EC), Luteolin (L), Quercetin (Q).
Figure 3a displayed the spectrum of S1–S3 under 280 nm with the retention time of L-Epicatechin (EC) and Cianidanol (C) 6.8 and 6.0 min, respectively. The content of L-Epicatechin in S1 and S3 were greater than that of S2 with 6.023 μg/mg in S1 and 4.426 μg/mg in S3, 0.60 and 0.44% in total mass, respectively. Likewise, the content of Cianidanol in S2 and S3 was greater than that of S1 with S2 297.039 and S3 338.20 μg/mg which were respectively 29.7 and 33.82% in total mass. Interestingly, the Cianidanol was most abundant among the four flavonoids.
As shown in Figure 3b, the spectrum of S1–S3 under 350 nm exhibited that the retention time of Luteolin (L) was 19.2 min and the content of Luteolin in S2 was much greater than both S1 and S3 with its concentration 89.821 μg/mg accounting for 1.80% in total mass. The spectrum of S1–S3 under 360 nm demonstrated that the retention time of Quercetin (Q) was 18.4 min with its concentration for S2 705.561 μg/mg (accounting for 14.11% in total mass), greater than S1 and S3. While that of Quercetin in S3 was 392.084 μg/mg, holding 7.84% in total mass (Figure 3c).
The total flavonoids for S1-S3 were 37.048, 462.139, and 422.698 μg·mg−1 respectively from the UPLC result, suggesting that the content of Luteolin in S2 was far greater than that of Luteolin of S1 and S3. The content of L-Epicatechin and Cianidanol in S2 and S3 was similar, but greater than S1. As for Quercetin, S2 was 2-folds than S3 with both S2 and S3 much >S1.
Results of Quadratic General Rotary Unitized Design Analysis
Determination of Code Level
Based on the IC50 of sample, S2 exhibited favorable anti-bacterial effect. The content of Luteolin, L-Epicatechin, Cianidanol, and Quercetin was defined as 0-code, and Luteolin (X1), L-Epicatechin (X2), Cianidanol (X3), and Quercetin (X4) were chosen as the four factor. The general quaternary quadratic designs of rotary combination statistical model (1/2 implement) was introduced to investigate the combined effect of four flavonoids with the use of microcalorimeter figuring out the antibacterial rate (Y-value) on different code level. The content of four flavonoids on different code level was illustrated on Table 5 with Table 6 and Figure 4 displaying experimental design scheme and the analysis result in Table 7.
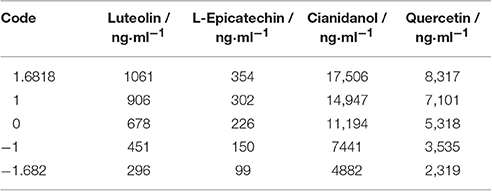
Table 5. The content of four flavonoids on different code level.
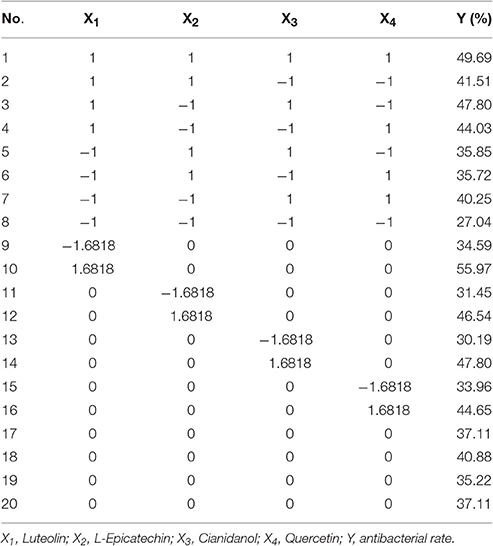
Table 6. Quaternary quadratic general rotary unitized design.
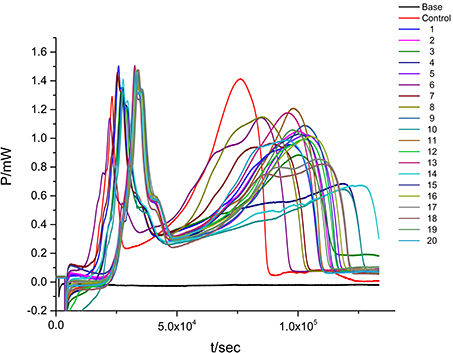
Figure 4. The P-t curves of E. coli at quaternary quadratic general rotary unitized design.
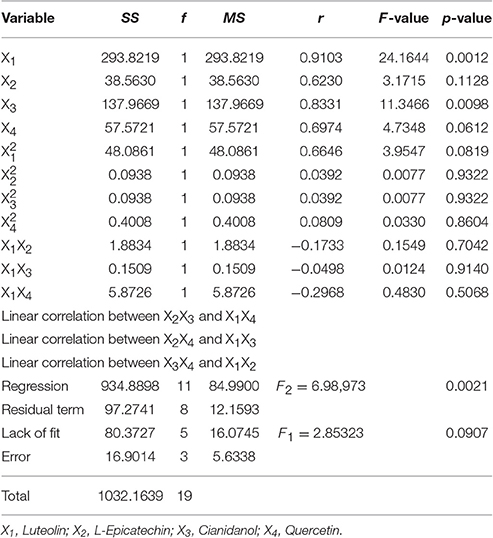
Table 7. The analysis of variance table for quadratic general rotary unitized design.
Results of Statistical Analysis
The regression equations of antibacterial rate were obtained from statistical model of quaternary quadratic general rotary unitized design. That was
The result (Table 7) of variance analysis with this model showed that F1 = 2.85323 (testing of lack of fit for regression equation of antibacterial rate) was < F0.05(5, 3) = 9.01, which suggested that the X factor had little influence on experimental result. Moreover, the test result for significance was that F2 = 6.98973 > F0.01(11, 8) = 5.74, demonstrating that the regression equation had significant difference. The mathematic model with good fitting degree could reflect the experimental file from the two aspects. Hence, the parameters calculated from the model had favorable confidence level.
In single-factor analysis procedure, the P-values of X1 (Luteolin) and X3 (Cianidanol) were < 0.01. Surprisingly, the P-values of (L-Epicatechin) and X4 (Quercetin) were >0.05. Moreover, the simplified four quaternary regression equation was calculated out without no-significance items of α = 0.10. That was
The four flavonoids had independent anti-bacterial effect with Luteolin and Cianidanol showing the main and better anti-bacterial effect from the analysis of variance table. In addition, the P-value of X1 (Luteolin) was less than X3 (Cianidanol) and the concentration range of X1 was 296–1061 ng·ml−1 far less than that of X3 (4482–17,506 ng·ml−1).
The diagram of single factor effect for S1–S3 was rationally calculated from the rotational combination design model. The single factor under different code level was predicted to make out the antibacterial rate (Y-value) with others factors as 0-code in this method.
The effect of different factors on bacteria could be observed via the range of each factor (the difference of Y-value for the highest code between the lowest one) and change tend single factor in the analysis of single factor effect. The result showed that X1 (Luteolin) mainly contributed to the antibacterial rate (Y-value) with X3 (Cianidanol) and X4 (Quercetin) contributing only marginally. Unexpectedly, X2 (L-Epicatechin) had little influence on antibacterial rate. Based on the range result, the sequence of antimicrobial activity was X1 (Luteolin) > X3 (Cianidanol) > X4 (Quercetin) > X2 (L-Epicatechin) consistent with the P-value of analysis of variance model, further validating the different anti-bacteria effect among the four individual compounds (Figure 5).
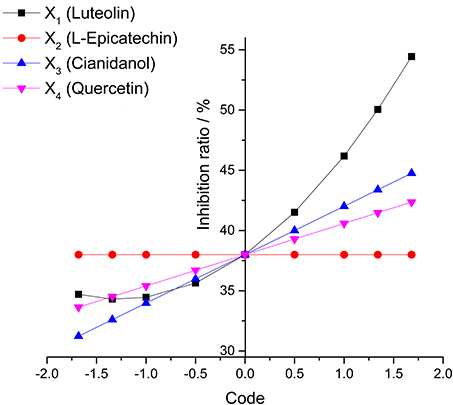
Figure 5. The analysis of single factor effect diagram.
Analysis of the effect of two-factor interaction that defined other factor as 0-code for the four flavonoids was obtained from the statistical model of quaternary quadratic general rotary unitized design. The changes of different factors on Y-value as well as the relationship between two factors could be found out via Y-value of two factors under different levels of code by mathematical model. The results showed that there were two couple of factors obvious and similar, such as the pair of Quercetin and Luteolin between Cianidanol and Luteolin (Figure 6).
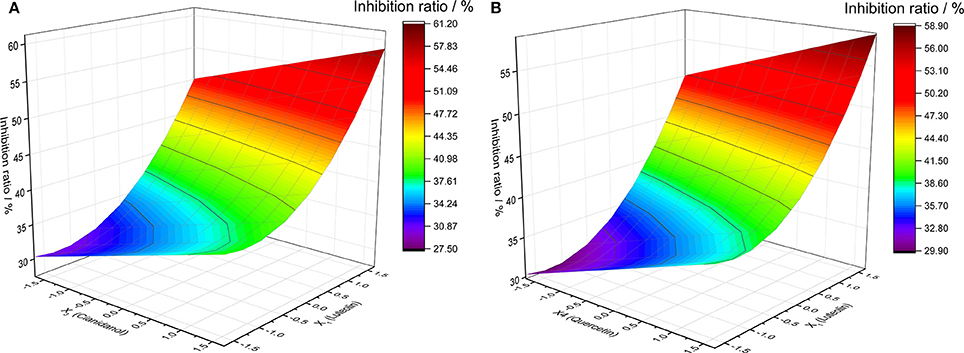
Figure 6. The analysis of two factors interaction effect diagram. (A) Luteolin and Cianidanol, (B) Luteolin and Quercetin.
The diagram of two-factor interaction effect for X1 (Luteolin) and X3 (Cianidanol) was rationally calculated from the rotational combination design model. When X1 and X3 factor were in high code level, the synergistic activity was obvious between X1 and X3 with the antibacterial rate (Y-value) in the top level, which suggested that there was a positive effect between high concentration of X1 (Luteolin) and X3 (Cianidanol) and antibacterial rate (Y-value). With the decline of code of Luteolin and Cianidanol, Y-value (antibacterial rate) decreased rapidly with a smaller degree. When the X1 code number was −1 to −1.6820, the Y-value decreased at first and increased later. When the X1 code number was −1.3410 and the X3 code number was −1.6818, the Y-value was 27.5466, which is the lowest point in this analysis model. Therefore, we predicted that there existed positive and synergistic effect between Luteolin and Cianidanol. When Luteolin and Cianidanol was in a higher concentration, there existed obvious synergistic effect between them. But when Luteolin and Cianidanol in low concentration, no marked synergistic effect was observed, even presenting slight antagonistic effects similar with the relationship of X1 (Luteolin) and X4 (Quercetin).
Obviously, the analysis showed that there existed both single factor effect and interaction among two factors. So it was difficult to find out the best antibacterial concentration and combinations from the results of the single factor effect and interaction analysis, and quaternary quadratic regression mathematical model did not have the maximum value of bacterial inhibition rate. The analysis method of frequency domain was performed to analyze and confirm this regression model and the combined optimum concentration (Table 8).
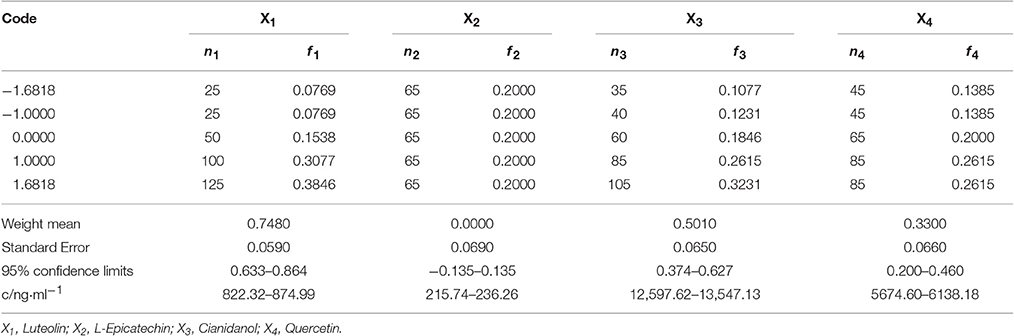
Table 8. Distribution frequency and interval of factor.
Table 8 showed the frequency distribution of 325 cases with antibacterial rate exceeding 39.87%. when antibacterial rate was over 39.87%, most cases could be obtained, verifying the mathematical regression model. Code value of factors was that X1: 0.633–0.864, X2: −0.135–0.135, X3: 0.374–0.627, X4: 0.200–0.460 under the condition that the antibacterial rate >39.87 within 95% confidence limits. In other words, Luteolin was 822.32–874.99 ng·ml−1, L-Epicatechin was 215.74–236.26 ng·ml−1, Cianidanol was 12,597.62–13,547.13 ng·ml−1, and Quercetin was 5674.6–6138.18 ng·ml−1.
To minimize the error for this experiment, the combined range was defined as Luteolin 850 ng·ml−1 (Code = 0.754), L-Epicatechin 220 ng·ml−1(Code = −0.079), Cianidanol 13,000 ng·ml−1 (Code = 0.481), and Quercetin 6,000 ng·ml−1 (Code = 0.382). The actual antibacterial rate was 45.96% according to the best combination close to the predicted value (46.22%) which further verified the rationality of regression model.
Finally, with the use of validated mathematical model, we finally obtained the combination that Luteolin was 1,061.00–1,061.00 ng·ml−1, L-Epicatechin was 189.14–262.86 ng·ml−1, Cianidanol was 15,990.33–16,973.62 ng·ml−1, Quercetin was 6,799.67–7662.64 ng·ml−1 with Y-value (inhibition rate) >60.00 within 95% confidence limits.
Anti-Microbial Activity of Single Flavonoid and Combination of Two Flavonoids
Anti-Microbial Activity of Single Flavonoid
To verify the result that antibacterial activity of the four major components from the leaves of D. dao is Luteolin > Cianidanol > Quercetin > L-Epicatechin based on the quadratic general rotary unitized design model, we determined the anti-bacterial activity of the four flavonoid independently using the microcalorimetry method (Figure 7) with the same parameter as above. The Probit regression with SPSS statistical analysis software was conducted to calculate the half-inhibitory concentration (IC50) after antibacterial rate counted. IC50 representing the sensitivity of bacteria to flavonoids was one of the most important indexes in evaluating the anti-bacterial activity of flavonoids. Table 9 showed the 95% confidence limit of IC50 for each flavonoid. The result showed that Luteolin (15.642 μg·ml−1), Cianidanol (17.584 μg·ml−1), and Quercetin (19.002 μg·ml−1) had lower IC50 values, except for L-Epicatechin. When the concentration of L-Epicatechin was increased to 32 μg/ml, the inhibition rate of L-Epicatechin was still < 50%. In the final calculation, only Probit regression can be used to predict the IC50 of L-Epicatechin (44.247 μg·ml−1). The exact IC50 of L-Epicatechin remains to be further analyzed yet, but that the antibacterial activity of L-Epicatechin is much weaker than that of Luteolin, and Cianidanol and Quercetin can be confirmed. By comparing the IC50 values, we can confirm that antibacterial activity of the four major components from the leaves of D. dao (Luteolin > Cianidanol > Quercetin > L-Epicatechin) based on the quadratic general rotary unitized design model is correct.
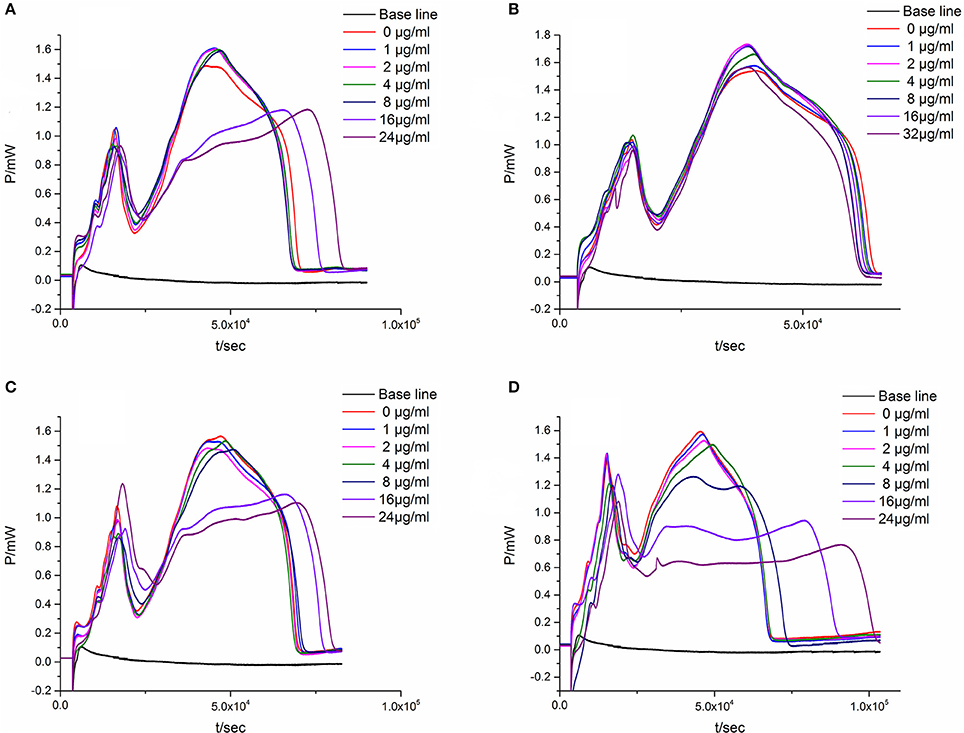
Figure 7. The P-t curves of E. coli intervened by single flavonoid. (A) Luteolin, (B) L-Epicatechin, (C) Cianidanol, (D) Quercetin.
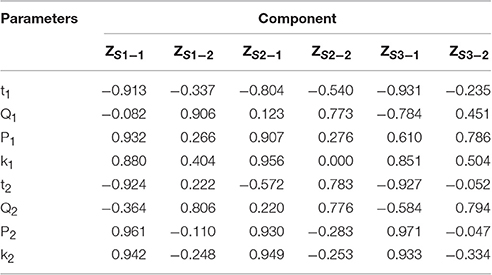
Table 9. Component correlation Matrix.
Anti-Microbial Activity of the Combination of Two Flavonoids
In the quadratic general rotary unitized design model, we analyzed two factors interaction effect: Luteolin and Cianidanol, Quercetin, and Luteolin had synergistic effects on antibacterial activity at high doses. In order to verify this result, we independently measured the antimicrobial activity of the two combinations. We referred to the proportion of flavonoids the anti-bacterial rate > 39.87 within 95% confidence limits from the quadratic general rotary unitized design model to determine the ratio of Luteolin and Cianidanol was 1:15, and the ratio of Luteolin and Quercetin was 1:7. microcalorimetry determination of half inhibition rate was also conducted to determine the anti-bacterial activity of flavonoids with the same anti-microbial activity indicators as above (Figure 8). The Probit regression with SPSS statistical analysis software was conducted to calculate the half-inhibitory concentration (IC50) after antibacterial rate counted. IC50 representing the sensitivity of bacteria to flavonoids was one of the most important indexes in evaluating the anti-bacterial activity of flavonoids. Table 9 showed the 95% confidence limit of IC50 for Luteolin and Cianidanol, Quercetin and Luteolin. The result showed that the IC50 values of the combination of Luteolin and Cianidanol was 11.566 μg/ml (722.9 ng·ml−1 for Luteolin, 10,843.1 ng·ml−1 for Cianidanol), and that of the combination of Luteolin and Quercetin was 14.721 μg·ml−1 (1840.1 ng·ml−1 for Luteolin, 12,880.9 ng·ml−1 for Cianidanol) within 95% confidence limits. The ratio of their anti-microbial activity P (in IC50 value) through the concentration ratio weighted average method based on the IC50 values of the four flavonoids alone and two combinations of two flavonoids was calculated. The results displayed that the IC50 value for the combination of Luteolin and Cianidanol was increased to 1.425-fold than the theoretical antibacterial activity of the same concentration of the compound alone and the IC50 value for the combination of Luteolin and Quercetin was 1.129-fold as much as the theoretical antibacterial activity of the same concentration of the compound alone. The synergistic effect of Luteolin and Cianidanol (PL+C = 1.425), Quercetin and Luteolin (PL+Q = 1.129) on anti-microbial activity could be confirmed, since the P-values of which were >1.
Cianidanol (C), Luteolin (L), Quercetin (Q).
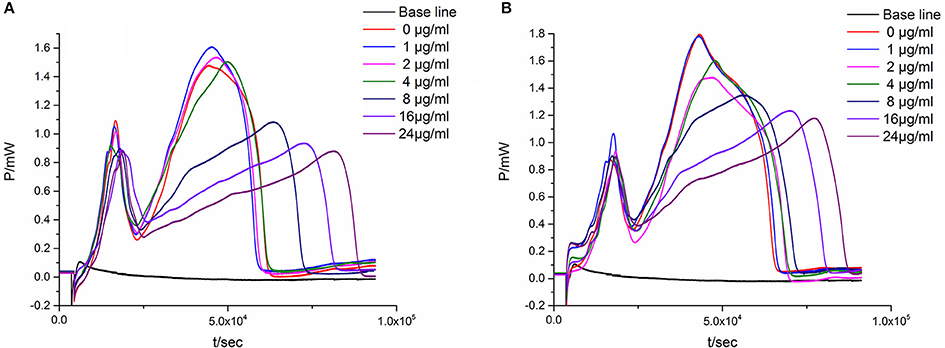
Figure 8. The P-t curves of E. coli intervened by the combination of two flavonoids. (A) Luteolin and Cianidanol, (B) Luteolin, and Quercetin.
Discussion
Escherichia coli, a Gram negative bacteria, is common and important to screen flavonoids with anti-bacterial activity as a model organism (Sondi and Salopek-Sondi, 2004). In the study, we investigated the anti-E. coli effect of three samples from the leaves of D dao (Blanco) Merr. et Rolfe by microcalorimetry and UPLC, and demonstrated that the anti-bacterial activity of the three samples (S1–S3) was various after E. coli was treated with three samples independently via microcalorimetry. According to the P-t curves of E. coli in Figure 2 and thermal-kinetic parameters in Table 1, it could be seen that the anti-bacterial activities of different simples varied in a dose-dependent manner with the IC50 value sequence S1>S3>S2.
The previous study has demonstrated that flavonoids are abundant in the leaves of D. dao, and their anti-bacterial activities have been reported by cumulative evidences. Ethanol extract from Mentha longifolia containing the components of Luteolin, Apigenin, Quercetin, and Kaempferol was the most active fraction against the tested bacteria (Akroum et al., 2009). The combination of Luteolin and Amoxicillin displayed synergistic activity against E. coli (Eumkeb et al., 2012). Furthermore, the novel Luteolin derivatives showed favorable antibacterial activity in vitro against B. subtilis, S. aureus, P. fluorescens, and E. coli (Lv et al., 2009).
In terms of IC50 values, the IC50 value of S2 was lower than those of S1 and S3, because the content and ratio of Luteolin, L-Epicatechin, Cianidanol, and Quercetin in S1-S3 were quite different. To be specific, the content of Luteolin in S2 was 22.5- and 10.8-fold than that of S1 and S3, respectively. The content of Quercetin in S2 was 20.1- and 1.8-fold than that of S1 and S3, respectively. However, the content of flavonoids in extracts did not show a linear relationship with the IC50 value, indicating that there existed unknown compounds with significant antibacterial activity from the leaves of D. dao.
The statistical model of quadratic general rotary unitized design was conducted to analyze the compounds interaction based on the content of four flavonoids in S2. We observed that the p-value of Luteolin (p = 0.0012) and Cianidanol (p = 0.0098) were < 0.01, which indicated that Luteolin and Cianidanol were very important factors (Table 7). Further research is needed to explore their antibacterial mechanism. Of note, Quercetin (p = 0.0612) and L-Epicatechin (p = 0.1128) were not the major factors of the antibacterial activity in the extract of the leaves of D. dao. The ultima result showed that the antibacterial activity of four flavonoids was Luteolin > Cianidanol > Quercetin > L-Epicatechin from the result of single factor analysis. And the IC50 values of each flavonoid evaluated by microcalorimetry confirmed the results above (the IC50 value of Luteolin was 15.642 μg·ml−1; the IC50 value of Cianidanol was 17.584 μg·ml−1; the IC50 value of Quercetin was 19.002 μg·ml−1; the IC50 value of L-Epicatechin was 44.247 μg·ml−1; Table 10).
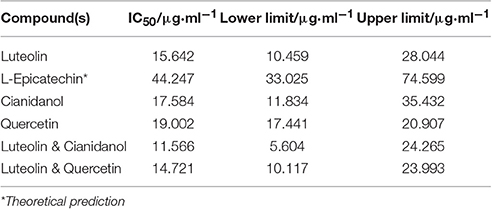
Table 10. Half inhibition rate of flavonoids (95% confidence limits).
The correlation analysis of two factors could be obtained from this model, indicating that the synergistic effects and concentrations of flavonoids were in a dose-dependent manner in a certain concentration range. In order to verify this deduction, we determined the IC50 value of the combination of Luteolin and Cianidanol (1:15), Luteolin and Quercetin (1:7) by microcalorimetry. The results showed that the combination of Luteolin and Cianidanol (PL+C = 1.425), Luteolin and Quercetin (PL+Q = 1.129) had synergetic effects, and the former couple showed stronger synergistic effect. Flavonoids had many different types of chemical structure. Luteolin and Quercetin had similar structural framework, but Quercetin had one more hydroxyl than Luteolin, thus we speculated that the antibacterial action sites of these two compounds may well be semblable. The chemical structures of Cianidanol and Luteolin are various, Luteolin has a unique carbon-carbon double bond and carbonyl compared to Cianidanol in a conjugate relationship. Compared with Luteolin, Cianidanol with a unique hydroxyl has a distinct synergistic effect on its anti-bacterial activity. The results could lay the foundation for exploring the synergistic mechanism of Luteolin and Cianidanol.
There may well exist other uncontrollable factors in UPLC with much larger peak area of substances not included as marker, thus their antimicrobial activities were not displayed under the application of quaternary quadratic general rotary unitized design.
The results of two-factor interaction effect analysis showed that Luteolin and Cianidanol had synergistic effect at high concentration. Interestingly, they were antagonistic in low concentration. Herein, a conclusion that the four flavonoids have anti-bacterial activity could be drawn. Together, this work could contribute to the quality evaluation and exploring the interaction among Luteolin, Quercetin, Cianidanol, and L-Epicatechin.
Author Contributions
YL did the writing of paper and polyamide column chromatography, Ultra High Performance Liquid Chromatography (UPLC) as well as micro-calorimetry and quaternary quadratic general rotary unitized design; YL, HX, YZ, and XX did the quaternary quadratic general rotary unitized design. MW, JW, XL, SW, KL, LW, RW, and PZ did the Ultra High Performance Liquid Chromatography (UPLC) as well as micro-calorimetry. HX, YZ, and XX supervised the project. All the authors read and approved the final manuscript.
Conflict of Interest Statement
The authors declare that the research was conducted in the absence of any commercial or financial relationships that could be construed as a potential conflict of interest.
Acknowledgments
The authors are grateful for the support from the National Major Drug Discovery Project (No: 2015ZX09J15102-004), the State Natural Science Foundation (No: 81573631) and the “12th Five-Year Plan” Foundation of China people's Liberation Army (No: CWS11C164).
References
Akroum, S., Bendjeddou, D., Satta, D., and Lalaoui, K. (2009). Antibacterial activity and acute toxicity effect of flavonoids extracted from Mentha longifolia. Am. Eurasia. J. Sci. Res. 4, 93–96.
Baldoni, D., Hermann, H., Frei, R., Trampuz, A., and Steinhuber, A. (2009). Performance of microcalorimetry for early detection of methicillin resistance in clinical isolates of Staphylococcus aureus. J. Clin. Microbiol. 47, 774–776. doi: 10.1128/JCM.02374-08
Braissant, O., Wirz, D., Gopfert, B., and Daniels, A. U. (2010). “The heat is on”: rapid microcalorimetric detection of mycobacteria in culture. Tuberculosis (Edinb) 90, 57–59. doi: 10.1016/j.tube.2009.11.001
Chen, J., Wang, F., Liu, J., Lee, F. S., Wang, X., and Yang, H. (2008). Analysis of alkaloids in Coptis chinensis Franch by accelerated solvent extraction combined with ultra performance liquid chromatographic analysis with photodiode array and tandem mass spectrometry detections. Anal. Chim. Acta 613, 184–195. doi: 10.1016/j.aca.2008.02.060
Chen, Y., Zhu, S. B., Xie, M. Y., Nie, S. P., Liu, W., Li, C., et al. (2008). Quality control and original discrimination of Ganoderma lucidum based on high-performance liquid chromatographic fingerprints and combined chemometrics methods. Anal. Chim. Acta 623, 146–156. doi: 10.1016/j.aca.2008.06.018
Eumkeb, G., Siriwong, S., and Thumanu, K. (2012). Synergistic activity of luteolin and amoxicillin combination against amoxicillin-resistant Escherichia coli and mode of action. J. Photochem. Photobiol. B 117, 247–253. doi: 10.1016/j.jphotobiol.2012.10.006
Kabanova, N., Stulova, I., and Vilu, R. (2012). Microcalorimetric study of the growth of bacterial colonies of Lactococcus lactis IL1403 in agar gels. Food Microbiol. 29, 67–79. doi: 10.1016/j.fm.2011.08.018
Khan, M. R., and Omoloso, A. D. (2002). Antibacterial and antifungal activities of Dracontomelon dao. Fitoterapia 73, 327–330. doi: 10.1016/S0367-326X(02)00076-X
Kong, W., Wang, X., Xing, C., Jin, X., Xiao, X. H., Zhao, Y. L., et al. (2011). Screening for novel antibacterial agents based on the activities of compounds on metabolism of Escherichia coli: a microcalorimetric study. J. Hazard. Mater. 185, 346–352. doi: 10.1016/j.jhazmat.2010.09.040
Kong, W., Zhao, Y. L., Xing, X., Ma, X., Sun, X., Yang, M., et al. (2015). Antibacterial evaluation of flavonoid compounds against E. coli by microcalorimetry and chemometrics. Appl. Microbiol. Biotechnol. 99, 6049–6058. doi: 10.1007/s00253-015-6711-1
Kong, W. J., Zhao, Y. L., Xiao, X. H., Li, Z. L., Jin, C., and Li, H. B. (2009a). Investigation of the anti-fungal activity of coptisine on Candida albicans growth by microcalorimetry combined with principal component analysis. J. Appl. Microbiol. 107, 1072–1080. doi: 10.1111/j.1365-2672.2009.04292.x
Kong, W. J., Zhao, Y. L., Xiao, X. H., Li, Z. L., and Ren, Y. S. (2009b). Action of palmatine on Tetrahymena thermophila BF5 growth investigated by microcalorimetry. J. Hazard. Mater. 168, 609–613. doi: 10.1016/j.jhazmat.2009.02.071
Liu, S. X., Zhao, Y. L., Zeng, N., Liu, T., Zhang, Y., Han, B., et al. (2013). Anti-bacterial effect of four extracts from leaves of Dracontomelon dao on Escherichia coli growth using microcalorimetry coupled with principal component analysis. J. Therm. Anal. Calorimetry 116, 491–497. doi: 10.1007/s10973-013-3516-2
Liu, T., Zhao, Y. L., Wang, J. B., Zhou, X., Sun, Z., Zheng, Q., et al. (2013). Action of crude Radix Aconiti Lateralis (Fuzi) and its processed products on splenic lymphocytes growth investigated by microcalorimetry. Therm. Acta 571, 1–7. doi: 10.1016/j.tca.2013.07.031
Lv, P. C., Li, H. Q., Xue, J. Y., Shi, L., and Zhu, H. L. (2009). Synthesis and biological evaluation of novel luteolin derivatives as antibacterial agents. Eur. J. Med. Chem. 44, 908–914. doi: 10.1016/j.ejmech.2008.01.013
Manneck, T., Braissant, O., Haggenmuller, Y., and Keiser, J. (2011). Isothermal microcalorimetry to study drugs against Schistosoma mansoni. J. Clin. Microbiol. 49, 1217–1225. doi: 10.1128/JCM.02382-10
Ren, Y.-s., Yan, D., Zhang, P., Li, H.-b., Feng, X., Zhang, Y.-m., et al. (2010). Hemagglutination activity of radix isatidis detected by microcalorimetry. Yao Xue Xue Bao 45, 1028–1034. doi: 10.16438/j.0513-4870.2010.08.006
Sondi, I., and Salopek-Sondi, B. (2004). Silver nanoparticles as antimicrobial agent: a case study on E. coli as a model for gram-negative bacteria. J. Colloid Interface Sci. 275, 177–182. doi: 10.1016/j.jcis.2004.02.012
Su, X. F., Liang, Z. Y., and Zhang, Y. X. (2008). Study on the chemical constituents of essential oil from the skins of stem of Dracontomelon dao (Blanco) Merr. et Rolfe. Lishizhen Med. Mat. Med. Res. 19, 1640–1641.
von, A. H., Wirz, U. D., and Daniels, A. U. (2009). Isothermal micro calorimetry: a new method for MIC determinations: results for 12 antibiotics and reference strains of E. coli and S. aureus. BMC Microbiol. 9:106. doi: 10.1186/1471-2180-9-106
Vor, T., Dyckmans, J., Flessa, H., and Beese, F. (2002). Use of microcalorimetry to study microbial activity during the transition from oxic to anoxic conditions. Biol. Fertil. Soils 36, 66–71. doi: 10.1007/s00374-002-0510-4
Wang, F., Yao, J., Chen, H., Chen, K., Trebse, P., and Zaray, G. (2010). Comparative toxicity of chlorpyrifos and its oxon derivatives to soil microbial activity by combined methods. Chemosphere 78, 319–326. doi: 10.1016/j.chemosphere.2009.10.030
Wenzler, T., Steinhuber, A., Wittlin, S., Scheurer, C., Brun, R., and Trampuz, A. (2012). Isothermal microcalorimetry, a new tool to monitor drug action against Trypanosoma brucei and Plasmodium falciparum. PLoS. Negl. Trop. Dis. 6:e1668. doi: 10.1371/journal.pntd.0001668
Wu, M. Q., Qu, F., Zhao, Y. L., Wang, J. B., Su, H., Chen, C., et al. (2015). Microcalorimetry and turbidimetry to investigate the anti-bacterial activities of five fractions from the leaves of Dracontomelon dao on P. aeruginosa. J. Therm. Anal. Calorimetry 123, 2367–2376. doi: 10.1007/s10973-015-4932-2
Xie, C. L., Tang, H. K., Song, Z. H., Qu, S. S., Liao, Y. T., and Liu, H. S. (1988). Microcalorimetric study of bacterial growth. Therm. Acta 123, 33–41. doi: 10.1016/0040-6031(88)80007-8
Yi, L. Z., Yuan, D. L., Liang, Y. Z., Xie, P. S., and Zhao, Y. L. (2007). Quality control and discrimination of pericarpium citri reticulatae and pericarpium citri reticulatae viride based on high-performance liquid chromatographic fingerprints and multivariate statistical analysis. Anal. Chim. Acta 588, 207–215. doi: 10.1016/j.aca.2007.02.012
Yi, Z. B., Yan, Y., Liang, Y. Z., and Bao, Z. (2007). Evaluation of the antimicrobial mode of berberine by LC/ESI-MS combined with principal component analysis. J. Pharm. Biomed. Anal. 44, 301–304. doi: 10.1016/j.jpba.2007.02.018
Zhao, Y. L., Liu, S. X., Qu, F., Wang, J. B., Hu, Y., Zhang, P., et al. (2015). Microcalorimetry coupled with principal component analysis for investigating the anti-Staphylococcus aureus effects of different extracted fractions from Dracontomelon dao. J. Therm Anal. Calorimetry 120, 913–920. doi: 10.1007/s10973-014-4268-3
Zhao, Y. L., Wang, J. B., Zhang, P., Shan, L. M., Li, R. S., and Xiao, X. H. (2010). Microcalorimetric study of the opposing effects of ginsenosides Rg1 and Rb1 on the growth of mice splenic lymphocytes. J. Therm. Anal. Calorimetry 104, 357–363. doi: 10.1007/s10973-010-1003-6
Zhao, Y. L., Wei, S. Z., Wang, J. B., Zhang, P., Li, R., and Xiao, X. H. (2011). Microcalorimetry coupled with principal component analysis for comparing the effects of two Panax species on mice splenic lymphocytes. J. Therm. Anal. Calorimetry 111, 1669–1674. doi: 10.1007/s10973-011-2060-1
Zheng, Q., Zhao, Y. L., Wang, J. B., Liu, T., Zhang, B., Gong, M., et al. (2014). Spectrum-effect relationships between UPLC fingerprints and bioactivities of crude secondary roots of Aconitum carmichaelii Debeaux (Fuzi) and its three processed products on mitochondrial growth coupled with canonical correlation analysis. J. Ethnopharmacol. 153, 615–623. doi: 10.1016/j.jep.2014.03.011
Keywords: Dracontomelon dao (Blanco) Merr. et Rolfe, antibacterial activity, E. coli, microcalorimetry, quaternary quadratic general rotary unitized design
Citation: Li Y, Xia H, Wu M, Wang J, Lu X, Wei S, Li K, Wang L, Wang R, Zhao P, Zhao Y and Xiao X (2017) Evaluation of the Antibacterial Effects of Flavonoid Combination from the Leaves of Dracontomelon dao by Microcalorimetry and the Quadratic Rotary Combination Design. Front. Pharmacol. 8:70. doi: 10.3389/fphar.2017.00070
Received: 26 July 2016; Accepted: 02 February 2017;
Published: 17 February 2017.
Edited by:
Adolfo Andrade-Cetto, National Autonomous University of Mexico, MexicoReviewed by:
Ashwell Rungano Ndhlala, Agricultural Research Council, South AfricaJian-Guo Ren, Harvard Medical School, USA
Weijun Kong, Institute of Medicinal Plant Development, China
Copyright © 2017 Li, Xia, Wu, Wang, Lu, Wei, Li, Wang, Wang, Zhao, Zhao and Xiao. This is an open-access article distributed under the terms of the Creative Commons Attribution License (CC BY). The use, distribution or reproduction in other forums is permitted, provided the original author(s) or licensor are credited and that the original publication in this journal is cited, in accordance with accepted academic practice. No use, distribution or reproduction is permitted which does not comply with these terms.
*Correspondence: Yanling Zhao, emhhb3lsMjg1NUAxNjMuY29t