 Mohsen Saeidi
 Ali Ahmadi2
 Mohammad-Reza Hajirezaei
- 1Department of Plant Production and Genetics, Razi University, Kermanshah, Iran
- 2Department of Agronomy and Plant Breeding, Faculty of Agricultural Sciences and Engineering, University of Tehran, Karaj, Iran
- 3Agricultural Biotechnology Research Institute of Iran (ABRII), Agricultural Research Education and Extension Organization (AREEO), Karaj, Iran
- 4Department of Physiology and Cell Biology, Leibniz-Institute of Plant Genetics and Crop Plant Research, Seeland, Germany
Abiotic stresses, including water deficit, cause myriad changes in plant metabolism. Metabolomics is a powerful tool for understanding plant resistance to such stresses. Therefore, this research was conducted to evaluate the effects of after anthesis water deficit (WD: from anthesis to maturity), i.e., maintaining moisture at field capacity (well-watered: WW) and 50% field capacity, on metabolome profiling (amino acids, hormones, nucleotides, soluble and insoluble sugars, sugar alcohols, and enzymes) in grains of two contrasting wheat cultivars grown in a greenhouse at Razi University as a factorial experiment. Based on the results, WD decreased grain yield (57%), 1000 grain weight (50%), and grain plant-1 (9%) in the sensitive cultivar (SC), while it had no significant effect on the tolerant cultivar (TC). In WW, the concentration of IAA, glucose, and fructose, as well as the activity of three invertase isoforms (vacuolic, cytosolic, and cell wall bound), were significantly higher at 10 days after anthesis compared to 17 and 31 days. In WD, these traits were significantly reduced in SC. ABA and sucrose concentration and sucrose synthase activity were significantly higher 17 days after anthesis than 10 days after anthesis. WD. In contrast to ABA, sucrose concentration decreased significantly in growing grains of SC in WD. The ATP/ADP ratio, inositol, glycerol and erythritol contents of TC were significantly higher in WD than in SC. Among the different amino acids, asparagine, glutamine and lysine were the highest, while ACC and methionine were the lowest. Contrary to SC, WD significantly increased the sum of the amino acid concentrations determined in the grains of TC, i.e. asparagine (22%), aspartic acid (48%), glycine (48%), ACC (79%) and valine (133%). These findings could help us to understand the resistance mechanisms to late season water deficit, which can increase sink strength (sink size and sink activity) and achieve higher yield quantity and quality in wheat.
1 Introduction
Among all crops, wheat has the largest harvested area with 221 million hectares and ranks fourth in global crop production (770 million tons) after sugarcane, maize, and rice (FAO, 2023). On average, this plant provides 20% of the carbohydrates and protein in the human diet (Shewry and Hey, 2015). The average global yield of this plant in 2021 was equal to 3492 kg ha-1, which is far from the yield potential of this plant (20 tons ha-1) (Mitchell and Sheehy, 2018; FAO, 2023).
Drought stress is the most critical factor limiting crop yield potential in arid and semi-arid regions of the world, especially for wheat at the after anthesis stage (Malko et al., 2022). On average, drought stress reduces the yield of crops, including wheat, by 21% (Daryanto et al., 2016) or 17-70% (Ahmadizadeh, 2013). Another study found that between 1980 and 2010, more than 40% of the change in wheat yield was related to drought and heat stress (Zampieri et al., 2017).
Examining the process of changes in metabolites in plant cells in the face of environmental stress is one of the important tools after examining gene expression to identify mechanisms of resistance or sensitivity to environmental stress, including drought stress (Abdelrahman et al., 2019; Kumar et al., 2021). The changes in some metabolites, such as proline, soluble sugars, and polyols, in the face of drought and other environmental stresses are not the same and often increase (Obata et al., 2020). In wheat, the role of different metabolites such as soluble sugars, amino acids, and tricarboxylic acid and enzyme activities such as antioxidant enzymes (catalase, peroxidase, superoxide dismutase) in the face of drought stress have been reported (Ullah et al., 2017; Du et al., 2020; Guo et al., 2020). In this context, Chen et al. (2023) and Kumar et al. (2021) stated that with changes in central metabolic pathways such as photosynthesis, sugar synthesis, tricarboxylic acid (TCA) cycle, glycolysis, the concentration of various metabolites such as fructose, sucrose, proline, and other amino acids changes play the critical role in the face of drought stress.
Plants produce primary metabolites such as sugars, polyols, and amino acids to resist environmental stresses (Fraire-Velázquez and Balderas-Hernández, 2013; Marček et al., 2019). Studies have shown that when wheat leaves undergo drought stress, there are significant alterations in the levels of amino acids (Guo et al., 2018; Lv et al., 2022), soluble sugars (Abid et al., 2018; Stallmann et al., 2020), organic sugars and amino acids (Guo et al., 2018), the activity of enzymes that are involved in sugar biosynthesis (Kutlu et al., 2021), and plant hormones (Luo et al., 2019; Itam et al., 2020). Nemati et al. (2018) and Kutlu et al. (2021) suggested that the tolerance of wheat to drought stress might be associated with sucrose metabolism.
Despite the metabolic studies conducted on crops under late-season water deficit, a comprehensive the research on the metabolic changes of growing wheat grains has been neglected. Therefore, this research was conducted to elucidate the metabolic responses in growing grains of a tolerant and a sensitive wheat cultivar to late season water deficit. To ensure accurate application of the water deficit treatment and other environmental factors such as temperature and light, this research was conducted in a greenhouse environment.
2 Materials and methods
2.1 Plant material and study site
In order to accurately control environmental factors influencing plant growth and to study plant metabolites, this research was conducted in the greenhouses of Razi University, Iran (34°21′N, 47°19′E, altitude 1319 meters above the sea level). Two contrasting wheat (Triticum aestivum L.) cultivars of Zagrose and Marvdasht, designated as tolerant cultivar (TC) and sensitive cultivar (SC) to after anthesis water deficit, respectively, were selected for the desired experiments (Najafian et al., 2011; Saeidi et al., 2012; Khoshro et al., 2013). The cultivars were obtained from the gene bank of Kermanshah Agricultural Research Center.
2.2 Experimental details
Plastic pots with a diameter of 15 cm and a height of 16.5 cm were selected and filled with 2.5 kg of a mixture of clay loam soil, sand, and farmyard manure in a ratio of 2:1:1, respectively. The fertilizer was applied at 100: 50: 50 kg ha-1 of N: P: K and maintained at ambient greenhouse conditions. The experiment was conducted in a greenhouse under controlled conditions with 16 hours of daylight at 25°C and 8 hours of night at 18°C. Conditions included 45% humidity and a photosynthetic photon flux density (PPFD) of 700 μmol m−2 s−1 for 16 hours. Supplementary lights and shade curtains were used to adjust the PPFD. The seeds were disinfected with Vitavax fungicide and planted at a depth of 3 to 5 cm. Ten seeds were planted per pot, and one week after emergence, the number of seedlings was reduced to five plants per pot. The humidity of all pots was precisely adjusted at the field capacity from planting to flowering. From the time of flowering, plants were subjected to two levels of water regimes: 1) well-watered condition (WW), where plants were watered regularly throughout the growing period of the plant and the water level was adjusted at field capacity to allow appropriate growth, and 2) water deficit (WD), where the water level of the pots was adjusted at 50% of field capacity from flowering to maturity. The water deficit treatment was applied as follows.
Pots of uniform weight and shape were filled with soil. After filling, the soil in the pots was completely saturated with water. The pots were then placed on mesh surfaces for 48 hours to remove excess water up to the field’s capacity. The pots were then quickly weighed, and their soil was dried completely at 105°C for 24 hours. Once the soil was dry, it was weighed again to measure its dry weight. Finally, the weight percentage of soil moisture at the field capacity and the amount of water needed for irrigation were calculated using specific formulas.
FC100% represents the percentage of soil moisture at the field capacity. SWFC and SWOven, refer to the weight of the soil at field capacity and oven-dried soil, respectively.
The following formula was used to calculate the weight of the pots at 50% of field capacity:
A50% is the total weight of the pot including the plant when the soil moisture level is 50% of its field capacity. F50% is the amount of moisture required to reach the field capacity of the soil. DW is the weight of the dry soil in the pot.
To include the weight of the plants in the amount of water required for each irrigation, five additional pots were considered in each treatment, and the weight of the plants was calculated weekly and subtracted from the weight of the pots. To accurately adjust the humidity of the pots to the extent of the field capacity and 50% of the field capacity, the humidity of all pots was measured daily at 9:00 am using a precision digital scale, and the required amount of water was added to the pots.
The pots were arranged in a factorial experiment based on a randomized complete block design. Each treatment was replicated four times. For seed metabolome analysis, samples were taken at three developmental stages (10, 17, and 31 days after anthesis). In addition to these three stages, hormones were sampled at 24 days after anthesis. For each treatment, three pots were used for sampling and harvesting times. Therefore, 210 pots were used.
Grains were frozen in liquid nitrogen on the dates indicated. They were then taken to the laboratory and stored in a research freezer at -80°C until analysis. The following metabolites were measured.
2.3 Hormones and metabolites measurement
2.3.1 Plant hormones
IAA and ABA concentrations in the growing grains were extracted, purified and quantified by reversed phase HPLC. The HPLC analysis was conducted using a Knauer HPLC system (1200 series) with a K-2501 UV detector as described by Kelen et al. (2004).
2.3.2 Soluble and insoluble sugars
Grain samples were extracted with 80% ethanol at 80°C for 60 minutes. Subsequently, the samples were centrifuged at 14000 rpm for 15 min, and the supernatant was used for the determination of glucose, fructose, and sucrose using a microtiter plate reader (EL808, Biotek company, Germany). The remaining leaf disc material was washed twice in ethanol and water and dried under the bench for 30 min. The determination of starch was carried out as described by (Ahkami et al., 2009).
2.3.3 Enzymes activity
The activity of invertase isoforms (apoplastic, cytosolic, vacuolic) and sucrose synthase was determined as described in Hajirezaei et al. (1994) with some modifications.
To measure enzyme activities, 100-200 mg powdered fresh grains were homogenized to a fine powder in 0.5 ml of 100 mM 4-(2-hydroxyethyl)-1-piperazine ethanesulphonic acid (Hepes)-KOH, pH=7.5, 2 mM MgCl2, 1 mM EDTA, 1 mM EGTA, 5 mM mercaptoethanol, 15% glycerine, and 0.1 mM pefabloc phosphatase inhibitor. After centrifugation at 13000 rpm for 10 min and 4°C, the supernatant was aliquoted and immediately frozen at -20°C for further analysis.
Alkaline invertase (cytosolic isoform): Alkaline invertase was assayed by adding extract to 100 µl containing 20 mM Hepes (pH=8) and 100 mM sucrose. The mixture was incubated at 37°C for 60 minutes and heated to 95°C for 4 minutes to inactivate the enzymes. Blanks were heated immediately after the addition of the extract. Glucose and fructose produced were determined by enzyme coupled assay as described by Ahkami et al. (2009).
Acid invertase (vacuolar isoform): Acid invertase was assayed by adding an aliquot of the extract to 100 µl containing 50 mM sodium acetate (pH=5.2) and 100 mM sucrose for 60 min at 37°C. The mixture was heated to 95°C for 4 min to inactivate the enzymes. After incubation, samples were neutralized by adding 10 µl of a solution containing 1 M Tris, pH=8.0. Blanks were heated immediately after adding the extract. Glucose and fructose produced were determined by enzyme coupled assay as described by Ahkami et al. (2009).
Acid invertase (apoplastic isoform): The pellet (apoplastic bound acid invertase) was resuspended in an equivalent volume of extraction medium before assay. The extract, including the pellet (equivalent to 1 mg FW), was incubated in 100 µl containing 100 mM sodium acetate (pH= 4.2) and 100 mM sucrose for 60 min at 37°C. Subsequently, 100 µl 5% (w/v) ZnSO4 was added to the mixture, incubated for 5 min on ice, and neutralized with 20 µl of saturated Ba(OH)2. Small aliquots (2.5 µl) were enzymatically assayed for glucose and fructose (Ahkami et al., 2009).
Sucrose synthase: Sucrose synthase activity was assayed by incubating ten microliters of extract (0.5 mg FW) in 100 µl assay medium (final volume) containing 20 mM Hepes-KOH (pH 8), 100 mM sucrose, four mM UDP for 30 min at 37°C followed by heating for 5 min, at 95°C). The formation of UDPGlc was assayed in 0.5 M glycine (pH 8.7), five mM MgC12, 2.5 mM NAD, and the addition of 20 mU UDPGlc dehydrogenase to start the reaction. Blanks, including buffer and extract, were prepared but heated to 95°C immediately after the addition of the extract (Ranwala and Miller, 1998).
2.3.4 Sugar alcohols
50 mg of powdered cereal material was used for the extraction of metabolites. 1 ml of extraction solvent containing chloroform, methanol and water in a ratio of 1:3:1 was added to the material. After 20 min of vortexing at four °C, the extract was centrifuged at 14000 rpm and four °C for 10 min (Sorvall, Germany). The supernatant was then evaporated to dryness in a speed vacuum, resuspended in ultrapure water and used for the determination of sugar alcohols by either ion chromatography (IC) or LC-MS. A Dionex system (Dionex Germany), including a gradient pump, degassing module, autosampler and pulsed electrochemical detector, was used to measure the sugar alcohols. Chromatograms were recorded using Dionex Chromeleon 6.8 chromatography software. Sugar alcohols were separated on an anion exchange column (CarrboPac MA1, 4 x 250 mm) connected to a precolumn (MA1 Guard 4 mm) and detected by a pulsed electrochemical detector. The gradient was established with 480 mM sodium hydroxide 50% solution (Baker, Germany). Detection was linear for 40 min.
2.3.5 Adenosine nucleotides
According to Haink and Deussen (2003), nucleotides were detected using a sensitive fluorescence method with some modifications. Prior to HPLC separation, an aliquot of the samples used for sugar alcohols was derivatized with 10% (v/v) chloracetaldehyde in 62 mM sodium citrate and 76 mM potassium dihydroxide phosphate, pH=5.2. The mixture was incubated at 80°C for 40 min, immediately cooled on ice, centrifuged at 14000 rpm for 1 min, and used for HPLC analysis. The separation was performed on a reversed-phase HPLC system (Alliance 2795, Waters, Germany) consisting of a gradient pump, a degassing module, an integrated microtiter plate autosampler, and a fluorescence detector. The gradient was accomplished with a buffer containing 5.7 mM tetrabutylammonium bisulfate (TBAS) and 30.5 mM potassium dihydroxide phosphate, pH 5.8, and an eluent containing pure acetonitrile (Roti C Solv HPLC, Roth, Karlsruhe, Germany). A single run was set to 4.5 min after a 3 min reconditioning with the eluent. The excitation wavelength was set at 280 nm, and the emission wavelength at 410 nm. In all cases, the chromatograms were integrated using the Empower software package.
2.3.6 Metabolite analysis
Liquid chromatography coupled to mass spectrometry (LC-MS) was used to determine the metabolites. For this purpose, 200 µl of the above extracts were purified using a microtiter plate containing a 10 KD filter (Microcon, 10 KD, Millipore). The plates were carefully centrifuged at 4°C and 4000 rpm for 60-80 minutes, and the filtrate was used directly for the measurement by LC-MS or stored at 80°C until analysis essentially as Ghaffari et al. (2016).
2.3.7 Amino acids
50 mg of grain samples were prepared in 1 ml 80% of ethanol for 60 min. at 80°C. The samples were centrifuged at 14000 rpm for 15 min, and the supernatant was evaporated to dryness, resuspended in purest water, and used for HPLC analysis.
Amino acid determination was essentially conducted as described in Mayta et al. (2018). In brief, samples were derivatized using the fluorescing reagent AQC (6-aminoquinolyl-Nhydroxysuccinimidylcarbamate). Three mg of home-made AQC (IPK, Germany) were dissolved in 1 ml acetonitrile and incubated for 10 min at 55_C. The reagent was stored at four °C and used for up to 4 weeks. For derivatization of the sample, 10 ml of the reagent solution were employed for each sample which contained 0.8 ml of 0.2 M boric acid, pH 8.8, and 10 ml of extract. Separation of soluble amino acids was performed by a newly developed method using ultra pressure reversed-phase chromatography (UPLC) AcQuity H-Class (Waters). The UPLC system consisted of a quaternary solvent manager, a sample manager-FTN, a column manager and a fluorescent detector (PDA el Detector). Separation was carried out on a C18 reversed-phase column (ACCQ Tag Ultra C18, 1.7 mm, 2.1 - 100 mm) with a flow rate of 0.7 ml per min and a duration of 10.2 min. The column was heated at 50°C during the whole run. Detection wavelengths were 266 nm for excitation and 473 nm for emission. The gradient was accomplished with four solutions prepared from two different buffers: eluent A concentrate and eluent B for amino acid analysis (Waters). Eluent A was pure concentrate, eluent B was a mixture of 90% LCMS water (Chemsolute) and 10% eluent B concentrate, eluent C was pure eluent B concentrate and eluent D was LCMS water. The column was equilibrated with a mixture of eluent A (10%) and eluent C (90%) for at least 30 min. The gradient was generated as follows: 0 min, 10% A and 90% C; 0.29 min, 9.9% A and 90.1% C; 5.49 min, 9% A, 80% B and 11% C; 7.1 min, 8% A, 15.6% B, 57.9% C and 18.5% D; 7.3 min, 8% A, 15.6% B, 57.9% C and 18.5% D; 7.69 min, 7.8% A, 70.9% C and 21.3% D; 7.99 min; 4% A, 36.3% C and 59.7% D; 8.68 min, 10% A, 90% C; and 10.2 min, 10% A and 90% C. Quantification was performed with Empower 3.0 (Waters GmbH, Germany).
2.4 Statistical analysis
After measuring and collecting the data, the symmetry of the data distribution was done using the Kolmogorov-Smirnov method (without skewness or kurtosis) with SPSS software (version 16, IBM Institute, USA). Analysis of variance (ANOVA) was performed using SAS software (version 9.2, SAS Institute, USA) to investigate the effect of moisture regime, cultivar and their two-way interaction on the concentration of the metabolites studied. Means were compared using the LSD test at the five per cent probability level (Steel et al., 1997).
3 Results
3.1 Yield and related traits
Significant differences in biomass yield (BY), grain yield (GY), 1000 grain weight (GW) and number of grains per ear (NG) were observed in two cultivars under well-watered and water-deficient conditions (Table 1). In the well-watered treatment, the above traits were significantly higher in SC than in TC. Water deficit significantly reduced BY, SY, GW and NG in SC but had no significant effect on these traits in TC. Under the well-watered treatment, the two varieties had no significant difference in harvest index (HI). However, under water deficit, HI was significantly reduced in SC from 59 to about 37%, whereas it was slightly reduced in TC from 57 to 50% (Table 1).
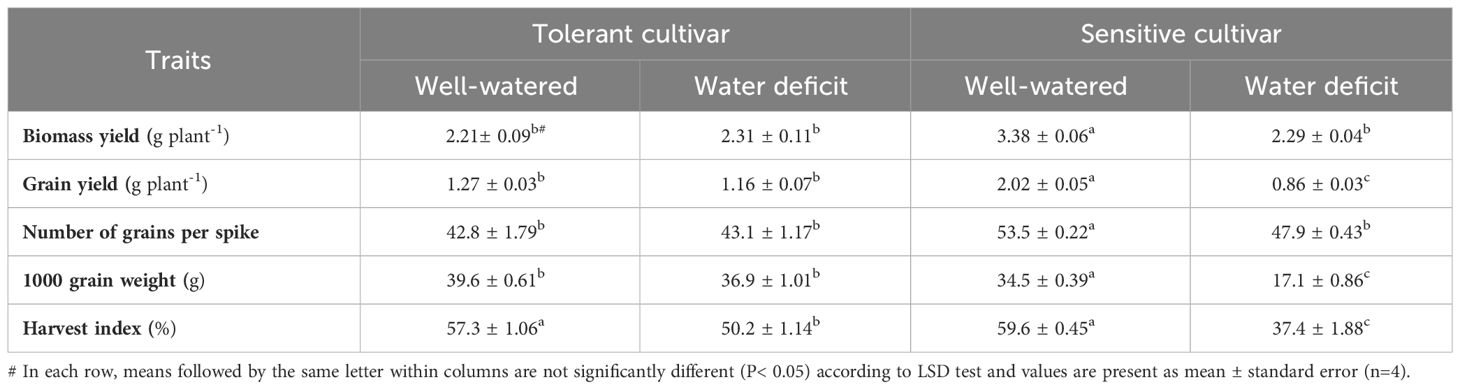
Table 1 Mean comparison of grain yield and related traits under after anthesis water deficit in two bread wheat cultivars.
3.2 IAA and ABA in the grain
In the WW treatment, the concentration of IAA in the grains of the SC (33 ± 2.2 nmol g-1 fw) was higher than that of the TC (22.9 ± 0.2 nmol g-1 fw) (Figure 1A). WD treatment caused a continuous reduction in IAA concentration during grain development in both cultivars to a similar extent, about 2-fold (Figure 1B). In the WW and the WD treatments, the concentration of ABA in the grains of SC was slightly higher compared to TC at all stages of grain development. However, A similar trend was observed for both cultivars before and during grain development, reaching a maximum concentration at 17 days after anthesis and decreasing again to the initial concentration (Figures 1C, D).
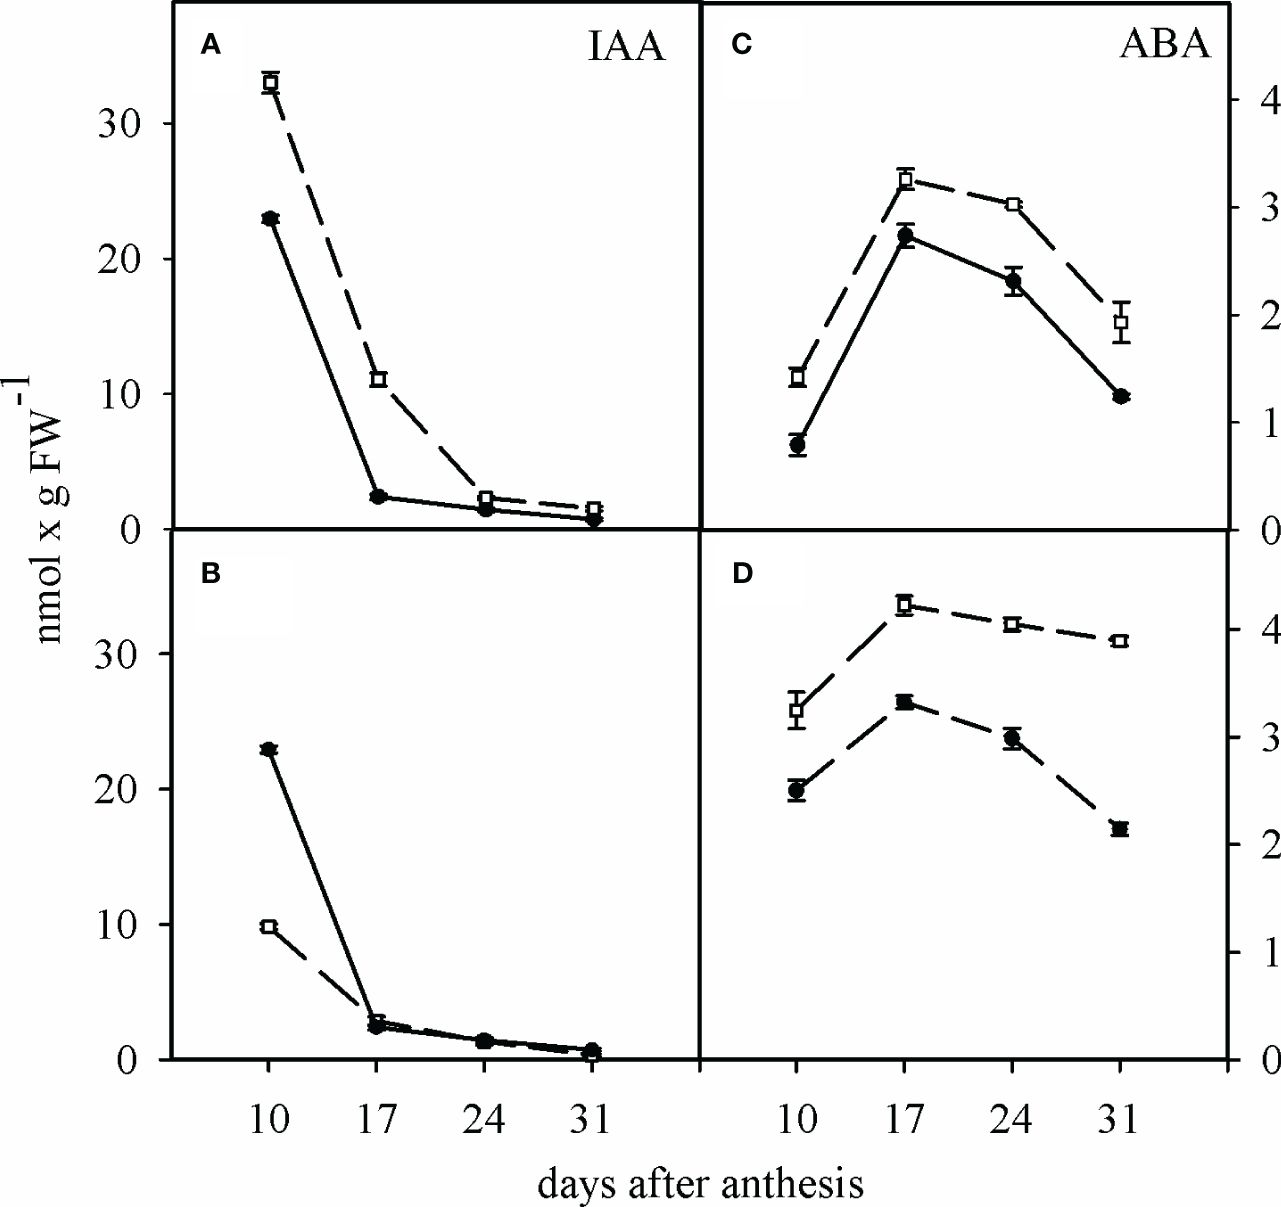
Figure 1 Change of IAA and ABA concentration in the grains of the sensitive and tolerant bread wheat cultivars at different developmental stages under water deficit. Dashed and solid lines show sensitive and tolerant cultivars, respectively. (A, C) are well-watered and (B, D) are after anthesis water deficit, respectively. Values are presented as mean ± standard error (n=4).
3.3 Soluble and insoluble sugars in the grain
Glucose and fructose concentrations in the growing grains of two contrasting cultivars decreased significantly from 10 to 31 days after anthesis. In contrast to glucose and fructose concentrations, sucrose concentration in the growing grains increased from 10 to 17 days after flowering in both cultivars and decreased until 31 days after flowering. Changes in starch concentration in growing grains were not similar to those of the soluble sugars analyzed (glucose, fructose, and sucrose). Under this condition, starch concentration in growing grains increased from 10 to 31 days after flowering in both cultivars investigated (Figures 2A, C, E, G).
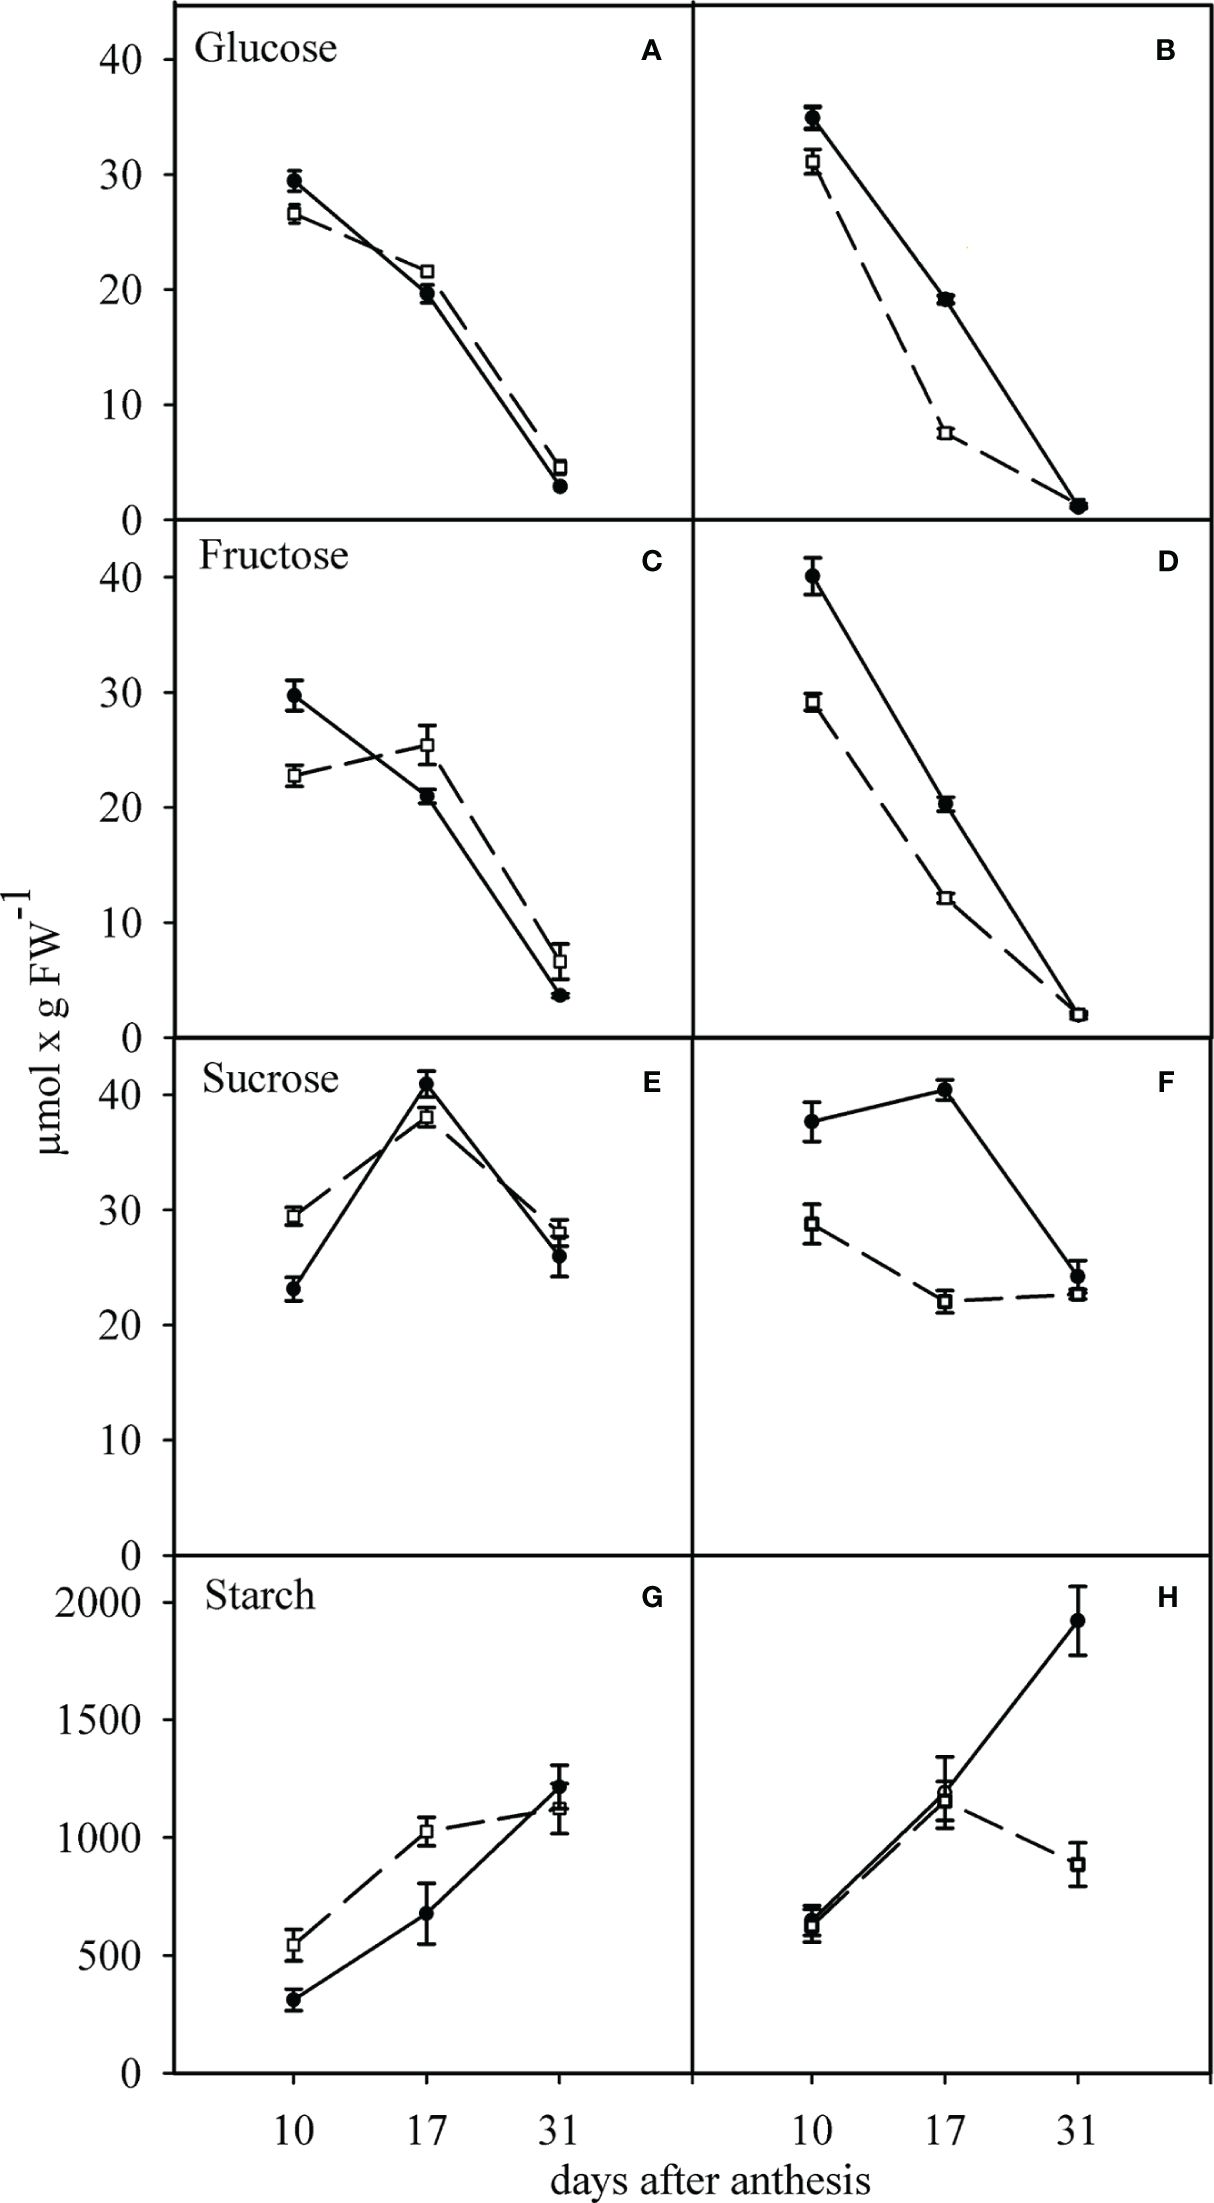
Figure 2 Effect of water deficit on the concentrations of glucose (A, B), fructose (C, D), sucrose (E, F) and starch (G, H) in sensitive (dashed line) and tolerant (solid line) cultivars. (A, C, E, G) show the well-watered condition and (B, D, F, H) the condition of after anthesis water deficit. Values presented are mean ± standard error (n=4).
Exposure of the growing grains to WD caused a significant decrease in glucose and fructose concentration in both TC and SC grains at various grain growth stages. In this condition, the concentration of glucose and fructose decreased more in the grains of the SC (Figures 2B, D).
A similar behavior was observed for sucrose content under WD condition, where sucrose decreased continuously in the SC. In contrast, it increased in the TC 10 days after anthesis. It remained unchanged 17 and 31 days after anthesis (Figure 2F). WD treatment caused a significant reduction in starch accumulation in the growing grains of the SC, especially at 31 days after anthesis, compared to the WW treatment. However, under WD, starch accumulation in the growing grains of the TC was higher than in the WW treatment and had an increasing trend (Figures 2G, H).
3.4 Enzymes activity in the grain
Sucrose synthase activity was high at 17 and 31 days compared to 10 days after anthesis in both WW and WD conditions (Figures 3A, B). The activity of all three isoforms of invertase (alkaline, cell wall bound, and cytosolic) decreased significantly from 10 to 31 days after anthesis in both cultivars and in WW and WD conditions, (Figures 3C–H). Among the different isoforms of invertase, the apoplastic isoform had the highest activity, and the cytosolic one had the lowest. In two cultivars, WD significantly increased sucrose synthase activity, especially in TC, and significantly decreased alkaline, cell wall bound, and cytosolic isoforms of invertase. Under WD condition, activity of alkaline and cell wall bound isoforms of invertase were significantly higher in the TC, and activity of cytosolic isoform of invertase was significantly higher in the SC (Figures 3B, D, F, H).
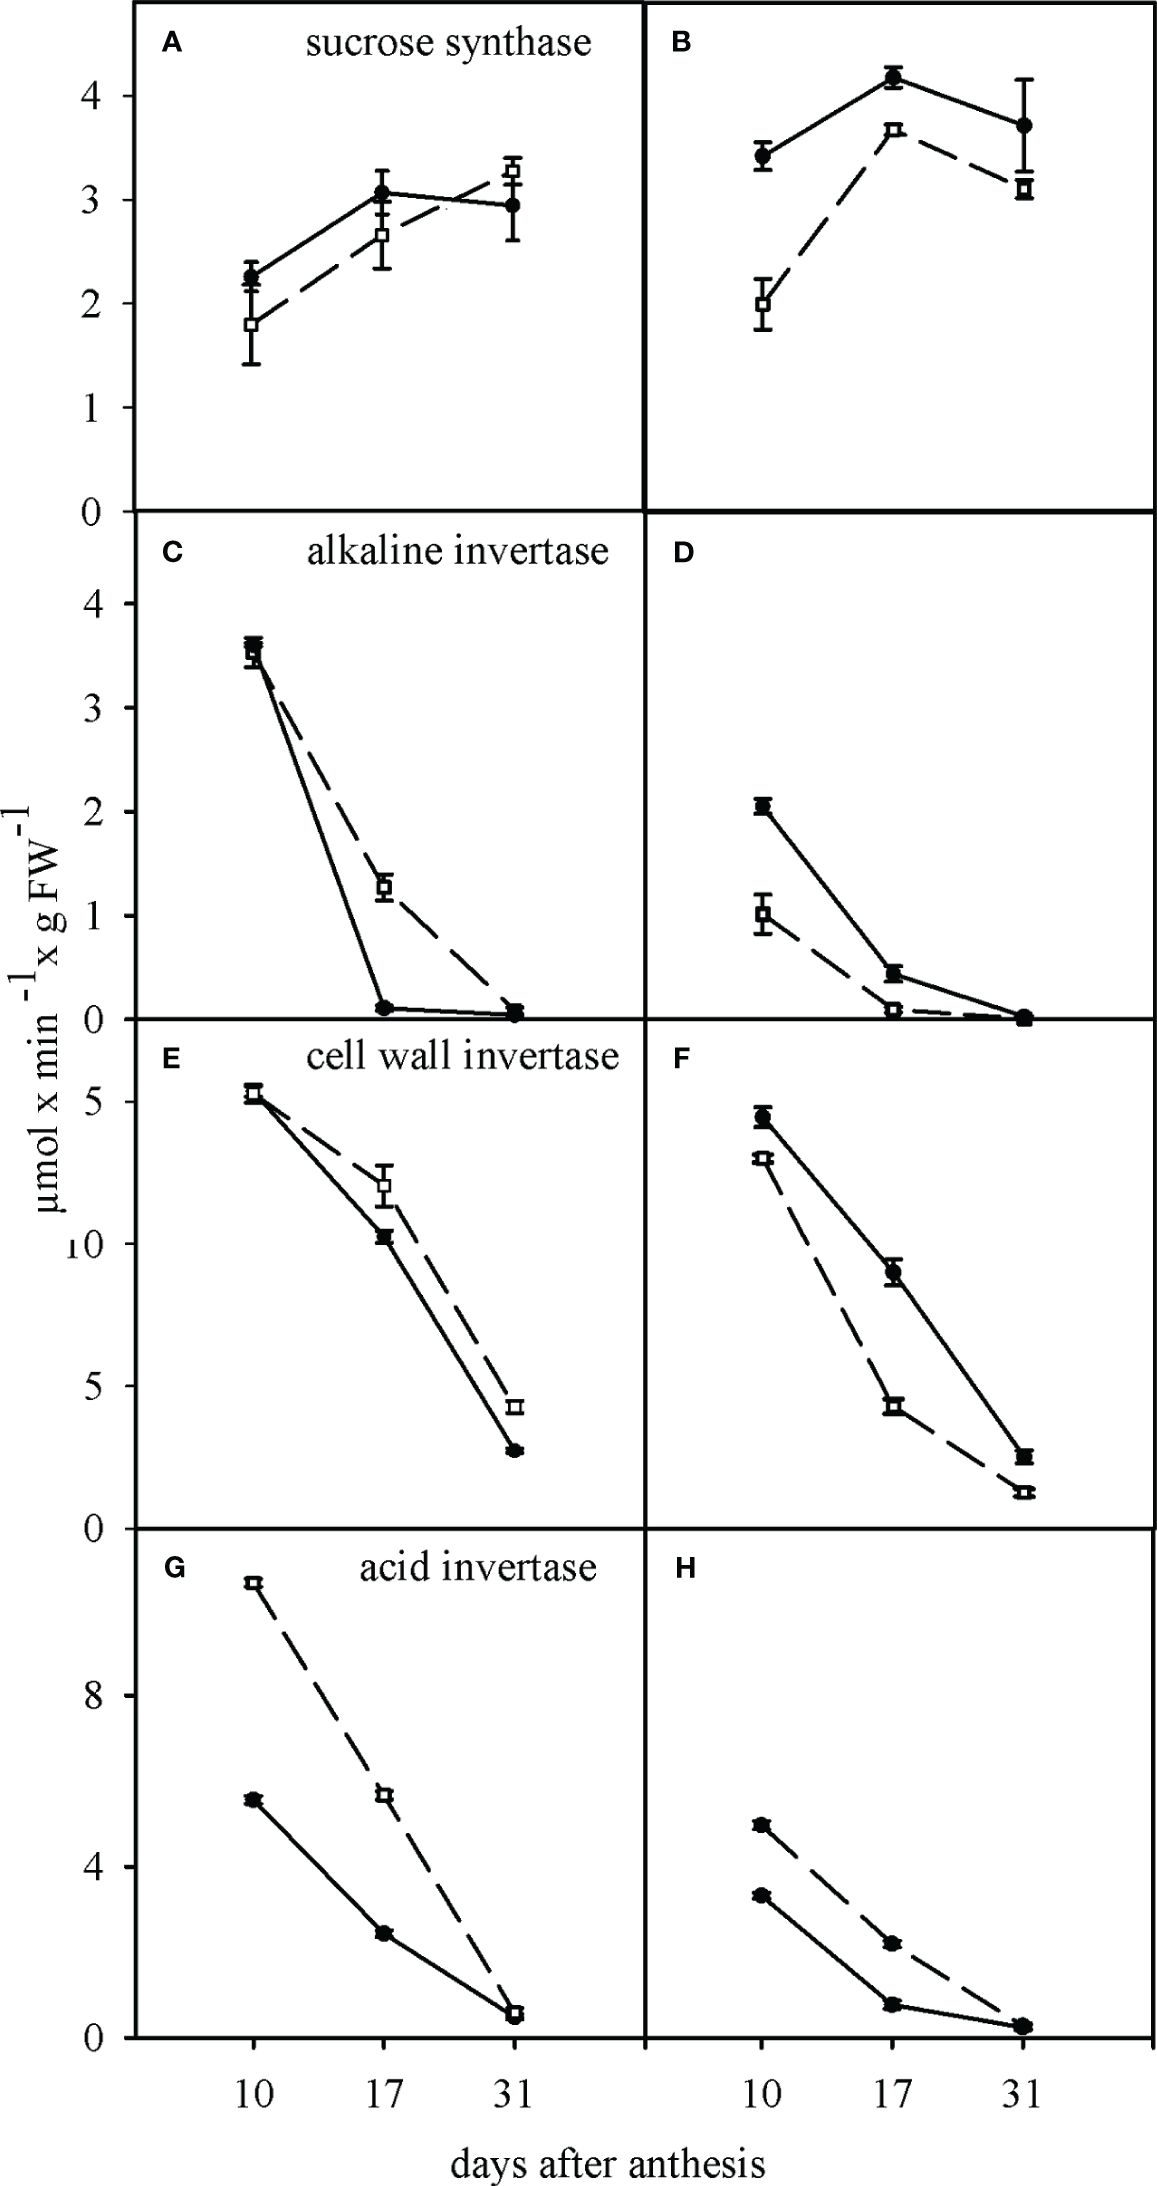
Figure 3 Effect of water deficit on the activity of sucrose synthase (A, B), alkaline invertase (C, D), cell wall invertase (E, F) and acid invertase (G, H) in sensitive (dashed line) and tolerant (solid line) cultivars. (A, C, E, G) show the well-watered condition and (B, D, F, H) the condition of after anthesis water deficit. Values presented are mean ± standard error (n=4).
3.5 Sugar alcohols in the grain
Under WW condition, the inositol, glycerol, and erythritol concentrations in the growing grains of two cultivars were significantly higher at 17 days after anthesis compared to 10 and 31 days after anthesis. At this stage, the SC had more inositol and glycerol in its growing grains than the TC (Figures 4A, C, E). In contrast to the TC, the inositol content of the growing grains of the SC was significantly affected by the WD. WD significantly decreased the inositol, glycerol, and erythritol concentration in the grains of the SC 17 days after anthesis, but it had no significant effect on the content of these sugars in the grains of the TC (Figures 4B, D, F).
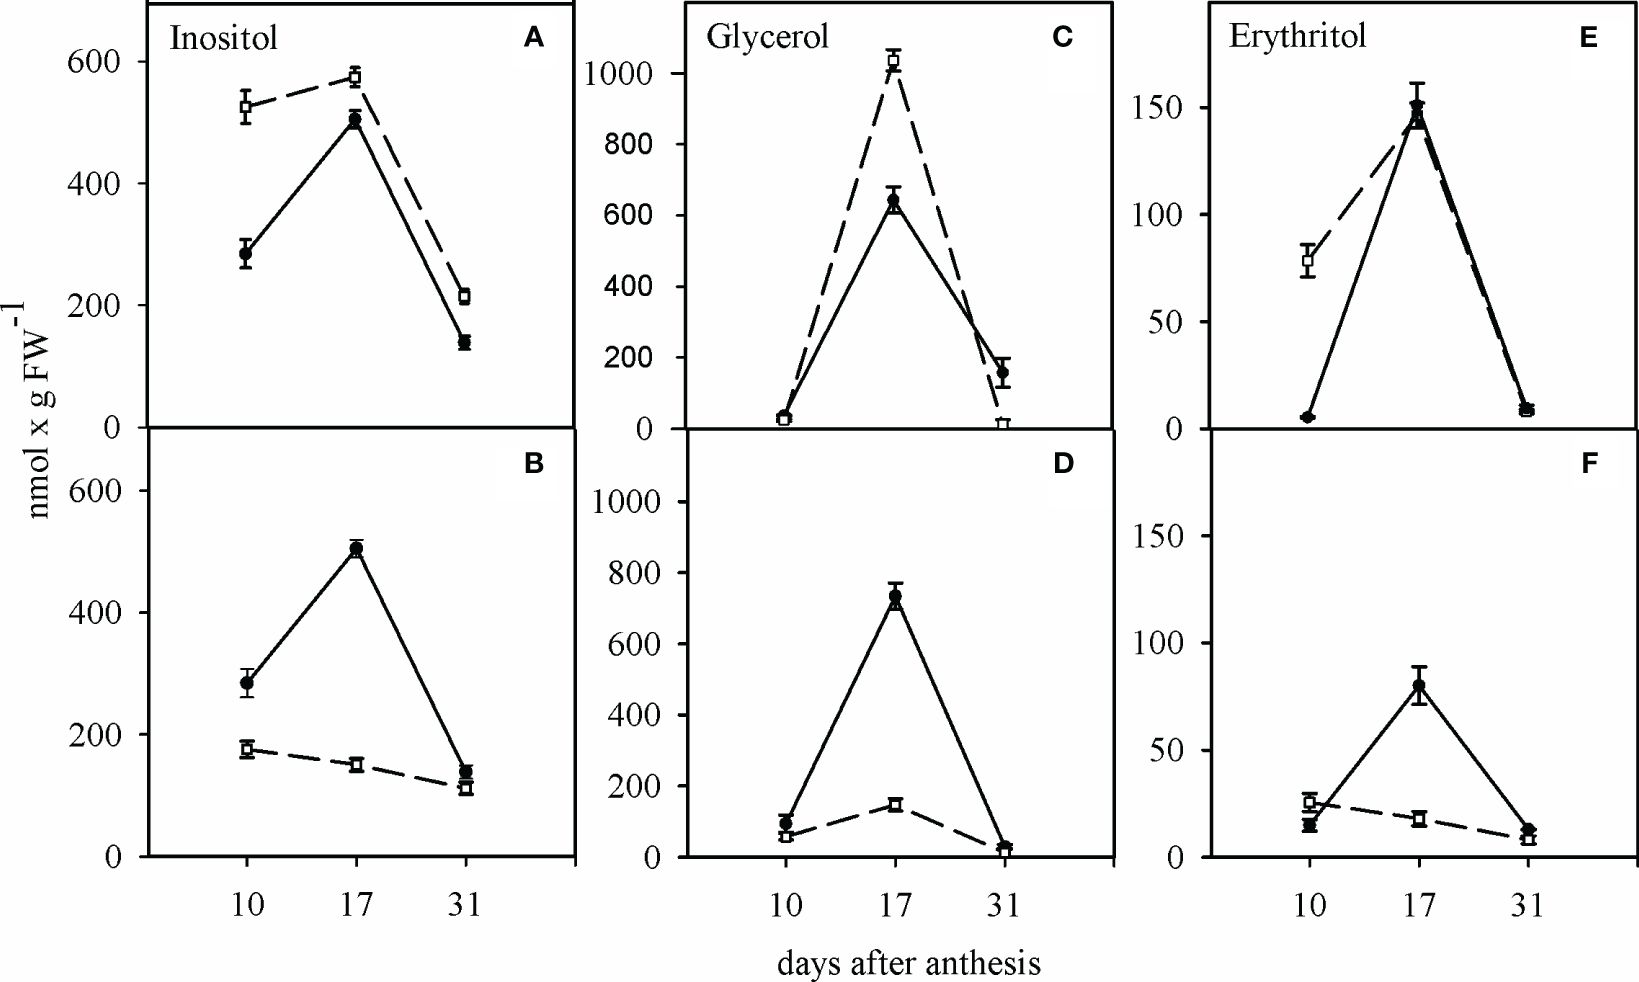
Figure 4 Influence of water deficit on the concentration of inositol (A, B), glycerol (C, D) and erythritol (E, F) in sensitive (dashed line) and tolerant (solid line) cultivars. (A, C, E) show the well-watered condition and (B, D, F) the condition of water deficit after anthesis. Values presented are mean ± standard error (n=4).
3.6 Nucleotides in the grain
The changes in the concentration of ATP, ADP, and ADPGlc in the two cultivars were almost identical in the WD condition. Together with grain filling, the highest concentration of these compounds in the WW condition was observed 31 days after anthesis in the TC (Figures 5A, C, E). WD caused a significant increase in the ATP and ADP contents in the SC and TC grains respectively, and a considerable decrease in the ATP content in the TC grains at 17 and 31 days after anthesis (Figures 5B, D). WD caused a significant reduction in ADPGlc content 31 days after anthesis, especially in the TC (Figure 5F). The highest ratio of ATP/ADP ratio in the grain under WW condition was related to the SC 10 days after anthesis. At 17 and 31 days after anthesis, this ratio was significantly higher in the grain of the TC than the SC. Under WD condition, the ATP/ADP ratio in the SC showed the most significant decrease 10 days after anthesis, falling from 6 to 0.7. The ATP/ADP ratio was less affected by the WD condition in the TC grains than in the SC grains (Figures 5G, H).
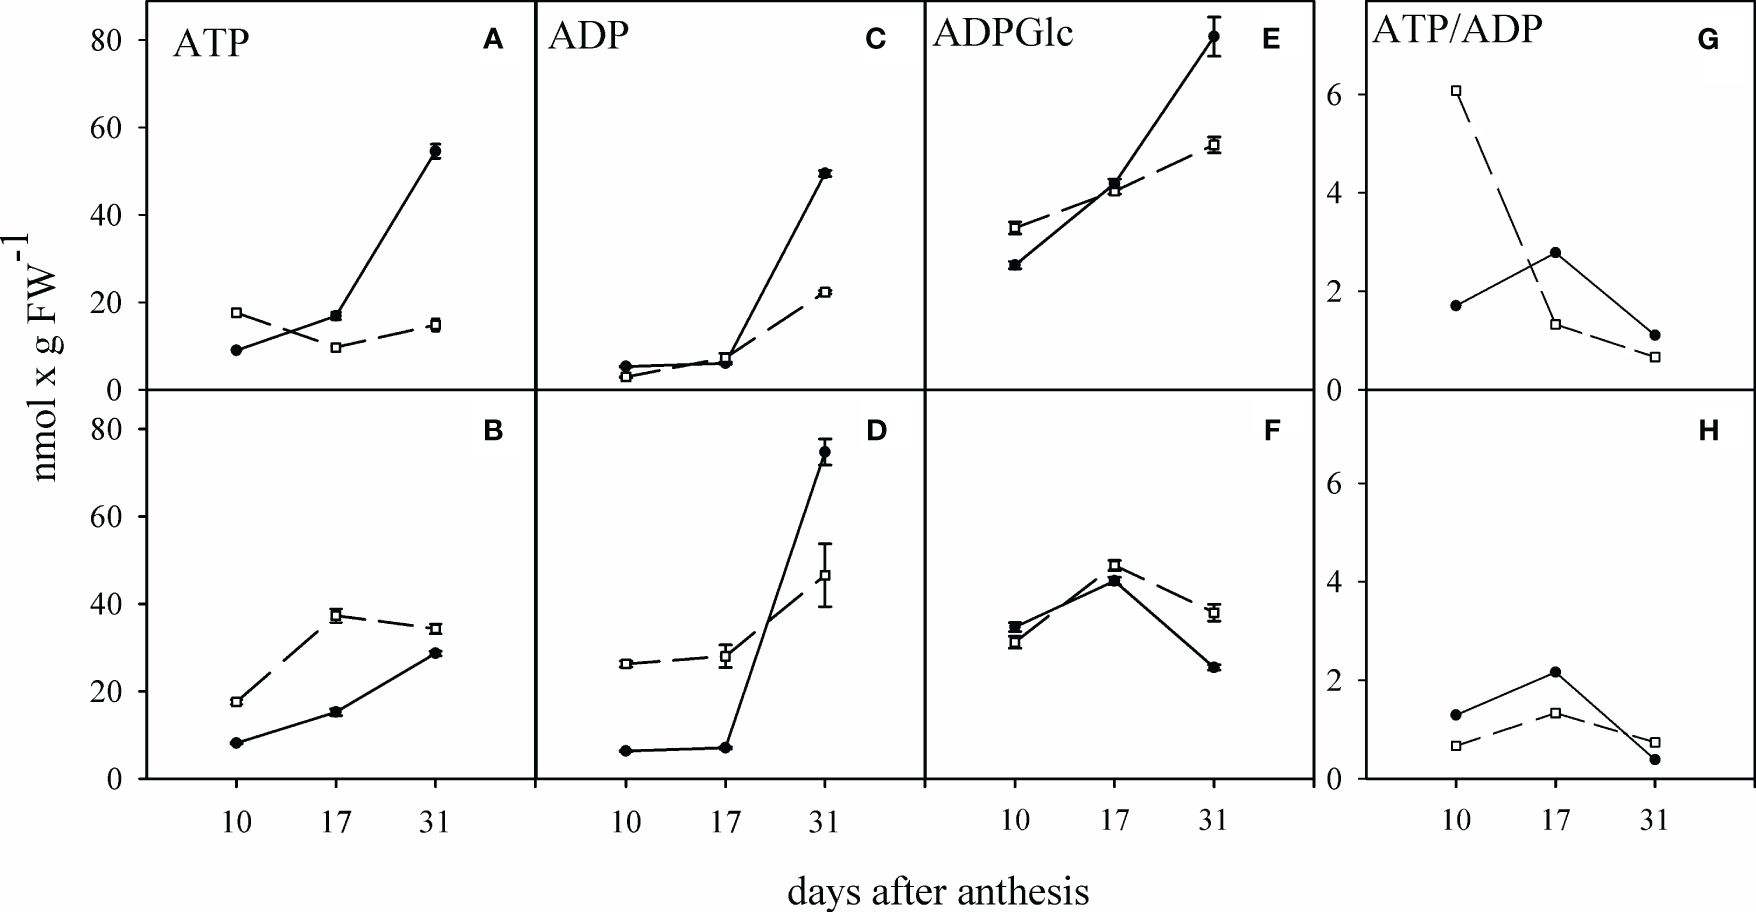
Figure 5 Alteration of adenosine nucleotides in the grains of sensitive and tolerant bread wheat cultivars under water deficit at anthesis stage. Dashed and solid lines show sensitive and tolerant cultivars, respectively. (A, C, E, G) are well-watered, and (B, D, F, H) show the condition of water deficit after anthesis, respectively. Values are presented as mean ± standard error (n=4).
3.7 Metabolites concentration in the grain
As shown in Figure 6A, in the WW condition, the hexose-P concentration decreased continuously during days anthesis in the TC grains, whereas it increased up to 2-fold 31 days after anthesis in the SC grains. A similar pattern was found for hexose-P concentration in both cultivars under WD condition. There was a continuous decrease from the initial value of about 600 to about 130 nmol per g FW in the SC grains. At the same time, this remained unchanged in the TC grains (Figure 6D). The concentration of UDPGlc constantly increased in the TC after anthesis. In contrast, it increased in the SC grains at 17 days after anthesis and decreased to the initial value at 31 days after anthesis in the WW condition (Figure 6B). In the WD condition, the concentration of UDPGlc increased about 5-fold at 31 days after anthesis in the SC grains (Figure 6E). The concentration of 3PGA showed a similar pattern in both cultivars under WW and WD conditions. While the 3PGA concentration increased up to 3-fold in the WW condition, it decreased to about half of the initial value 31 days after anthesis in the WD condition (Figures 6C, F).
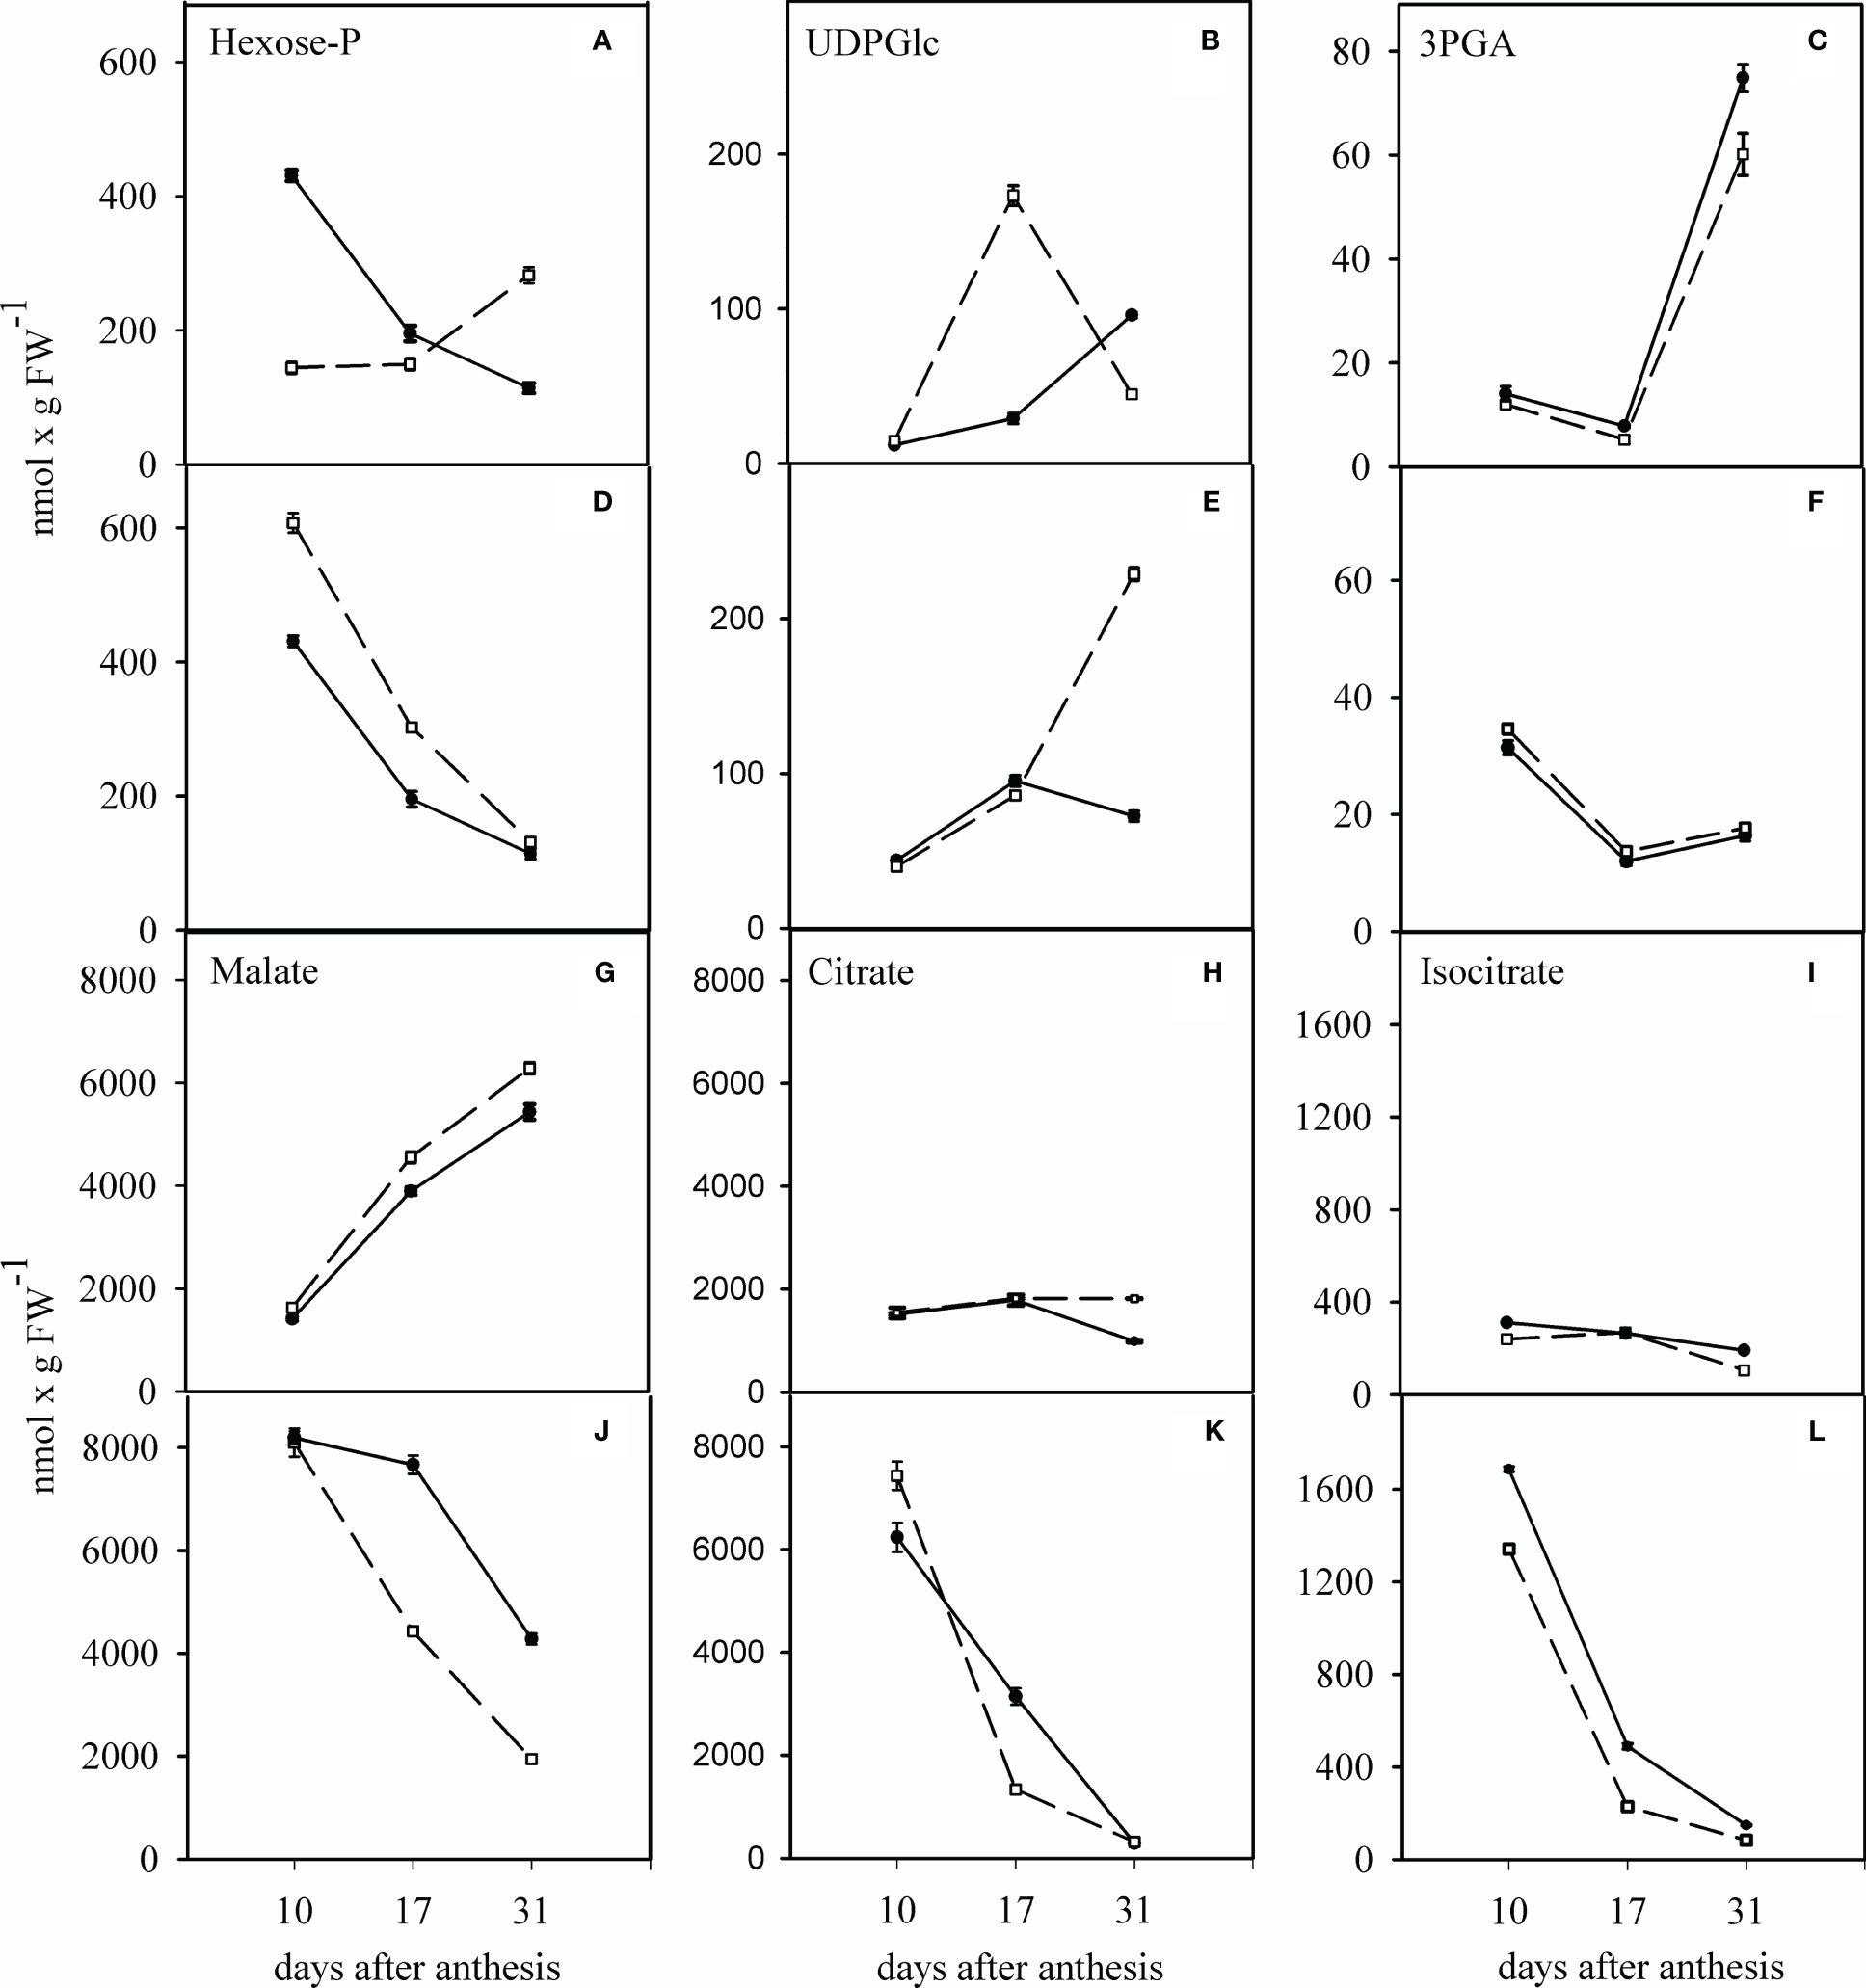
Figure 6 Effect of water deficit on the change in hexose-P (A, D), UDPGlc (B, E), 3PGA (C, F), malate (G, J), citrate (H, K) and isocitrate (I, L) in grains of sensitive and tolerant bread wheat cultivars after anthesis under water deficit. Dashed and solid lines indicate sensitive and tolerant cultivars, respectively. (A–C, G–I) show the well-watered condition and (D–F, J–L) show the condition of after anthesis water deficit. Values are expressed as mean ± standard error (n=4).
The determination of TCA cycle intermediates required for respiration showed that malate concentration increased in both cultivars under the WW condition (Figure 6G). In contrast, it decreased continuously under the WD condition (Figure 6J). The citrate concentration remained unchanged in the WW condition (Figure 6H). It decreased steadily in the WD condition in the grains of both cultivars (Figure 6K). A similar behavior was observed for the isocitrate concentration, which was five times lower than the citrate concentration in both the WW and WD conditions (Figures 6I, L). Interestingly, all organic acids were always up to 5 times higher 10 days after anthesis in the WD condition (Figures 6J, K, L).
3.8 Amino acids in the grain
In the growing grains, in two cultivars and water regimes (WW and WD), among the different amino acids, asparagine, glutamine, alanine, GABA, glutamic acid, and serine had the highest percentages, while ACC and methionine had the lowest percentages (Figures 7A, B).
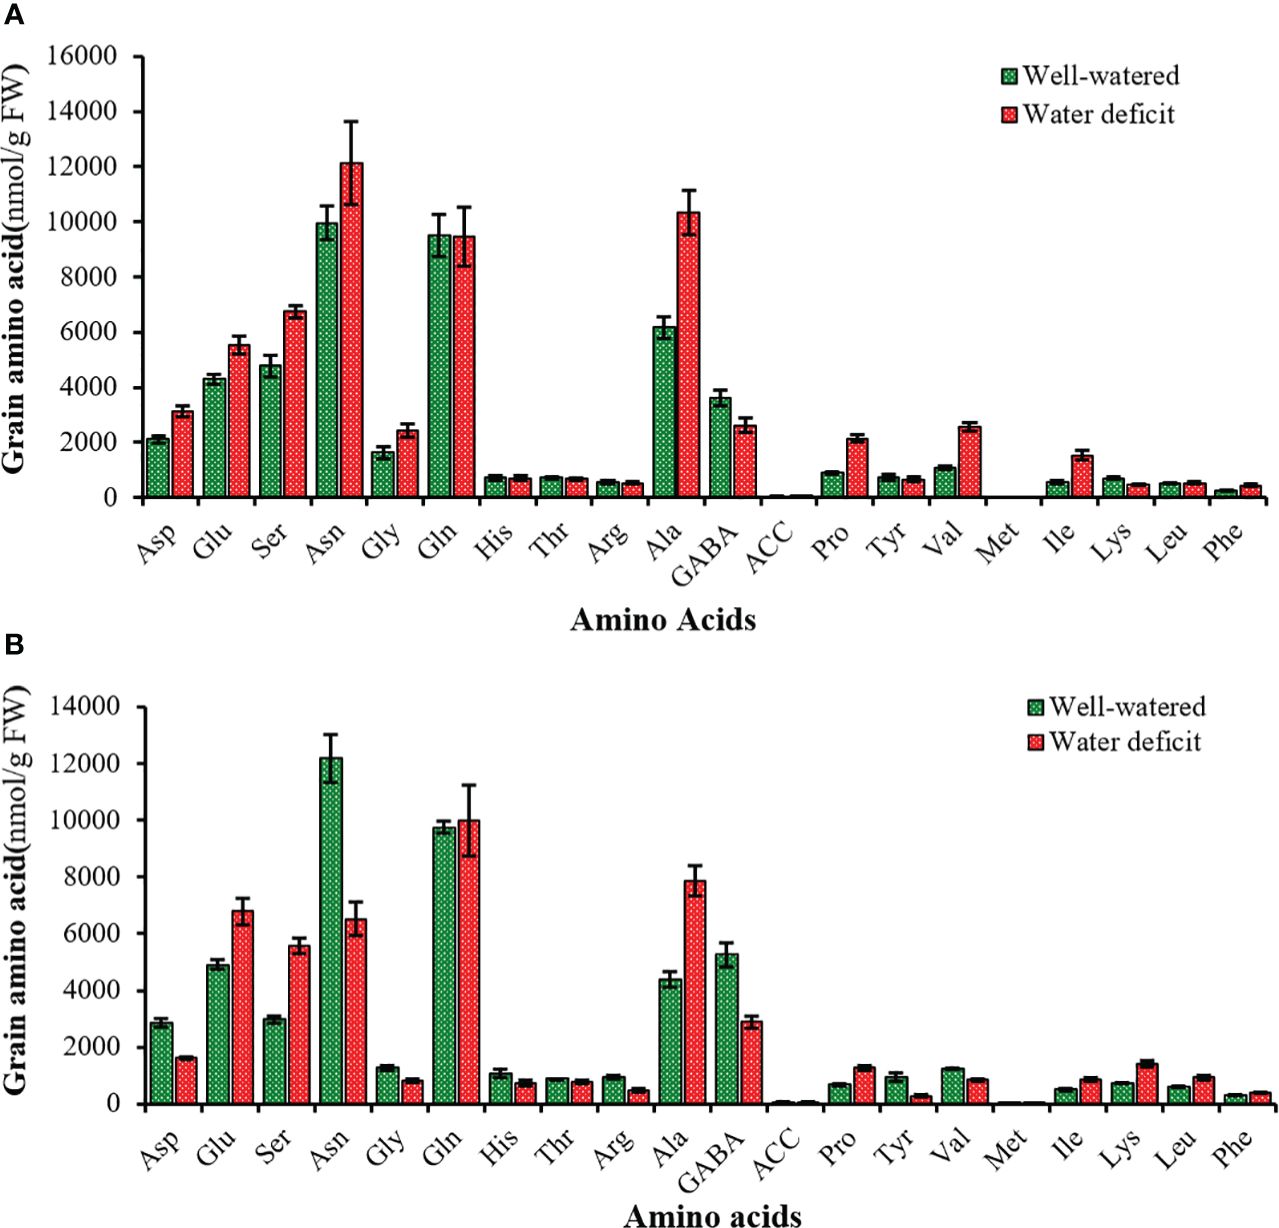
Figure 7 Mean comparison of different amino acids in the grain of tolerant (A) and sensitive (B) bread wheat cultivars under water deficit after anthesis, and well-watered conditions. Asp, Aspartic acid; Glu, Glutamic acid; Ser, Serine; Asn, Asparagine; Gly, Glycine; Glu, Glutamine; His, Histidine; Thr, Threonine; Arg, Arginine; Ala, Alanine; GABA, γ–Aminobutyric acid; ACC, 1-Aminocyclopropane 1-carboxylic acid; Pro, Proline; Tyr, Tyrosine; Val; Valine; Met, Methionine; Ile, Isoleucine; Lys, Lysine; Leu, Leucine; Phe, Phenylalanine. Values are presented as mean ± standard error (n=4).
During WD, glutamic acid, serine, alanine, proline, methionine, leucine, phenylalanine, and isoleucine accumulated significantly, whereas the concentration of γ-amino butyric acid, histidine, threonine, arginine and tyrosine concentration decreased significantly in the SC and TC grains. The concentration of asparagine (22%), aspartic acid (48%), glycine (48%), 1-aminocyclopropane 1-carboxylic acid (79%) and valine (133%) increased strongly under WD in the TC grains in contrast to the SC grain. The concentration of lysine (92%) increased significantly in the SC grains in contrast to those of the TC grains (Figure 7). In addition, the concentration of methionine, isoleucine, proline, valine increased by 2.7, 2.7, 2.4 and 2.3 times, respectively, while the concentration of lysine decreased 3.3 times in the TC and SC grains (Figure 7). WD significantly increased the sum of amino acid concentrations determined in the TC grains but had no significant effect on the sum of amino acid concentrations in the SC grains (Figure 8).
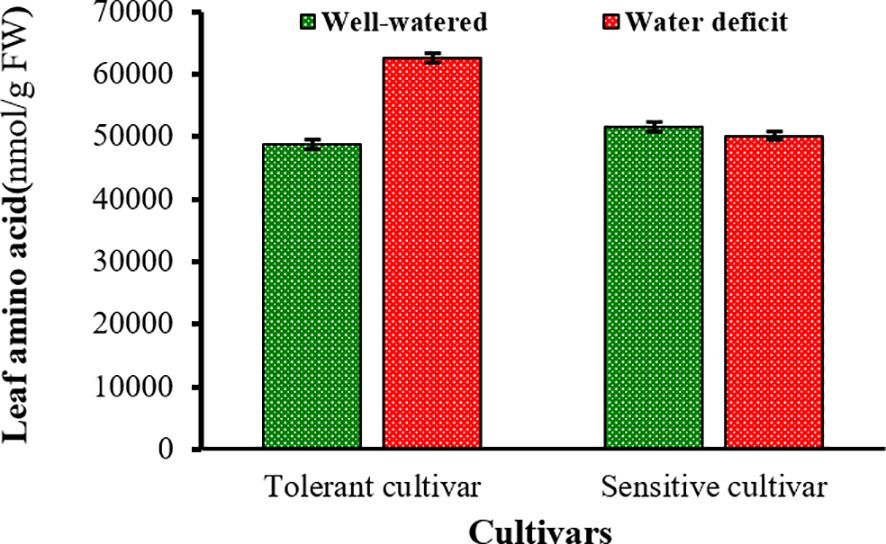
Figure 8 Mean comparison of total amino acids in the grains of tolerant and sensitive bread wheat cultivars after anthesis under water deficit and well-watered conditions. Green bars indicate well-watered condition and red bars indicate after anthesis water deficit condition. Values are presented as mean ± standard error (n=4).
The total amino acid concentration decreased significantly from 10 to 31 days after anthesis in both cultivars. At 31 days after anthesis, glutamic acid, alanine, aspartate, and glycine at 17 days after anthesis had the highest concentration. The most significant decrease in the amino acid concentration under these conditions was related to methionine, tyrosine, and histidine in both cultivars at 31 days after anthesis compared to 10 days after anthesis (Figure 9).
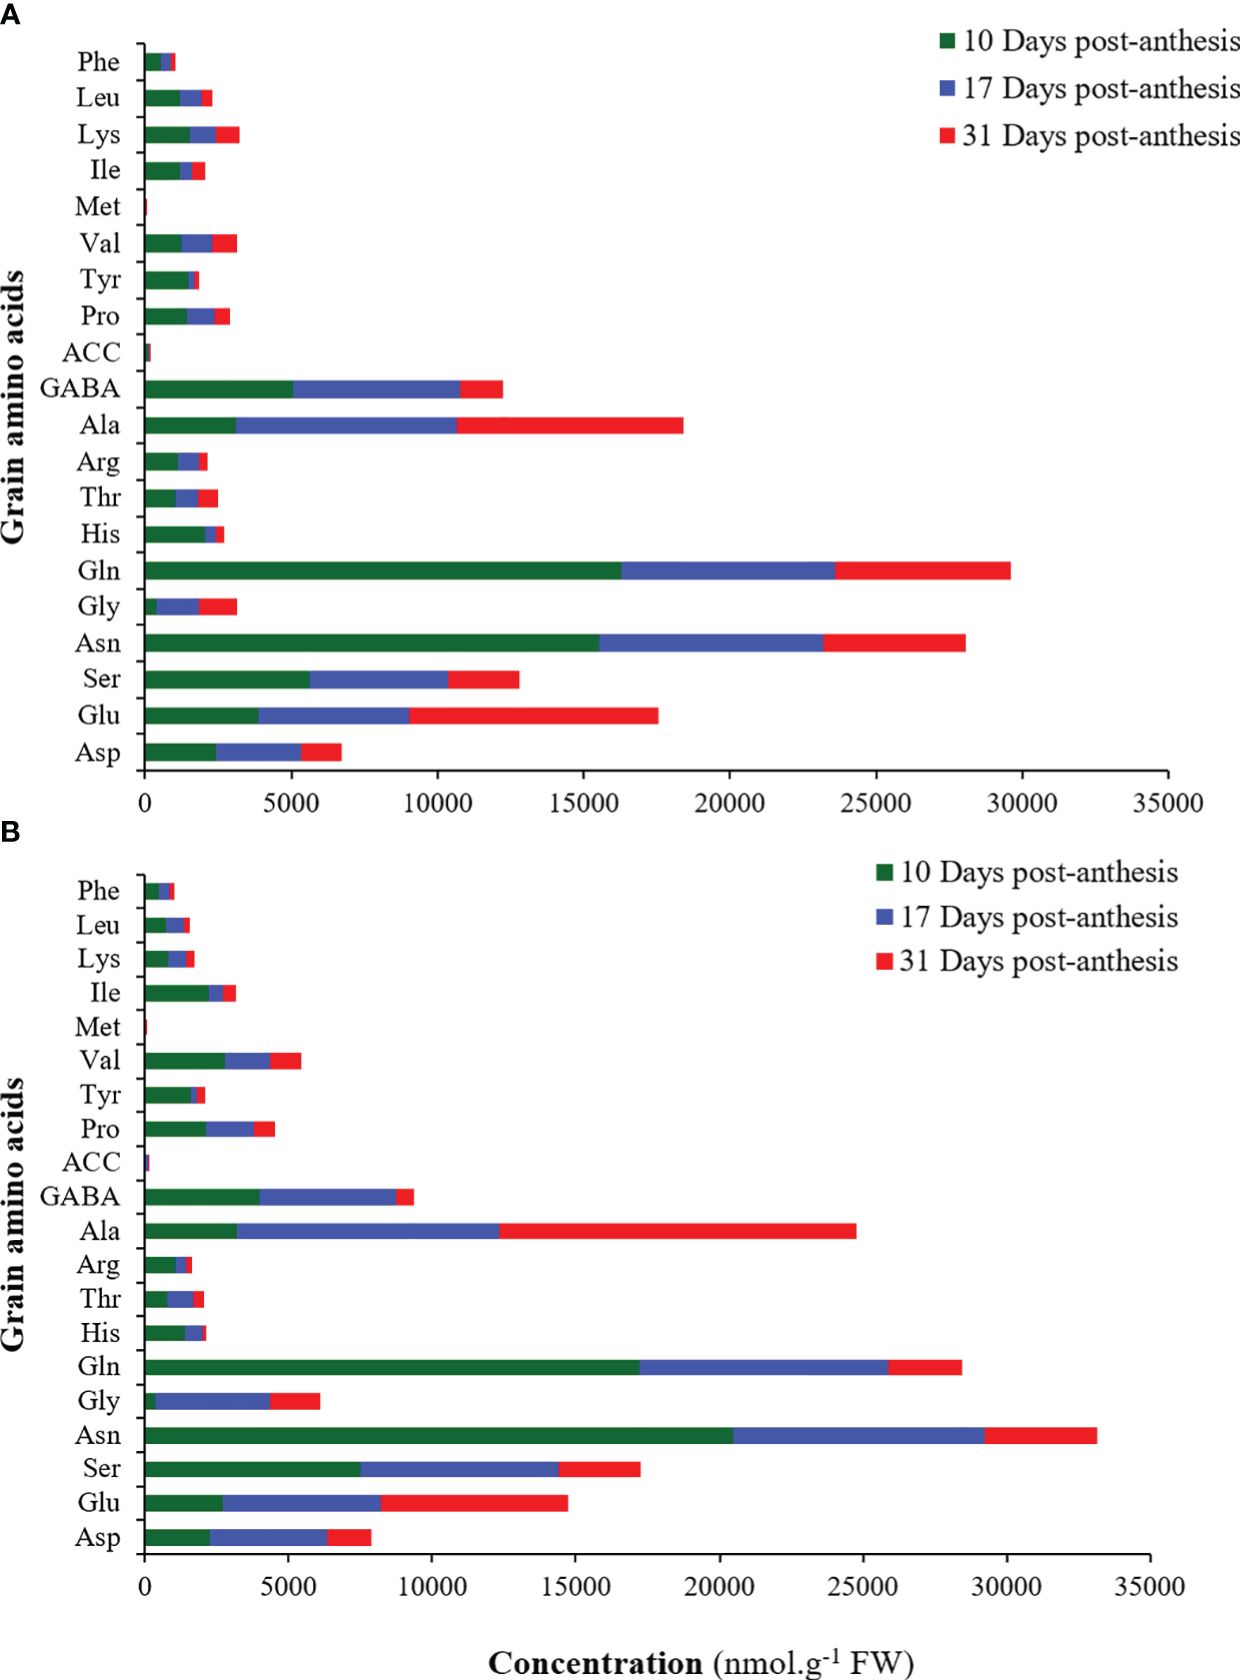
Figure 9 Mean comparison of different amino acids in the grains of sensitive (A) and tolerant (B) bread wheat cultivars under water deficit at 10, 17, and 31 days after anthesis. Asp, Aspartic acid; Glu, Glutamic acid; Ser, Serine; Asn, Asparagine; Gly, Glycine; Glu, Glutamine; His, Histidine; Thr, Threonine; Arg, Arginine; Ala, Alanine; GABA, γ–Aminobutyric acid; ACC, 1-Aminocyclopropane 1-carboxylic acid; Pro, Proline; Tyr, Tyrosine; Val; Valine; Met, Methionine; Ile, Isoleucine; Lys, Lysine; Leu, Leucine; Phe, Phenylalanine. Values are present as mean ± standard error (n=4).
4 Discussion
Drought stress is one of the important agricultural factors limiting the final yield of crops worldwide. Wheat is the most important cereal crop in the world and contains minerals, proteins and vitamins that are essential for human nutrition. However, wheat is severely affected by drought, resulting in huge yield losses in agriculture, as also shown by Zampieri et al. (2017). Therefore, this study aimed to elucidate the biochemical mechanisms occurring during drought in two contrasting wheat cultivars, a sensitive (SC) and a tolerant (TC) cultivar.
Our findings show that higher grain yield (GY) of the sensitive cultivar (SC) in the WW treatment resulted from higher 1000 grain weight (GW) and number of grains per spick (NG). Under WD condition, a significant reduction in GY of the SC was accompanied by a significant decrease in GW and NG. However, in the TC, no significant reduction in the GY, GW, and NG was observed in the WD treatment compared to the WW treatment. These results demonstrated that GW and NG in the WW treatment and GW in the WD treatment might be the most critical factors determining the GY of these cultivars. The higher variation in GY in the WD condition, especially in SC, was predominantly the result of variation in GW. The extreme changes in GW and NG in the SC and the severe decrease in its yield (in contrast to TC) indicated the importance of the stability of these traits under extreme WD. However, according to the previous research results, maintaining the NG in the after anthesis WD is more important than trying to increase grain weight (Adotey et al., 2021). The occurrence of WD at the time of anthesis and shortly after it leads to a decrease in fruit setting and consequently to a reduction in NG. Therefore, according to the application of WD from the time of anthesis in this research, the reduction of the NG reduction can be justified. On the other hand, after anthesis WD treatment usually causes senescence, reduction of photosynthetic rate and period, and, as a result, reduction of photoassimilates, shortening of the grain filling period, and finally, reduction of GW and GY (Kadam et al., 2014; Zhang et al., 2018; Adotey et al., 2021).
In this study, IAA was found to be highest at 10 days after anthesis, while it decreased significantly during the linear phase of grain filling. IAA might be critical in regulating cell division and enlargement during grain growth (Yang et al., 2001, Yang et al., 2003; Yu et al., 2020). A significant decrease in IAA concentration at the linear grain filling stage indicates that this plant hormone may not have played a significant role in regulating starch accumulation in the linear grain filling stage. Therefore, the regulatory role of IAA during this period is ambiguous and needs to be further investigated. The increase of ABA concentration at the beginning of grain filling in this study showed that this plant hormone may be responsible for the cessation of dividing and enlargement of endosperm cells and trigger starch accumulation (Yang et al., 2006; Wang et al., 2019). Depending on its dose, ABA plays a crucial role in grain filling by regulating the enzyme activity in the filling grains (sink) (Wang et al., 2015). Therefore, manipulating the switch from cell division and enlargement phase to the grain filling phase by changing the ABA to IAA ratio might be a feasible strategy to enhance the GY.
The highest levels of glucose and fructose and the activity of three isoforms of invertase were observed 10 days after anthesis (at the beginning of grain growth or cell division and growth). The results of this research showed that the process of changes in the activity of invertase isoforms and the concentration of auxin are similar (Figures 2, 3). Considering this evidence of the role of IAA in stimulating cell division in growing grains in cooperation with cytokinin hormone, auxin hormone may play a role in regulating the activity of invertase isoforms such as CK (Wang et al., 2016). In addition, a positive and significant correlation was found between bound invertase activity and glucose content (Figures 2, 3). At the beginning of grain growth, high energy is required for cell division. Based on our results, different isoforms of invertase may play an essential role in the regulation of cell division in the grains (sink tissue) and thus, in the formation of sink size. Weschke et al. (2003); Chen et al. (2023), and Roitsch and Ehneb (2000) have also shown that different isoforms of invertase are critical regulators of apoplastic phloem unloading due to their enzymological properties. Among the different isoforms of invertase, the apoplastic isoform had the highest activity and the cytosolic isoform the lowest. Therefore, among the three invertase isoforms (cell wall bound, cytosolic, vacuolic), this enzyme plays the most crucial role in the stimulation of grain cell division and the formation of sink size. These results agree with the data presented by Sonnewald et al. (1997), Liu et al. (2022) and Ruan (2022).
A significant increase in sucrose synthase activity at 17 and 31 days compared to 10 days after anthesis in these cultivars suggests a critical role for this enzyme in the regulation of starch biosynthesis. Like invertase, sucrose synthase is more involved in the breakdown of sucrose into glucose and fructose in growing grains, with the difference that the hexose sugars produced by sucrose synthase are used for starch synthesis (Chen et al., 2023). The increase the enzyme sucrose synthase and the sharp decrease in the activity of different isoforms of invertase from the 10 to the 17 days after anthesis had a similar trend. The ABA hormone may decrease the activity of invertase isoforms and increase the activity of the sucrose synthase enzyme. The role of sucrose synthase in starch biosynthesis has also been reported by Berahim et al. (2019); Chen et al. (2019), and Weschke et al. (2003). A significant increase in sucrose synthase activity, as shown in this paper (at the beginning of grain filling), was accompanied by an increase in UDPGlc (Figure 6) and ADPGlc (Figure 5) concentrations in the endosperm of grains. These results showed that this enzyme may be essential for the regulation of starch synthesis during grain growth (Weschke et al., 2003; Berahim et al., 2019; Chen et al., 2019).
We found an increase in inositol concentration under WD at 10, 17, and 31 days, as well as for glycerol and erythritol at 17 days after anthesis in the grains of TC in contrast to SC (Figure 4). The increase in these sugar alcohols was accompanied by WD application in the TC grains and the maintenance of GY. Because of water-like hydroxyl groups of sugar alcohols, they may mimic the structure of water and maintain an artificial hydration sphere around macromolecules under water deficit. As such, they may protect large molecules during dehydration and rehydration and act as stabilizers against rapid osmotic changes and oxidative stress (El-Sayed et al., 2014; Ivanov et al., 2019). Thus, among different sugar alcohols, inositol might be the prominent sugar alcohol involved in resistance to WD in these two cultivars.
In the WW treatment, constant increase of ADPGlc at 17 and 31 days after anthesis in the grains of two cultivars (Figure 5) could be due to a higher activity of ADPGlc pyrophosphorylase during the grain filling stage (Pozueta-Romero et al., 1991 and Okita, 1992). The ATP/ADP ratio decreased significantly under WD. A decrease in ATP/ADP ratio under WD in different crops has been reported by Cornic (2000) and Corbineau et al. (2004). Destruction of the ATP synthase complex is the main reason for the decreased ATP/ADP ratio (Kadam et al., 2017; Bhandari et al., 2023). ATP/ADP can affect the activity of ATP synthase in the endosperm to a greater extent when compared with the effect on the leaf enzyme. Thus, reducing the ATP/ADP ratio in endosperm could severely decrease GY (Figure 4).
The main forms of amino acids translocated from the xylem to the grain are asparagine and glutamine (Yao et al., 2020). In addition to amino acid metabolism in the grain, the main reason for high concentrations of asparagine and glutamine concentrations might be the translocation of those amino acids from leaf tissue. Changes in free amino acids at different sampling times in grains indicate that these substances are responsible for specific functions in the primary and secondary metabolism of plants, as well as acting in protein synthesis. Some amino acids are used as a nitrogen sources, whereas others are used as precursors of secondary products (Jiao et al., 2018). In grains, the maximum concentration of free amino acids was observed at 10 days after anthesis, while it decreased at 17 and 31 days after anthesis (Figure 9). This result agrees with the data of by Barneix (2007), who concluded that the main part of the protein in grains is synthesized from anthesis until 10 days after anthesis, at which point the delivered amino acids are incorporated into protein synthesis. Based on our results, the maximum protein synthesis in grains may occur during the early phase of grain growth. Furthermore, the accumulation of free amino acids in tissues of plant species is considered as a general response to WD (Batista-Silva et al., 2019). Total amino acid concentration tends to increase in tissues stressed by due to increased proteolysis (Oddy et al., 2020), increased de novo synthesis of amino acids and reduced incorporation of them into protein (Castañeda and González, 2021). WD significantly increased the concentration of amino acids in the grains of TC, as opposed to those of SC. The reduction of amino acid concentration in the grains of SC could be due to a decline in amino acid biosynthesis or enhanced consumption of amino acids. As shown in Figure 7, the WD resulted in an increase of asparagine, aspartate, 1-aminocyclopropane 1-carboxylic acid (ACC), glycine, and valine in the grains of the TC and a decrease of the same amino acids in the grains of the SC. Asparagine and aspartate are produced via oxaloacetate from the Crebs cycle and are converted in the chloroplasts to other amino acids such as lysine, methionine, threonine, and isoleucine (Taiz et al., 2015). The decline of asparagine and aspartate concentrations in the SC grains may be related to the increase in leucine, lysine, and isoleucine. Under WD condition, we observed a reduction of glycine and valine concentrations in the grains of SC. As these amino acids are generally derived from the conversion of soluble sugars such as glucose and fructose, which declined continuously during grain development under WD to the intermediates 3PGA and pyruvate, we believe that the reduction of these sugars is the main cause of the reduced concentration of the desired amino acids in the SC grains. The plant’s capacity to significantly increase the concentration of amino acids such as proline, glutamine, and glutamate can effectively regulate osmotic regulation and drought resistance (Gámez et al., 2019). Under WD condition, the most significant changes in amino acids concentrations were observed for valine and lysine. Under this condition, the concentration of valine and lysine in the grains of TC and SC increased and decreased by 2.3 and 1.9 times, respectively. The branched-chain amino acid valine is one of the precursors for the biosynthesis of alkaloids, glucosinolates, and auxin and is involved in resistance to abiotic stresses such as drought stress (Ziegler and Facchini, 2008; Ingrisano et al., 2023). Lysine (an essential amino acid) plays a role in message transduction under environmental stress conditions. This amino acid plays a decisive role in gamete production, fertilization, and grain growth (Shehzad et al., 2022).
The increase in respiratory intermediates such as malate, isocitrate, and citrate and the decrease in ATP/ADP ratio under WD at 10 days after anthesis in the grains of two cultivars can be considered as further evidence that downstream processing, rather than the phosphorylation capacity of the grains limits the use of different metabolites and their accumulation (Hajirezaei et al., 2000). The decrease in 3-PGA concentration under WD could be due to AGPase inhibition or increased consumption of 3-PGA via enhanced respiration rate. In both cases, the drop in the 3-PGA concentration is accompanied by an inhibition of starch synthesis. In our study, this phenomenon was observed in the SC grains, which showed a decrease in 3PGA and a concomitant reduction in starch 31 days after anthesis. However, in the TC grains, the reduction of 3PGA concentration did not affect starch content, probably due to a compensation of internal inorganic phosphate concentration, which is an inhibitor of AGPase (Comino et al., 2017; Liang et al., 2022). High concentrations of citrate, isocitrate, and malate at the early stage of grain growth (10 days after anthesis) under WD suggest that WD significantly increased respiration rate at the early grain filling phase.
The role of sugars during different stages of grain development has been demonstrated in the expression of genes encoding sucrose metabolizing enzymes and hexose and sucrose transporters (Ren et al., 2020; Liu et al., 2021). However, sugars must act in concert with other factors and phytohormones. HXK, a hexose sensor, can determine the flux of hexoses entering glycolysis, while sucrose transporters act as disaccharide sensors and may sense the apoplastic sugar concentration and the flux of sugars crossing the plasma membrane (Ćosić et al., 2021). During the development of starch-accumulating storage sinks such as grains, there are marked changes in the mechanisms by which incoming sucrose is cleaved to support biosynthesis and growth. As shown in this paper, during the early phase of sink development, when the rates of cell division rates and metabolic activity (such as respiration) were high, the invertase pathway was the dominant pathway by which sucrose was metabolized. During the later phases of sink development, when storage product synthesis predominates, the activity of the invertase pathway declines and is substituted by the sucrose synthase pathway. Remarkably, the emergence of the sucrose synthase pathway is highly correlated with the onset of starch biosynthesis (Önder et al., 2022; Taiz et al., 2015). One of the striking differences between the invertase and sucrose synthase in sucrose breakdown is the mobilization via invertase, which is followed by the ATP-dependent phosphorylation of hexoses. In contrast, UDPGlc, the product of the sucrose synthase reaction, is metabolized to glucose-1-P via the inorganic pyrophosphate (PPi)-dependent enzyme UDPGlc pyrophosphorylase (UGPase) (Stitt, 1998; Mehdi et al., 2023).
5 Conclusion
Interestingly, there was a correlation between the high activity of sucrose synthase and the high concentration of ABA, especially at 17 days after anthesis. We also found a correlation between the activities of different isoforms of invertase and IAA concentration at different stages of grain growth. These data demonstrate that these two phytohormones may play a regulatory role in the activity of sucrose synthase and different isoforms of invertase, respectively, and thus influence sucrose metabolism at different developmental stages of grain growth to regulate cell division (formation of sink size) and starch biosynthesis rate (sink strength).
In the present work, we have demonstrated that there may be an interaction between specific plant hormones, enzymes, and intermediates of primary metabolism during wheat grain anthesis. Furthermore, we have also shown that specific metabolites, such as organic acids, are essential for maintaining metabolic activity during WD. Thus, specific metabolic pathways would be a convenient target for genetic manipulation to improve plant performance in the face of environmental adversity. However, this needs to be demonstrated in future studies.
Data availability statement
The raw data supporting the conclusions of this article will be made available by the authors, without undue reservation.
Author contributions
MS: Conceptualization, Data curation, Formal analysis, Visualization, Writing – original draft, Writing – review & editing. AA: Methodology, Validation, Visualization, Writing – review & editing. FM: Methodology, Validation, Visualization, Writing – review & editing. M-RH: Data curation, Formal analysis, Methodology, Visualization, Writing – review & editing.
Funding
The author(s) declare that no financial support was received for the research, authorship, and/or publication of this article.
Acknowledgments
The authors are grateful to the University of Tehran, Agricultural Biotechnology Research Institute of Iran (ABRII) and Leibniz Institute of Plant Genetics and Crop Plant Research (IPK) for providing the traits measurement facilities.
Conflict of interest
The authors declare that the research was conducted in the absence of any commercial or financial relationships that could be construed as a potential conflict of interest.
Publisher’s note
All claims expressed in this article are solely those of the authors and do not necessarily represent those of their affiliated organizations, or those of the publisher, the editors and the reviewers. Any product that may be evaluated in this article, or claim that may be made by its manufacturer, is not guaranteed or endorsed by the publisher.
References
Abdelrahman M., Hirata S., Sawada Y., Hirai M. Y., Sato S., Hirakawa H., et al. (2019). Widely targeted metabolome and transcriptome landscapes of Allium fistulosum–A. cepa chromosome addition lines revealed a flavonoid hot spot-on chromosome 5A. Sci. Rep. 9, 3541. doi: 10.1038/s41598-019-39856-1
Abid M., Ali S., Qi L. K., Zahoor R., Tian Z., Jiang D., et al. (2018). Physiological and biochemical changes during drought and recovery periods at tillering and jointing stages in wheat (Triticum aestivum L.). Sci. Rep. 8, 4615. doi: 10.1038/s41598-018-21441-7
Adotey R. E., Patrignani A., Bergkamp B., Kluitenberg G., Prasad P. V., Jagadish S. K. (2021). Water-deficit stress alters intra-panicle grain number in sorghum. Crop Scie. 61, 2680–2695. doi: 10.1002/csc2.20532
Ahkami A. H., Lischewski S., Haensch K. T., Porfirova S., Hofmann J., Rolletschek H., et al. (2009). Molecular physiology of adventitious root formation in Petunia hybrida L. cuttings: involvement of wound response and primary metabolism. New Phytol. 181, 613–625. doi: 10.1111/j.1469-8137.2008.02704.x
Ahmadizadeh M. (2013). Physiological and agro-morphological response to drought stress. Middle East J. Sci. Res. 13, 998–1009. doi: 10.5829/idosi.mejsr.2013.13.8.3531
Barneix A. J. (2007). Physiology and biochemistry of source-regulated protein accumulation in the wheat grain. J. Plant Physiol. 164, 581–590. doi: 10.1016/j.jplph.2006.03.009
Batista-Silva W., Heinemann B., Rugen N., Nunes-Nesi A., Araújo W. L., Braun H. P., et al. (2019). The role of amino acid metabolism during abiotic stress release. Plant Cell Environ. 42, 1630–1644. doi: 10.1111/pce.13518
Berahim Z., Dorairaj D., Saud H. M., Ismail M. R. (2019). Regulation of sucrose synthase and its association with grain filling in spermine-treated rice plant under water deficit. J. Plant Interact. 14, 464–473. doi: 10.1080/17429145.2019.1657189
Bhandari U., Gajurel A., Khadka B., Thapa I., Chand I., Bhatta D., et al. (2023). Morpho-physiological and biochemical response of rice (Oryza sativa L.) to drought stress: A review. Heliyon 9, e13744. doi: 10.1016/j.heliyon.2023.e13744
Castañeda V., González E. M. (2021). Strategies to apply water-deficit stress: similarities and disparities at the whole plant metabolism level in Medicago truncatula. Int. J. Mol. Sci. 22, 2813. doi: 10.3390/ijms22062813
Chen L., Ganguly D. R., Shafik S. H., Danila F., Grof C. P., Sharwood R. E., et al. (2023). The role of SWEET4 proteins in the post-phloem sugar transport pathway of Setaria viridis sink tissues. J. Exp. Bot. 74, 2968–2986. doi: 10.1093/jxb/erad076
Chen L., Tian Y., McClements D. J., Huang M., Zhu B., Wang L., et al. (2019). A simple and green method for preparation of non-crystalline granular starch through controlled gelatinization. Food Chem. 274, 268–273. doi: 10.1016/j.foodchem.2018.09.006
Comino N., Cifuente J. O., Marina A., Orrantia A., Eguskiza A., Guerin M. E. (2017). Mechanistic insights into the allosteric regulation of bacterial ADP-glucose pyrophosphorylases. J. Biol. Chem. 292, 6255–6268. doi: 10.1074/jbc.M116.773408
Corbineau F., Berjak P., Pammenter N., Vinel D., Picard M. A., Come D. (2004). Reversible cellular and metabolic changes induced by dehydration in desiccation tolerant wheat seedling shoots. Physiol. Plant 122, 28–38. doi: 10.1111/j.1399-3054.2004.00351.x
Cornic G. (2000). Drought stress inhibits photosynthesis by decreasing stomatal aperture not by affecting ATP synthesis. Trends Plant Sci. 5, 187–188. doi: 10.1016/S1360-1385(00)01625-3
Ćosić T., Motyka V., Savić J., Raspor M., Marković M., Dobrev P. I., et al. (2021). Sucrose interferes with endogenous cytokinin homeostasis and expression of organogenesis-related genes during de novo shoot organogenesis in kohlrabi. Sci. Rep. 11, 6494. doi: 10.1038/s41598-021-85932-w
Daryanto S., Wang L., Jacinthe P. A. (2016). Drought effects on root and tuber production: a meta-analysis. Agric. Water Manage. 176, 122–131. doi: 10.1016/j.agwat.2016.05.019
Du Y., Zhao Q., Chen L., Yao X., Zhang W., Zhang B., et al. (2020). Effect of drought stress on sugar metabolism in leaves and roots of soybean seedlings. Plant Physiol. Biochem. 146, 1–12. doi: 10.1016/j.plaphy.2019.11.003
El-Sayed A. I., Rafudeen M. S., Golldack D. (2014). Physiological aspects of raffinose family oligosaccharides in plants: protection against abiotic stress. Plant Biol. 16, 1–8. doi: 10.1111/plb.12053
FAOSTAT. (2023). The statistics division of the FAO. Available at: https://www.fao.org/faostat/en/#data (Accessed 12 October 2023).
Fraire-Velázquez S. L., Balderas-Hernández V. E. (2013). “Abiotic stress in plants and metabolic responses,” in Abiotic Stress—Plant Responses and Applications in Agriculture. Eds. Vahdati K., Leslie C. (Intech, Rijeka, Croatia), 25–46. doi: 10.5772/54859
Gámez A. L., Soba D., Zamarreño Á.M., García-Mina J. M., Aranjuelo I., Morales F. (2019). Effect of water stress during grain filling on yield, quality, and physiological traits of Illpa and Rainbow quinoa (Chenopodium quinoa Willd.) cultivars. Plants 8, 173. doi: 10.3390/plants8060173
Ghaffari M. R., Ghabooli M., Khatabi B., Hajirezaei M. R., Schweizer P., Hosseini Salekdehet G. (2016). Metabolic and transcriptional response of central metabolism affected by root endophytic fungus Piriformospora indica under salinity in barley. Plant Mol. Biol. 90, 699–717. doi: 10.1007/s11103-016-0461-z
Guo R., Shi L., Jiao Y., Li M., Zhong X., Gu F., et al. (2018). Metabolic responses to drought stress in the tissues of drought-tolerant and drought-sensitive wheat genotype seedlings. AoB Plants 10, ply016. doi: 10.1093/aobpla/ply016
Guo X., Xin Z., Yang T., Ma X., Zhang Y., Wang Z., et al. (2020). Metabolomics response for drought stress tolerance in Chinese wheat genotypes (Triticum aestivum). Plants 9, 520. doi: 10.3390/plants9040520
Haink G., Deussen A. (2003). Liquid chromatography method for the analysis of adenosine compounds. J. Chromatogr. B. 784, 189–193. doi: 10.1016/S1570-0232(02)00752-3
Hajirezaei M., Sonnewald U., Viola R., Carlisle S., Dennis D., Stitt M. (1994). Transgenic potato plants with strongly decreased expression of pyrophosphate: fructose-6-phosphate phospho-transferase show no visible phenotype and only minor changes in metabolic uses in their tubers. Planta 192, 16–30. doi: 10.1007/BF00198688
Hajirezaei M. R., Takahata Y., Trethewey R. N., Willmitzer L., Sonnewald U. (2000). Impact of elevated cytosolic and apoplastic invertase activity on carbon metabolism during potato tuber development. J. Exp. Bot. 51, 439–445. doi: 10.1093/jexbot/51.suppl_1.439
Ingrisano R., Tosato E., Trost P., Gurrieri L., Sparla F. (2023). Proline, cysteine and branched-chain amino acids in abiotic stress response of land plants and microalgae. Plants 12, 3410. doi: 10.3390/plants12193410
Itam M., Mega R., Tadano S., Abdelrahman M., Matsunaga S., Yamasaki Y., et al. (2020). Metabolic and physiological responses to progressive drought stress in bread wheat. Sci. Rep. 10, 17189. doi: 10.1038/s41598-020-74303-6
Ivanov Y. V., Kartashov A. V., Zlobin I. E., Sarvin B., Stavrianidi A. N., Kuznetsov V. V. (2019). Water deficit-dependent changes in non-structural carbohydrate profiles, growth and mortality of pine and spruce seedlings in hydroculture. Environ. Exp. Bot. 157, 151–160. doi: 10.1016/j.envexpbot.2018.10.016
Jiao Y., Chen Y., Ma C., Qin J., Nguyen T. H. N., Liu D., et al. (2018). Phenylalanine as a nitrogen source induces root growth and nitrogen-use efficiency in Populus canescens. Tree Physiol. 38, 66–82. doi: 10.1093/treephys/tpx109
Kadam N. N., Tamilselvan A., Lawas L. M., Quinones C., Bahuguna R. N., Thomson M. J., et al. (2017). Genetic control of plasticity in root morphology and anatomy of rice in response to water deficit. Plant Physiol. 174, 2302–2315. doi: 10.1104/pp.17.00500
Kadam N. N., Xiao G., Melgar R. J., Bahuguna R. N., Quinones C., Tamilselvan A., et al. (2014). Agronomic and physiological responses to high temperature, drought, and elevated CO2 interactions in cereals. Adv. Agron. 127, 111–156. doi: 10.1016/B978-0-12-800131-8.00003-0
Kelen M., Cubukdem-Iralay E., Sen S., Ozkan G. (2004). Separation of abscisic acid, indole-3-acetic acid, gibberellic acid in 99R (Vitis berlandieri x Vitis rupestris) and rose Oil (Rosa damascena Mill.) by reversed phase liquid chromatography. Turk. J. Chem. 28, 603–610.
Khoshro H. H., Taleei A., Bihamta M. R., Shahbazi M., Abbasi A. (2013). Expression analysis of the genes involved in osmotic adjustment in bread wheat (Triticum aestivum L.) cultivars under terminal drought stress conditions. J. Crop Sci. Biotechnol. 16, 173–181. doi: 10.1007/s12892-013-0040-7
Kumar M., Kumar Patel M., Kumar N., Bajpai A. B., Siddique K. H. (2021). Metabolomics and molecular approaches reveal drought stress tolerance in plants. Int. J. Mol. Sci. 22, 9108. doi: 10.3390/ijms22179108
Kutlu İ., Turhan E., Yorgancilar Ö., Yorgancilar A. (2021). Differences of physiological parameters and sucrose metabolism in bread wheat genotypes exposed to drought stress. J. Anim. Plant Sci. 31, 998–1006. doi: 10.36899/japs.2021.4.0296
Liang G., Li Y., Wang P., Jiao S., Wang H., Mao J., et al. (2022). VaAPL1 promotes starch synthesis to constantly contribute to soluble sugar accumulation, improving low temperature tolerance in Arabidopsis and tomato. Front. Plant Sci. 13. doi: 10.3389/fpls.2022.920424
Liu C., Hu S., Liu S., Shi W., Xie D., Chen Q., et al. (2022). Functional characterization of a cell wall invertase inhibitor StInvInh1 revealed its involvement in potato micro tuber size in vitro. Front. Plant Sci. 13. doi: 10.3389/fpls.2022.1015815
Liu S., Li Z., Wu S., Wan X. (2021). The essential roles of sugar metabolism for pollen development and male fertility in plants. Crop J. 9, 1223–1236. doi: 10.1016/j.cj.2021.08.003
Luo Y., Pang D., Jin M., Chen J., Kong X., Li W., et al. (2019). Identification of plant hormones and candidate hub genes regulating flag leaf senescence in wheat response to water deficit stress at the grain-filling stage. Plant Direct 3, e00152. doi: 10.1002/pld3.152
Lv L., Chen X., Li H., Huang J., Liu Y., Zhao A. (2022). Different adaptive patterns of wheat with different drought tolerance under drought stresses and rehydration revealed by integrated metabolomic and transcriptomic analysis. Front. Plant Sci. 13. doi: 10.3389/fpls.2022.1008624
Malko M. M., Khanzada A., Wang X., Samo A., Li Q., Jiang D., et al. (2022). Chemical treatment refines drought tolerance in wheat and its implications in changing climate: A review. Plant Stress. 6, 100118. doi: 10.1016/j.stress.2022.100118
Marček T., Hamow K. A., Végh B., Janda T., Darko E. (2019). Metabolic response to drought in six winter wheat genotypes. PloS One 14, e0212411. doi: 10.1371/journal.pone.0212411
Mayta M. L., Lodeyro A. F., Guiamet J. J., Tognetti V. B., Melzer M., Hajirezaei M. R., et al. (2018). Expression of a plastid-targeted flavodoxin decreases chloroplast reactive oxygen species accumulation and delays senescence in aging tobacco leaves. Front. Plant Sci. 9. doi: 10.3389/fpls.2018.01039
Mehdi F., Liu X., Riaz Z., Javed U., Aman A., Galani S. (2023). Expression of sucrose metabolizing enzymes in different sugarcane varieties under progressive heat stress. Front. Plant Sci. 14. doi: 10.3389/fpls.2023.1269521
Mitchell P. L., Sheehy J. E. (2018). Potential yield of wheat in the United Kingdom: How to reach 20 t ha-1. Field Crops Res. 224, 115–125. doi: 10.1016/j.fcr.2018.05.008
Najafian G., Jafarnejad A., Ghandi A., Nikooseresht R. (2011). Adaptive traits related to terminal drought tolerance in hexaploid wheat (Triticum aestivum L.) genotypes under field conditions. Crop Breed. J. 1, 55–71.
Nemati F., Ghanati F., Ahmadi Gavlighi H., Sharifi M. (2018). Comparison of sucrose metabolism in wheat seedlings during drought stress and subsequent recovery. Biol. Plant 62, 595–599. doi: 10.1007/s10535-018-0792-5
Obata T., Klemens P. A., Rosado-Souza L., Schlereth A., Gisel A., Stavolone L., et al. (2020). Metabolic profiles of six African cultivars of cassava (Manihot esculenta Crantz) highlight bottlenecks of root yield. Plant J. 102, 1202–1219. doi: 10.1111/tpj.14693
Oddy J., Raffan S., Wilkinson M. D., Elmore J. S., Halford N. G. (2020). Stress, nutrients and genotype: Understanding and managing asparagine accumulation in wheat grain. CABI Agric. Biosci. 1, 1–14. doi: 10.1186/s43170-020-00010-x
Okita T. W. (1992). Is there an alternative pathway for starch synthesis? Plant Physiol. 100, 560–564. doi: 10.1104/pp.100.2.560
Önder S., Erbaş S., Önder D., Tonguç M., Mutlucan M. (2022). “Seed filling,” in In the Seed biology updates. Ed. Jimenez-Lopez J. C. (Budapest Open Access Initiative: IntechOpen). doi: 10.5772/intechopen.98120
Pozueta-Romero J., Ardila F., Akazawa T. (1991). ADP-glucose transport by the chloroplast adenylate translocator is linked to starch biosynthesis. Plant Physiol. 97, 1565–1572. doi: 10.1104/pp.97.4.1565
Ranwala A. P., Miller W. B. (1998). Sucrose-cleaving enzymes and carbohydrate pools in Lilium longiflorum floral organs. Physiol. Plant 103, 541–550. doi: 10.1034/j.1399-3054.1998.1030413.x
Ren R., Yue X., Li J., Xie S., Guo S., Zhang Z. (2020). Coexpression of sucrose synthase and the SWEET transporter, which are associated with sugar hydrolysis and transport, respectively, increases the hexose content in Vitis vinifera L. Grape berries. Front. Plant Sci. 11. doi: 10.3389/fpls.2020.00321
Roitsch T., Ehneb R. (2000). Regulation of source/sink relations by cytokinins. Plant Growth Regul. 32, 359–367. doi: 10.1023/A:1010781500705
Ruan Y. L. (2022). CWIN-sugar transporter nexus is a key component for reproductive success. J. Plant Physiol. 268, 153572. doi: 10.1016/j.jplph.2021.153572
Saeidi M., Moradi F., Jalali-Honarmand S. (2012). The effect of post anthesis source limitation treatments on wheat cultivars under water deficit. Aust. J. Crop Sci. 6, 1179–1187.
Shehzad F., Ali Q., Ali S., Al-Misned F. A., Maqbool S. (2022). Fertigation with Zn-lysine confers better photosynthetic efficiency and yield in water stressed Maize: water relations, antioxidative defense mechanism and nutrient acquisition. Plants 11, 404. doi: 10.3390/plants11030404
Shewry P. R., Hey S. J. (2015). The contribution of wheat to human diet and health. Food Energy Secur. 4, 178–202. doi: 10.1002/fes3.64
Sonnewald U., Hajirezaei M. R., Kossmann J., Heyer A., Trethewey R. N., Willmitzer L. (1997). Increased potato tuber size resulting from apoplastic expression of a yeast invertase. Nat. Biotechnol. 15, 794–797. doi: 10.1038/nbt0897-794
Stallmann J., Schweiger R., Pons C. A. A., Müller C. (2020). Wheat growth, applied water use efficiency and flag leaf metabolome under continuous and pulsed deficit irrigation. Sci. Rep. 10, 10112. doi: 10.1038/s41598-020-66812-1
Steel R. G. D., Torrie J. H., Dickey D. A. (1997). Principles and procedures of statistics. 3rd ed (New York: McGraw-Hill). doi: 10.1002/bimj.19620040313
Stitt M. (1998). Pyrophosphate as an alternative energy donor in the cytosol of plant cells: an enigmatic alternative to ATP. Bot. Acta. 111, 167–175. doi: 10.1111/j.1438-8677.1998.tb00692.x
Taiz L., Zeiger E., Møller I. M., Murphy A. (2015). Plant physiology and development. (No. ed. 6). Sunderland: Sinauer Associates, Massachusetts, U.S.A., Incorporated. p. 761. doi: 10.1093/hesc/9780197614204.001.0001
Ullah N., Yüce M., Neslihan Öztürk Gökçe Z., Budak H. (2017). Comparative metabolite profiling of drought stress in roots and leaves of seven Triticeae species. BMC Genom. 18, 1–12. doi: 10.1186/s12864-017-4321-2
Wang W., Hao Q., Tian F., Li Q., Wang W. (2016). Cytokinin-regulated sucrose metabolism in stay-green wheat phenotype. PloS One 11, e0161351. doi: 10.1371/journal.pone.0161351
Wang G. Q., Li H. X., Feng L., Chen M. X., Meng S., Ye N. H., et al. (2019). Transcriptomic analysis of grain filling in rice inferior grains under moderate soil drying. J. Exp. Bot. 70, 1597–1611. doi: 10.1093/jxb/erz010
Wang Z., Xu Y., Chen T., Zhang H., Yang J., Zhang J. (2015). Abscisic acid and the key enzymes and genes in sucrose-to-starch conversion in rice spikelets in response to soil drying during grain filling. Planta 241, 1091–1107. doi: 10.1007/s00425-015-2245-0
Weschke W., Panitz R., Gubatz S., Wang Q., Radchuk R., Weber H., et al. (2003). The role of invertases and hexose transporters in controlling sugar ratios in maternal and filial tissues of barley caryopses during early development. Plant J. 33, 395–411. doi: 10.1046/j.1365-313X.2003.01633.x
Yang J., Zhang J., Wang Z., Liu K., Wang P. (2006). After anthesis development of inferior and superior spikelets in rice in relation to abscisic acid and ethylene. J. Exp. Bot. 57, 149–160. doi: 10.1093/jxb/erj018
Yang J., Zhang J., Wang Z., Zhu Q. (2003). Hormones in the grains in relation to sink strength and postanthesis development of spikelets in rice. Plant Growth Regul. 41, 185–195. doi: 10.1023/B:GROW.0000007503.95391.38
Yang J., Zhang J., Wang Z., Zhu Q., Wang W. (2001). Hormonal changes in the grains of rice subjected to water stress during grain filling. Plant Physiol. 127, 315–323. doi: 10.1104/pp.127.1.315
Yao X., Nie J., Bai R., Sui X. (2020). Amino acid transporters in plants: Identification and function. Plants 9, 972. doi: 10.3390/plants9080972
Yu N. N., Zhang J. W., Peng L. I. U., Bin Z. H. A. O., Ren B. Z. (2020). Integrated agronomic practices management improved grain formation and regulated endogenous hormone balance in summer maize (Zea mays L.). J. Integr. Agric. 19, 1768–1776. doi: 10.1016/S2095-3119(19)62757-7
Zampieri M., Ceglar A., Dentener F., Toreti A. (2017). Wheat yield loss attributable to heat waves, drought and water excess at the global, national and subnational scales. Environ. Res. Lett. 12, 064008. doi: 10.1088/1748-9326/aa723b
Zhang J., Zhang S., Cheng M., Jiang H., Zhang X., Peng C., et al. (2018). Effect of drought on agronomic traits of rice and wheat: A meta-analysis. Int. J. Environ. Res. Public Health 15, 839. doi: 10.3390/ijerph15050839
Keywords: amino acid, hormone, invertase, nucleotide, sucrose synthase, sugar alcohol
Citation: Saeidi M, Ahmadi A, Moradi F and Hajirezaei M-R (2024) Comparative metabolome profiling of two contrasting wheat cultivars in late-season water deficit. Front. Plant Physiol. 2:1386473. doi: 10.3389/fphgy.2024.1386473
Received: 15 February 2024; Accepted: 11 April 2024;
Published: 26 April 2024.
Edited by:
Jiaxu Li, Mississippi State University, United StatesReviewed by:
Ghulam Hasnain, University of North Georgia, United StatesMurat Aycan, Niigata University, Japan
Copyright © 2024 Saeidi, Ahmadi, Moradi and Hajirezaei. This is an open-access article distributed under the terms of the Creative Commons Attribution License (CC BY). The use, distribution or reproduction in other forums is permitted, provided the original author(s) and the copyright owner(s) are credited and that the original publication in this journal is cited, in accordance with accepted academic practice. No use, distribution or reproduction is permitted which does not comply with these terms.
*Correspondence: Mohsen Saeidi, bXNhZWlkaUByYXppLmFjLmly; Mohammad-Reza Hajirezaei, bW9oYW1tYWRAaXBrLWdhdGVyc2xlYmVuLmRl