 Berit Boshuizen1,2*†
 Maarten Willems1†
 Lorie De Maré1
 Guilherme Hosotani3
 Jean Eduardo De Oliveira3
 Benjamin Horemans3
 Carmen Vidal Moreno De Vega1
 Elisabeth-Lidwien J. M. M. Verdegaal1,4
 Catherine Delesalle1,4
- 1Department of Translational Physiology, Infectiology and Public Health, Research Group of Comparative Physiology, Faculty of Veterinary Medicine, Ghent University, Merelbeke, Belgium
- 2Equine Hospital Wolvega, Oldeholtpade, Netherlands
- 3Cargill Research and Development Centre Europe, Vilvoorde, Belgium
- 4Equine Health and Performance Centre, School of Animal and Veterinary Sciences, Roseworthy Campus, University of Adelaide, Adelaide, SA, Australia
Introduction: Aleurone, a bioactive wheat bran component, has been shown to modulate host metabolism and gut microbiota, but its effects across different compartments of the equine gastrointestinal (GI) tract remain unclear. In this study, we aimed to characterize aleurone-derived metabolite profiles using an in vitro fermentation model with digesta from three equine GI compartments (jejunum, cecum, and colon).
Methods: Three substrates (control feed, aleurone-containing feed, and pure aleurone) were fermented over 72 h, and targeted metabolomics was performed on 38 metabolites.
Results: Significant substrate- and compartment-dependent effects were found for 21 metabolites. Aleurone-containing feed increased asparagine and threonine levels while reducing lactic acid, particularly in the cecum. In contrast, control feed showed the highest overall metabolite abundance, suggesting greater microbial accessibility. Time-resolved analyses revealed dynamic production–utilization patterns; isoleucine, for example, displayed a distinct peak–decay pattern in the colon. Carnitine increased over time across compartments, showing local production, especially in the cecum. Artificial intelligence-based classification models achieved >90% accuracy in distinguishing substrate types and revealed ferulic acid and indole acetic acid as key differentiators.
Discussion: The findings suggest that aleurone’s structural matrix may influence metabolite release and microbial access, highlighting its functional role in modulating fermentation and overall host metabolism. In this study, we demonstrate that aleurone alters microbial fermentation and metabolite output in a time- and compartment-specific manner. These insights enhance our understanding of aleurone as a functional feed component in horses and provide a foundation for future dietary strategies targeting metabolic and gut health.
Introduction
There is increasing scientific evidence that aleurone, a component derived from wheat bran, acts as a prebiotic, providing a substrate for the microbial community both in humans and several different animal species. Aleurone is the outermost living cell layer(s) of a cereal grain’s endosperm. These cells are rich in proteins and lipids, and during germination, they respond to gibberellins from the embryo by synthesizing and secreting hydrolytic enzymes (e.g., α-amylase and proteases) that mobilize the starch and proteins in the starchy endosperm. In milling, aleurone usually remains with the bran fraction. The aleurone layer can be found in the following grain types: wheat, rye, barley, oats, rice, maize (corn), sorghum, millets, and triticale (Bohm and Buri, 2004; Brouns et al., 2010; 2012; Fardet, 2010; Pekkinen et al., 2014; Quemeneur et al., 2020; Deng et al., 2021; Boshuizen et al., 2021; Boshuizen et al., 2025). Aleurone is considered a key contributor to the health benefits associated with whole grain consumption in humans. However, many consumers are discouraged by the coarse texture of whole grain products. To address this, the food industry is increasingly recognizing aleurone’s potential to enhance the fiber and nutrient content of foods without significantly altering their texture, and the milling industry has developed advanced separation techniques to isolate the aleurone layer from the bran fraction, yielding concentrates of differing purity—such as ASP1 and purer ASP2 (Roye et al., 2020; Lebert et al., 2022).
Moreover, the feed industry shows increasing interest in aleurone. It has been demonstrated that aleurone triggers multiple physiological effects across animal species, including, most recently, in pigs and horses (Quemeneur et al., 2020; Deng et al., 2021; Boshuizen et al., 2021; 2025). In pigs, aleurone supplementation has been shown to positively influence the feeding behavior, nitrogen metabolism, and energy partitioning. In particular, aleurone reduces the number of meals per day and decreases nitrogen retention, suggesting altered protein metabolism and nutrient utilization strategies (Le Gall et al., 2009; Quemeneur et al., 2020). Furthermore, in gestating sows, dietary inclusion of wheat aleurone improved postprandial satiety (via increased peptide YY and glucagon like peptide-1) and stress parameters (reduced salivary cortisol), and significantly lowered the stillbirth rate, indicating both metabolic and reproductive benefits (Quemeneur et al., 2020; Deng et al., 2021).
Both untrained and trained horses have been studied. In untrained horses, it was shown that daily feeding ≥200 g of aleurone (ASP1) significantly changed the glucose and insulin responses to a standardized meal; for example, the time to peak for both blood glucose and insulin increased, whereas the area under the curve (AUC) and maximum levels of glucose remained the same, and AUCinsulin and maximum insulin levels decreased. These study results suggest an increase in insulin sensitivity as a result of aleurone supplementation in untrained horses. In addition, aleurone-supplemented horses showed significant changes in the relative abundance in higher taxonomic levels of their fecal microbiome and decreased relative abundance of the following genera: Roseburia, Shuttleworthia, Anaerostipes, Faecalibacter, and Succinovibrionaceae. The most pronounced changes in relative abundance at the phylum level were observed in Firmicutes and Verrucomicrobia (downregulation), as well as in Bacteroidetes and Spirochaetes (upregulation) (Boshuizen et al., 2021; Boshuizen et al., 2025). This shift is often interpreted as beneficial, especially in the context of metabolic health, insulin sensitivity, or reduction in obesity-associated profiles. A high Firmicutes/Bacteroidetes ratio is often associated with metabolic dysregulation, so a shift toward more Bacteroidetes may imply improved gut efficiency or anti-inflammatory potential (Fitzgerald et al., 2020; Górniak et al., 2021).
Shifts in the composition of the gut microbiome can lead to changes in the metabolic fingerprint of the microbiome (Holmes et al., 2012; Proudman et al., 2015; Lloyd-Price et al., 2019; Zimmermann et al., 2019; Wilmanski et al., 2021; Boshuizen et al., 2021; 2025). Some of these metabolites have already been identified as having beneficial health effects. For example, it has been established that as a part of the dietary fiber fraction, aleurone is partly digested by the gut microbiota, which leads to the production of short-chain fatty acids (SCFAs) (i.e., acetate, butyrate, and propionate) (Glinsky et al., 1976; Cheng et al., 1987; Hughes et al., 2007). These SCFAs could modulate health benefits both locally at the level of the gastrointestinal (GI) tract (Bedford and Gong, 2018) and systemically, for example, through the amelioration of insulin sensitivity (Gao et al., 2009; Al-Lahham et al., 2010; Freeland et al., 2010). Other by-products in the fermentation of fibers using the gut microbiota include lactate, α-oxovalerate, aromatic amino acids (AAAs), and branched-chain amino acids (BCAAs). In conclusion, the results of the equine study supplementing aleurone to non-trained horses showed that aleurone blunts the postprandial glucose and insulin response and induces significant shifts in the fecal microbiome (Boshuizen et al., 2021; Boshuizen et al., 2025).
In trained Standardbred mares, aleurone further enhanced the insulin-sensitizing effects of exercise, as demonstrated by improved glucose effectiveness and lowered acute insulin response to glucose (AIRg) during intravenous glucose tolerance tests. Microbiome analysis revealed that training alone decreased Pseudomonas, a genus associated with dysbiosis, whereas aleurone supplementation reduced the relative abundance of inflammation-associated Desulfovibrio (Boshuizen et al., 2025). These findings further support a role for aleurone in modulating the metabolic–microbiome axis, referring to the dynamic and bidirectional relationship between the host’s metabolism and the composition and activity of its intestinal microbiota.
It is to be expected that aleurone’s prebiotic and metabolic regulatory roles are governed by species-specific digestive physiology. In particular, the extensive hindgut fermentation capacity found in horses may influence aleurone’s site of degradation/fermentation and absorption. Both in vivo and in vitro studies across different animal species have demonstrated that the bioavailability of the key components of the aleurone fraction, among which are ferulic acid and betaine, depends on how efficiently the organism releases them from the arabinoxylan-containing fiber matrix (Andreasen et al., 2001; Amrein et al., 2003; Zhao et al., 2003; Hughes et al., 2007; Neyrinck et al., 2008; Anson et al., 2009; Rosa et al., 2014; Keaveney et al., 2015; Bresciani et al., 2016; Boshuizen et al., 2021; Boshuizen et al., 2025). According to previous in vitro studies, there is evidence that bioaccessibility of the different aleurone components can be enhanced by the application of ultrafine grinding techniques and by the solubilization of cell-wall polysaccharides via enzymatic processing (Anson et al., 2009; Hemery et al., 2010; Calani et al., 2014; Pekkinen et al., 2014; Rosa et al., 2014; Aslam et al., 2018; Lebert et al., 2022). In vivo, it is expected that fermentation by gut microbiota during the gastrointestinal passage has an important impact on bioavailability of aleurone components. For this reason, an equine animal model was chosen for performing both in vivo and in vitro studies, with an extensive fermentation capacity in its hindgut (Mackie and Wilkins, 1988; Schoster et al., 2013). At this point, only a few in vivo studies have been performed, either in mice or in pigs (Neyrinck et al., 2008; Le Gall et al., 2009; Theil et al., 2011; Nørskov et al., 2013; Calani et al., 2014; Pekkinen et al., 2014; Rosa et al., 2014; Ingerslev et al., 2017; Quemeneur et al., 2019; Quemeneur et al., 2020; Deng et al., 2021; Sun et al., 2023), and, more recently, in horses (Boshuizen et al., 2021; Boshuizen et al., 2025).
It has been suggested that aleurone mediates its effects through a combined effect of factors, such as 1) the effect of aleurone and its components on feed texture and subsequent digestive processing, 2) the effect of aleurone and its components on metabolism, and 3) microbiome composition and metabolic output (Boshuizen et al., 2021).
Region-specific in vitro fermentation assays using inocula from different parts of the equine GI tract can pinpoint where aleurone is degraded and which metabolites are produced, thereby clarifying how it may affect host metabolism. These assays simulate intestinal conditions and quantify both the physical breakdown of the substrate and the chemical outputs. By comparing jejunal, cecal, and colonic inocula, they reveal when and where key nutrients are released and infer downstream cellular and systemic effects from the fermentative end-products. In vitro platforms also allow tight control of pH, temperature, redox state, and enzyme activity conditions difficult to standardize in vivo without invasive models, thereby providing mechanistic insight into aleurone–digestive interactions. As such, they serve as a complementary tool to generate hypotheses for subsequent validation in living animals (Mcclements et al., 2009; Bosch et al., 2017; Jeong et al., 2019; Leng et al., 2020).
We aimed to characterize and compare the in vitro fermentation/metabolic profiles of control feed, aleurone-containing feed, and purified aleurone (ASP1) using equine jejunum, cecum, and colon inocula in an ex vivo dynamic model. Our primary hypothesis (H1) was that aleurone-containing substrates yield distinct fermentation/metabolomic signatures relative to control feed, with effects most pronounced under hindgut (cecal/colonic) inocula compared with jejunal inoculum. In addition, the following secondary hypotheses were addressed in this study: (H2) the magnitude of aleurone effects follows purified aleurone ≥ aleurone feed > control; and (H3) a binary, supervised AI model can (i) classify aleurone vs. non-aleurone fermentation profiles above chance across compartments and (ii) identify candidate aleurone-specific biomarkers for future studies. For this purpose, a 3 × 3 factorial (substrate × compartment) ex vivo fermentation protocol was performed; metabolomic and physicochemical readouts enable direct substrate-by-compartment contrasts to test H1–H2. The same dataset feeds the AI classifier to test H3 and nominate features for follow-up work in vivo and in dietary applications.
Materials and methods
Experimental design: the fermentation was evaluated over a period of 72 h, with a total of 27 fermentation bottles and one blank bottle. The experimental design included three substrates (control feed without aleurone, aleurone-containing feed, and pure aleurone) and three inocula (jejunal, cecal, and colonic digesta) collected from horses in the slaughterhouse, leading to a total of nine different treatment combinations, with three replicates each. Table 1 provides an overview of the study design. Supplementary Table S1 provides an overview of the macronutrient composition of both the control feed and aleurone-containing feed. Both diets were formulated to provide comparable energy and digestible protein levels (not identical; EWpa 0.701 vs. 0.708; DCP 85.6 vs. 83.4 g/kg), with the control diet slightly higher in starch and sugars (342 vs. 316 g/kg) (Supplementary Table S1). Inoculum collection and transportation: In brief, the insulated containers were pre-warmed by filling them with warm distilled water and remained closed until inoculum collection to maintain optimal temperature. During collection, efforts were made to minimize exposure of the intestinal content to temperature changes and oxygen. Immediately before sample collection, the containers were opened, and the warm water was discarded. Immediately after stunning and evisceration, horse digesta was collected from the end of the jejunum, cecum, and colon ascendens from each horse. Each container was filled with 500–1,000 mL of digesta (depending on the target compartment: jejunum versus, for example, cecum or colon), ensuring that it was filled to more than 90% of its volume to minimize oxygen exposure and pressure changes. “Stripping” of the intestinal segments was avoided. The inoculum was transported in a temperature-controlled transport incubator (37.5 °C) to the laboratory within 1 hour.
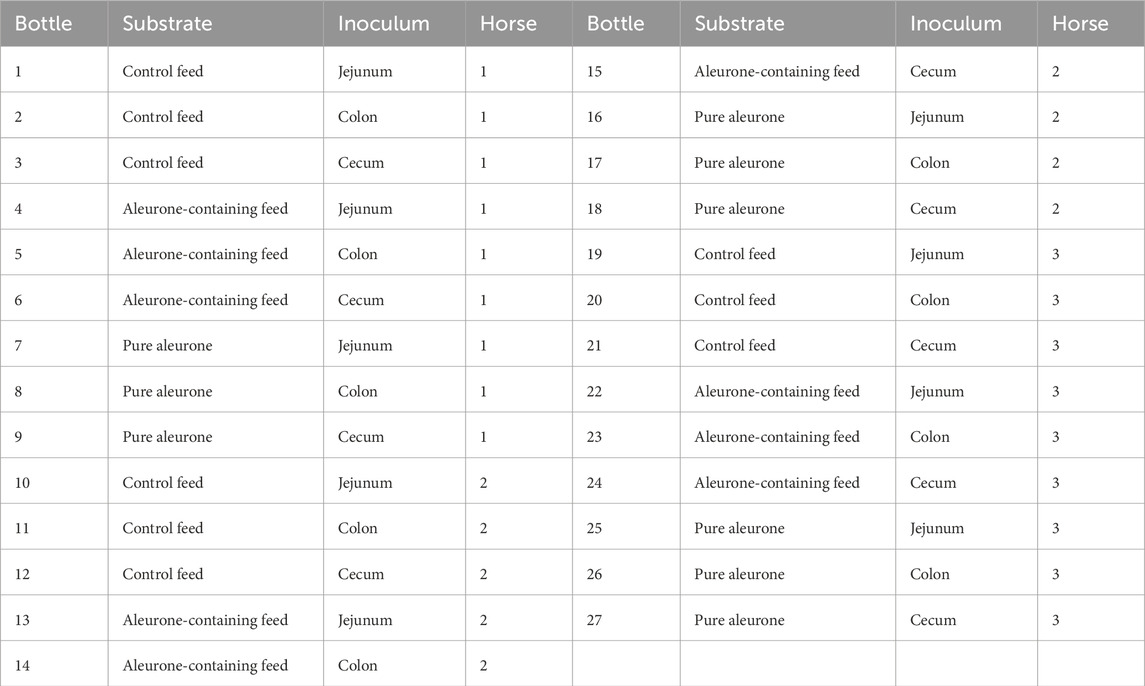
Table 1. Overview of the study design, detailing the specific combinations of substrates and GI compartments sampled for incubation.
Fermentation setup: at the laboratory, the collected inocula were promptly utilized for the in vitro fermentation experiments. Each treatment was incubated under anaerobic conditions at 37 °C, with samples collected from the fermentation setup at the initiation of the experiment (T0) and at subsequent time points (T3, T6, T24, T48, and T72). Additionally, a separate bottle, containing neither substrate, was included as a blank control.
The applied in vitro fermentation protocol was adapted from the study by Goering and Van Soest (1970). Throughout the procedure, all equipment and consumables involved in the handling or storage of samples were pre-warmed and maintained at 38 °C to preserve physiological conditions, with the exception of nitrogen (N2) used to flush the bottles to maintain anaerobic conditions. Substrates (control feed, aleurone-containing feed, and pure aleurone) were weighed, and 500 mg of each sample was added into 50 mL Ankom bottles. Subsequently, 35 mL of in vitro buffer solution (2 g NH4HCO3, 17.5 g NaHCO3, 2.86 g Na2HPO4, 3.1 g KH2PO4, 0.3 g MgSO4, and 0.25 mL 0.1% (w/v) resazurin brought to a final volume of 2 L with water) was added to each bottle. The ankom bottles were placed in an incubator shaker (Infors HT, model Ecotron, Bottmingen, Switzerland) and kept sealed with bottle caps.
The freshly collected inocula from the three GI sections (jejunum, cecum, and colon) were prepared by filtration through a single layer of cheesecloth and subsequently mixed with an in vitro buffer solution at a 1:2.5 ratio (inoculum:buffer). A volume of 15 mL of the prepared inoculum was precisely added to each designated bottle using a pipette.
Fermentation of the substrates was assessed at the initiation of the experiment (T0) and at subsequent intervals (T3, T6, T24, T48, and T72). At each time point, duplicate 1 mL samples were collected in Eppendorf tubes and stored at −80 °C until further analysis.
Targeted metabolomics: after collection, samples were centrifuged at 10,000 rpm at room temperature for 5 min. Then, 100 µL of each sample was diluted in 900 µL of 50:50 MiliQ-H2O/acetonitrile and again centrifuged at 10,000 rpm at room temperature for 5 min. After that, 700 µL of this solution was transferred to a high-performance liquid chromatography (HPLC) vial for analysis. Ultra-high-performance liquid chromatography (UHPLC, Thermo UltiMate 3,000, Thermo Fisher™ Scientific, Belgium) and quadrupole-orbitrap mass spectrometry (MS) (Thermo Q-Exactive Focus, Thermo Fisher Scientific™, Belgium) were performed using a 1.7 µm, 100 Å, 100 × 2.1 mm column (Kinetex PFP, Phenomenex, Belgium), MiliQ water, and 0.1% formic acid in channel A and acetonitrile and 0.1% formic acid in channel B. UHPLC-MS analysis and quantification were performed in positive and negative ion modes. Compound Discoverer (Thermo Fisher™ Scientific, Belgium) and Chromeleon (Thermo Fisher™ Scientific, Belgium) software were used to assess the metabolites in each sample. Each sample was analyzed in triplicate for the presence of a series of 38 metabolites, which were preselected based on the studies performed by Pekkinen et al. (2014), Rosa et al. (2014), and Bresciani et al. (2016). The selected metabolites were as follows: hippuric acid, methyl hippuric acid, leucine, isoleucine, valine, phenylalanine, phenyl lactate, tryptophan, tyrosine, histidine, alanine, glutamate, glutamine, taurine, asparagine, threonine, lysine, aspartate, citrate, malate, succinate, fumarate, betaine, NN-dimethylglycine, carnitine, butyrate, propionate, 3-hydroxy isobutyrate, α-oxovalerate, β-hydroxybutyrate, pyridoxine, urate, 5-hydroxyindoleacetate, N-methyldiphenylamine, trans-ferulic acid, indole acetate, lactate, and choline.
Statistical analysis: statistical analyses were performed using R software (version 4.0.2 (Team, 2020)). The linear mixed model was used to analyze the data using the lmer function from the “lme4” package (Bates et al., 2015). The model was fitted with restricted maximum likelihood (REML). Denominator degrees of freedom were computed using the Satterthwaite method. The model was specified as follows:
Yij = β0 + β1substrate + β2inoculum + β3time + β4substrate x inoculum + β5substrate x time + β6inoculum x time + bi + εij,
where Yij is the AUC for each metabolite, β0 is the overall mean, β1 is the fixed effect of the substrate, β2 is the fixed effect of inoculum (GI section), β3 is the fixed effect of time (incubation timepoint), β4 is the interaction between the substrate and inoculum, β5 is the interaction between the substrate and time, β6 is the interaction between the inoculum and time, bi is the random effect of individual horse, and εij is the residual error.
Tukey’s post hoc tests were performed to test for pairwise differences. All statistical tests were conducted at a significant level of α ≤ 0.05. The results were reported as mean estimates with their associated standard errors and p-values.
The following analyses were performed: time-independent substrate effects, time-independent compartment effects, time-dependent substrate effects per compartment, identification of time-dependent and time-independent substrate-specific metabolic profiles, time-dependent patterns in total significant metabolite abundance under different feed conditions across all three compartments taken together, and time-independent patterns in significant metabolite abundance under different feed conditions across all three compartments taken together.
Application of a binary AI model: in a second step, an AI model was applied to address the following questions: 1. Can an AI model be trained to classify horse samples accurately and assign them to the correct class using metabolomic data? 2. What are the most important metabolites for correctly assigning samples to their respective groups, by feeding following parameters to the AI model: time points: short (T0 to T6) and long time interval (T24 to T72); substrates: control feed, aleurone-containing feed, and pure aleurone; intestinal inoculum: jejunum, cecum, and colon.
The AI-based model hypothesis was developed using HoRIZON software.
The study involved the following parameters: time points: short (T0, T3, and T6) and long interval (T24, T48, and T72); substrates: control feed, aleurone-containing feed, and pure aleurone; intestinal inoculum: jejunum, cecum, and colon.
Data processing and model training were performed as follows: Data binarization: datasets were binarized to facilitate model training and evaluation. Classification of models: various classification models were tested to identify nonlinear relationships between metabolites and sample classification. Model evaluation: models were considered valuable if the P-value of the permutation score was ≤0.05 (indicating significance superior to random) and the AUC was at least 85% (indicating high model accuracy).
Models tested
A total of 39 models were developed to compare different treatments. Table 2 provides an overview of the different AI models.
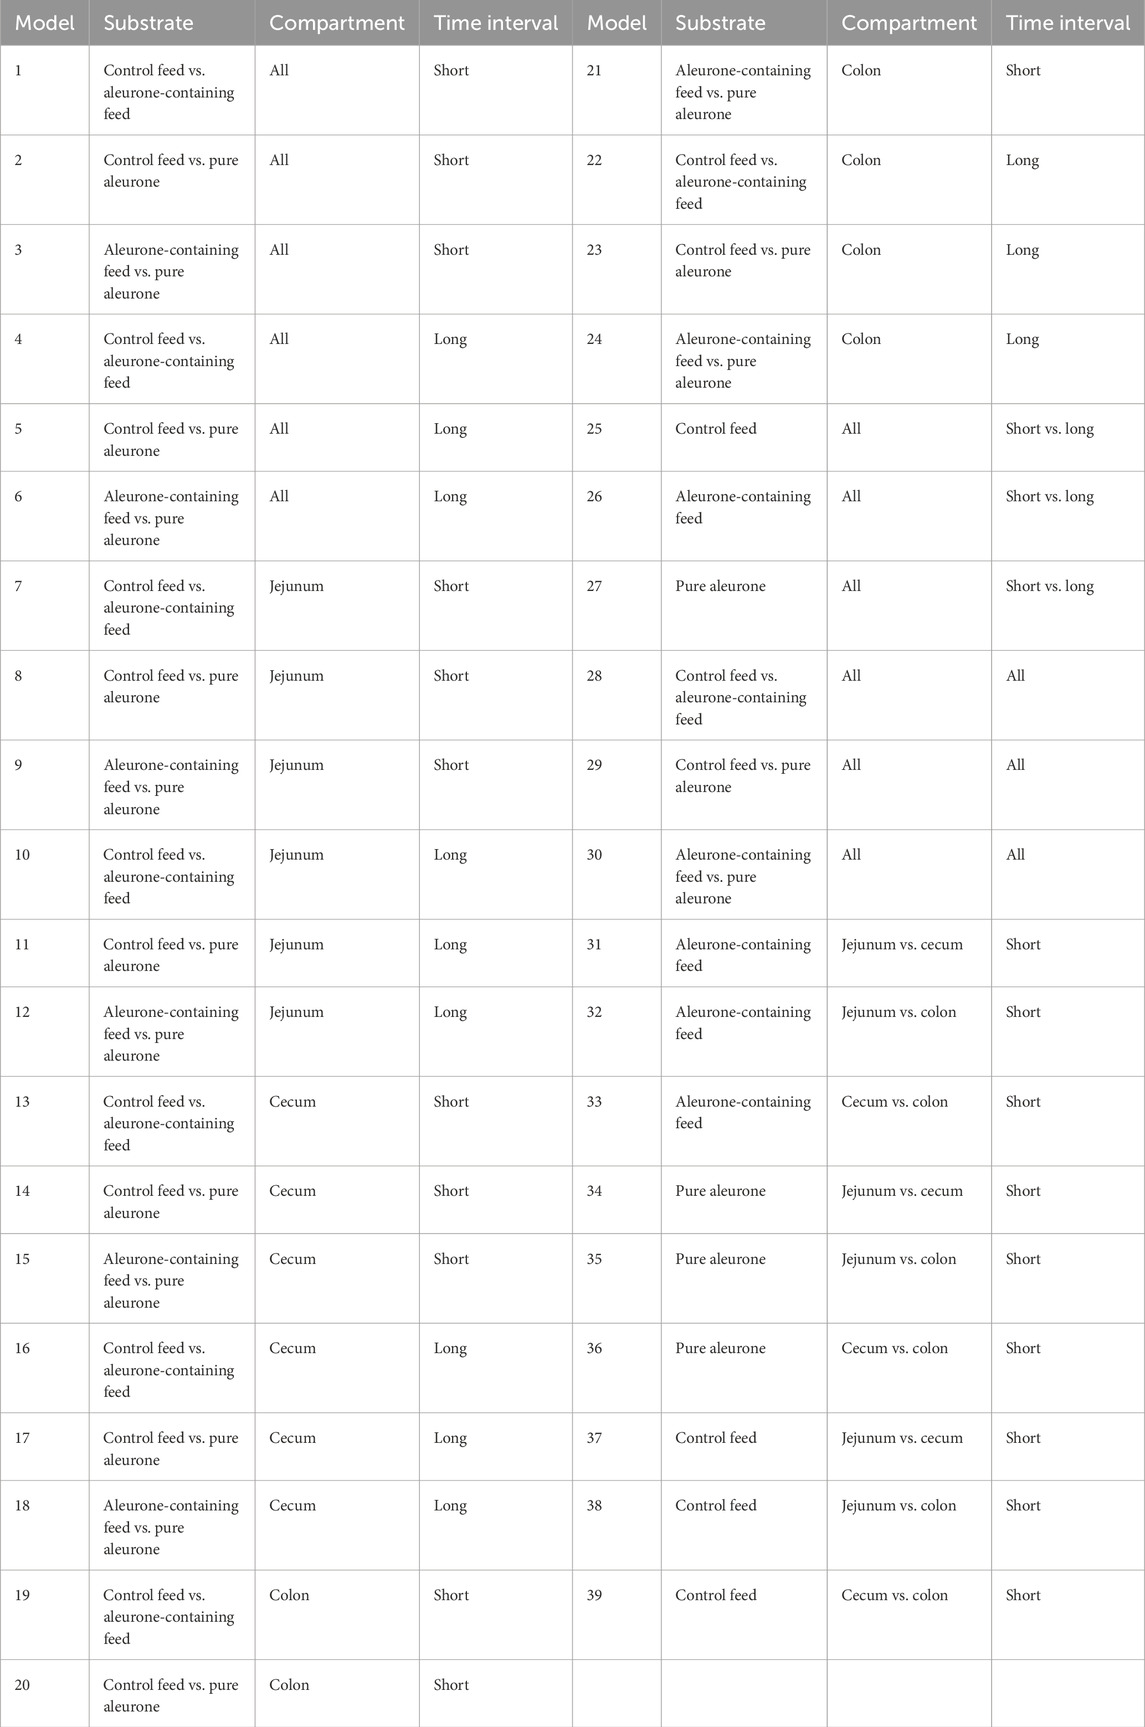
Table 2. Overview of the different AI models, detailing the specific combinations of substrates, gastrointestinal compartments, and time interval.
Assessment of feature importance and metabolite selection was performed as follows:
Feature importance: the importance of each metabolite was assessed based on the loss of model quality when the metabolite was removed from the dataset. The higher the loss of quality, the higher the importance of the metabolite. Random variable: in all models, a random made-up variable (Random_variable) was included as a cutoff. Metabolites ranked below this variable were not considered significant. Top important metabolites: the most important metabolites were identified on each occasion and further analyzed for mathematical correlation. The study of correlations and network analysis was performed as follows: mathematical correlation: correlations between important metabolites were analyzed to determine whether they changed in the same or opposite directions. Network plots: network plots were created to visualize the relationships between metabolites. The size of each circle indicates the importance of the metabolite, whereas the lines represent the strength (line thickness) and direction of the correlation (blue for direct and red for inverse). A correlation threshold of at least |0.3| was set. Unconnected metabolites that did not meet this threshold are depicted in different colors.
Results
Time-independent substrate effect
The analysis of metabolites during the fermentation process revealed significant differences in 21 of the 38 pre-defined metabolites: alanine, asparagine, betaine, carnitine, choline chloride, ferulic acid, glutamic acid, glutamine, histidine, isoleucine, indoleic acid, lactic acid, leucine, lysine, malic acid, NN-dimethylglycine, phenylalanine, threonine, tryptophan, tyrosine, and valine based on the substrate and the gut compartment (i.e., jejunum, cecum, and colon).
The most important results for time-independent substrate effect across all GI compartments for aleurone-containing feed compared to control feed were a significant increase in the levels of asparagine (P < 0.0001) and threonine (P = 0.000). Furthermore, there was a reduction in lactic acid (P = 0.002). In the group of pure aleurone, the overall metabolite abundance was lower than that of both the aleurone-containing feed and the control feed groups. The control feed group showed the highest abundance of alanine (P < 0.0001), carnitine (P < 0.0001), glutamic acid (P < 0.0001), glutamine (P < 0.0001), histidine (P < 0.0001), isoleucine (P < 0.0001), NN-dimethylglycine (P < 0.0001), phenylalanine (P < 0.0001), and tyrosine (P = 0.0001). Figure 1 shows the metabolites with different levels depending on the substrate type (control feed, aleurone-containing feed, and pure aleurone).
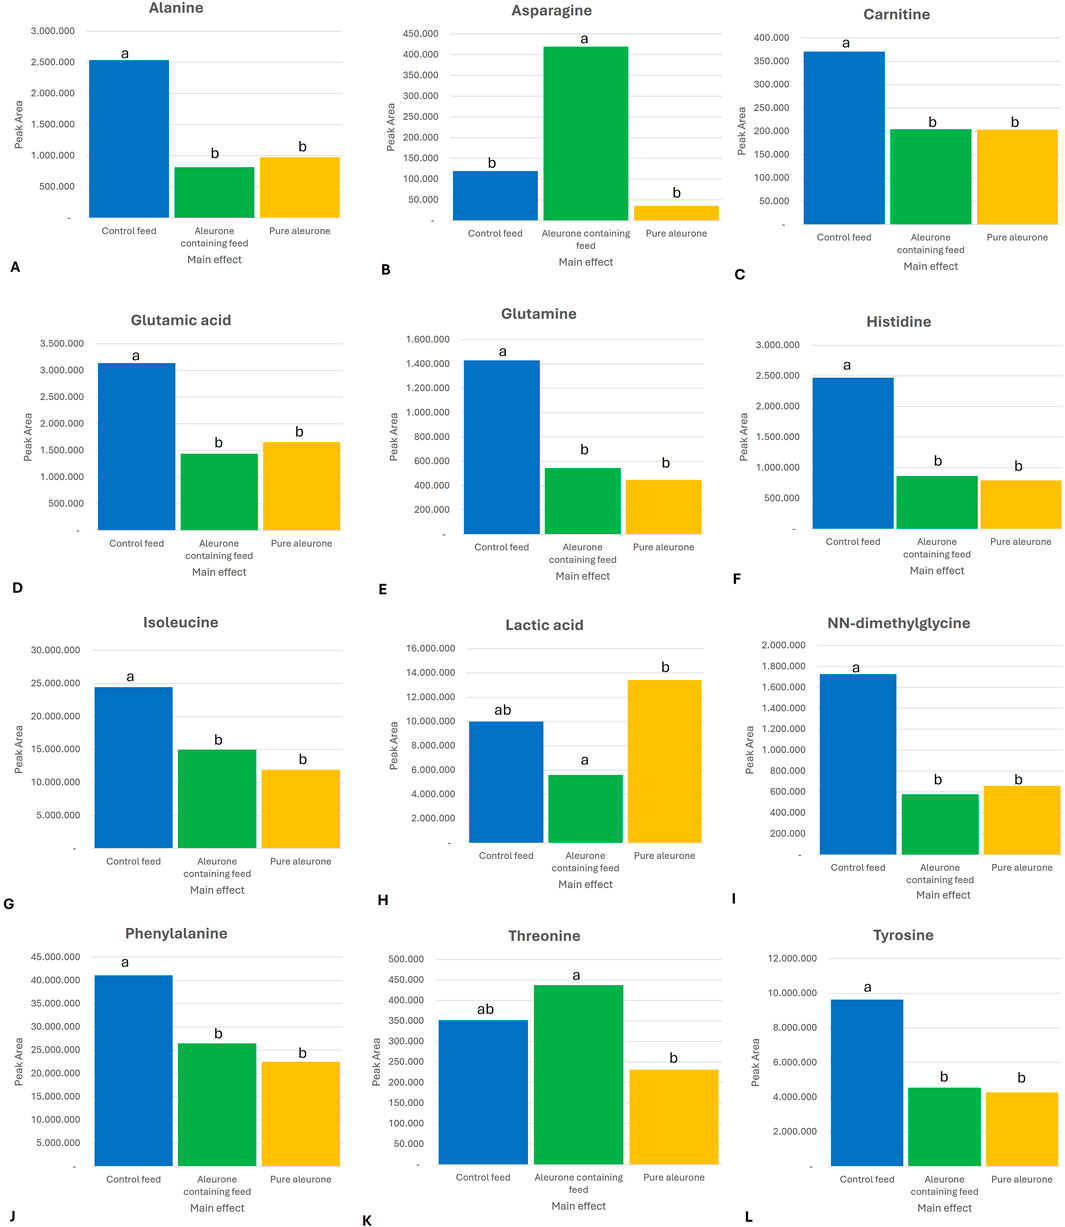
Figure 1. Bar graphs representing the significant substrate in the peak area for (A) alanine, (B) asparagine, (C) carnitine, (D) glutamic acid, (E) glutamine, (F) histidine, (G) isoleucine, (H) lactic acid, (I) NN-dimethylglycine, (J) phenylalanine, (K) threonine, and (L) tyrosine. The letters (a, ab, and b) above each bar represent the significance between the substrates. If two substrates have the same letter above, it means there is no significant difference between these two substrates for that specific metabolite. For example, for alanine, the control feed is significantly different from that of the aleurone-containing feed and the pure aleurone. However, there is no significant difference between the aleurone-containing feed and pure aleurone.
Time-independent compartment effect
The metabolite profiles varied significantly across the different GI compartments. Figure 2 provides a graphical overview of the significantly elevated metabolites for each GI compartment compared to the other GI compartments. This is to be expected as the different GI compartments have different microbiome compositions. In both the jejunum and colon, lactic acid (P = 0.002) was significantly higher than that in the cecum. This is consistent with anaerobic activity in these compartments. In the cecum, there were elevated levels of alanine (P < 0.0001), betaine (P < 0.0001), asparagine (P = 0.019), carnitine (P < 0.0001), choline chloride (P = 0.000), ferulic acid (P = 0.000), glutamine (P = 0.004), isoleucine (P < 0.0001), leucine (P = 0.0001), phenylalanine (P < 0.0001), tryptophan (P < 0.0001), and valine (P < 0.0001). These are indicative of an anaerobic fermentation process. Figure 3 provides an overview of the compartment effect, across the three substrates (control feed, aleurone feed, and pure aleurone).
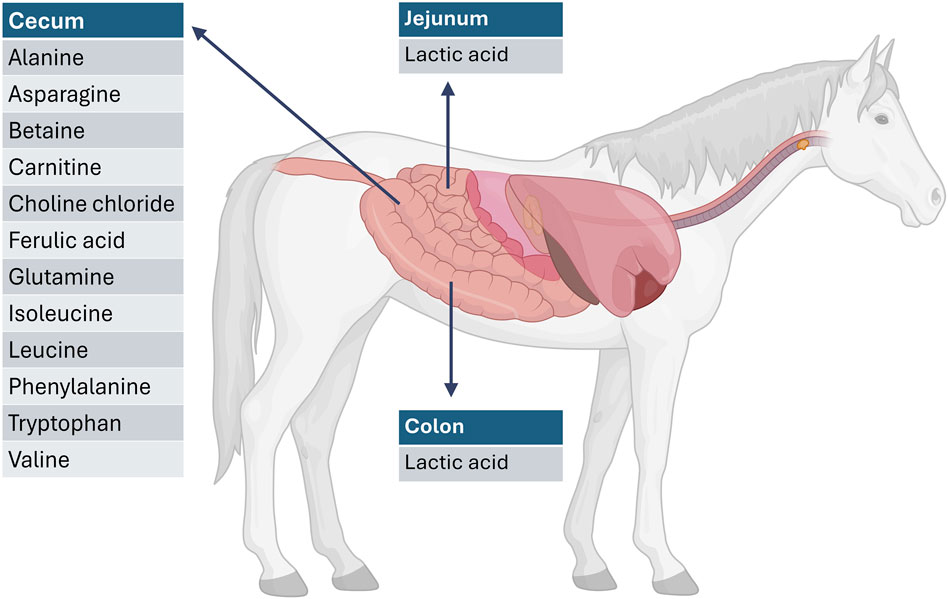
Figure 2. Representation of significantly elevated metabolites per GI compartment compared with the other GI compartments. For example, the metabolites listed at the level of the cecum are significantly increased when compared to the jejunum and the colon. Created in BioRender. Willems, M. (2025) https://BioRender.com/dzzz9ae.
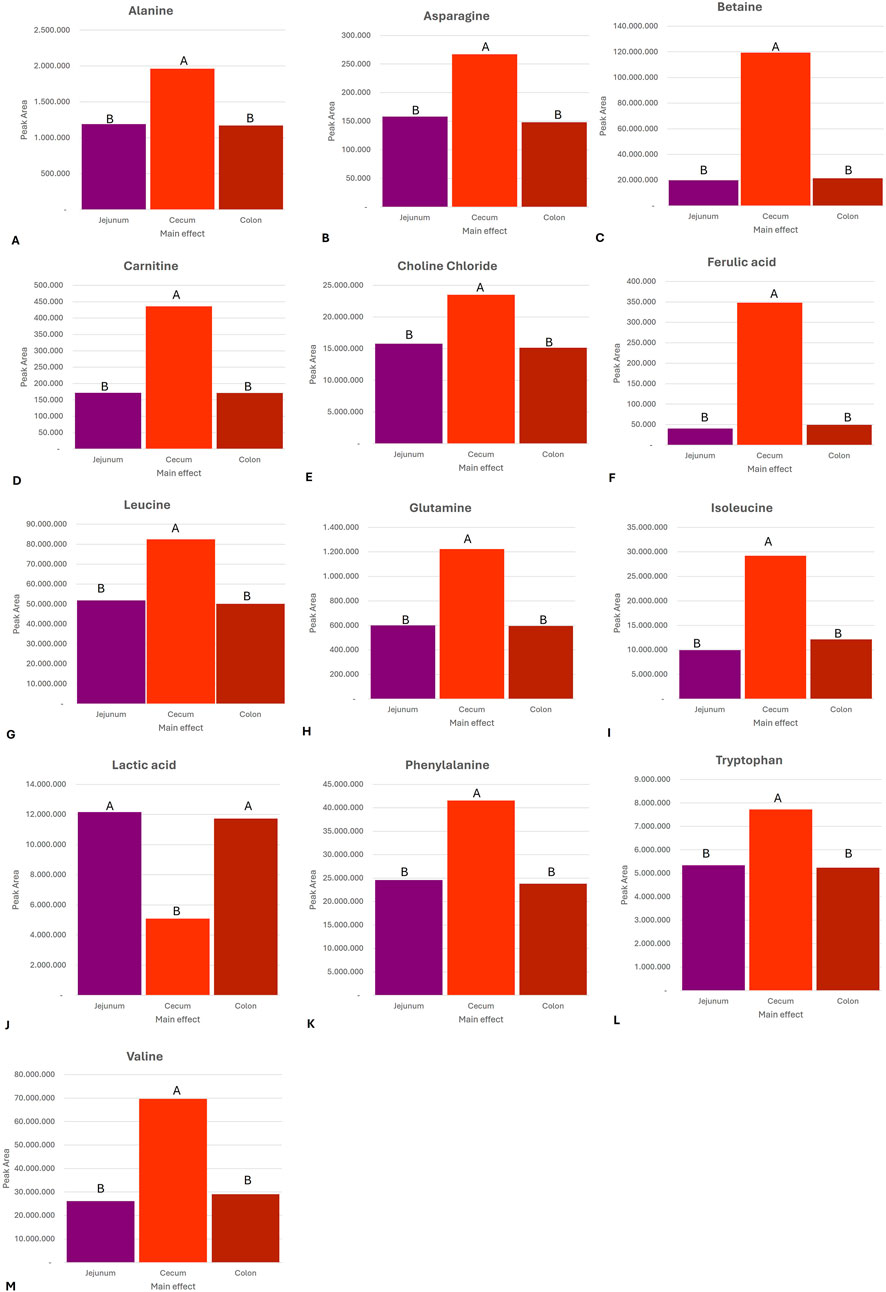
Figure 3. Bar graphs representing the compartment effect, across the three substrates (control feed, aleurone-containing feed, and pure aleurone), on the abundance in the peak area of (A) alanine, (B) asparagine, (C) betaine, (D) carnitine, (E) choline chloride, (F) ferulic acid, (G) leucine, (H) glutamine, (I) isoleucine, (J) lactic acid, (K) phenylalanine, (L) tryptophan, and (M) valine. The letters (A and B) above each bar represent the significance between the compartments (e.i. jejunum, cecum, and colon); the same letter means there is no significant difference between each other. If two substrates have the same letter above, it means there is no significant difference between these two GI compartment for that specific metabolite. For example, for alanine, the cecum is significantly different from that of the jejunum and the colon. However, there is no significant difference between the jejunum and the colon.
Substrate × compartment interactions
The interaction between the substrate and the GI compartment indicated that the effect of the feed type on the metabolite production varied across the different sections of the gut. It suggests a compartment-specific utilization or production pattern of metabolites. The metabolites alanine (P = 0.038) and malic acid (P = 0.013) showed a significant interaction of production and utilization in different GI compartments. Alanine was more abundant in the cecum than in the other two compartments under control feed. In contrast to this, malic acid showed an opposite pattern. It was more abundant in the jejunum and colon than in the cecum under aleurone-containing feed and pure aleurone conditions (Figure 4).
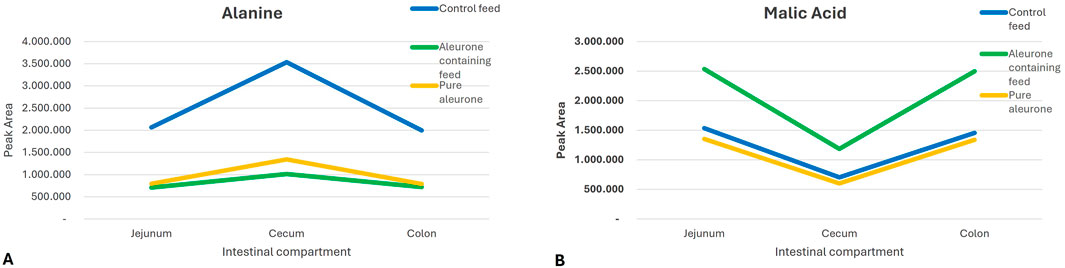
Figure 4. Graphs representing the differences in the peak area of (A) alanine and (B) malic acid for each substrate (control feed, aleurone-containing feed, and pure aleurone) used in each GI compartment.
Time-dependent substrate effect by the compartment
Figure 5 visually represents the relationships between the significant metabolite changes and the substrate for the jejunum (5A), cecum (5B), and colon (5C).
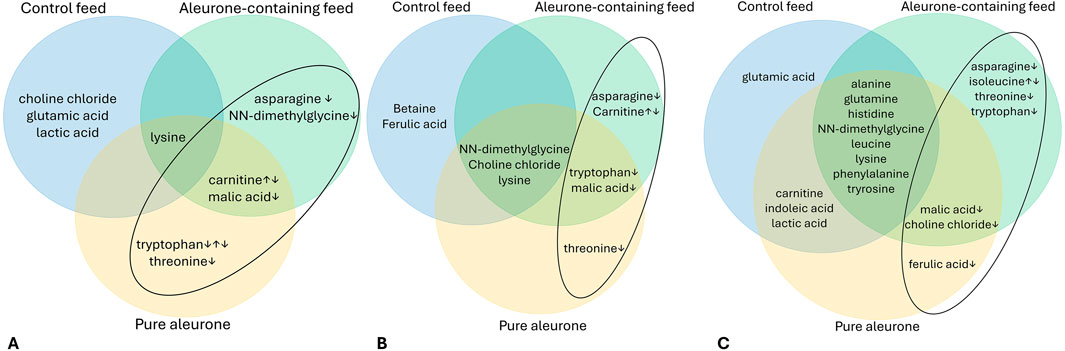
Figure 5. Venn diagram for the jejunum (A), the cecum (B), and the colon (C), depicting the important time-dependent metabolites for each substrate (control feed, aleurone-containing feed, and pure aleurone). The ↓ and ↑ show the concentration trend over time (T0–T72). In the ellipse, the metabolites for aleurone-containing feed and pure aleurone are highlighted.
In the jejunum (Figure 5A), with aleurone-containing feed, there was a significant change over the time period T0–T72 for five metabolites: asparagine (P < 0.001), carnitine (P < 0.001), lysine (P < 0.001), malic acid (P < 0.001), and NN-dimethylglycine (P < 0.001). For the pure aleurone substrate, there was a significant change in five metabolites: carnitine (P = 0.038), lysine (P < 0.001), malic acid (P < 0.001), threonine (P = 0.006), and tryptophan (P = 0.032). In the control feed group, there was a significant change in four metabolites: choline chloride (P = 0.004), glutamic acid (P = 0.002), lactic acid (P = 0.001), and lysine (P = 0.019). The time lapses of up- or downregulation of these important metabolites for both aleurone-containing feed and pure aleurone is further discussed below (Figure 5C).
In the cecum (Figure 5B), with aleurone-containing feed, there were significant changes in seven metabolites along the time period T0–T72: asparagine (P < 0.001), carnitine (P < 0.001), choline chloride (P = 0.016), lysine (P < 0.001), NN-dimethylglycine (P < 0.001), tryptophan (P = 0.010), and malic acid (P = 0.005). With pure aleurone, this resulted in a significant change in six metabolites: choline chloride (P = 0.021), lysine (P < 0.001), malic acid (P < 0.001), NN-dimethylglycine (P = 0.010), threonine (P = 0.037), and tryptophan (P = 0.002). For the control feed, significant time changes were observed in five metabolites: betaine (P = 0.002), choline chloride (P = 0.004), ferulic acid (P = 0.037), lysine (P = 0.030), and NN-dimethylglycine (P = 0.017).
Finally, the most different metabolite changes over the time period T0–T72 were observed in the colon (Figure 5C). With aleurone-containing feed, a significant change was observed in 14 different metabolites: alanine (P < 0.001), asparagine (P = 0.022), choline chloride (P < 0.001), glutamine (P = 0.011), histidine (P < 0.001), isoleucine (P = 0.002), leucine (P < 0.001), lysine (P < 0.001), malic acid (P < 0.001), NN-dimethylglycine (P < 0.001), phenylalanine (P = 0.001), threonine (P < 0.001), tryptophan (P = 0.005), and tyrosine (P < 0.001). Pure aleurone resulted in a significant change in 14 metabolites: alanine (P < 0.001), carnitine (P = 0.017), choline chloride (P < 0.001), ferulic acid (P = 0.049), glutamine (P = 0.001), histidine (P < 0.001), indoleic acid (P = 0.027), lactic acid (P = 0.035), leucine (P = 0.005), lysine (P < 0.001), malic acid (P < 0.001), NN-dimethylglycine (P = 0.003), phenylalanine (P = 0.004), and tyrosine (P < 0.001). Finally, with control feed, there was a significant change in 12 metabolites: alanine (P < 0.001), carnitine (P < 0.001), glutamic acid (P < 0.001), glutamine (P = 0.006), histidine (P < 0.001), indoleic acid (P = 0.005), lactic acid (P = 0.013), leucine (P = 0.024), lysine (P = 0.002), NN-dimethylglycine (P = 0.004), phenylalanine (P = 0.002), and tyrosine (P < 0.001).
The time trends of the main metabolites for aleurone-containing feed and pure aleurone revealed that for the aleurone feed, asparagine (Figure 6A) in all the GI compartments showed a sharp decrease until T3, followed by a less pronounced decrease until it disappeared at T6. Carnitine (Figure 6B) showed, at the level of the cecum with aleurone-containing feed and in the jejunum with both the aleurone-containing feed and pure aleurone, a peak at T24, a sharp decrease at T48, and a further gradual decrease thereafter. The time-dependent changes for isoleucine (Figure 6C) in the colon with aleurone-containing feed showed a decrease at T3, evolving into a peak at T6 before decreasing sharply at T24. In the jejunum with aleurone-containing feed, NN-dimethylglycine (Figure 6D) decreased until T3, remained stable until T6, and then decreased sharply until T48. In the colon, choline chloride (Figure 6E) with aleurone-containing feed showed a peak at T6 and subsequently decreased until T24. With pure aleurone, it began to decrease gradually, and at T24, the decrease became more pronounced. Malic acid’s (Figure 6F) abundance time profile is comparable for the jejunum and colon with aleurone-containing feed; it decreased gradually until T3 and then decreased sharply until T6. With pure aleurone, the jejunum and colon are also comparable; it decreased sharply until T3 and then decreased more gradually. In the cecum with aleurone-containing feed, it showed a peak at T3 and then decreased until T6; with pure aleurone, it decreased sharply until T3 and then more gradually thereafter. In the colon with aleurone-containing feed, threonine abundance (Figure 6G) decreased strongly from T3 to T24 and showed a small peak at T48. In the jejunum and cecum with pure aleurone, it decreased sharply until T3 and then more gradually until T24, followed by a small peak at T48. In the colon with aleurone-containing feed, tryptophan (Figure 6H) began decreasing at T3 to disappear at T48. At the level of the cecum with aleurone-containing feed, it started decreasing sharply at T3 and more gradually from T6 to T48. With pure aleurone, it decreased sharply to T3, gradually to T6, increased to a small peak at T24, and finally decreased until T48. In the jejunum with pure aleurone, it showed a strong decrease until T3 and started gradually to increase to reach a peak at T24. Finally, in the colon with pure aleurone, ferulic acid (Figure 6I) showed a peak at T3, with a decrease until T24.
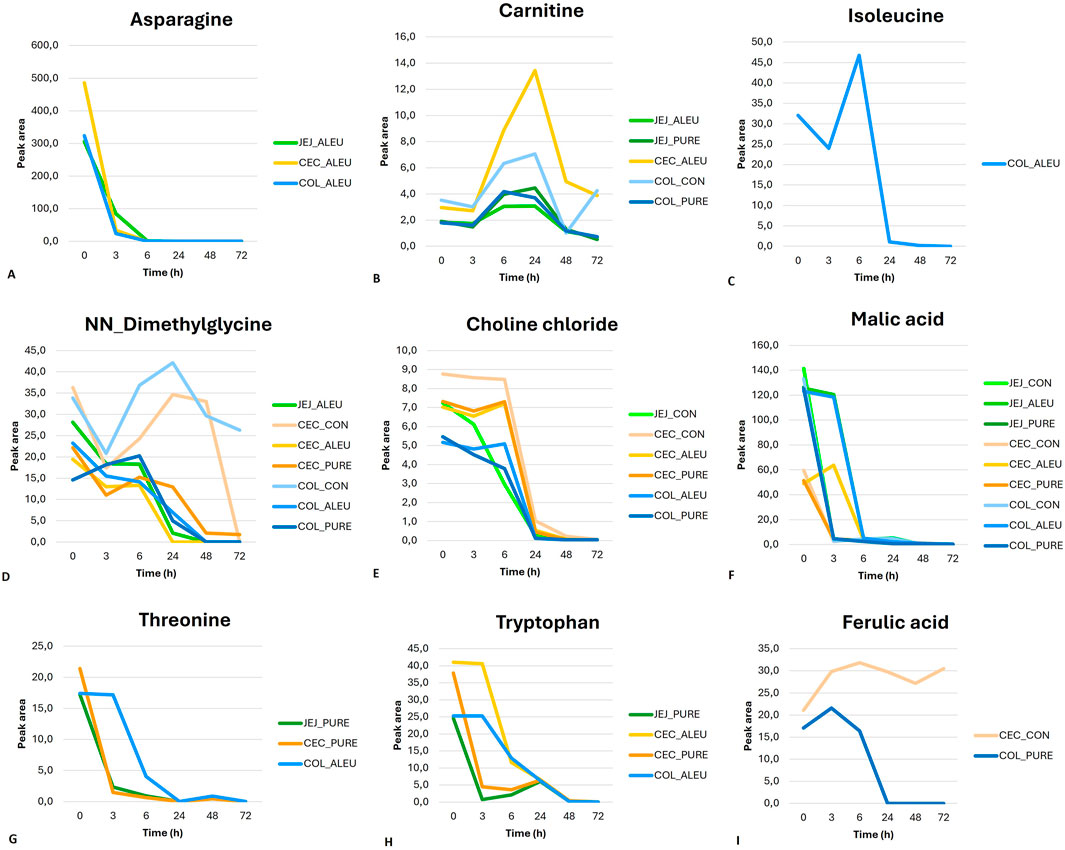
Figure 6. Time-course of metabolite abundancy for the different GI compartments is represented by different colors [(green for jejunum (JEJ), orange for cecum (CEC), and blue for colon (COL)], and substrates are represented by different color shades [light for control feed (CON), medium for aleurone-containing feed (ALEU), and dark for pure aleurone (PURE)].
Long-term vs. short-term metabolite dynamics
The results of the effect of time between a short time interval (T0–T6) vs. a long time interval (T24–T72) on the metabolite changes over all the GI compartments showed a significant change in 15 metabolites: alanine (P < 0.001), asparagine (P < 0.001), betaine (P = 0.004), carnitine (P < 0.001), choline chloride (P = 0.008), ferulic acid (P < 0.001), glutamic acid (P < 0.001), glutamine (P = 0.002), histidine (P < 0.001), lysine (P = 0.006), malic acid (P < 0.001), NN-dimethylglycine (P < 0.001), threonine (P = 0.001), tryptophan (P < 0.001), and tyrosine (P < 0.001).
In general, these metabolites showed higher concentrations during the short time interval than during the long time interval, except for carnitine, which was present at a higher concentration during the long time interval.
AI model insights
After running the AI model across all 39 structured models, the following models (M) with significant results of P ≤ 0.05 and with accuracy above 85% were obtained: (M1) control feed vs. aleurone-containing feed, short time (T0–T6), all compartments (accuracy = 99%; P = 0.0015); (M2) control feed vs. pure aleurone, short time, all compartments (accuracy = 98%; P = 0.0020); (M3) aleurone-containing feed vs. pure aleurone, short time, all compartments (accuracy = 96%; P = 0.0020); (M4) control feed vs. aleurone-containing feed, long time (T24–T72), all compartments (accuracy = 92%; P = 0.0075); (M5) control feed vs. pure aleurone, long time, all compartments (accuracy = 94%; P = 0.0065); (M28) control feed vs. aleurone-containing feed, complete time interval, all compartments (accuracy = 96%; P = 0.0005); and (M29) control feed vs. pure aleurone, complete time interval, all compartments (accuracy = 95%; P = 0.0005).
Each of these models provides a list of the most important metabolites, in a descending order of importance, and a network analysis of the correlation between the metabolites.
AI model 1 compared the control feed with aleurone-containing feed over a short time interval. This model resulted in 10 important metabolites: indole acetic acid, histidine, alanine, tyrosine, taurine, ferulic acid, phenylalanine, valine, leucine, and lactic acid. The aleurone-containing feed metabolic profile was different from that of the control, with a higher abundance of indole acetic acid and ferulic acid. An overview of the metabolic profile can be found in Figure 7A. The network analysis (Figures 8A,B) of this model showed a positive correlation between lactic acid and indole acetic acid but a negative correlation with most amino acids (phenylalanine, histidine, leucine, glutamine, lysine, alanine, tyrosine, isoleucine, and taurine). Furthermore, ferulic acid had a positive correlation with carnitine but a negative correlation with lactic acid and NN-dimethylglycine.
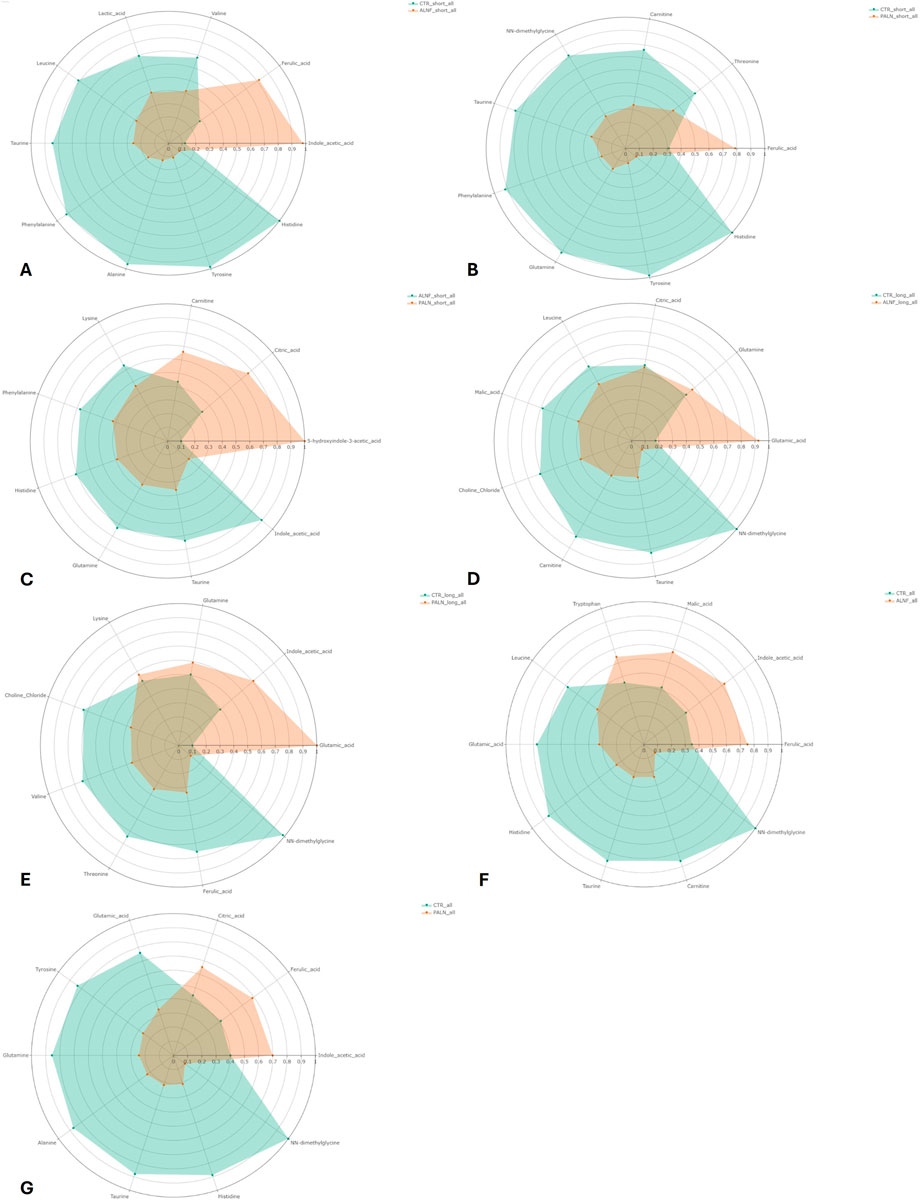
Figure 7. Radar diagrams of the metabolic profile of the AI models. Each colored area represents the relative concentration of the metabolite in the respective group. The distance from the center of the chart indicates the magnitude of the value; further out means higher concentration. Model 1 (A) green for control feed and red for aleurone-containing feed. This indicates a higher concentration of indole acetic acid and ferulic acid with aleurone-containing feed compared with the control feed. Model 2 (B) green for control feed and red for pure aleurone. This indicates a higher concentration of ferulic acid with pure aleurone compared with the control feed. Model 3 (C) green for aleurone-containing feed and red for pure aleurone. This indicates a higher concentration of 5-hydroxyindole-3-acetic, citric acid, and carnitine with pure aleurone compared with aleurone-containing feed. Model 4 (D) green for control feed and red for aleurone-containing feed. This indicates a higher concentration of glutamic acid and glutamine with aleurone-containing feed compared to the control feed. Model 5 (E) green for control feed and red for pure aleurone. This indicates a higher concentration of glutamic acid, indole acetic acid, glutamine, and lysine with pure aleurone compared with the control feed. Model 28 (F) green for control feed and red for aleurone-containing feed. This indicates a higher concentration of ferulic acid, indole acetic acid, malic acid, and tryptophan with aleurone-containing feed compared with the control feed. Model 29 (G) green for control feed and red for pure aleurone. This indicates a higher concentration of indole acetic acid, ferulic acid, and citric acid with pure aleurone compared with the control feed.
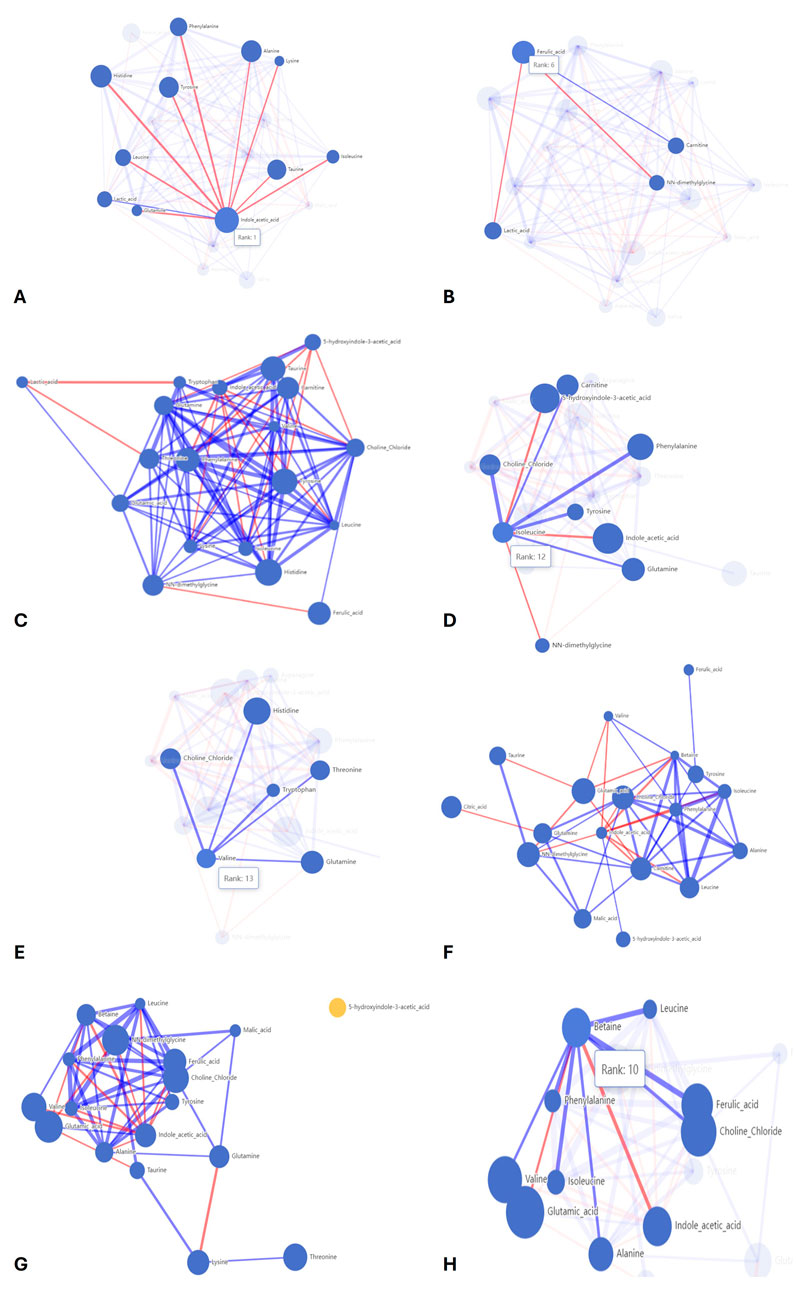
Figure 8. Correlation networks of the AI models. The size of the node represents the importance of the metabolite in the model. The lines represent positive (blue) and negative (red) correlations between metabolites. The width of the lines represents the strength of the correlation. (A) Correlation network for model 1, highlighting the correlations for indole acetic acid and (B) for ferulic acid. (C) Correlation network for model 2. (D) Correlation network for model 3, highlighting the correlations for isoleucine and (E) valine. (F) Correlation network for model 4. (G) Correlation network for model 5 highlighting the correlation for (H) betaine.
Model 2 compared control feed with pure aleurone for a short time interval, which resulted in eight important metabolites, namely, histidine, tyrosine, taurine, phenylalanine, ferulic acid, carnitine, NN-dimethylglycine, and threonine. Comparing the metabolic profiles (Figure 7B) of pure aleurone and the control, pure aleurone had a higher abundance of only ferulic acid. This was positively correlated to choline and negatively correlated to NN-dimethylglycine (Figure 8C).
Model 3 compared aleurone-containing feed with pure aleurone for a short time interval, which resulted in five important metabolites, namely, indole acetic acid, 5-hydroxyindole-3 acetic, lysine, histidine, and phenylalanine. The pure aleurone metabolic profile (Figure 7C) was associated with a higher abundance of 5-hydroxyindole-3- acetic than that of the aleurone-containing feed. The metabolic profile (Figure 7C) of the aleurone feed was associated with a higher abundance of histidine, phenylalanine, lysine, and indoleic acid. The network metabolite analysis (Figure 8D) showed a negative correlation between 5-hydroxyindole-3-acetic and isoleucine. Choline was positively correlated with both isoleucine and valine.
In model 4, the control feed was compared with the aleurone-containing feed for a long time interval. This resulted in five important metabolites: glutamic acid, NN-dimethylglycine, choline chloride, carnitine, and citric acid. The metabolic profile (Figure 7D) of aleurone-containing feed was associated with a higher abundance of glutamic acid and glutamine than that of the control group, with a higher abundance of NN-dimethylglycine, carnitine, choline chloride, and citric acid. Figure 8F provides the metabolic network for model 4.
Model 5 compared control feed with pure aleurone for a long time interval. This led to seven important metabolites: glutamic acid, NN-dimethylglycine, choline chloride, valine, threonine, ferulic acid, and lysine. The metabolic profile (Figure 7E) for pure aleurone resulted in higher abundance of glutamic acid, indole acetic acid, glutamine, and lysine, whereas that of control feed was associated with a higher abundance of NN-dimethylglycine, ferulic acid, threonine, valine, and choline chloride.
The metabolic network (Figures 8G,H) showed a positive correlation between glutamine and alanine, choline, and malic acid. However, it was negatively correlated to lysine. Betaine (Figure 8H) was negatively correlated to glutamic acid and indole acetic acid.
Model 28 compared control feed and aleurone-containing feed over all the GI compartments and the entire time interval. This resulted in 10 important metabolites: glutamic acid, indole acetic acid, NN-dimethylglycine, ferulic acid, carnitine, taurine, histidine, malic acid, leucine, and tryptophan. The metabolic profile (Figure 7F) of aleurone feed had a higher abundance of ferulic acid, indole acetic acid, malic acid, and tryptophan than that of the control feed, which had a higher abundance of NN-dimethylglycine, carnitine, taurine, histidine, glutamic acid, and leucine.
Model 29 compared control feed with pure aleurone over all the GI compartments and the entire time interval. This resulted in 10 important metabolites, namely, glutamic acid, taurine, histidine, ferulic acid, NN-dimethylglycine, tyrosine, glutamine, alanine, citric acid, and indole acetic acid. The metabolite profile (Figure 7G) of pure aleurone showed a higher abundance of indole acetic acid, ferulic acid, and citric acid. Compared to the metabolic profile of the control feed, higher abundances of NN-dimethylglycine, histidine, taurine, alanine, glutamine, tyrosine, and glutamic acid were observed.
Summary
Across both time intervals together, significant changes were observed in the metabolites ferulic acid and indole acetic acid for both aleurone-containing feed and pure aleurone. Citric acid changed significantly only with the pure aleurone substrate.
Within the short time interval, a significant change occurred for metabolite ferulic acid in both aleurone-containing feed and pure aleurone. For indole acetic acid, this change occurred in aleurone-containing feed, whereas for citric acid, it occurred only with pure aleurone.
The long time interval showed, for both aleurone-containing feed and pure aleurone, a change in the metabolites (glutamine and glutamic acid). Indole acetic acid changed significantly only with pure aleurone.
Discussion
In this study, we provide clear evidence that aleurone and aleurone-containing feed exert compartment- and time-dependent effects on microbial fermentation and metabolite production in the equine gastrointestinal tract. These findings are consistent with previous in vivo studies showing shifts in microbial composition and improved insulin sensitivity following aleurone supplementation in horses (Boshuizen et al., 2021; Boshuizen et al., 2025). The present data further specify that such effects are not uniform across the gut but are most pronounced in the cecum and colon, which are recognized as key fermentation sites (Dougal et al., 2013; Reed et al., 2021).
Within this context, several mechanistic explanations can be considered. The reduction in lactic acid under aleurone-containing feed, for example, may indicate enhanced lactate utilization by cecal microbes such as Megasphaera elsdenii or Veillonella spp., taxa known to maintain hindgut pH stability (Biddle et al., 2013; Louis et al., 2022). Similarly, the lower overall metabolite abundance observed with pure aleurone likely reflects its restricted nutrient profile, which limits broad microbial activity. At the same time, the structural matrix of aleurone may encapsulate fermentable substrates and modulate their release, delaying microbial access and contributing to the time-resolved patterns observed (Pekkinen et al., 2014; Lebert et al., 2022).
Time-independent substrate effect
Aleurone-containing feed led to increased levels of asparagine and threonine and a reduction in lactic acid compared to control feed. The reduction in lactic acid may suggest improved fermentation efficiency or alternative microbial metabolic routes, which could be beneficial in maintaining hindgut pH stability (Biddle et al., 2013; Dicks et al., 2014). The lower overall metabolite abundance in the pure aleurone group likely results from its limited nutrient spectrum, which is insufficient to support broad microbial activity. Interestingly, the control feed led to the highest overall metabolite abundance. One explanation may lie in the physical structure of aleurone, which can encapsulate or slow the release of fermentable substrates, leading to a different fermentation output time profile when compared to aleurone-containing feed or control feed (Pekkinen et al., 2014; Lebert et al., 2022).
Table 3 provides an overview to explain why higher metabolic output values were observed for control feed when compared to the other two substrates (aleurone-containing feed or pure aleurone).
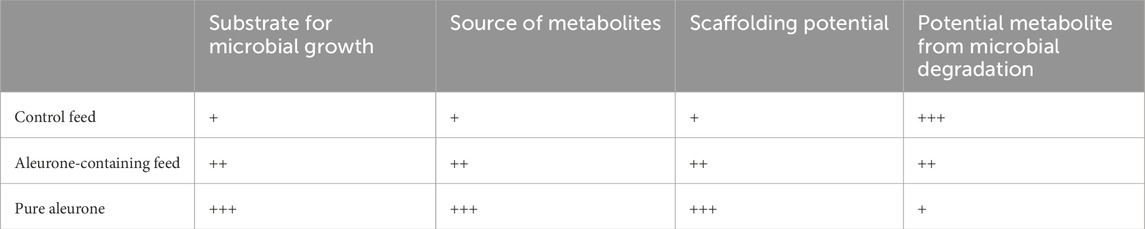
Table 3. An overview to explain why higher metabolic output values were observed for control feed when compared to the other two substrates (aleurone-containing feed or pure aleurone).
Time-independent compartment effect
The cecum displayed significantly higher levels of various metabolites than the jejunum and colon, confirming its role as a major fermentation site in horses. This finding aligns with that of the previous literature, emphasizing the cecum’s anaerobic environment and rich microbial diversity. Lactic acid levels were higher in the jejunum and colon but low in the cecum, suggesting active lactate-utilizing microbes in the latter. Taxa such as M. elsdenii and V. spp., known for lactate consumption, may play a role. The metabolic output differences across compartments underline the importance of compartment-specific evaluation in equine digestive studies.
Although the colon, particularly the ventral and dorsal colon, contributes significantly to the fermentation process (Sneddon et al., 2006; Dougal et al., 2013; Reed et al., 2021), the cecum is often highlighted as the major site for microbial fermentation, with a significant role in the breakdown of dietary fibers and production of volatile fatty acids (Brandi and Furtado, 2009; Fujimori, 2021). The cecum is particularly important for hosting a variety of microorganisms that initiate the fermentation, whereas the colon continues this process, further breaking down the digesta (Dougal et al., 2013; Reed et al., 2021). The lower levels of lactic acid in the cecum suggest a possible metabolic pathway where lactic acid produced in the jejunum is utilized by cecal microbes for further fermentation, potentially contributing to the production of other beneficial metabolites such as SCFAs (Al Jassim et al., 2005; Mach et al., 2021; Louis et al., 2022). It has been described that taxa related to M. elsdenii and Veillonella montpellierensis are known to utilize lactate, reducing its concentration in the large intestine (Biddle et al., 2013). This aligns with the anaerobic conditions of the cecum, which favors the growth of microbes capable of metabolizing lactic acid. It is important to note that the control diet contained slightly more readily fermentable carbohydrate than the aleurone diet (starch + sugars ∼342 vs. 316 g/kg) (Supplementary Table S1), which could have induced a higher lactic acid production. However, when translating this to the in vivo study (Boshuizen et al., 2025), the magnitude is well below doses typically associated with pronounced hindgut lactate accumulation or large insulin excursions. Any effect of this small residual difference is likely minimal and does not change the interpretation of the lactate results. The observed differences are more readily explained by aleurone’s matrix properties and compartment-specific microbial responses.
Time-dependent substrate effect by the compartment
Fermentation kinetics revealed time-specific dynamics in metabolite abundance. Several metabolites peaked early (T3 or T6) and declined, indicative of microbial utilization after initial substrate breakdown. These temporal profiles varied by GI compartment and substrate, highlighting localized microbial activity and metabolic specialization. The colon displayed the most dynamic fermentation profile, consistent with its diverse microbiota and extended digesta retention time.
Most metabolites significantly changed in the colon, followed by the cecum and jejunum. This is in agreement with previous studies suggesting that the concentration of volatile fatty acids increases significantly from the cecum to the colon (Miyaji et al., 2008) and the microbial population in the colon is distinct and more diverse than that of the cecum, contributing to a more extensive fermentation process (Dougal et al., 2013; Reed et al., 2021).
Isoleucine, an amino acid relevant for muscle metabolism in exercising horses, showed compartment-specific production, particularly in the colon under aleurone-containing feed, suggesting microbial biosynthesis (Zhuang et al., 2025).
The sustained presence or delayed peak of certain metabolites may be influenced by aleurone’s unique 3D structure. This scaffold-like matrix could physically trap nutrients and release them more slowly, affecting both substrate availability and microbial access. Similar mechanisms have been proposed in the field of bioengineered gut scaffolds and could explain some of the metabolic trends observed (Orlando et al., 2012; Lefebvre et al., 2015).
Long-term vs. short-term metabolite dynamics
Most metabolites were more abundant in early time points (T0–T6), except carnitine, which increased over time and was particularly elevated in the cecum. This aligns with the known microbial synthesis of carnitine and highlights the cecum’s role in producing compounds involved in lipid metabolism and energy balance (Dambrova et al., 2022). Aleurone did not significantly alter carnitine levels, suggesting that its effects may be substrate- or compartment-specific.
AI models
The application of AI modeling identified key metabolites that distinguish between substrates. Ferulic acid and indole acetic acid emerged as central differentiators for aleurone-containing feed and pure aleurone, respectively. Other metabolites such as glutamine, glutamic acid, and citric acid were also identified, reinforcing the capacity of aleurone to modulate amino acid and energy-related pathways. The high predictive accuracy of these models supports their use in future biomarker discovery and functional feed evaluation.
Static in vitro systems, although economical and high-throughput, lack the physiological dynamics of digestion such as peristalsis, enzyme gradients, and mucosal interactions. Future studies may benefit from coupling static fermentation with dynamic in vitro digestion models to improve physiological relevance (Sensoy, 2021). In contrast, dynamic in vitro models represent more accurately physiological conditions within the digestive system and can be either mono- or multi-compartmental (Guerra et al., 2012; Dupont et al., 2019; Liu et al., 2019; Sensoy, 2021). These models can simulate changes in pH, enzyme secretion, peristaltic forces, and microbial fermentation, proving a more comprehensive understanding of digestive processes (Liu et al., 2019; Sensoy, 2021).
Linking metabolite profiles to microbial taxa across in vitro and in vivo aleurone studies
The in vitro fermentation trial identified several key metabolites, including ferulic acid, indole acetic acid, asparagine, threonine, and reduced lactate, which provide strong clues about the gut microbial taxa likely to be involved. Ferulic acid release is typically associated with members of the Bacteroidetes and Firmicutes (notably Lachnospiraceae and Ruminococcaceae), which harbor feruloyl esterases capable of liberating bound phenolics. Indole acetic acid derives from microbial tryptophan metabolism, often linked to Clostridiales and certain Bacteroides species. The observed reduction in lactate with aleurone-containing feed is consistent with enhanced utilization by lactate-consuming taxa such as M. elsdenii and V. spp., taxa known to stabilize hindgut pH. When aligned with the in vivo oral dosing trial (Boshuizen et al., 2021), where aleurone supplementation shifted the fecal microbiome toward higher Bacteroidetes and Spirochaetes, with a concomitant decrease in Firmicutes and Verrucomicrobia, these metabolite patterns suggest that aleurone promotes a microbial ecosystem enriched in fibrolytic- and phenolic-metabolizing phyla. The training study (Boshuizen et al., 2025) further supports this interpretation: aleurone supplementation reduced inflammation-associated Desulfovibrio and correlated positively with Ruminococcaceae and Victivallis, taxa linked to improved insulin sensitivity. Taken together, the concordance of metabolite profiles and microbiome shifts across in vitro and in vivo settings indicates that aleurone likely fosters a hindgut community where Bacteroidetes, Ruminococcaceae, and lactate-utilizing taxa are promoted, underpinning the observed improvements in metabolic flexibility and insulin sensitivity.
Conclusion
In this study, we confirm that aleurone alters fermentation patterns and metabolite production in a compartment-specific and time-dependent manner. The metabolic effects were more pronounced with aleurone-containing feed than with pure aleurone, underscoring the importance of matrix interactions and nutrient balance.
In parallel, the application of AI-based modeling demonstrated that complex metabolomic datasets from in vitro fermentations can be classified with high accuracy. The models consistently identified ferulic acid, indole acetic acid, and related metabolites as key discriminators, providing candidate biomarkers of aleurone exposure. This dual approach not only strengthens mechanistic insight into aleurone’s functional role but also illustrates the value of AI as a complementary analytical tool for dietary evaluation.
Together, these findings highlight aleurone’s potential as a functional feed component in horses and establish a framework for integrating AI-driven metabolomic analysis into future in vivo validation and nutritional applications.
Data availability statement
The datasets presented in this study can be found in online reporitory. The name of the repository and accession number can be found below: https://figshare.com/, 10.6084/m9.figshare.30429076.
Ethics statement
Ethical approval was not required for the study: According to European Directive 2010/63/EU on the protection of animals used for scientific purposes, ethical approval is not required for studies involving materials obtained from animals that were not euthanized for the purpose of the experiment. In the present study, digesta from the jejunum, caecum, and colon of horses were collected ex vivo.
Author contributions
BB: Writing – original draft, Formal analysis, Methodology, Data curation, Investigation, Validation, Conceptualization, Writing – review and editing. MW: Writing – review and editing, Writing – original draft, Visualization. LD: Writing – original draft, Investigation, Writing – review and editing, Methodology. GH: Software, Writing – review and editing, Visualization, Conceptualization, Investigation, Writing – original draft, Formal analysis, Validation, Methodology. JD: Formal analysis, Visualization, Validation, Conceptualization, Methodology, Writing – review and editing, Software, Investigation, Writing – original draft. BH: Validation, Writing – review and editing, Formal analysis, Data curation, Methodology. CV: Visualization, Writing – review and editing, Writing – original draft. E-LV: Writing – review and editing. CD: Methodology, Data curation, Supervision, Writing – review and editing, Investigation, Conceptualization, Visualization, Resources, Validation, Formal analysis, Writing – original draft, Project administration, Funding acquisition.
Funding
The author(s) declare that financial support was received for the research and/or publication of this article. This study was partly funded by VLAIO, Brussels, Belgium, grant number IWT155039.
Acknowledgments
The authors would like to thank Chevideco NV. Olivier Kemseke, Lauwe, Flemish Region, Belgium, for providing logistic support for the study.
Conflict of interest
Authors GH, BH, and JD were employed by Cargill Research and Development Centre Europe.
The remaining authors declare that the research was conducted in the absence of any commercial or financial relationships that could be construed as a potential conflict of interest.
Generative AI statement
The author(s) declare that no Generative AI was used in the creation of this manuscript.
Any alternative text (alt text) provided alongside figures in this article has been generated by Frontiers with the support of artificial intelligence and reasonable efforts have been made to ensure accuracy, including review by the authors wherever possible. If you identify any issues, please contact us.
Publisher’s note
All claims expressed in this article are solely those of the authors and do not necessarily represent those of their affiliated organizations, or those of the publisher, the editors and the reviewers. Any product that may be evaluated in this article, or claim that may be made by its manufacturer, is not guaranteed or endorsed by the publisher.
Supplementary material
The Supplementary Material for this article can be found online at: https://www.frontiersin.org/articles/10.3389/fphys.2025.1644738/full#supplementary-material
References
Al Jassim R. A. M., Scott P. T., Trebbin A. L., Trott D., Pollitt C. C. (2005). The genetic diversity of lactic acid producing bacteria in the equine gastrointestinal tract. FEMS Microbiol. Lett. 248, 75–81. doi:10.1016/j.femsle.2005.05.023
Al-Lahham S. H., Peppelenbosch M. P., Roelofsen H., Vonk R. J., Venema K. (2010). Biological effects of propionic acid in humans; metabolism, potential applications and underlying mechanisms. Biochim. Biophys. Acta Mol. Cell Biol. Lipids 1801, 1175–1183. doi:10.1016/j.bbalip.2010.07.007
Amrein T. M., Gränicher P., Arrigoni E., Amadò R. (2003). In vitro digestibility and colonic fermentability of aleurone isolated from wheat bran. LWT 36, 451–460. doi:10.1016/S0023-6438(03)00036-7
Andreasen M. F., Kroon P. A., Williamson G., Garcia-Conesa M. T. (2001). Esterase activity able to hydrolyze dietary antioxidant hydroxycinnamates is distributed along the intestine of mammals. J. Agric. Food Chem. 49, 5679–5684. doi:10.1021/jf010668c
Anson N. M., Selinheimo E., Havenaar R., Aura A. M., Mattila I., Lehtinen P., et al. (2009). Bioprocessing of wheat bran improves in vitro bioaccessibility and colonic metabolism of phenolic compounds. J. Agric. Food Chem. 57, 6148–6155. doi:10.1021/jf900492h
Aslam M. F., Ellis P. R., Berry S. E., Latunde-Dada G. O., Sharp P. A. (2018). Enhancing mineral bioavailability from cereals: current strategies and future perspectives. Nutr. Bull. 43, 184–188. doi:10.1111/nbu.12324
Bates D., Mächler M., Bolker B. M., Walker S. C. (2015). Fitting linear mixed-effects models using lme4. J. Stat. Softw. 67. doi:10.18637/jss.v067.i01
Bedford A., Gong J. (2018). Implications of butyrate and its derivatives for gut health and animal production. Anim. Nutr. 4, 151–159. doi:10.1016/j.aninu.2017.08.010
Biddle A. S., Black S. J., Blanchard J. L. (2013). An in vitro model of the horse gut microbiome enables identification of lactate-utilizing bacteria that differentially respond to starch induction. PLoS One 8, e77599. doi:10.1371/journal.pone.0077599
Bohm A., Buri R. (2004). Composition comprising aleurone, method of administering the same, and method of manufacturing the same.
Bosch G., Heesen L., De Melo Santos K., Pellikaan W. F., Cone J. W., Hendriks W. H. (2017). Evaluation of an in vitro fibre fermentation method using feline faecal inocula: repeatability and reproducibility. J. Nutr. Sci. 6, e25. doi:10.1017/jns.2017.22
Boshuizen B., Moreno de Vega C. V., De Maré L., de Meeûs C., de Oliveira J. E., Hosotani G., et al. (2021). Effects of aleurone supplementation on glucose-insulin metabolism and gut microbiome in untrained healthy horses. Front. Vet. Sci. 8, 642809. doi:10.3389/fvets.2021.642809
Boshuizen B., De Maré L., Oosterlinck M., Van Immerseel F., Eeckhaut V., De Meeus C., et al. (2025). Aleurone supplementation enhances the metabolic benefits of training in standardbred mares: impacts on glucose-insulin dynamics and gut microbiome composition. Front. Physiol. 16, 1565005. doi:10.3389/fphys.2025.1565005
Brandi R., Furtado C. (2009). Importância nutricional e metabólica da fibra na dieta de equinos. Rev. Bras. Zootec. 38, 246–258. doi:10.1590/s1516-35982009001300025
Bresciani L., Scazzina F., Leonardi R., Dall’Aglio E., Newell M., Dall’Asta M., et al. (2016). Bioavailability and metabolism of phenolic compounds from wholegrain wheat and aleurone-rich wheat bread. Mol. Nutr. Food Res. 60, 2343–2354. doi:10.1002/mnfr.201600238
Brouns F., Adam-Perrot A., Atwell B., Reding W. V. (2010). Nutritional and technological aspects of wheat aleurone fibre: implications for use in food. Diet. Fibre New Front. Food Health, 395–413. doi:10.3920/978-90-8686-692-2_028
Brouns F., Hemery Y., Price R., Anson N. M. (2012). Wheat aleurone: separation, composition, health aspects, and potential food use. Crit. Rev. Food Sci. Nutr. 52, 553–568. doi:10.1080/10408398.2011.589540
Calani L., Ounnas F., Salen P., Demeilliers C., Bresciani L., Scazzina F., et al. (2014). Bioavailability and metabolism of hydroxycinnamates in rats fed with durum wheat aleurone fractions. Food Funct. 5, 1738–1746. doi:10.1039/c4fo00328d
Cheng B.-Q., Trimble R. P., Illman R. J., Stone B. A., Topping D. L. (1987). Comparative effects of dietary wheat bran and its morphological components (aleurone and pericarp-seed coat) on volatile fatty acid concentrations in the rat. Br. J. Nutr. 57, 69–76. doi:10.1079/bjn19870010
Dambrova M., Makrecka-Kuka M., Kuka J., Vilskersts R., Nordberg D., Attwood M. M., et al. (2022). Acylcarnitines: nomenclature, biomarkers, therapeutic potential, drug targets, and clinical trials. Pharmacol. Rev. 74, 506–551. doi:10.1124/pharmrev.121.000408
Deng J., Cheng C., Yu H., Huang S., Hao X., Chen J., et al. (2021). Inclusion of wheat aleurone in gestation diets improves postprandial satiety, stress status and stillbirth rate of sows. Anim. Nutr. 7, 412–420. doi:10.1016/j.aninu.2020.06.015
Dicks L. M. T., Botha M., Dicks E., Botes M. (2014). The equine gastro-intestinal tract: an overview of the microbiota, disease and treatment. Livest. Sci. 160, 69–81. doi:10.1016/j.livsci.2013.11.025
Dougal K., de la Fuente G., Harris P. A., Girdwood S. E., Pinloche E., Newbold C. J. (2013). Identification of a core bacterial community within the large intestine of the horse. PLoS One 8, e77660. doi:10.1371/journal.pone.0077660
Dupont D., Alric M., Blanquet-Diot S., Bornhorst G., Cueva C., Deglaire A., et al. (2019). Can dynamic in vitro digestion systems mimic the physiological reality? Crit. Rev. Food Sci. Nutr. 59, 1546–1562. doi:10.1080/10408398.2017.1421900
Fardet A. (2010). New hypotheses for the health-protective mechanisms of whole-grain cereals: what is beyond fibre? Nutr. Res. Rev. 23, 65–134. doi:10.1017/S0954422410000041
Fitzgerald D. M., Spence R. J., Stewart Z. K., Prentis P. J., Sillence M. N., De Laat M. A. (2020). The effect of diet change and insulin dysregulation on the faecal microbiome of ponies. J. Exp. Biol. 223, jeb219154. doi:10.1242/jeb.219154
Freeland K. R., Wilson C., Wolever T. M. S. (2010). Adaptation of colonic fermentation and glucagon-like peptide-1 secretion with increased wheat fibre intake for 1 year in hyperinsulinaemic human subjects. Br. J. Nutr. 103, 82–90. doi:10.1017/S0007114509991462
Fujimori S. (2021). Humans have intestinal bacteria that degrade the plant cell walls in herbivores. World J. Gastroenterol. 27, 7784–7791. doi:10.3748/wjg.v27.i45.7784
Gao Z., Yin J., Zhang J., Ward R. E., Martin R. J., Lefevre M., et al. (2009). Butyrate improves insulin sensitivity and increases energy expenditure in mice. Diabetes 58, 1509–1517. doi:10.2337/db08-1637
Glinsky M. J., Smith R. M., Spires H. R., Davis C. L. (1976). Measurement of volatile fatty acid production rates in the cecum of the pony. J. Anim. Sci. 42, 1465–1470. doi:10.2527/jas1976.4261465x
Goering H. K., Van Soest P. J. (1970). Forage fiber analyses (apparatus, reagents, procedures and some applications).
Górniak W., Cholewińska P., Szeligowska N., Wołoszyńska M., Soroko M., Czyż K. (2021). Effect of intense exercise on the level of bacteroidetes and Firmicutes phyla in the digestive system of thoroughbred racehorses. Animals 11, 290–299. doi:10.3390/ANI11020290
Guerra A., Etienne-Mesmin L., Livrelli V., Denis S., Blanquet-Diot S., Alric M. (2012). Relevance and challenges in modeling human gastric and small intestinal digestion. Trends Biotechnol. 30, 591–600. doi:10.1016/j.tibtech.2012.08.001
Hemery Y. M., Anson N. M., Havenaar R., Haenen G. R. M. M., Noort M. W. J., Rouau X. (2010). Dry-fractionation of wheat bran increases the bioaccessibility of phenolic acids in breads made from processed bran fractions. Food Res. Int. 43, 1429–1438. doi:10.1016/j.foodres.2010.04.013
Holmes E., Li J. V., Marchesi J. R., Nicholson J. K. (2012). Gut microbiota composition and activity in relation to host metabolic phenotype and disease risk. Cell Metab. 16, 559–564. doi:10.1016/j.cmet.2012.10.007
Hughes S. A., Shewry P. R., Li L., Gibson G. R., Sanz M. L., Rastall R. A. (2007). In vitro fermentation by human fecal microflora of wheat arabinoxylans. J. Agric. Food Chem. 55, 4589–4595. doi:10.1021/jf070293g
Ingerslev A. K., Mutt S. J., Lærke H. N., Hedemann M. S., Theil P. K., Nielsen K. L., et al. (2017). Postprandial PYY increase by resistant starch supplementation is independent of net portal appearance of short-chain fatty acids in pigs. PLoS One 12, e0185927. doi:10.1371/journal.pone.0185927
Jeong D., Han J. A., Liu Q., Chung H. J. (2019). Effect of processing, storage, and modification on in vitro starch digestion characteristics of food legumes: a review. Food Hydrocoll. 90, 367–376. doi:10.1016/j.foodhyd.2018.12.039
Keaveney E. M., Price R. K., Hamill L. L., Wallace J. M. W., McNulty H., Ward M., et al. (2015). Postprandial plasma betaine and other methyl donor-related responses after consumption of minimally processed wheat bran or wheat aleurone, or wheat aleurone incorporated into bread. Br. J. Nutr. 113, 445–453. doi:10.1017/S0007114514003778
Le Gall M., Serena A., Jørgensen H., Theil P. K., Bach Knudsen K. E. (2009). The role of whole-wheat grain and wheat and rye ingredients on the digestion and fermentation processes in the gut a model experiment with pigs. Br. J. Nutr. 102, 1590–1600. doi:10.1017/S0007114509990924
Lebert L., Buche F., Sorin A., Aussenac T. (2022). The wheat aleurone layer: optimisation of its benefits and application to bakery products. Foods 11, 3552. doi:10.3390/foods11223552
Lefebvre D. E., Venema K., Gombau L., Valerio L. G., Raju J., Bondy G. S., et al. (2015). Utility of models of the gastrointestinal tract for assessment of the digestion and absorption of engineered nanomaterials released from food matrices. Nanotoxicology 9, 523–542. doi:10.3109/17435390.2014.948091
Leng J., Walton G., Swann J., Darby A., Ragione R. L., Proudmana C. (2020). “bowel on the bench”: proof of concept of a three-stage, in vitro fermentation model of the equine large intestine. Appl. Environ. Microbiol. 86, e02093-19. doi:10.1128/AEM.02093-19
Liu W., Ye A., Han F., Han J. (2019). Advances and challenges in liposome digestion: surface interaction, biological fate, and GIT modeling. Adv. Colloid Interface Sci. 263, 52–67. doi:10.1016/j.cis.2018.11.007
Lloyd-Price J., Arze C., Ananthakrishnan A. N., Schirmer M., Avila-Pacheco J., Poon T. W., et al. (2019). Multi-omics of the gut microbial ecosystem in inflammatory bowel diseases. Nature 569, 655–662. doi:10.1038/s41586-019-1237-9
Louis P., Duncan S. H., Sheridan P. O., Walker A. W., Flint H. J. (2022). Microbial lactate utilisation and the stability of the gut microbiome. Gut Microbiome 3, e3. doi:10.1017/gmb.2022.3
Mach N., Moroldo M., Rau A., Lecardonnel J., Le Moyec L., Robert C., et al. (2021). Understanding the holobiont: crosstalk between gut microbiota and mitochondria during long exercise in horse. Front. Mol. Biosci. 8, 656204. doi:10.3389/fmolb.2021.656204
Mackie R. I., Wilkins C. A. (1988). Enumeration of anaerobic bacterial microflora of the equine gastrointestinal tract. Appl. Environ. Microbiol. 54, 2155–2160. doi:10.1128/aem.54.9.2155-2160.1988
Mcclements D. J., Decker E. A., Park Y., Weiss J. (2009). Structural design principles for delivery of bioactive components in nutraceuticals and functional foods. Crit. Rev. Food Sci. Nutr. 49, 577–606. doi:10.1080/10408390902841529
Miyaji M., Ueda K., Kobayashi Y., Hata H., Kondo S. (2008). Fiber digestion in various segments of the hindgut of horses fed grass hay or silage. Animal Sci. J. 79, 339–346. doi:10.1111/j.1740-0929.2008.00535.x
Neyrinck A. M., De Backer F., Cani P. D., Bindels L. B., Stroobants A., Portetelle D., et al. (2008). Immunomodulatory properties of two wheat bran fractions - aleurone-enriched and crude fractions - in Obese mice fed a high fat diet. Int. Immunopharmacol. 8, 1423–1432. doi:10.1016/j.intimp.2008.05.015
Nørskov N. P., Hedemann M. S., Theil P. K., Fomsgaard I. S., Laursen B. B., Knudsen K. E. B. (2013). Phenolic acids from wheat show different absorption profiles in plasma: a model experiment with catheterized pigs. J. Agric. Food Chem. 61, 8842–8850. doi:10.1021/jf4002044
Orlando G., García-Arrarás J. E., Soker T., Booth C., Sanders B., Ross C. L., et al. (2012). Regeneration and bioengineering of the gastrointestinal tract: current status and future perspectives. Dig. Liver Dis. 44, 714–720. doi:10.1016/J.DLD.2012.04.005
Pekkinen J., Rosa N. N., Savolainen O.-I., Keski-Rahkonen P., Mykkänen H., Poutanen K., et al. (2014). Disintegration of wheat aleurone structure has an impact on the bioavailability of phenolic compounds and other phytochemicals as evidenced by altered urinary metabolite profile of diet-induced obese mice. Nutr. Metab. (Lond) 11, 1. doi:10.1186/1743-7075-11-1
Proudman C. J., Hunter J. O., Darby A. C., Escalona E. E., Batty C., Turner C. (2015). Characterisation of the faecal metabolome and microbiome of thoroughbred racehorses. Equine Vet. J. 47, 580–586. doi:10.1111/evj.12324
Quemeneur K., Labussiere E., Le Gall M., Lechevestrier Y., Montagne L. (2019). Feeding behaviour and pre-prandial status affect post-prandial plasma energy metabolites and insulin kinetics in growing pigs fed diets differing in fibre concentration. Br. J. Nutr. 121, 625–636. doi:10.1017/S0007114518003768
Quemeneur K., Montagne L., Le Gall M., Lechevestrier Y., Labussiere E. (2020). Relation between feeding behaviour and energy metabolism in pigs fed diets enriched in dietary fibre and wheat aleurone. Animal 14, 508–519. doi:10.1017/S1751731119002246
Reed K. J., Kunz I. G. Z., Scare J. A., Nielsen M. K., Turk P. J., Coleman R. J., et al. (2021). The pelvic flexure separates distinct microbial communities in the equine hindgut. Sci. Rep. 11, 4332. doi:10.1038/s41598-021-83783-z
Rosa N. N., Pekkinen J., Zavala K., Fouret G., Korkmaz A., Feillet-Coudray C., et al. (2014). Impact of wheat aleurone structure on metabolic disorders caused by a high-fat diet in mice. J. Agric. Food Chem. 62, 10101–10109. doi:10.1021/jf503314a
Roye C., Henrion M., Chanvrier H., de Roeck K., de Bondt Y., Liberloo I., et al. (2020). Extrusion-cooking modifies physicochemical and nutrition-related properties of wheat bran. Foods 9, 738. doi:10.3390/foods9060738
Schoster A., Arroyo L. G., Staempfli H. R., Weese J. S. (2013). Comparison of microbial populations in the small intestine, large intestine and feces of healthy horses using terminal restriction fragment length polymorphism. BMC Res. Notes 6, 91. doi:10.1186/1756-0500-6-91
Sensoy I. (2021). A review on the food digestion in the digestive tract and the used in vitro models. Curr. Res. Food Sci. 4, 308–319. doi:10.1016/j.crfs.2021.04.004
Sneddon J. C., Boomker E., Howard C. V. (2006). Mucosal surface area and fermentation activity in the hind gut of hydrated and chronically dehydrated working donkeys. J. Anim. Sci. 84, 119–124. doi:10.2527/2006.841119x
Sun Y., Zhang J., Zhang H., Hou H. (2023). Effects of long-term intake of whole wheat and aleurone-enriched Chinese steamed bread on gut microbiome and liver metabolome in mice fed high-fat diet. J. Cereal Sci. 109, 103614. doi:10.1016/j.jcs.2022.103614
Team R. C. (2020). RA language and environment for statistical computing. Computing. Available online at: https://cran.r-project.org/doc/manuals/r-release/fullrefman.pdf (Accessed June 6, 2025).
Theil P. K., Joørgensen H., Serena A., Hendrickson J., Bach Knudsen K. E. (2011). Products deriving from microbial fermentation are linked to insulinaemic response in pigs fed breads prepared from whole-wheat grain and wheat and rye ingredients. Br. J. Nutr. 105, 373–383. doi:10.1017/S0007114510003715
Wilmanski T., Diener C., Rappaport N., Patwardhan S., Wiedrick J., Lapidus J., et al. (2021). Gut microbiome pattern reflects healthy ageing and predicts survival in humans. Nat. Metab. 3, 274–286. doi:10.1038/s42255-021-00348-0
Zhao Z., Egashira Y., Sanada H. (2003). Digestion and absorption of ferulic acid sugar esters in rat gastrointestinal tract. J. Agric. Food Chem. 51, 5534–5539. doi:10.1021/jf034455u
Zhuang Y., Gao D., Jiang W., Xu Y., Liu G., Hou G., et al. (2025). Core microbe bifidobacterium in the hindgut of calves improves the growth phenotype of young hosts by regulating microbial functions and host metabolism. Microbiome 13, 13. doi:10.1186/s40168-024-02010-9
Keywords: aleurone, equine gastrointestinal tract, metabolism, metabolomics, hindgut microbiota, functional feed, time-resolved metabolite profiling, artificial intelligence modeling
Citation: Boshuizen B, Willems M, De Maré L, Hosotani G, De Oliveira JE, Horemans B, Vidal Moreno De Vega C, Verdegaal E-LJMM and Delesalle C (2025) From wheat bran to equine gut: the in vitro fermentation dynamics of aleurone. Front. Physiol. 16:1644738. doi: 10.3389/fphys.2025.1644738
Received: 10 June 2025; Accepted: 01 October 2025;
Published: 11 November 2025.
Edited by:
Philippa Kate Morrison, Scotland’s Rural College, United KingdomReviewed by:
Chamia C. Chatman, Biocompatibility & Toxicology, United StatesJulia Ferreira, Universidade de Sao Paulo Programa de Reproducao Animal, Brazil
Copyright © 2025 Boshuizen, Willems, De Maré, Hosotani, De Oliveira, Horemans, Vidal Moreno De Vega, Verdegaal and Delesalle. This is an open-access article distributed under the terms of the Creative Commons Attribution License (CC BY). The use, distribution or reproduction in other forums is permitted, provided the original author(s) and the copyright owner(s) are credited and that the original publication in this journal is cited, in accordance with accepted academic practice. No use, distribution or reproduction is permitted which does not comply with these terms.
*Correspondence: Berit Boshuizen, YmVyaXQuYm9zaHVpemVuQHVnZW50LmJl
†These authors have contributed equally to this work and share first authorship