 Ewelina Bogdańska-Chomczyk
 Maciej Równiak2†
 Andrew Chih-Wei Huang
 Anna Kozłowska
- 1Department of Human Physiology and Pathophysiology, School of Medicine, University of Warmia and Mazury, Olsztyn, Poland
- 2Department of Animal Anatomy and Physiology, Faculty of Biology and Biotechnology, University of Warmia and Mazury, Olsztyn, Poland
- 3Department of Psychology, Fo Guang University, Yilan County, Taiwan
Background: Attention deficit hyperactivity disorder (ADHD) is characterized by impairments in developmental–behavioral inhibition, resulting in impulsivity and hyperactivity. Recent research has underscored cortical inhibition deficiencies in ADHD via the gamma-aminobutyric acid (GABA)ergic system, which is crucial for maintaining excitatory–inhibitory balance in the brain. This study explored postnatal changes in parvalbumin (PV) immunoreactivity, indicating GABAergic interneuron types, in the prefrontal (PFC) and motor (MC) cortices of spontaneously hypertensive rats (SHRs), an ADHD animal model.
Methods: Examining PV- positive (PV+) cells associated with dopamine D2 receptors (D2) and the impact of dopamine on GABA synthesis, we also investigated changes in the immunoreactivity of D2 and tyrosine hydroxylase (TH). Brain sections from 4- to 10-week-old SHRs and Wistar Kyoto rats (WKYs) were immunohistochemically analyzed, comparing PV+, D2+ cells, and TH+ fiber densities across age-matched SHRs and WKYs in specific PFC/MC regions.
Results: The results revealed significantly reduced PV+ cell density in SHRs: prelimbic (~20% less), anterior cingulate (~15% less), primary (~15% less), and secondary motor (~17% less) cortices. PV+ deficits coincided with the upregulation of D2 in prepubertal SHRs and the downregulation of TH predominantly in pubertal/postpubertal SHRs.
Conclusion: Reduced PV+ cells in various PFC regions could contribute to inattention/behavioral alterations in ADHD, while MC deficits could manifest as motor hyperactivity. D2 upregulation and TH deficits may impact GABA synthesis, exacerbating behavioral deficits in ADHD. These findings not only shed new light on ADHD pathophysiology but also pave the way for future research endeavors.
1 Introduction
Attention deficit hyperactivity disorder (ADHD) is a complex neurodevelopmental condition affecting the central nervous system characterized by persistent inattention, hyperactivity, and impulsivity throughout an individual’s life span (1, 2). It is believed to be a childhood disorder; but long-term follow-up studies revealed that symptoms often persist into adulthood (3, 4). The precise etiology and pathogenesis of ADHD remain elusive, with increasing evidence implicating stress, anxiety, and neuroinflammation in the emergence of this disorder (5, 6). For example, increased inflammation could lead to changes in the synthesis, release, or clearance of a number of neurotransmitters (7–9). The etiology of the disorder involves the dysregulation of various neurotransmitters, including dopamine (DA), norepinephrine (NA), and serotonin (5-HT).
ADHD is intricately linked to dysregulation in DA neurotransmission, a key factor influencing attention, reward, and motivation within neural circuits spanning the prefrontal cortex (PFC) and subcortical structures such as the basal ganglia (10–12). Dysfunctions in the DA receptors D1 and D2, anomalies in dopamine transporters, and perturbations in DA release and synthesis underscore the molecular intricacies contributing to ADHD symptoms (13). In addition, the interplay between the inhibitory gamma-aminobutyric acid (GABA)ergic system and dopaminergic signaling pathways is crucial for regulating the cognitive and motor functions in the brain, both of which are impaired in ADHD (14, 15). GABAergic neurons, utilizing GABA as their principal neurotransmitter, exert inhibitory control on neural circuits, preventing excessive excitability and contributing to the balance of neuronal activity. Dopaminergic signaling, driven by DA, modulates various physiological functions, including cognition and motor control (15). The intricate reciprocal modulation between the GABAergic inhibitory neurons and dopaminergic pathways occurs in cortical and subcortical regions, creating a dynamic regulatory network (16, 17).
Dysregulation in this interplay has been implicated in neurological and psychiatric disorders, including ADHD (18–20). There is a suggestion, supported by recent findings, that a deficit in behavioral inhibition may be at the core of ADHD (21–23). For instance, evidence indicates a reduction in the concentration of the principal inhibitory neurotransmitter GABA in certain studied cortical (22, 24) and subcortical (23) brain regions of children with ADHD. Reduced GABA content has also been reported in the hippocampus of the animal model of ADHD, spontaneously hypertensive rats (SHRs) (25). Studies in animal models are pivotal in translational research, offering insights into the biological and physiological processes pertinent to human health and the comprehension of numerous disorders (26). Moreover, recent studies in female ADHD patients have indicated that low GABA concentrations in the PFC were strongly associated with high inattention scores (24). In addition, diminished short-interval cortical inhibition (SICI), influenced by GABA-A agonists, is correlated with the severity of ADHD symptoms and motor skills (27). Although the cellular components involved in this phenomenon are still unclear, parvalbumin (PV)-expressing (PV+) cells appear to be quite good candidates as they use GABA (28) and have an abundant amount of GABA-A receptors (29).
The behavioral inhibition mediated by GABAergic interneurons in the cortex is modulated by DA, as evidenced by the influence of dopaminergic innervation on GABAergic neurons (30–34) and the abundant localizations of DA receptors in these cells (33). Moreover, current evidence shows that DA inhibits both spontaneous and evoked neural activity in the PFC, and there is good evidence that this inhibition is mediated by GABAergic neurons (34–36). Notably, these interneurons, which receive the heaviest dopaminergic innervation and possess the most abundant DA receptors, are PV+ cells that exert potent inhibitory actions on pyramidal cells (35). Given the capability of a single GABAergic interneuron to synapse on hundreds of pyramidal cells, the activation of a limited number of these interneurons by DA is sufficient to induce strong local cortical inhibition (37, 38). However, in ADHD, the downregulation of tyrosine hydroxylase (TH), a rate-limiting enzyme in DA synthesis, has been observed in patients and in animal models, potentially impacting GABA neurotransmission and exacerbating deficits in behavioral inhibition (39). GABAergic cells, including PV+ cells, express both D1 (activating) and D2 (deactivating) DA receptors. Dysregulation of these receptors could lead to severe alterations in GABA synthesis and contribute to abnormalities in behavioral inhibition in individuals with ADHD (33).
In light of these findings, our hypothesis posits that ADHD-affected individuals demonstrate a) diminished GABA activity attributable to deficits in PV+ neurons in cortical regions and b) perturbations in DA activity due to a diminished density of TH+ fibers and DA receptor (D2)+ cells. To test this hypothesis, the densities of interneurons expressing PV (GABAergic), cells endowed with D2, and fibers expressing TH were compared in the PFC and motor cortex (MC) of SHRs, considered to be a validated animal model of ADHD, and Wistar Kyoto rats (WKYs), which served as the control strain (40). The PFC was chosen for investigation due to reported abnormalities in patients with ADHD, including morphological and circuit irregularities and weaker activation during attention and behavior regulation (41, 42). Moreover, lesions of the PFC produce symptoms that are quite similar to those observed in patients with ADHD (12). The MC was selected because either ADHD patients or SHRs display increased motor activity (43). PV was proposed as a marker of GABAergic interneurons as, in rats, PV+ cells comprise numerous populations of GABAergic interneurons in the mammalian cerebral cortex (44–46). It was estimated that PV+ interneurons make up roughly 40% of the total GABAergic interneuron population in the rat cerebral cortex (47–49). Finally, recent studies have indicated that PV+ neurons function as a cohesive unit, orchestrating activity within the local PFC circuit during goal-driven attentional processing (50). D2 was chosen based on evidence indicating its abundant expression on cortical PV+ neurons (33), suggesting its potential role in mediating hyperactivity in ADHD (51). TH was considered due to its role as a rate-limiting enzyme in DA synthesis and its downregulation in the PFC of SHRs (39) and in patients with ADHD (41). The study employed rats aged 4–10 weeks to cover the growth stages from weaning to adulthood, aligning with the manifestation of ADHD-related abnormalities in children and in prepubertal SHRs (52). Investigating both hemispheres separately addressed the observed hemisphere-specific abnormalities (53, 54). Due to the evident male bias in patients with ADHD and in SHRs, the study focused its investigation on males of this strain (55, 56).
2 Materials and methods
2.1 Subjects
In order to test the previously mentioned hypotheses, male SHRs (ADHD group) and WKYs (control group) at 4, 5, 6, 7, 8, 9, and 10 weeks of age were used as subjects in the present investigation (n = 5 or 6 per group). Animals from both groups at 21 days of life were purchased from Charles River (Germany) and conveyed to the animal facilities at the Institute of Animal Reproduction and Food Research of the Polish Academy of Sciences (Olsztyn, Poland). In this study, the animals were housed in sanitized polypropylene cages in pairs or in threes to avoid social isolation stress. The rats were maintained in climate-controlled rooms (21 ± 1°C, 12–20 exchanges/h) with diurnal lighting (12/12-h light/dark cycle: lights on at 8:00 hours, lights off at 18:00 hours). All rats had free access to their diet (VRF1 diet; Charles River, Germany) and tap water. All animal housing and handling were conducted in strict accordance with the European Union Directive (2010/63/EU). The use of animals and all protocols were approved by the Local Ethical Commission of the University of Warmia and Mazury in Olsztyn (no. 43/2014). Furthermore, all attempts were made to reduce animal suffering and decrease the number of animals to the minimum needed to yield accurate data. The rat strains used in this study have been carefully selected. The SHRs from Charles River (Germany) were chosen as behavioral, genetic, and neurobiological studies have indicated that these rats are at present the most appropriate model of ADHD (40). WKYs are the classical control for rat ADHD models (especially SHRs). In addition, the same rat strains have been evaluated by us (57) using the various behavioral tests that confirmed the symptoms of ADHD in SHRs. We have previously reported that exposure of SHRs to an open-field arena results in an increase in motor activity and a drop in the anxiety behavior of these animals. Thus, these rat strains were chosen for investigation in the present study. Moreover, the time points of the rat’s life span were deliberately selected. The decision to select animals at 4 weeks for investigation was based on the fact that prepubertal SHRs exhibit ADHD abnormalities and symptoms (58) while being free of hypertension (59). On the other hand, postpubertal and mature SHRs no longer display symptoms of ADHD (58), but develop hypertension (59).
2.2 Tissue preparation
After the habituation phase, all SHRs and WKYs were randomly allocated into seven age groups in accordance with the study plan, with all animals from each group later given the same tissue processing. Briefly, the rats were acutely anesthetized with an intraperitoneal inoculation of Morbital (Biowet, Puławy, Poland; 2 ml/kg, 133.3 mg/ml of pentobarbital sodium salt and 26.7 mg/ml of pentobarbital). Following cessation of breathing, animals were immediately perfused transcardially with saline (0.9%) followed by 4% paraformaldehyde (PFA; pH 7.4 (1040051000; Merck, Darmstadt, Germany), which was dissolved in phosphate-buffered saline (PBS) (P5493; Sigma-Aldrich, Schnelldorf, Germany). After perfusion, the whole brain was conscientiously removed from the skull. In the next step, brains were post-fixed by immersion in 4% PFA for 24 h and then rinsed three times in 0.1 M phosphate buffer (pH 7.4, 4°C). Thereafter, all brains were cryoprotected in series (10%, 20%, and 30%) with sucrose (363-117720907; Alchem, Wrocław, Poland) in 1× PBS at 4°C until they sunk (3–5 days). Conclusively, the brains were frozen as blocks and were then coronally cut at a thickness of 10 μm using a cryostat (HM525; Zeiss, Jena, Germany). The tissue sections were placed on glass slides and stored at −80°C until further investigation.
2.3 Immunohistochemistry
Chosen brain sections comprising the PFC and MC from both strains (SHRs and WKYs) were stained using two standard immunohistochemical methods: immunoperoxidase reaction targeted a neuron-specific nuclear protein (NeuN) and immunofluorescence focused on PV, D2, and TH. Both staining methods were performed in a special humid and dark chamber (Immuno Slide Staining Trays, R64001-E; Pyramid Innovation Ltd., Polegate, UK) at room temperature.
2.3.1 DAB method
To define the location and borders of the various PFC and MC regions in the brain, every 25th brain section was bound to diaminobenzidine (DAB) labeling (Dako Liquid DAB + Substrate Chromogen System, K3468, Glostrup, Denmark), which was accurate in more detail in our previous studies (60, 61). Concisely, the slides with the selected brain sections were covered overnight with a solution of primary antibody: NeuN (anti-NeuN antibody, clone A60, MAB377, 1:1000 dilution; Merck Millipore, Warsaw, Poland). Subsequently, the sections were covered for 1 h with a solution of secondary antibodies (ImmPRESS™ Universal Reagent anti-mouse/rabbit IgG peroxidase, MP-7500, 1:1 dilution; Vector Laboratories Inc., Burlingame, CA, USA). Then, all brain sections were rinsed in PBS and covered for 1 min with a DAB substrate and chromogen mixture. Finally, labeled brain sections were washed in tap water, dehydrated in a series of alcohols (POCH, Gliwice, Poland), cleaned in xylene, and covered in DPX (DPX Mountant for histology, 44581; Sigma-Aldrich, Schnelldorf, Germany).
2.3.2 Immunofluorescence
For neurochemical analysis, slides containing the selected brain sections composed of the PFC and MC were treated for the standard single immunofluorescence staining described earlier by Kozłowska et al. (61) These brain sections were covered overnight with a solution of primary antibodies: PV (mouse, cat. no. 235, 1:4000 dilution; Swant, Burgdorf, Switzerland), D2 (rabbit, cat. no. AB5084P, 1:1000 dilution; EMD Millipore, Billerica, MA, USA), or TH (mouse, cat. no. MAB 318, 1:1000 dilution; EMD Millipore, Billerica, MA, USA). Subsequently, they were washed in PBS (3 × 15 min) and then covered for 1 h with a solution of secondary antibodies: Alexa 488 (cat. no. A-21202, 1:1000 dilution; Thermo Fisher Scientific, Waltham, MA, USA) or Alexa 568 (cat. no. A-11011, 1:1000 dilution; Thermo Fisher Scientific, Waltham, MA, USA). Finally, all brain sections were covered with a fluorescent mounting medium (cat. no. S3023; Agilent, Glostrup, Denmark). Furthermore, to evaluate the relationship between PV+ neurons and cells enriched in D2, additional sections of the subject were processed for double immunofluorescence staining as described earlier by Równiak et al. (29). In this case, the sections were covered with a mixture of primary antibodies consisting of mouse antisera against PV and rabbit antisera toward D2, the same antibodies used in the single immunofluorescence experiment.
2.4 Controls
NeuN, stained using immunoperoxidase techniques, is a sensitive and specific neuronal marker for neurons in the peripheral and central nervous systems (62). The specificity of a mouse antibody against PV (235) and rabbit antibody against D2 (AB5084P) has also been proven by various researchers in multiple previous studies (63–66). Moreover, these antibodies have been positively evaluated using Western blotting, immunohistochemistry in knockout mouse brain sections, and immunoprecipitation, justifying their specificity to their targets (63, 64, 66). The mouse antibody toward TH (MAB 318) is commonly used in brain studies on dopaminergic neurotransmission (67, 68). The specificity of secondary antibodies was examined by the omission of the primary antibody and its replacement by nonimmune sera or PBS. The absence of any response designated their specificity.
2.5 Cell and fiber counting
To validate the aforementioned hypotheses, a single immunofluorescence staining method was employed. This widely utilized technique in molecular and cell biology laboratories is a robust and straightforward approach for accurately localizing molecules within a diverse array of fixed cells or tissues. Quantification of the density of neurons and/or immunoreactive fibers for PV, D2, and TH in the selected regions of PFC and MC was carried out using an Olympus BX61 microscope provided with the cellSens Dimension image analysis software (Olympus, Tokyo, Japan). The following PFC regions were analyzed: prelimbic (PRL), anterior cingulate (CG1), lateral orbitofrontal (LO), and ventral orbitofrontal (VO). Within the MC, the primary (M1) and secondary (M2) motor cortices were studied. For each PFC/MC area in each animal for both SHRs and WKYs, PV+ and/or D2+ cells and TH-positive fibers were manually counted on 10 evenly distributed sections. To confirm the localization of specific PFC/MC regions on the sections, they were stained with mouse anti-NeuN (pan-neuronal marker). All measurements on the individual section were made at ×40 magnification using 220 µm × 170 µm areas as the test frames. Based on the cross-section size of the specific PFC/MC area, scores were calculated from either one such field located in the middle of the area (covering 100% of its cross-sectional area) or two to six bordering on non-overlapping fields. All scores determined inside the test frames in the individual PFC/MC area on the section were averaged. As such, the mean density value was mentioned only for the region of the test frame and was recalculated every time to present the density of the neurons in 1 mm3 of the brain tissue. To determine the mean density of the neurons in the entire single PFC/MC area in the rat, the means of the individual sections were averaged. Eventually, the density values from every PFC/MC area were averaged for every age range in both SHRs and WKYs and shown as the mean ± standard deviation (SD). It should be underlined that all calculations were made on coded slides prepared by the first author. To abstain from fluorescence fading, every test frame was digitally recorded before estimation. Digitalized test frames were then assessed by two independent researchers who had no knowledge of the parameters of the tissue under study (i.e., strain, age, and PFC/MC region, among others). The scores of these calculations presented high inter-rater reliability using Pearson’s correlation test (r = 0.79, p < 0.05). It should be acknowledged here that the data for PRL and CG1 in the 5- and 10-week-old WKYs and SHRs shown in the current study were from our previously published paper (61). They were included here only to complete the pattern of postnatal development on the graphs.
2.6 Statistical analysis
Mean differences between multiple groups were comprehensively assessed through one-way ANOVA using GraphPad Prism 6 software (GraphPad Software, La Jolla, CA, USA). Following this, Tukey’s post-hoc test was conducted. The ability of Tukey’s test to adjust for multiple comparisons enhanced the reliability and interpretability of our findings. In addition, the potential presence of non-normally distributed data or situations where the assumptions of ANOVA may not be fully met was recognized, leading to the incorporation of the Mann–Whitney U test. This nonparametric test allowed confirmation or exclusion of observed differences between pairs. A p < 0.05 was assumed to indicate that the difference is statistically significant.
2.7 Photomicrographic production
Low-magnification photomicrographs of immunoperoxidase-stained sections were obtained by digitizing these sections with ×5 magnification using a PathScan Enabler IV Histology Slide Scanner (Prague, Czech Republic). High-magnification photomicrographs of the immunofluorescence-stained sections were taken using a CC-12 digital camera (Soft Imaging System, Münster, Germany) on an Olympus BX61 microscope.
3 Results
Anatomically, the rat PFC includes two main regions—the medial PFC (mPFC) with the PRL and CG1 and the ventrally located orbitofrontal PFC (oPFC) with the LO and VO—which were chosen for investigation in the present study (Figures 1A, B). In between these regions and dorsally lies the MC, consisting of M1 and M2, which were taken into consideration (Figures 1A, B). In all of these regions, the densities of neurons immunoreactive to PV and/or D2 and fibers expressing TH were evaluated and compared in WKYs and SHRs (Figures 2–13). In addition, as part of preliminary research in these regions, the relationship between PV and D2 was also elucidated (Figure 14).
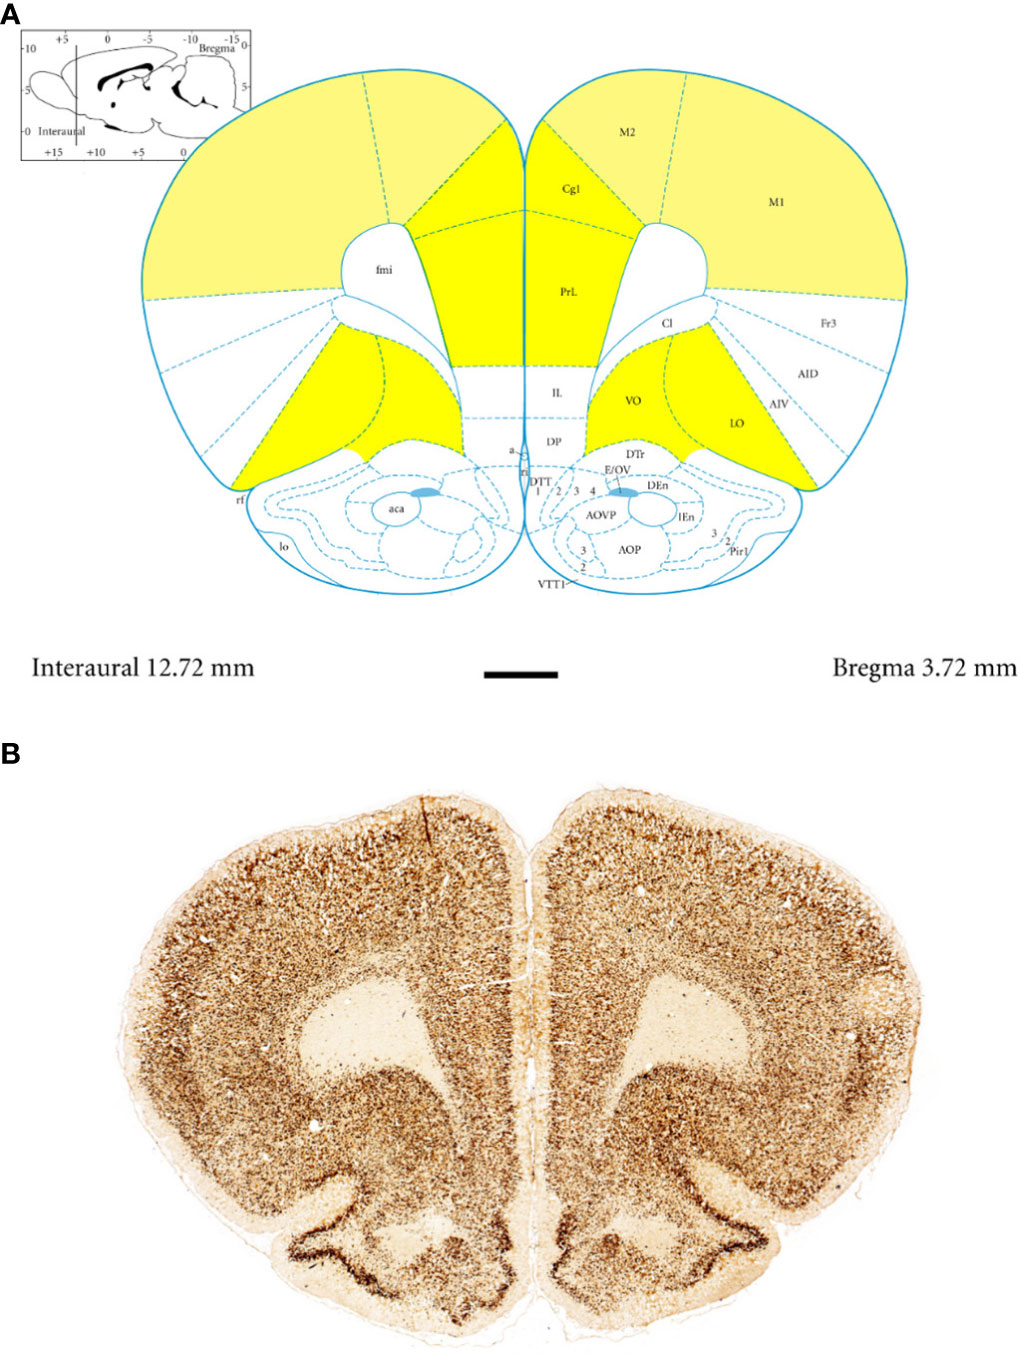
Figure 1 Topography and subdivisions of the prefrontal cortex (PFC, highlighted in yellow) and the motor cortex (MC, light yellow). (A) Schematic drawing from the rat brain atlas of Paxinos and Watson (69) illustrating the subdivisions of the PFC and MC at the bregma of 3.72 mm. (B) Low-magnification photomicrographs capturing representative coronal sections through the PFC and MC of 5-week-old spontaneously hypertensive rats (SHRs). Key regions include the prelimbic (PRL), cingulate (CG1), lateral orbitofrontal (LO), ventral orbitofrontal (VO), primary motor (M1), and secondary motor (M2) cortices. Scale bar, 1 mm.
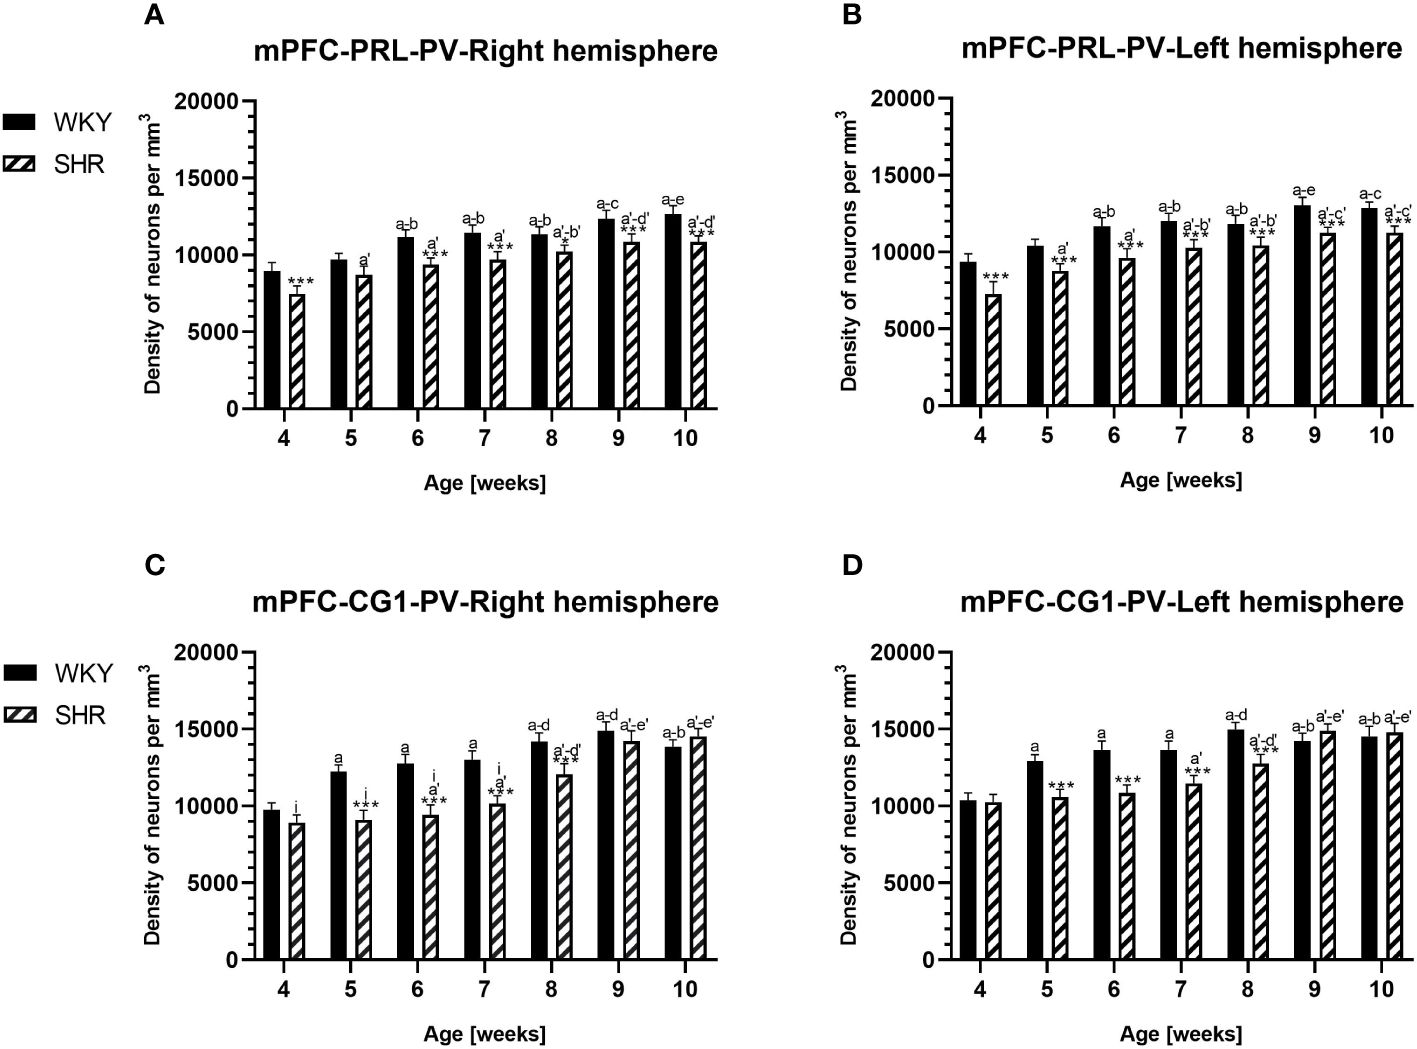
Figure 2 Densities of parvalbumin (PV)-expressing neurons in the prelimbic (PRL) cortex (A, B) and the cingulate (CG1) cortex (C, D) in Wistar Kyoto rats (WKYs) and spontaneously hypertensive rats (SHRs) during postnatal development. Data are expressed as the mean ± SD (n = 5 or 6). *p ≤ 0.05; ***p ≤ 0.001 (statistically significant differences between WKYs and SHRs). Age-dependent differences show the following: a–f- developmental differences (p < 0.05–p < 0.001) in the WKY strain; a'–f'- developmental differences (p < 0.05–p < 0.001) in the SHR strain; a, a'- 4 weeks vs. subsequent weeks; b, b'- 5 weeks vs. subsequent weeks; c, c'- 6 weeks vs. subsequent weeks; d, d'- 7 weeks vs. subsequent weeks; e, e'- 8 weeks vs. subsequent weeks; f, f'- 9 weeks vs. 10 weeks; and i- differences between the right and left hemispheres.
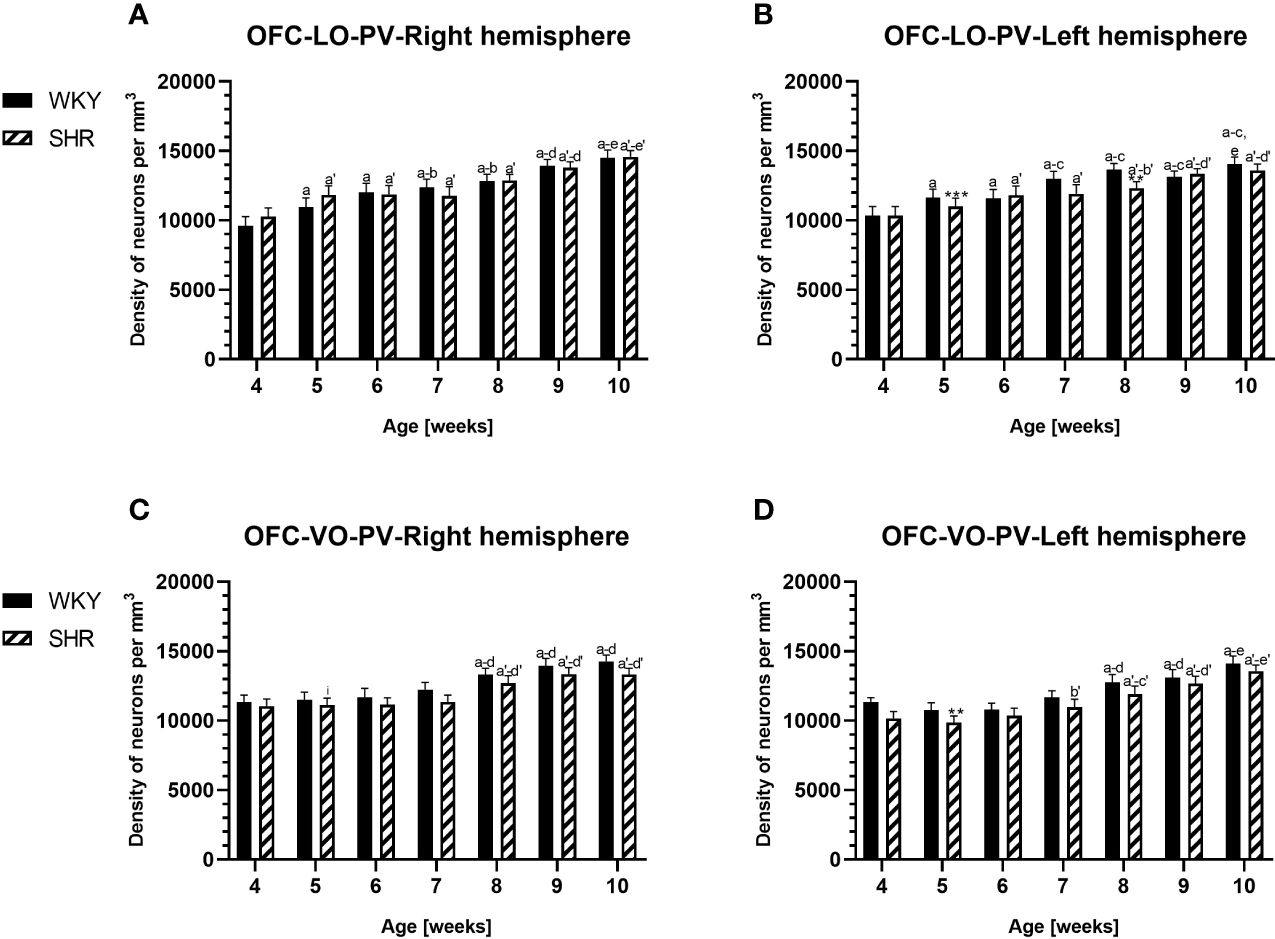
Figure 3 Densities of parvalbumin (PV)-expressing neurons in the lateral orbitofrontal (LO) cortex (A, B) and ventral orbitofrontal (VO) cortex (C, D) in Wistar Kyoto rats (WKYs) and spontaneously hypertensive rats (SHRs) during postnatal development. Data are expressed as the mean ± SD (n = 5 or 6). **p ≤ 0.01; ***p ≤ 0.001 (statistically significant differences between WKYs and SHRs). Age-dependent differences show the following: a–f- developmental differences (p < 0.05–p < 0.001) in the WKY strain; a'–f'- developmental differences (p < 0.05–p < 0.001) in the SHR strain; a, a'- 4 weeks vs. subsequent weeks; b, b'- 5 weeks vs. subsequent weeks; c, c'- 6 weeks vs. subsequent weeks; d, d'- 7 weeks vs. subsequent weeks; e, e'- 8 weeks vs. subsequent weeks; f, f'- 9 weeks vs. 10 weeks; and i- differences between the right and left hemispheres.
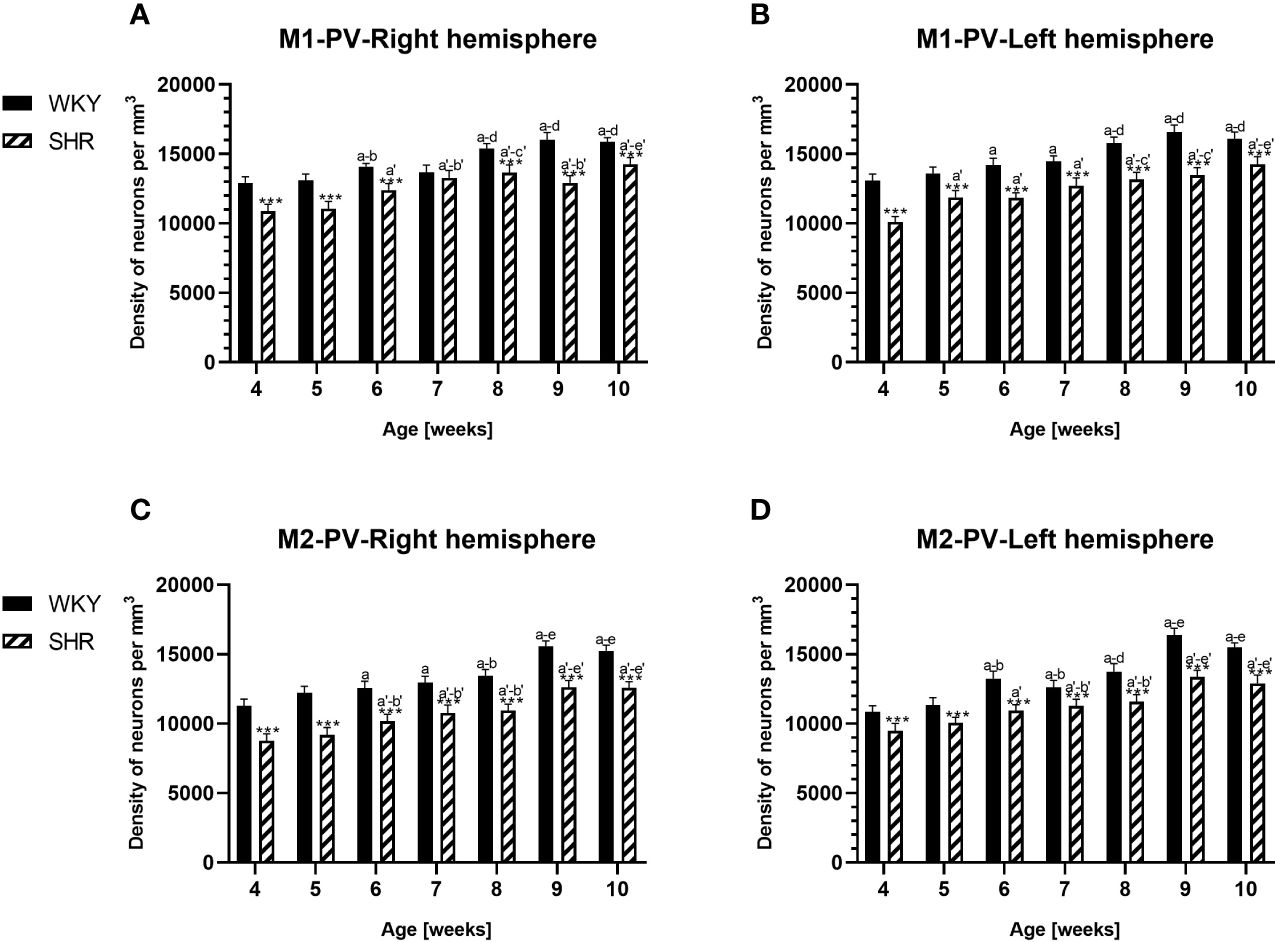
Figure 4 Densities of parvalbumin (PV)-expressing neurons in the primary motor (M1) cortex (A, B) and secondary motor (M2) cortex (C, D) in Wistar Kyoto rats (WKYs) and spontaneously hypertensive rats (SHRs) during postnatal development. Data are expressed as the mean ± SD (n = 5 or 6). ***p ≤ 0.001 (statistically significant differences between WKYs and SHRs). Age-dependent differences show the following: a–f- developmental differences (p < 0.05–p < 0.001) in the WKY strain; a'–f'- developmental differences (p < 0.05–p < 0.001) in the SHR strain; a, a'- 4 weeks vs. subsequent weeks; b, b'- 5 weeks vs. subsequent weeks; c, c'- 6 weeks vs. subsequent weeks; d, d'- 7 weeks vs. subsequent weeks; e, e'- 8 weeks vs. subsequent weeks; and f, f'- 9 weeks vs. 10 weeks.
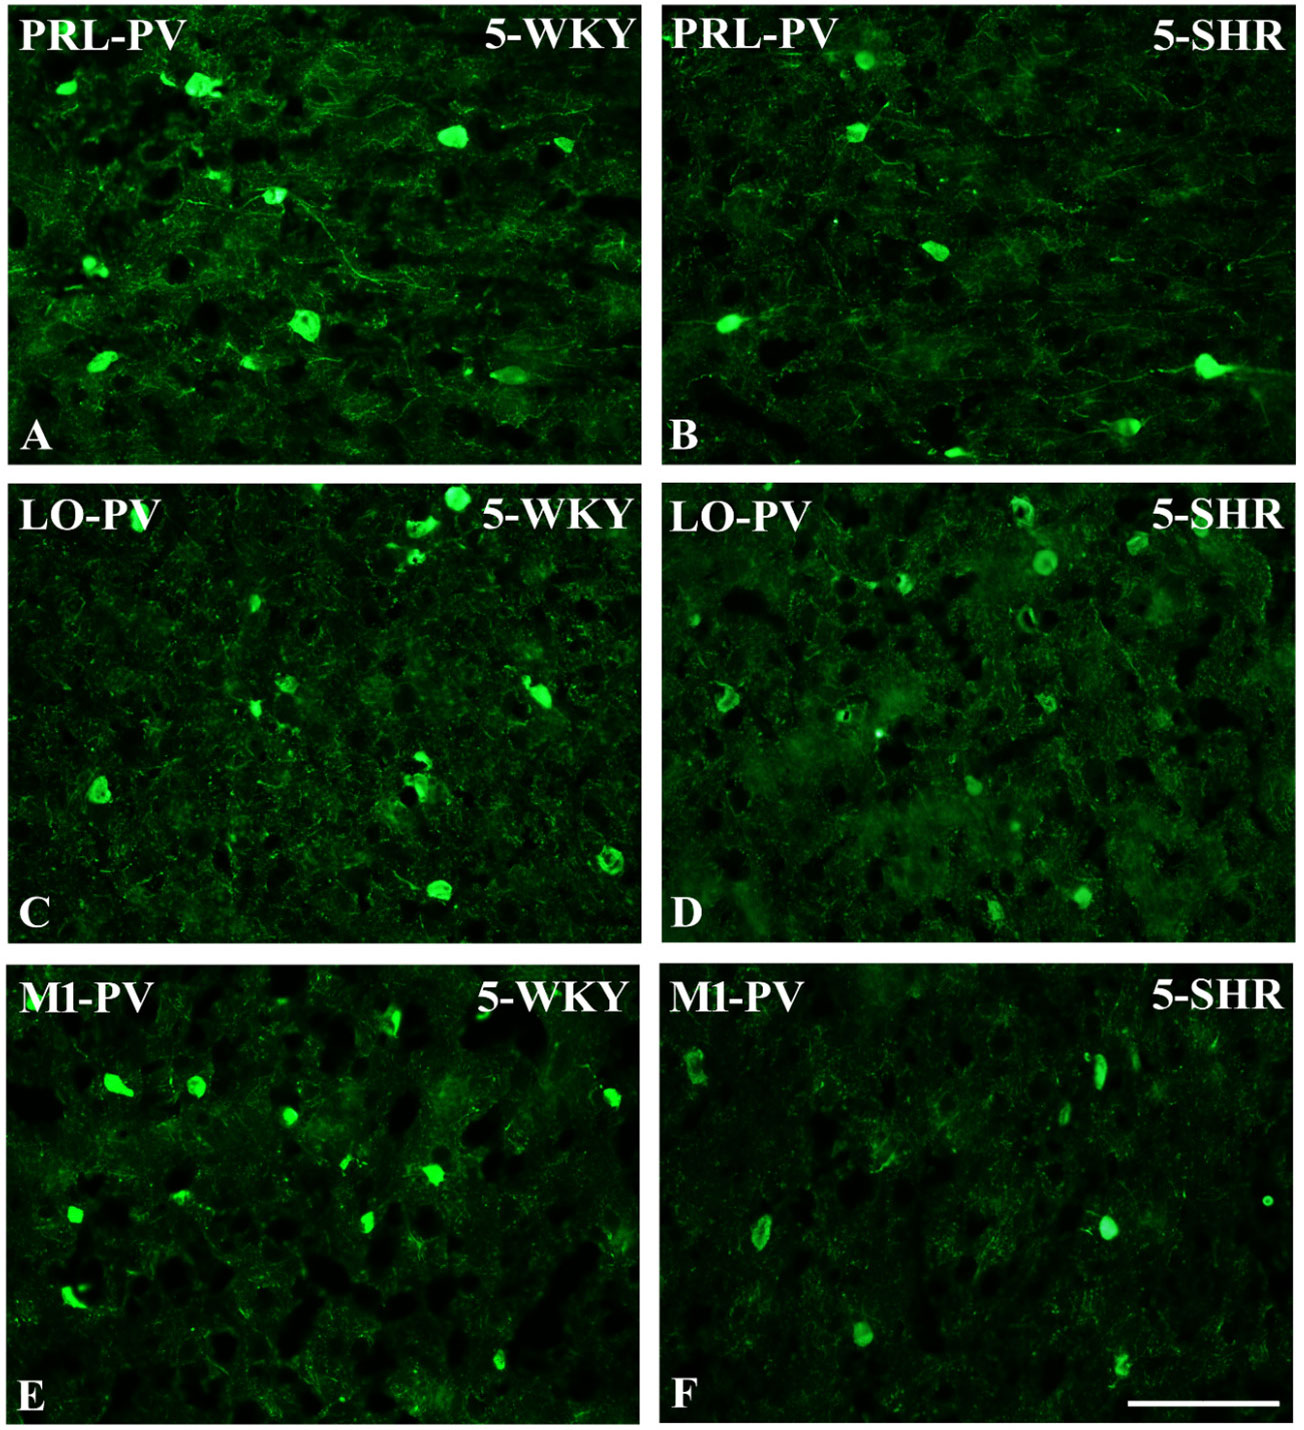
Figure 5 Representative color photomicrographs depicting the staining patterns of parvalbumin (PV)-expressing neurons in the prelimbic (PRL), lateral orbitofrontal (LO), and primary motor (M1) cortices of Wistar Kyoto rats (WKYs) (A, C, E) and spontaneously hypertensive rats (SHRs) (B, D, F). Significantly diminished cell densities were observed in the PRL and M1 of 5-week-old SHRs (B, F) in comparison to age-matched WKYs (A, E). Notably, no significant differences were observed in the LO cortex of 5-week-old WKYs (C) and SHRs (D). Scale bar, 200 μm.
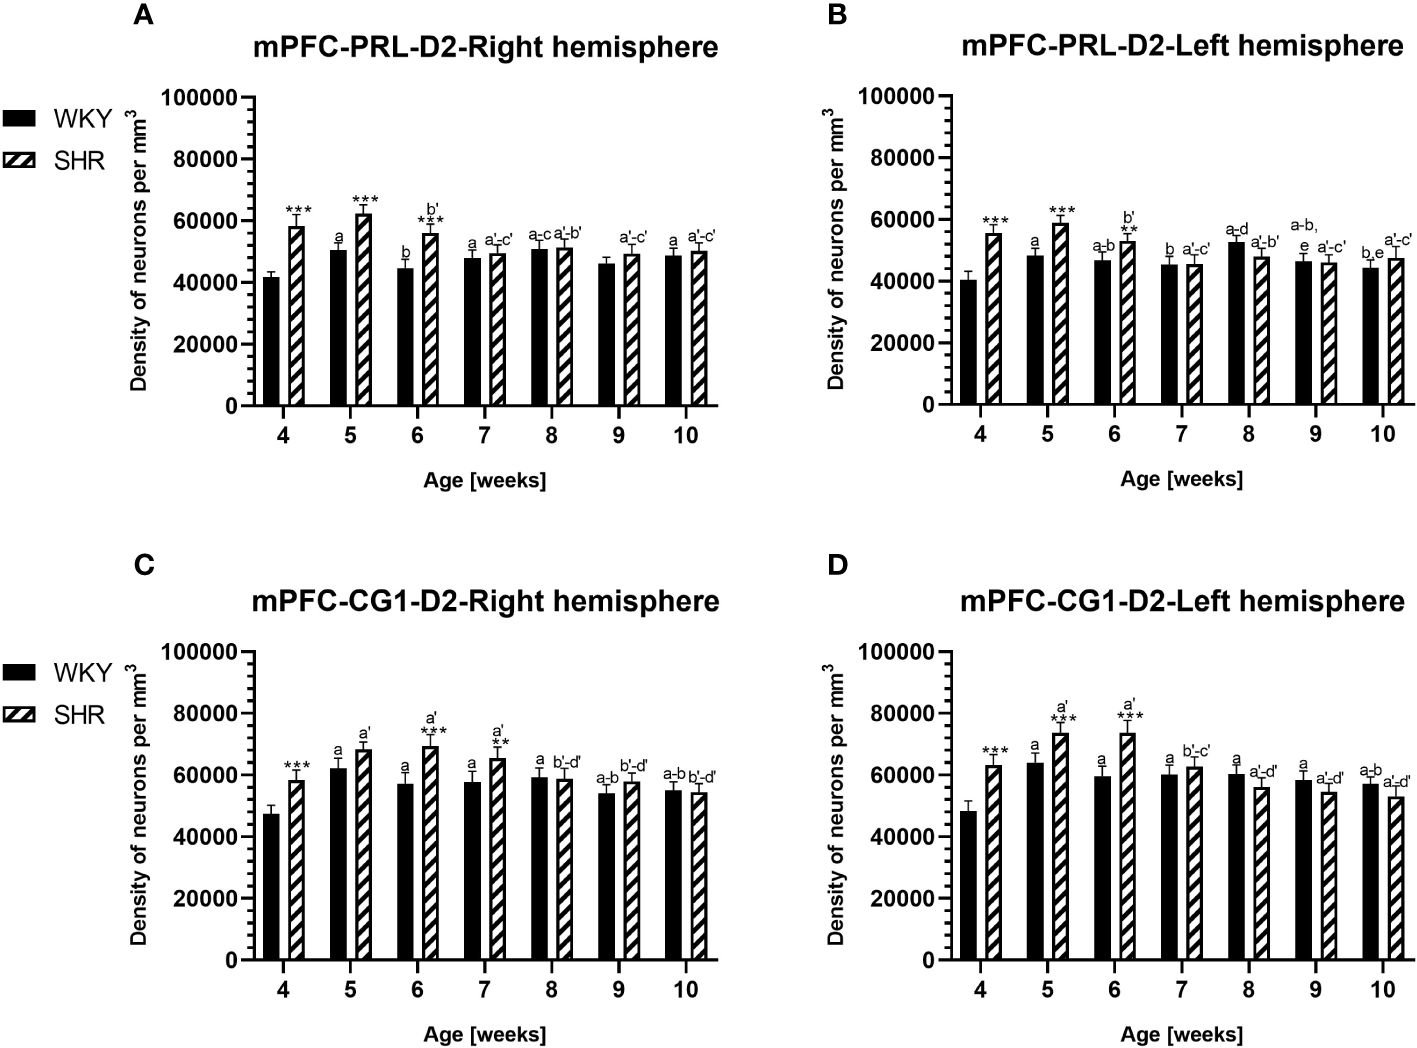
Figure 6 Densities of neurons enriched in dopamine receptor subtype 2 (D2) in the prelimbic (PRL) cortex (A, B) and cingulate (CG1) cortex (C, D) in Wistar Kyoto rats (WKYs) and spontaneously hypertensive rats (SHRs) during postnatal development. Data are expressed as the mean ± SD (n = 5 or 6). **p ≤ 0.01, ***p ≤ 0.001 (statistically significant differences between WKYs and SHRs). Age-dependent differences show the following: a–f- developmental differences (p < 0.05–p < 0.001) in the WKY strain; a'–f'- developmental differences (p < 0.05–p < 0.001) in the SHR strain; a, a'- 4 weeks vs. subsequent weeks; b, b'- 5 weeks vs. subsequent weeks; c, c'- 6 weeks vs. subsequent weeks; d, d'- 7 weeks vs. subsequent weeks; e, e'- 8 weeks vs. subsequent weeks; and f, f'- 9 weeks vs. 10 weeks. Data for PRL and CG1 in 5- and 10- week-old WKYs and SHRs were earlier published in our study (61) and were included here only to complete the pattern of postnatal development.
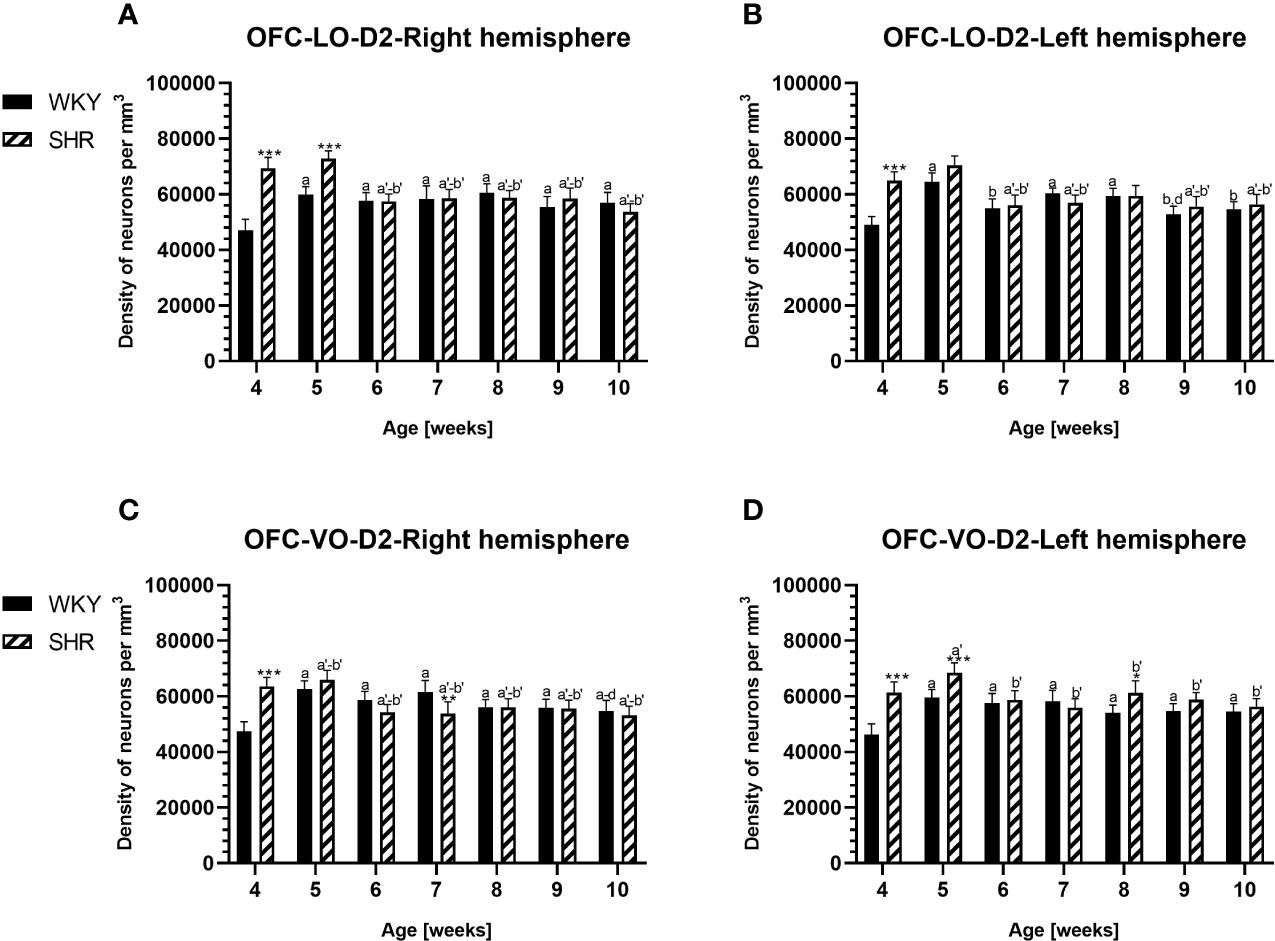
Figure 7 Densities of neurons enriched in dopamine receptor subtype 2 (D2) in the lateral orbitofrontal (LO) cortex (A, B) and ventral orbitofrontal (VO) cortex (C, D) in Wistar Kyoto rats (WKYs) and spontaneously hypertensive rats (SHRs) during postnatal development. Data are expressed as the mean ± SD (n = 5 or 6). *p ≤ 0.05; **p ≤ 0.01; ***p ≤ 0.001 (statistically significant differences between WKYs and SHRs). Age-dependent differences show the following: a–f- developmental differences (p < 0.05–p < 0.001) in the WKY strain; a'–f'- developmental differences (p < 0.05–p < 0.001) in the SHR strain; a, a'-, 4 weeks vs subsequent weeks; b, b'- 5 weeks vs. subsequent weeks; c, c'- 6 weeks vs. subsequent weeks; d, d'- 7 weeks vs. subsequent weeks; e, e'- 8 weeks. subsequent weeks; f, f'- 9 weeks vs. 10 weeks.
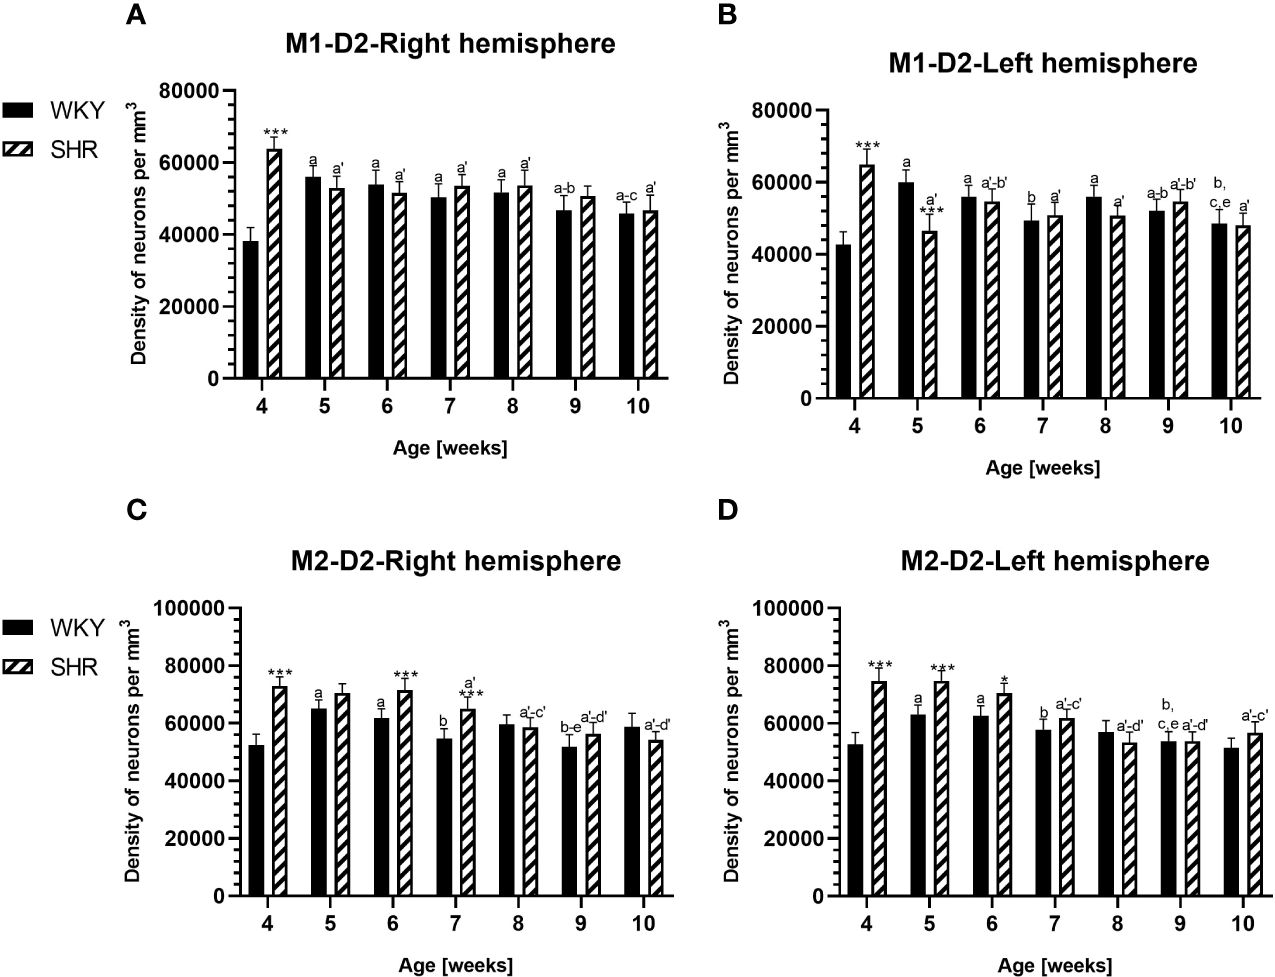
Figure 8 Densities of neurons enriched in dopamine receptor subtype 2 (D2) in the primary motor (M1) cortex (A, B) and secondary motor (M2) cortex (C, D) in Wistar Kyoto rats (WKYs) and spontaneously hypertensive rats (SHRs) during postnatal development. Data are expressed as the mean ± SD (n = 5 or 6). *p ≤ 0.05; ***p ≤ 0.001 (statistically significant differences between WKYs and SHRs). Age-dependent differences show the following: a–f- developmental differences (p < 0.05–p < 0.001) in the WKY strain; a'–f'- developmental differences (p < 0.05–p < 0.001) in the SHR strain; a, a'- 4 weeks vs. subsequent weeks; b, b'- 5 weeks vs. subsequent weeks; c, c'- 6 weeks vs. subsequent weeks; d, d'- 7 weeks vs. subsequent weeks; e, e'- 8 weeks vs. subsequent weeks; and f, f'- 9 weeks vs. 10 weeks.
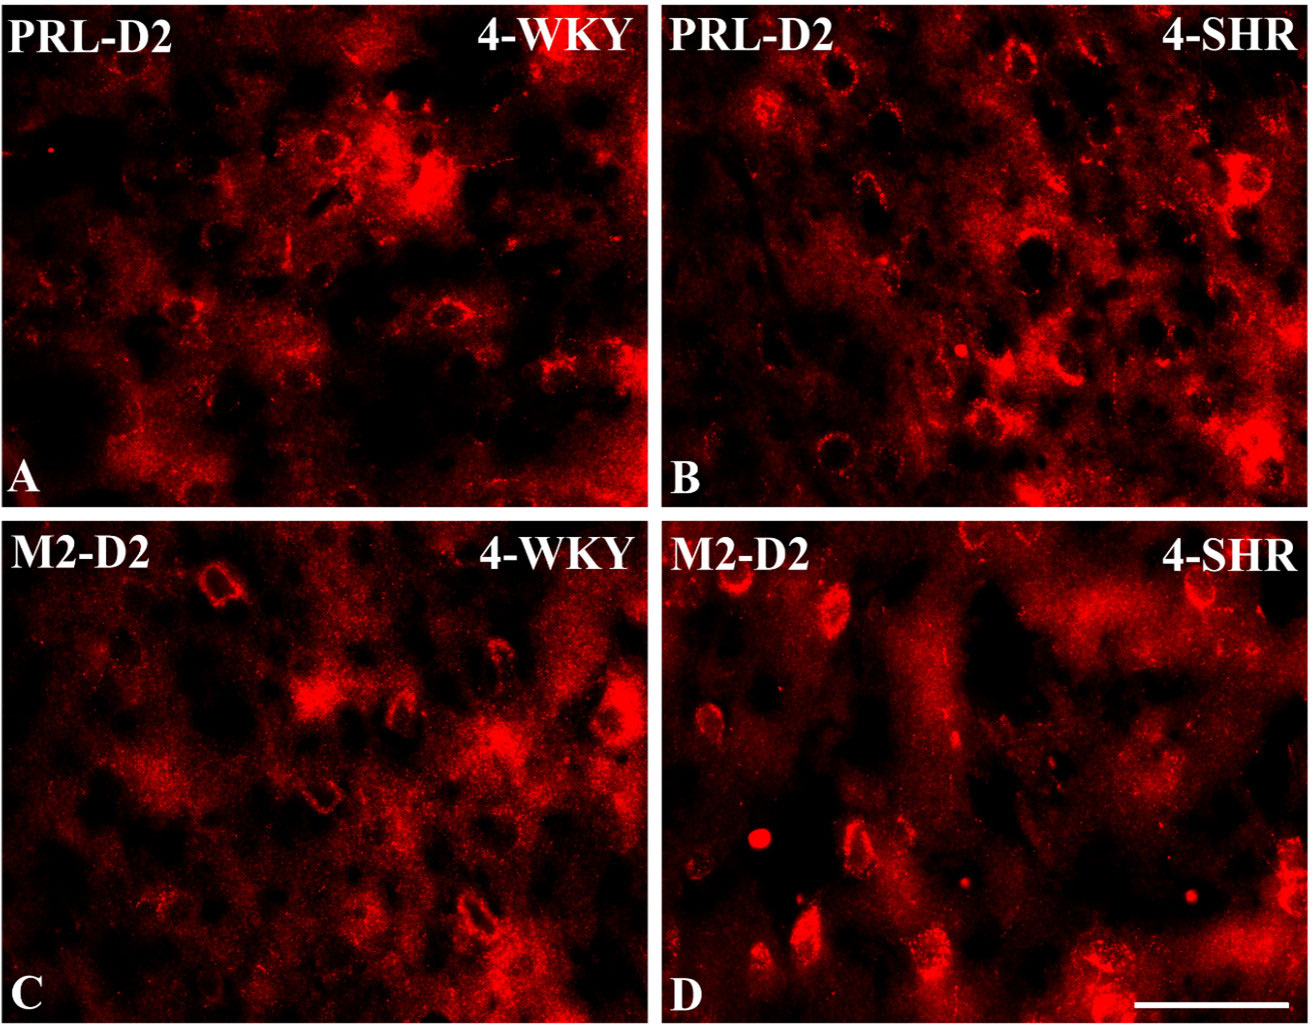
Figure 9 Representative color photomicrographs depicting the staining patterns of dopamine receptor subtype 2 (D2)-expressing neurons in the prelimbic (PRL) and secondary motor (M2) cortices of Wistar Kyoto rats (WKYs) (A, C) and spontaneously hypertensive rats (SHRs) (B, D). Significantly higher densities of these cells were observed in the PRL and M2 of 4-week-old SHRs (B, D) in comparison to age-matched WKYs (A, C). Scale bar, 100 µm.
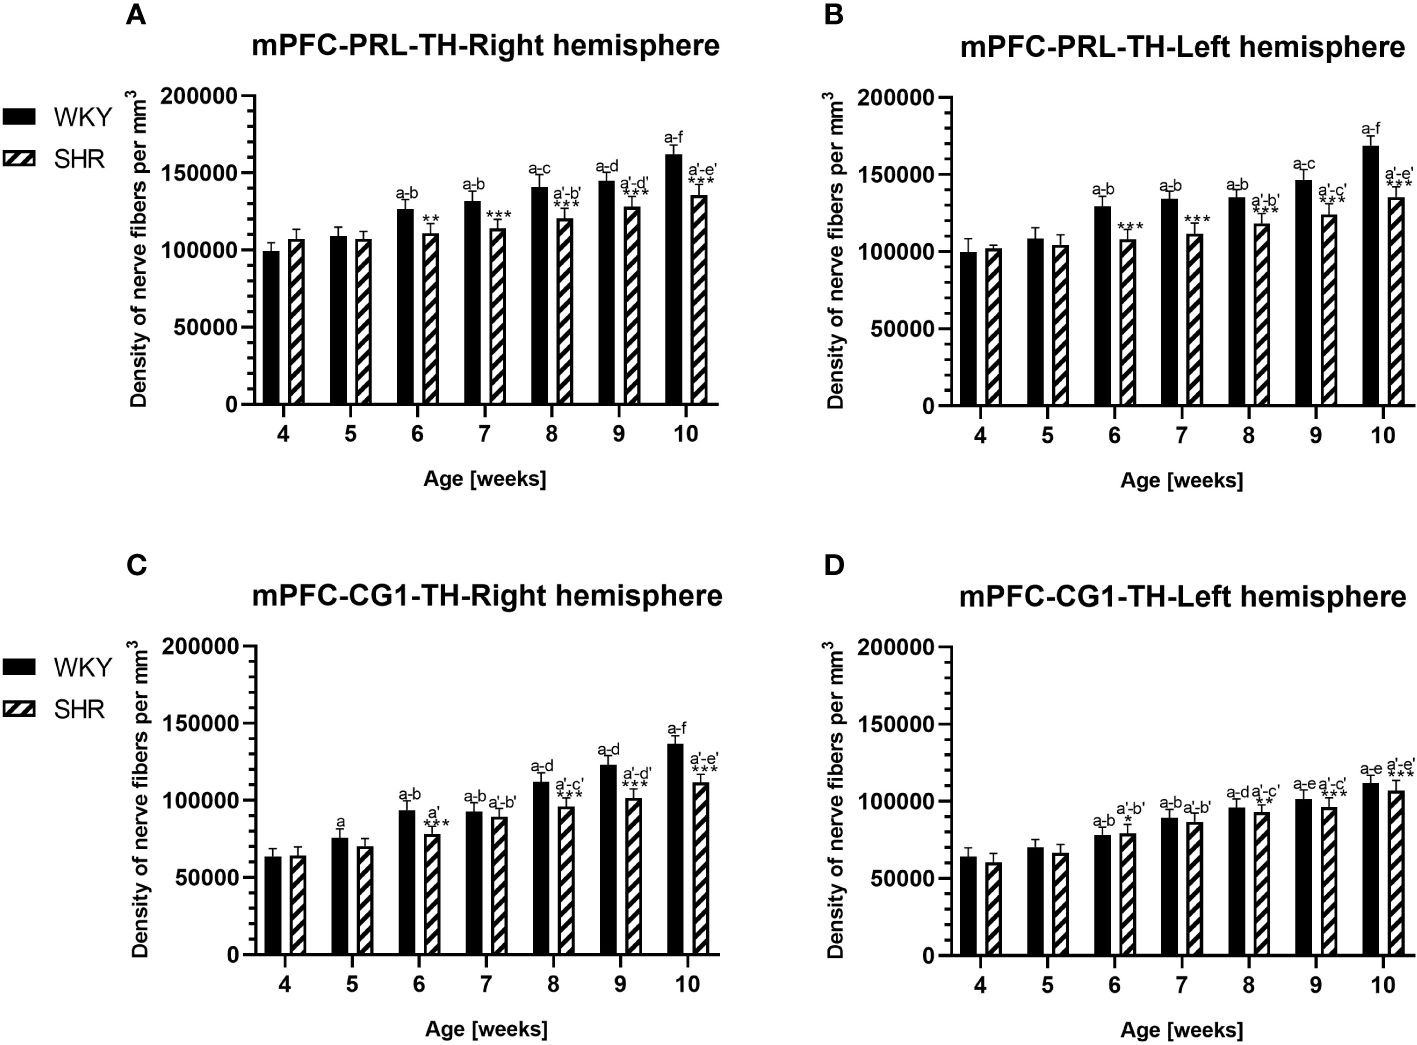
Figure 10 Densities of tyrosine hydroxylase (TH)-expressing fibers in the prelimbic (PRL) cortex (A, B) and cingulate (CG1) cortex (C, D) of Wistar Kyoto rats (WKYs) and spontaneously hypertensive rats (SHRs) during postnatal development. Significantly reduced fiber densities were observed in pubertal and postpubertal SHRs in comparison to age-matched WKYs. Data are expressed as the mean ± SD (n = 5 or 6). *p ≤ 0.05; **p ≤ 0.01; ***p ≤ 0.001 (statistically significant differences between WKYs and SHRs). Age-dependent differences show the following: a–f- developmental differences (p < 0.05–p < 0.001) in the WKY strain; a'–f'- developmental differences (p < 0.05–p < 0.001) in the SHR strain; a, a'- 4 weeks vs. subsequent weeks; b, b'- 5 weeks vs. subsequent weeks; c, c'- 6 weeks vs. subsequent weeks; d, d'- 7 weeks vs. subsequent weeks; e, e'- 8 weeks vs. subsequent weeks; and f, f'- 9 weeks vs. 10 weeks. Data for PRL and CG1 in 5- and 10-week-old WKYs and SHRs were earlier published in our study (61) and were included here only to complete the pattern of postnatal development.
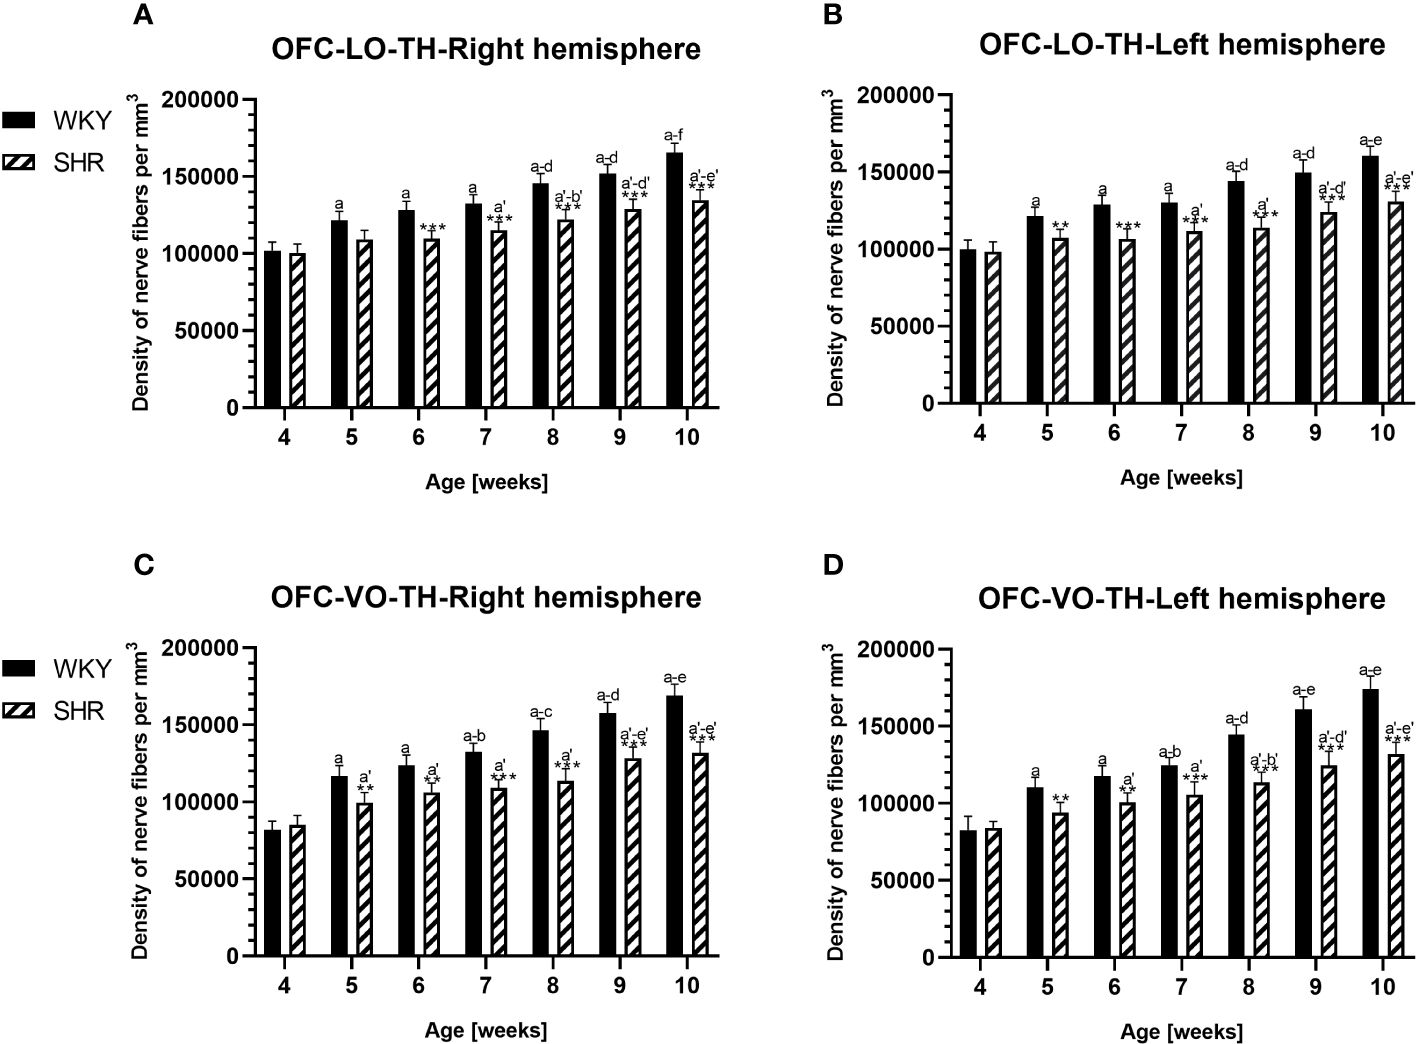
Figure 11 Densities of of tyrosine hydroxylase (TH)-expressing fibers in the l ateral orbitofrontal (LO) cortex (A, B) and ventral orbitofrontal (VO) cortex (C, D) in Wistar Kyoto rats (WKYs) and spontaneously hypertensive rats (SHRs) during postnatal development. Data are expressed as the mean ± SD (n = 5 or 6). **p ≤ 0.01; ***p ≤ 0.001 (statistically significant differences between WKYs and SHRs). Age-dependent differences show the following: a–f- developmental differences (p < 0.05–p < 0.001) in the WKY strain; a'–f'- developmental differences (p < 0.05–p < 0.001) in the SHR strain; a, a'- 4 weeks vs. subsequent weeks; b, b'- 5 weeks vs. subsequent weeks; c, c'- 6 weeks vs. subsequent weeks; d, d'- 7 weeks vs. subsequent weeks; e, e'- 8 weeks vs. subsequent weeks; and f, f'- 9 weeks vs. 10 weeks.
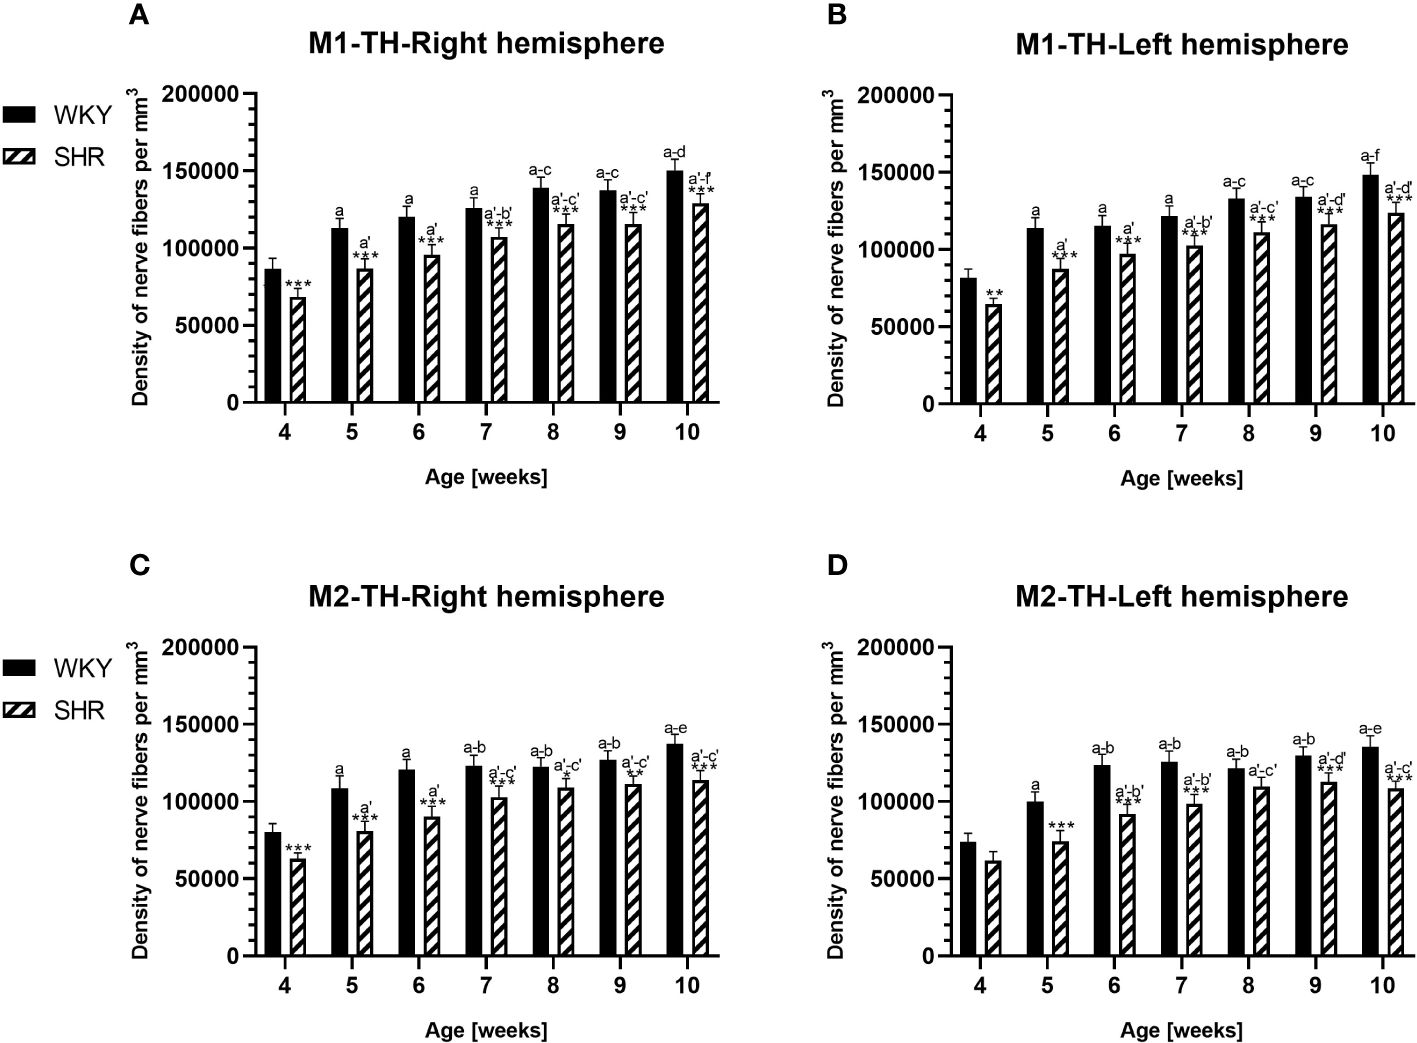
Figure 12 Densities of tyrosine hydroxylase (TH)-expressing fibers in the primary motor (M1) cortex (A, B) and secondary motor (M2) cortex (C, D) of Wistar Kyoto rats (WKYs) and spontaneously hypertensive rats (SHRs) during postnatal development. Data are expressed as the mean ± SD (n = 5 or 6). *p ≤ 0.05, **p ≤ 0.01; ***p ≤ 0.001 (statistically significant differences between WKYs and SHRs). Age-dependent differences show the following: a–f- developmental differences (p < 0.05–p < 0.001) in the WKY strain; a'–f'- developmental differences (p < 0.05–p < 0.001) in the SHR strain; a, a'- 4 weeks vs. subsequent weeks; b, b'- 5 weeks vs. subsequent weeks; c, c'- 6 weeks vs. subsequent weeks; d, d'- 7 weeks vs. subsequent weeks; e, e'- 8 weeks vs. subsequent weeks; f, f'- 9 weeks vs. 10 weeks.
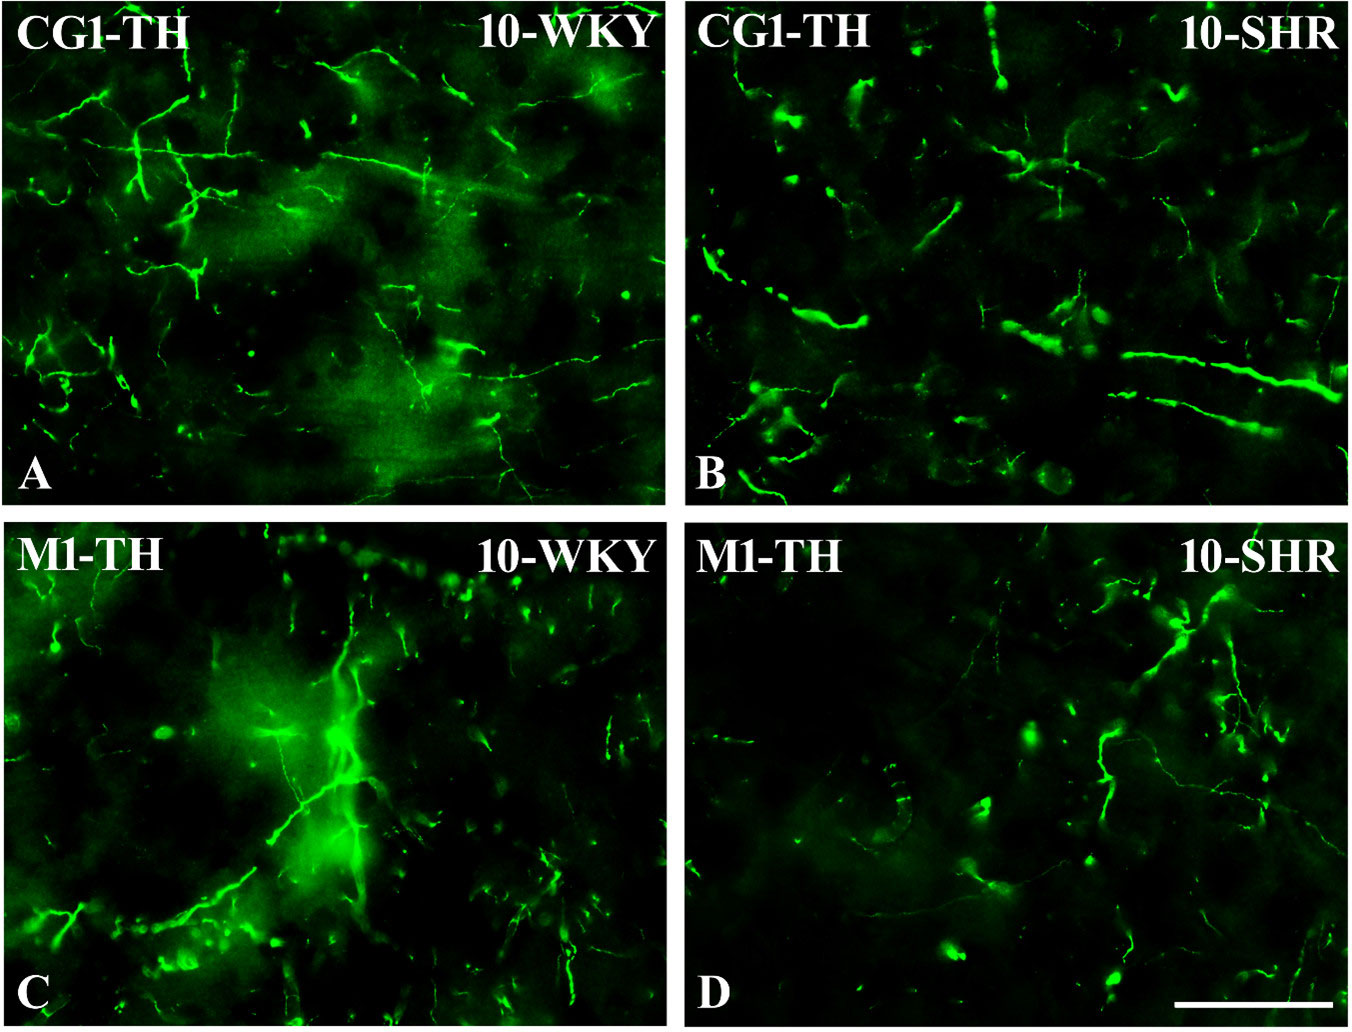
Figure 13 Representative color photomicrographs depicting the staining patterns of tyrosine hydroxylase (TH)-expressing fibers in the anterior cingulate (CG1) and primary motor (M1) cortices of Wistar Kyoto rats (WKYs) (A, C) and spontaneously hypertensive rats (SHRs) (B, D). Significantly reduced fiber densities were observed in the CG1 and M1 of 10-week-old SHRs (B, D) as compared to age-matched WKYs (A, C). Scale bar, 100 µm.
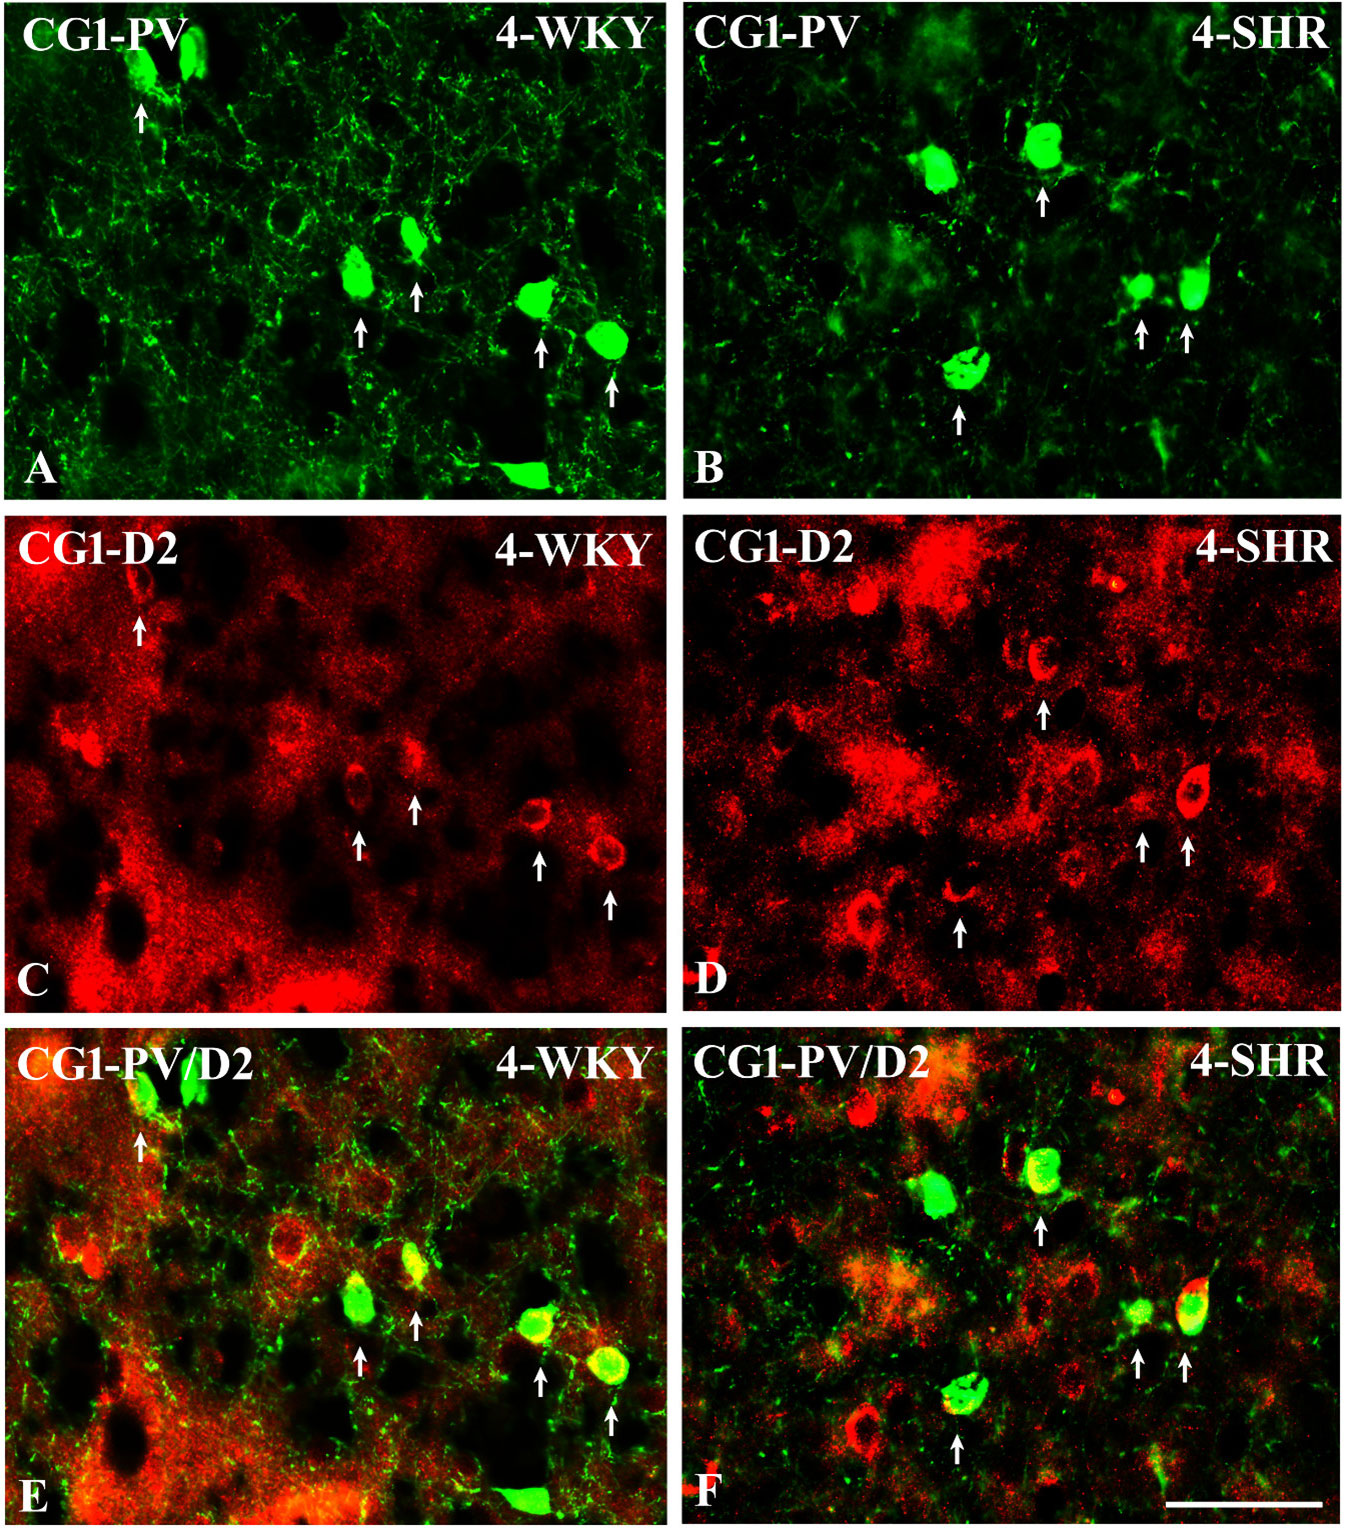
Figure 14 Representative color photomicrographs illustrating the anatomical relationship between parvalbumin (PV)-expressing neurons and dopamine receptor subtype 2 (D2) in the anterior cingulate (CG1) cortex of juvenile Wistar Kyoto rats (WKYs) (A, C, E) and spontaneously hypertensive rats (SHRs) (B, D, F). Note the extensive co-localization of PV with D2 in both rat strains (arrows). Note also that the expression of D2 is much more abundant in SHRs (D) compared to age-matched WKYs (C). Scale bar, 100 µm.
3.1 Parvalbumin
The results showed that, in the PRL (Figures 2A, B; 5A, B, green photomicrographs), M1 (Figures 4A, B; 5E, F, green photomicrographs), and M2 (Figures 4C, D), the densities of PV+ cells were significantly decreased (p < 0.001) in SHRs when compared to WKYs at almost any age studied. The CG1 density values were also decreased (p < 0.001) in the SHRs, but only from 5 to 8 weeks of their lives (Figures 2C, D). No density changes among PV+ cells were observed in the LO and VO (p > 0.05), with the exception of the left hemisphere in 5-week-old SHRs where the density of PV+ neurons decreased (p < 0.01–0.001) in relation to WKYs (Figures 3A–D; 5C, D, green photomicrographs). Moreover, the comparison of the right and left hemispheres in SHRs revealed disparities in the density of PV+ neurons. Notably, in the CG1 during weeks 4–7 (p < 0.01; Figures 2C, D), the density of neurons positive for PV in the right hemisphere was lower than that in the left hemisphere. In turn, a higher density of PV+ neurons within the right hemisphere in VO in week 5 was found (p < 0.01; Figures 3C, D).
3.2 Dopamine receptor 2
PV deficits were accompanied by D2 upregulation, which were observed mostly in prepubertal SHRs. In the PRL (Figures 6A, B; 9A, B, red photomicrographs), CG1 (Figures 6C, D), and M2 (Figures 8C, D; 9C, D, red photomicrographs), the densities of D2+ cells were significantly elevated (p < 0.01–0.001) in 4-, 5-, and/or 6-week-old SHRs in comparison to age-matched WKYs; however, in older animals, the densities were similar (p > 0.05) in both rat strains. In the case of LO (Figures 7A, B) and VO (Figures 7C, D), the density values were also increased (p < 0.001), but only in 4-, 5- and/or 6-week-old SHRs. Significantly elevated D2+ density values (p < 0.001) were observed in M1 only in 4-week-old SHRs (Figures 8A, B).
3.3 Hydroxylase tyrosine
In all studied regions, PV deficits were also accompanied by the downregulation of TH, which was observed mostly in pubertal and postpubertal SHRs. In M1 (Figures 12A, B; 13C, D, green photomicrographs) and M2 (Figures 12C, D), the densities of TH+ fibers were significantly decreased (p < 0.01 and 0.001) in SHRs in comparison to WKYs at any age studied. In VO (Figures 11C, D), decreased (p < 0.05 and 0.001) density values were observed in 5- to 10-week-old SHRs; however, in 4-week-old animals, the values were comparable (p > 0.05) in both rat strains. In the PRL (Figures 10A, B), CG1 (Figures 10C, D, 13A, B, green photomicrographs), and LO (Figures 11A, B), the density values were decreased in 6- to 10-week-old SHRs only (p < 0.01).
3.4 PV/D2 relationships
To elucidate the relationship between PV+ cells and D2+ elements, some sections in each subject were processed for double immunofluorescence staining. The results revealed extensive co-expression of D2 in PV+ neurons in both WKYs and SHRs at any age studied. The co-expression patterns of PV and D2 in various regions of the PFC and MC did not differ significantly between WKYs and SHRs and ranged from 60% in PRL to ~75% in M1. However, a higher abundance of these proteins on PV+ cells in SHRs was easily recognizable (Figures 14A–F).
3.5 Summary of results
Our findings, which exhibited a region-specific reduction in PV+ cell density along with D2 receptor upregulation and TH downregulation in SHRs, serve as a crucial starting point for more comprehensive research aimed at unraveling the pathophysiology of ADHD. These baseline studies have identified specific neurobiological alterations within the PFC and MC regions, shedding light on the intricate interplay between the inhibitory and excitatory neurotransmission systems. The reduction in the density of PV+ cells implies a potential imbalance in inhibitory signaling, while the observed upregulation of D2 and downregulation of TH suggest alterations in the dopaminergic system, which is crucial for attention, impulse control, and motor function. Building upon these foundational findings, further detailed research can delve into the molecular, cellular, and circuit-level mechanisms underlying these alterations. Investigating the specific interactions between PV+ interneurons, D2 receptors, and the DA synthesis pathway in ADHD-relevant brain regions could provide a more nuanced understanding of the neurobiological basis of this disorder.
4 Discussion
The results presented here provide evidence that, in the PFC and MC, the densities of PV+ interneurons, which in the cerebral cortex are the main subset of inhibitory GABAergic neurons (70), were significantly reduced in pre- and postpubertal SHRs, a validated ADHD animal model (40). This parallels the diminished GABA content in pediatric ADHD patients and aligns with the reduced SICI observed in ADHD. Notably, PV+ deficits in all the studied regions coincided with D2 receptor upregulation, primarily in prepubertal SHRs, and TH downregulation, predominantly in pubertal and postpubertal SHRs. Given that PV+ neurons co-expressed substantial D2 receptors (present results) (29, 33), their upregulation could exacerbate the deficits in GABA and impairments in cortical inhibition. In addition, downregulation of TH, a key enzyme in DA synthesis, could contribute to reduced GABA neurotransmission and behavioral inhibition deficits. The intricate interplay between GABAergic transmission and DA signaling in the PFC and MC underscores their pivotal role in sensory information filtering and behavioral response determination (71). A comprehensive understanding of these mechanisms during juvenile SHRs development offers critical insights into the neurobiological foundations of ADHD, with implications for targeted interventions.
The findings obtained unequivocally illustrate substantial PV deficits in SHRs across diverse regions of the PFC and MC, except for the LO and VO regions. This observation resonates with previous research highlighting diminished GABA concentrations in the PFC and MC of children diagnosed with ADHD compared to their typically developing counterparts (22, 24). The identified PV deficits align with documented impairments in SICI in individuals with ADHD, suggesting a GABAergic deficiency within this population (27). Given that SICI modulation involves GABA-A agonists and is believed to be orchestrated by GABA-A cortical interneurons (72), it appears that fast-spiking PV+ neurons are the most plausible candidates to meet both criteria (28, 70). These neurons exhibit GABAergic properties and boast abundant GABA-A receptors (29), making them prime contenders for playing a crucial role in the observed deficits. Recent evidence has emphasized the pivotal role of PV+ interneurons in regulating pyramidal neuron activity (73, 74), modulating the excitation/inhibition (E/I) balance (75, 76) to drive appropriate behavioral responses (77, 78). Consequently, deficits in PV+ cell density could disrupt the E/I balance, potentially increasing excitatory drive and contributing to inappropriate behaviors or psychiatric disorders (79). Good examples of such phenomena are schizophrenia and autism spectrum disorder, which is characterized by significant deficits in GABAergic signaling and reduced expressions of GAD-67 and/or PV (80, 81). It also appears that at least some of the ADHD symptoms may have a similar etiology. An example is the correlation between GABA concentrations and motor control in healthy adults (82). ADHD patients and SHRs showed increased motor activity, with reduced GABA in the MC of human patients (22) and PV+ deficits in the MC of SHRs (present results). There is also evidence that a low GABA concentration in the CG1 is strongly associated with high inattention scores in children with ADHD (24). Interestingly, SHRs that also displayed inattention had PV+ deficits in the CG1 (present results). Notably, the severity of ADHD symptoms and the motor skill proficiency of school-aged children with this disorder have been linked to reduced SICI in the MC, indicating a GABA-A/PV deficit (27). Recent reports have also suggested that the glutamate levels in the PFC may be related to the intensity of ADHD traits in human patients and in SHRs (83, 84). Elevated glutamate levels in the CG1 of patients with ADHD positively correlate with the severity of symptoms related to hyperactivity and impulsivity (84).
The current study reveals a noteworthy association between deficits in PV+ and the increased density of neurons expressing D2 receptors in various regions of the PFC and MC in SHRs, particularly evident in prepubertal individuals. While some prior investigations indicated no significant differences in the expression of D1 and D2 receptors between SHRs and WKYs (85–87), multiple studies have consistently reported the upregulation of D1 and D2 receptors in various brain regions of SHRs, including the frontal cortex, nucleus accumbens, and striatum (88–91). These receptors in the cortical areas are localized both in the pyramidal glutamatergic neurons and in various classes of GABAergic interneurons (present results) (29, 92). Considering that, in physiological conditions, a high proportion of PV+ interneurons co-express both D1 or D2 receptors (33, 93) and DA primarily increases PV+ cell excitability, enhancing the GABAergic transmission via D1 activation to suppress persistent firing of pyramidal neurons (35), increased D2 expression on these cells in juvenile SHRs may favor opposite consequences. Thus, the overexpression of D2 in conjunction with the overall deficit of PV+ expression in the PFC and MC of SHRs could, at least in part, lead to the reduced behavioral inhibition observed in ADHD-affected individuals. This aligns with the established roles of D2 receptors in mediating hyperactivity and responses to amphetamine, phenomena observed in both ADHD-affected individuals and animal models (94). Notably, targeted deletion of the D2 (but not the D3 or D4) DA receptor in coloboma mice, an ADHD mouse model, eliminated hyperactivity, and similar effects were observed in response to amphetamine treatment in both coloboma mice and human ADHD patients (94–97). The observed upregulation of D2 receptors in the 4- to 6-week-old SHRs in our study aligns temporally with the manifestation of ADHD symptoms in both rats and human patients. Rats undergo weaning at approximately 3 weeks, with puberty commencing around 7–8 weeks. In comparison, humans are typically weaned around 6 months, with puberty beginning at approximately 11.5 years. The 4- to 6-week-old SHRs in our study, equivalent to 7–10 years of age in children (98), exhibited an upregulation of D2 receptors in the PFC and MC. The age of 7 weeks in rats, when the contents of D2 receptors for the two strains became comparable, corresponds to the onset of puberty. This temporal alignment closely mirrors clinical findings in children with ADHD, where symptoms manifest in young school-aged individuals and hyperactivity tends to improve after puberty (2).
Preliminary data indicating the co-localization of PV and D2 in PFC and MC neurons further add to the complexity of the findings. While detailed analysis on this topic is lacking in the literature, future investigations exploring the interaction between D2 receptors and PV+ neurons in both WKYs and SHRs may provide valuable insights into the neurobiological mechanisms at play in ADHD.
The current findings reveal PV deficits in the PFC and MC regions of SHRs, accompanied by a reduction in TH+ fibers, predominantly observed in pubertal and postpubertal SHRs. Previous reports documented decreased TH protein and mRNA levels in the PFC of SHRs (39, 99–101), but data on this aspect in human ADHD patients are lacking. As the gene encoding TH appears to be not altered in individuals with ADHD, the phenomenon of TH downregulation is difficult to explain. There is also no information on the content of l-3,4-dihydroxyphenylalanine (l-DOPA; a precursor of DA synthesis) in human ADHD patients and in SHRs that could shed light on the role of TH downregulation in the pathogenesis of ADHD. However, TH deficits may have an impact on the overall DA action in the PFC and MC as methylphenidate treatment increased the TH levels in SHRs and improved the ADHD symptoms in these animals (100). It is worth mentioning that, in the case of PFC, one factor should be considered when comparing the TH levels in SHRs and WKYs, or in human ADHD patients. The PFC undergoes a prolonged maturation process, exhibiting structural and connectivity changes that extend through adolescence into early adulthood (102–104). This protracted development of the DA input to the PFC is attributed to the continued growth of DA axons during adolescence (105). Notably, both ADHD human patients and SHRs display a maturational trajectory of the PFC that is typical but delayed by a few years or weeks, respectively (106, 107). This delay is also evident in the maturation of dopaminergic pathways. When comparing the TH levels in the PFC between SHRs and WKYs, it is essential to consider developmental delay. The presence of age-inappropriate levels of hyperactivity/impulsivity and inattention in both ADHD individuals and SHRs may reflect this delayed maturation of the PFC in these populations (107).
The study’s focus on the temporal alignment of neurotransmitter alterations with ADHD symptom manifestation provides crucial insights into the developmental trajectory of this disorder. While acknowledging the study’s merit in shedding light on the neurobiological foundations of ADHD, several limitations exist. The existence of a PFC in rats and its primate equivalent has been a subject of ongoing debate. Anatomical studies suggest that the rat medial PFC is homologic to both the primate anterior cingulate cortex (ACC) and the dorsolateral PFC (108, 109). Functionally, in rats, it has been found that there are strong correlations between motor planning, movement, and reward anticipation, similar to observations in the primate ACC (110). Moreover, it is well known that rats may encode information over delays by utilizing body posture or variations in the running path that are tracked by medial PFC neurons (111, 112). Based on these results, the rat medial PFC appears to combine elements of the primate ACC and dorsolateral PFC (111–113). To aim for a deeper knowledge of the homology of PFC across species, further research is required to gather more data. In addition, the study calls for continued exploration of the interactions of PV+ neurons with D2 receptors in WKYs and SHRs, emphasizing the need for more in-depth cross-species homology investigations. In conclusion, this research marks a significant stride toward unraveling the complexities of ADHD neurobiology, emphasizing the importance of PV+ interneurons, D2 receptors, and TH in shaping the neurotransmission dynamics. The findings of this study not only contribute to existing knowledge but also underscore the need for more extensive research to unveil etiological factors, clinical ramifications, and potential therapeutic interventions for ADHD. These outcomes hold promise for advancing targeted treatments and facilitating more effective management of this prevalent neurodevelopmental disorder.
5 Conclusions
The results of the present study provide evidence that, in the PFC and MC, the density of PV+ neurons, which form in the cerebral cortex as the main subset of inhibitory GABAergic neurons, is significantly reduced in pre- and postpubertal SHRs. Thus, these results unequivocally align with prior findings that have consistently reported significantly reduced GABA content in children with ADHD (22, 114). Moreover, they firmly corroborate the observed pattern of diminished SICI in ADHD (27). In addition, in all studied areas, the PV+ deficits were accompanied by the upregulation of D2 observed mostly in prepubertal SHRs and the downregulation of TH observed mostly in pubertal and postpubertal SHRs. As cortical PV+ neurons co-express large amounts of D2 receptors (present results), which selectively suppress GABAergic transmission (115), the upregulation of these proteins could additionally potentiate deficits in GABA and/or deficits in cortical inhibition. Similarly, indirect effects on GABA neurotransmission and behavioral inhibition may also have downregulation of TH, which is considered to be the rate-limiting enzyme of DA synthesis. Nevertheless, additional research is imperative to comprehensively substantiate the precise etiological factors, repercussions, and broader implications of impaired GABAergic signaling in the pathophysiology of individuals with ADHD. Robust investigations are necessary to deepen our understanding for more effective treatment of this disorder.
Data availability statement
The raw data supporting the conclusions of this article will be made available by the authors, without undue reservation.
Ethics statement
The animal study was approved by the Local Ethical Commission of the University of Warmia and Mazury in Olsztyn (no. 43/2014). The study was conducted in accordance with the local legislation and institutional requirements.
Author contributions
EBC: Data curation, Formal analysis, Investigation, Visualization, Writing – original draft. AK: Conceptualization, Data curation, Formal analysis, Funding acquisition, Investigation, Methodology, Resources, Supervision, Writing – review & editing. MR: Conceptualization, Data curation, Formal analysis, Investigation, Methodology, Validation, Writing – original draft. ACHW: Writing – review & editing.
Funding
The author(s) declare financial support was received for the research, authorship, and/or publication of this article. The work was supported by grant No. PL-TW II/4/2015 from the National Centre for Research and Development in Poland. Funded by The Minister of Science under “The Regional Initiative of Excellence Program”.
Acknowledgments
We would like to thank Małgorzata Kolenkiewicz for their assistance during the immunohistochemical procedures.
Conflict of interest
The authors declare that the research was conducted in the absence of any commercial or financial relationships that could be construed as a potential conflict of interest.
Publisher’s note
All claims expressed in this article are solely those of the authors and do not necessarily represent those of their affiliated organizations, or those of the publisher, the editors and the reviewers. Any product that may be evaluated in this article, or claim that may be made by its manufacturer, is not guaranteed or endorsed by the publisher.
References
1. Tanaka M, Spekker E, Szabó Á, Polyák H, Vécsei L. Modelling the neurodevelopmental pathogenesis in neuropsychiatric disorders. Bioactive kynurenines and their analogues as neuroprotective agents—in celebration of 80th birthday of Professor Peter Riederer. J Neural Transm. (2022) 129:627–42. doi: 10.1007/s00702-022-02513-5
2. Polanczyk GV, Casella EB, Miguel EC, Reed UC. Attention deficit disorder/hyperactivity: a scientific overview. Clinics. (2012) 67:1125–6. doi: 10.6061/clinics/2012(10)01
3. Biederman J, Petty CR, Evans M, Small J, Faraone SV. How persistent is ADHD? A controlled 10-year follow-up study of boys with ADHD. Psychiatry Res. (2010) 177:299–304. doi: 10.1016/j.psychres.2009.12.010
4. Paris J, Bhat V, Thombs B. Adult attention-deficit hyperactivity disorder is being overdiagnosed. Can J Psychiatry. (2016) 61:62–2. doi: 10.1177/0706743715619938
5. Saccaro LF, Schilliger Z, Perroud N, Piguet C. Inflammation, anxiety, and stress in attention-deficit/hyperactivity disorder. Biomedicines. (2021) 9:1313. doi: 10.3390/biomedicines9101313
6. Battaglia MR, Di Fazio C, Battaglia S. Activated Tryptophan-Kynurenine metabolic system in the human brain is associated with learned fear. Front Mol Neurosci. (2023) 16. doi: 10.3389/fnmol.2023.1217090
7. Tong RL, Kahn UN, Grafe LA, Hitti FL, Fried NT, Corbett BF. Stress circuitry: mechanisms behind nervous and immune system communication that influence behavior. Front Psychiatry. (2023) 14. doi: 10.3389/fpsyt.2023.1240783
8. Felger JC, Treadway MT. Inflammation effects on motivation and motor activity: role of dopamine. Neuropsychopharmacol Off Publ Am Coll Neuropsychopharmacol. (2017) 42:216–41. doi: 10.1038/npp.2016.143
9. Haroon E, Miller AH, Sanacora G. Inflammation, glutamate, and glia: A trio of trouble in mood disorders. Neuropsychopharmacology. (2017) 42:193–215. doi: 10.1038/npp.2016.199
10. Blum K, Chen AL, Braverman ER, Comings DE, Chen TJ, Arcuri V, et al. Attention-deficit-hyperactivity disorder and reward deficiency syndrome. Neuropsychiatr Dis Treat. (2008) 4:893–918. doi: 10.2147/NDT
11. De La Fuente A, Xia S, Branch C, Li X. A review of attention-deficit/hyperactivity disorder from the perspective of brain networks. Front Hum Neurosci. (2013) 7. doi: 10.3389/fnhum.2013.00192
12. Brennan AR, Arnsten AFT. Neuronal mechanisms underlying attention deficit hyperactivity disorder. Ann N Y Acad Sci. (2008) 1129:236–45. doi: 10.1196/annals.1417.007
13. Del Campo N, Chamberlain SR, Sahakian BJ, Robbins TW. The roles of dopamine and noradrenaline in the pathophysiology and treatment of attention-deficit/hyperactivity disorder. Biol Psychiatry. (2011) 69:e145–157. doi: 10.1016/j.biopsych.2011.02.036
14. Allen MJ, Sabir S, Sharma S. GABA receptor. In: StatPearls. StatPearls Publishing, Treasure Island (FL (2024).
15. Speranza L, di Porzio U, Viggiano D, de Donato A, Volpicelli F. Dopamine: the neuromodulator of long-term synaptic plasticity, reward and movement control. Cells. (2021) 10:735. doi: 10.3390/cells10040735
16. Lew SE, Tseng KY. Dopamine modulation of GABAergic function enables network stability and input selectivity for sustaining working memory in a computational model of the prefrontal cortex. Neuropsychopharmacology. (2014) 39:3067–76. doi: 10.1038/npp.2014.160
17. Morozova EO, Myroshnychenko M, Zakharov D, di Volo M, Gutkin B, Lapish CC, et al. Contribution of synchronized GABAergic neurons to dopaminergic neuron firing and bursting. J Neurophysiol. (2016) 116:1900–23. doi: 10.1152/jn.00232.2016
18. Kessi M, Duan H, Xiong J, Chen B, He F, Yang L, et al. Attention-deficit/hyperactive disorder updates. Front Mol Neurosci. (2022) 15:925049. doi: 10.3389/fnmol.2022.925049
19. Grace AA. Dysregulation of the dopamine system in the pathophysiology of schizophrenia and depression. Nat Rev Neurosci. (2016) 17:524–32. doi: 10.1038/nrn.2016.57
20. Takashima H, Terada T, Bunai T, Matsudaira T, Obi T, Ouchi Y. In vivo illustration of altered dopaminergic and GABAergic systems in early parkinson’s disease. Front Neurol. (2022) 13:880407. doi: 10.3389/fneur.2022.880407
21. Barkley RA. Behavioral inhibition, sustained attention, and executive functions: Constructing a unifying theory of ADHD. Psychol Bull. (1997) 121:65–94. doi: 10.1037//0033-2909.121.1.65
22. Edden RAE, Crocetti D, Zhu H, Gilbert DL, Mostofsky SH. Reduced GABA concentration in attention-deficit/hyperactivity disorder. Arch Gen Psychiatry. (2012) 69(7):750–3. doi: 10.1001/archgenpsychiatry.2011.2280
23. Bollmann S, Ghisleni C, Poil SS, Martin E, Ball J, Eich-Höchli D, et al. Developmental changes in gamma-aminobutyric acid levels in attention-deficit/hyperactivity disorder. Transl Psychiatry. (2015) 5:e589. doi: 10.1038/tp.2015.79
24. Ende G, Cackowski S, Van Eijk J, Sack M, Demirakca T, Kleindienst N, et al. Impulsivity and aggression in female BPD and ADHD patients: association with ACC glutamate and GABA concentrations. Neuropsychopharmacology. (2016) 41:410–8. doi: 10.1038/npp.2015.153
25. Sterley T-L, Howells FM, Russell VA. Evidence for reduced tonic levels of GABA in the hippocampus of an animal model of ADHD, the spontaneously hypertensive rat. Brain Res. (2013) 1541:52–60. doi: 10.1016/j.brainres.2013.10.023
26. Tanaka M, Szabó Á, Vécsei L, Giménez-Llort L. Emerging translational research in neurological and psychiatric diseases: from. In Vitro In Vivo Models Int J Mol Sci. (2023) 24:15739. doi: 10.3390/ijms242115739
27. Gilbert DL, Isaacs KM, Augusta M, MacNeil LK, Mostofsky SH. Motor cortex inhibition: A marker of ADHD behavior and motor development in children. Neurology. (2011) 76:615–21. doi: 10.1212/WNL.0b013e31820c2ebd
28. Baimbridge KG, Miller JJ. Immunohistochemical localization of calcium-binding protein in the cerebellum, hippocampal formation and olfactory bulb of the rat. Brain Res. (1982) 245:223–9. doi: 10.1016/0006-8993(82)90804-6
29. Równiak M, Kolenkiewicz M, Kozłowska A. Parvalbumin, but not calretinin, neurons express high levels of α1-containing GABAA receptors, α7-containing nicotinic acetylcholine receptors and D2-dopamine receptors in the basolateral amygdala of the rat. J Chem Neuroanat. (2017) 86:41–51. doi: 10.1016/j.jchemneu.2017.08.002
30. Benes FM, Vincent SL, Molloy R. Dopamnine-Immunoreactive axon varicosities form nonrandom contacts with GABA-immunoreactive neurons of rat medial prefrontal cortex. Synapse. (1993) 15:285–95. doi: 10.1002/syn.890150405
31. Sesack S. Dopamine innervation of a subclass of local circuit neurons in monkey prefrontal cortex: ultrastructural analysis of tyrosine hydroxylase and parvalbumin immunoreactive structures. Cereb Cortex. (1998) 8:614–22. doi: 10.1093/cercor/8.7.614
32. Ohara PT, Granato A, Moallem TM, Wang BR, Tillet Y, Jasmin L. Dopaminergic input to GABAergic neurons in the rostral agranular insular cortex of the rat. J Neurocytol. (2003) 32:131–41. doi: 10.1023/B:NEUR.0000005598.09647.7f
33. Xu L, Zhang X-H. Distribution of D1 and D2-dopamine receptors in calcium-binding-protein expressing interneurons in rat anterior cingulate cortex. Sheng Li Xue Bao. (2015) 67:163–72.
34. Gulledge AT, Jaffe DB. Multiple effects of dopamine on layer V pyramidal cell excitability in rat prefrontal cortex. J Neurophysiol. (2001) 86:586–95. doi: 10.1152/jn.2001.86.2.586
35. Gorelova N, Seamans JK, Yang CR. Mechanisms of dopamine activation of fast-spiking interneurons that exert inhibition in rat prefrontal cortex. J Neurophysiol. (2002) 88:3150–66. doi: 10.1152/jn.00335.2002
36. Kröner S, Rosenkranz JA, Grace AA, Barrionuevo G. Dopamine modulates excitability of basolateral amygdala neurons. In Vitro J Neurophysiol. (2005) 93:1598–610. doi: 10.1152/jn.00843.2004
37. Freund TF, Martin KAC, Smith AD, Somogyi P. Glutamate decarboxylase-immunoreactive terminals of Golgi-impregnated axoaxonic cells and of presumed basket cells in synaptic contact with pyramidal neurons of the cat’s visual cortex. J Comp Neurol. (1983) 221:263–78. doi: 10.1002/cne.902210303
38. Defelipe J, Hendry SHC, Jones EG, Schmechel D. Variability in the terminations of GABAergic chandelier cell axons on initial segments of pyramidal cell axons in the monkey sensory-motor cortex. J Comp Neurol. (1985) 231:364–84. doi: 10.1002/cne.902310307
39. Viggiano D, Vallone D, Sadile A. Dysfunctions in dopamine systems and ADHD: evidence from animals and modeling. Neural Plast. (2004) 11:97–114. doi: 10.1155/NP.2004.97
40. Sagvolden T, Johansen EB. Rat models of ADHD. Curr Top Behav Neurosci. (2012) 9:301–15. doi: 10.1007/7854_2011_126
41. Arnsten AFT. ADHD and the prefrontal cortex. J Pediatr. (2009) 154(5):I–S43. doi: 10.1016/j.jpeds.2009.01.018
42. Mostofsky SH, Cooper KL, Kates WR, Denckla MB, Kaufmann WE. Smaller prefrontal and premotor volumes in boys with attention-deficit/hyperactivity disorder. Biol Psychiatry. (2002) 52:785–94. doi: 10.1016/S0006-3223(02)01412-9
43. Stanford C, Rosemary T. Behavioral Neuroscience of Attention Deficit Hyperactivity Disorder and Its Treatment Vol. 9. Berlin, Heidelberg: Springer (2012).
44. Kelsom C, Lu W. Development and specification of GABAergic cortical interneurons. Cell Biosci. (2013) 3:19. doi: 10.1186/2045-3701-3-19
45. Nahar L, Delacroix BM, Nam HW. The role of parvalbumin interneurons in neurotransmitter balance and neurological disease. Front Psychiatry. (2021) 12:679960. doi: 10.3389/fpsyt.2021.679960
46. Rupert DD, Shea SD. Parvalbumin-positive interneurons regulate cortical sensory plasticity in adulthood and development through shared mechanisms. Front Neural Circuits. (2022) 16. doi: 10.3389/fncir.2022.886629
47. Hafner G, Witte M, Guy J, Subhashini N, Fenno LE, Ramakrishnan C, et al. Mapping brain-wide afferent inputs of parvalbumin-expressing GABAergic neurons in barrel cortex reveals local and long-range circuit motifs. Cell Rep. (2019) 28:3450–3461.e8. doi: 10.1016/j.celrep.2019.08.064
48. Lee S, Hjerling-Leffler J, Zagha E, Fishell G, Rudy B. The largest group of superficial neocortical GABAergic interneurons expresses ionotropic serotonin receptors. J Neurosci Off J Soc Neurosci. (2010) 30:16796–808. doi: 10.1523/JNEUROSCI.1869-10.2010
49. Pfeffer CK. Inhibitory neurons: vip cells hit the brake on inhibition. Curr Biol. (2014) 24:R18–20. doi: 10.1016/j.cub.2013.11.001
50. Kim DI, Lee KH, Gabr AA, Choi GE, Kim JS, Ko SH, et al. Aβ-Induced Drp1 phosphorylation through Akt activation promotes excessive mitochondrial fission leading to neuronal apoptosis. Biochim Biophys Acta. (2016) 1863:2820–34. doi: 10.1016/j.bbamcr.2016.09.003
51. Fan X, Hess EJ. D2-like dopamine receptors mediate the response to amphetamine in a mouse model of ADHD. Neurobiol Dis. (2007) 26:201–11. doi: 10.1016/j.nbd.2006.12.011
52. Hsu J-W, Lee LC, Chen RF, Yen CT, Chen YS, Tsai ML. Striatal volume changes in a rat model of childhood attention-deficit/hyperactivity disorder. Psychiatry Res. (2010) 179:338–41. doi: 10.1016/j.psychres.2009.08.008
53. Doi H, Shinohara K. fNIRS studies on hemispheric asymmetry in atypical neural function in developmental disorders. Front Hum Neurosci. (2017) 11. doi: 10.3389/fnhum.2017.00137
54. Silk TJ, Vilgis V, Adamson C, Chen J, Smit L, Vance A, et al. Abnormal asymmetry in frontostriatal white matter in children with attention deficit hyperactivity disorder. Brain Imaging Behav. (2016) 10:1080–9. doi: 10.1007/s11682-015-9470-9
55. Nøvik TS, Hervas A, Ralston SJ, Dalsgaard S, Rodrigues Pereira R, et al. Influence of gender on attention-deficit/hyperactivity disorder in Europe – ADORE. Eur. Child Adolesc Psychiatry. (2006) 15:i15–24. doi: 10.1007/s00787-006-1003-z
56. Willcutt EG. The prevalence of DSM-IV attention-deficit/hyperactivity disorder: A meta-analytic review. Neurotherapeutics. (2012) 9:490–9. doi: 10.1007/s13311-012-0135-8
57. Tsai M-L, Kozłowska A, Li Y-S, Shen W-L, Huang ACW. Social factors affect motor and anxiety behaviors in the animal model of attention-deficit hyperactivity disorders: A housing-style factor. Psychiatry Res. (2017) 254:290–300. doi: 10.1016/j.psychres.2017.05.008
58. Hsieh Y-L, Yang C-C. Age-series characteristics of locomotor activities in spontaneously hypertensive rats: a comparison with the Wistar-Kyoto strain. Physiol Behav. (2008) 93:777–82. doi: 10.1016/j.physbeh.2007.11.032
59. Pinto YM, Paul M, Ganten D. Lessons from rat models of hypertension: from Goldblatt to genetic engineering. Cardiovasc Res. (1998) 39:77–88. doi: 10.1016/S0008-6363(98)00077-7
60. Równiak M, Bogus-Nowakowska K, Robak A. The densities of calbindin and parvalbumin, but not calretinin neurons, are sexually dimorphic in the amygdala of the Guinea pig. Brain Res. (2015) 1604:84–97. doi: 10.1016/j.brainres.2015.01.048
61. Kozłowska A, Wojtacha P, Równiak M, Kolenkiewicz M, Huang ACW. ADHD pathogenesis in the immune, endocrine and nervous systems of juvenile and maturating SHR and WKY rats. Psychopharmacol (Berl). (2019) 236:2937–58. doi: 10.1007/s00213-019-5180-0
62. Mullen RJ, Buck CR, Smith AM. NeuN, a neuronal specific nuclear protein in vertebrates. Dev Camb Engl. (1992) 116:201–11. doi: 10.1242/dev.116.1.201
63. Celio MR, Baier W, Schärer L, De Viragh PA, Gerday CH. Monoclonal antibodies directed against the calcium binding protein parvalbumin. Cell Calcium. (1988) 9:81–6. doi: 10.1016/0143-4160(88)90027-9
64. Schwaller B, Dick J, Dhoot G, Carroll S, Vrbova G, Nicotera P, et al. Prolonged contraction-relaxation cycle of fast-twitch muscles in parvalbumin knockout mice. Am J Physiol Cell Physiol. (1999) 276:C395–403. doi: 10.1152/ajpcell.1999.276.2.C395
65. Mészár Z, Girard F, Saper CB, Celio MR. The lateral hypothalamic parvalbumin-immunoreactive (PV1) nucleus in rodents. J Comp Neurol. (2012) 520:798–815. doi: 10.1002/cne.22789
66. Stojanovic T, Orlova M, Sialana FJ, Höger H, Stuchlik S, Milenkovic I, et al. Validation of dopamine receptor DRD1 and DRD2 antibodies using receptor deficient mice. Amino Acids. (2017) 49:1101–9. doi: 10.1007/s00726-017-2408-3
67. Bogus-Nowakowska K, Równiak M, Hermanowicz-Sobieraj B, Wasilewska B, Najdzion J, Robak A. Tyrosine hydroxylase-immunoreactivity and its relations with gonadotropin-releasing hormone and neuropeptide Y in the preoptic area of the Guinea pig. J Chem Neuroanat. (2016) 78:131–9. doi: 10.1016/j.jchemneu.2016.09.008
68. Salinas-Hernández XI, Vogel P, Betz S, Kalisch R, Sigurdsson T, Duvarci S. Dopamine neurons drive fear extinction learning by signaling the omission of expected aversive outcomes. eLife. (2009) 7:e38818. doi: 10.7554/eLife.38818
69. The Rat Brain in Stereotaxic Coordinates. Available online at: https://www.elsevier.com/books/the-rat-brain-in-stereotaxic-coordinates/paxinos/978-0-12-374121-9.
70. Celio MR. Parvalbumin in most gamma-aminobutyric acid-containing neurons of the rat cerebral cortex. Science. (1986) 231:995–7. doi: 10.1126/science.3945815
71. Sumner P, Edden RAE, Bompas A, Evans CJ, Singh KD. More GABA, less distraction: a neurochemical predictor of motor decision speed. Nat Neurosci. (2010) 13:825–7. doi: 10.1038/nn.2559
72. Ziemann U, Lönnecker S, Steinhoff BJ, Paulus W. The effect of lorazepam on the motor cortical excitability in man. Exp Brain Res. (1996) 109:127–35. doi: 10.1007/BF00228633
73. Packer AM, Yuste R. Dense, unspecific connectivity of neocortical parvalbumin-positive interneurons: A canonical microcircuit for inhibition? J Neurosci. (2011) 31:13260–71. doi: 10.1523/JNEUROSCI.3131-11.2011
74. Hu H, Gan J, Jonas P. Fast-spiking, parvalbumin + GABAergic interneurons: From cellular design to microcircuit function. Science. (2014) 345:1255263. doi: 10.1126/science.1255263
75. Schmitt LI, Wimmer RD, Nakajima M, Happ M, Mofakham S, Halassa MM. Thalamic amplification of cortical connectivity sustains attentional control. Nature. (2017) 545:219–23. doi: 10.1038/nature22073
76. Selimbeyoglu A, Kim CK, Inoue M, Lee SY, Hong ASO, Kauvar I, et al. Modulation of prefrontal cortex excitation/inhibition balance rescues social behavior in CNTNAP2 -deficient mice. Sci Transl Med. (2017) 9:eaah6733. doi: 10.1126/scitranslmed.aah6733
77. Kvitsiani D, Ranade S, Hangya B, Taniguchi H, Huang JZ, Kepecs A. Distinct behavioural and network correlates of two interneuron types in prefrontal cortex. Nature. (2013) 498:363–6. doi: 10.1038/nature12176
78. Ferguson BR, Gao W-J. Thalamic control of cognition and social behavior via regulation of gamma-aminobutyric acidergic signaling and excitation/inhibition balance in the medial prefrontal cortex. Biol Psychiatry. (2018) 83:657–69. doi: 10.1016/j.biopsych.2017.11.033
79. Ferguson BR, Gao W-J. PV interneurons: critical regulators of E/I balance for prefrontal cortex-dependent behavior and psychiatric disorders. Front Neural Circuits. (2018) 12:37. doi: 10.3389/fncir.2018.00037
80. Lewis DA, Curley AA, Glausier JR, Volk DW. Cortical parvalbumin interneurons and cognitive dysfunction in schizophrenia. Trends Neurosci. (2012) 35:57–67. doi: 10.1016/j.tins.2011.10.004
81. Gao R, Penzes P. Common mechanisms of excitatory and inhibitory imbalance in schizophrenia and autism spectrum disorders. Curr Mol Med. (2015) 15:146–67. doi: 10.2174/1566524015666150303003028
82. Boy F, Evans CJ, Edden RA, Singh KD, Husain M, Sumner. Individual differences in subconscious motor control predicted by GABA concentration in SMA. Curr Biol. (2010) 20:1779–85. doi: 10.1016/j.cub.2010.09.003
83. Miller EM, Pomerleau F, Huettl P, Gerhardt GA, Glaser PEA. Aberrant glutamate signaling in the prefrontal cortex and striatum of the spontaneously hypertensive rat model of attention-deficit/hyperactivity disorder. Psychopharmacol (Berl). (2014) 231:3019–29. doi: 10.1007/s00213-014-3479-4
84. Bauer J, Werner A, Kohl W, Kugel H, Shushakova A, Pedersen A, et al. Hyperactivity and impulsivity in adult attention-deficit/hyperactivity disorder is related to glutamatergic dysfunction in the anterior cingulate cortex. World J Biol Psychiatry. (2018) 19:538–46. doi: 10.1080/15622975.2016.1262060
85. Fuller RW, Hemrick-Luecke SK, Wong DT, Pearson D, Threlkeld PG, Hynes MD 3rd, et al. Altered behavioral response to a D2 agonist, LY141865, in spontaneously hypertensive rats exhibiting biochemical and endocrine responses similar to those in normotensive rats. J Pharmacol Exp Ther. (1983) 227:354–9.
86. Van den Buuse M, Jones CR, Wagner J. Brain dopamine D-2 receptor mechanisms in spontaneously hypertensive rats. Brain Res Bull. (1992) 28:289–97. doi: 10.1016/0361-9230(92)90190-9
87. Linthorst AC, De Jong W, De Boer T, Versteeg DH. Dopamine D1 and D2 receptors in the caudate nucleus of spontaneously hypertensive rats and normotensive Wistar-Kyoto rats. Brain Res. (1993) 602:119–25. doi: 10.1016/0006-8993(93)90250-Q
88. Chiu P, Rajakumar G, Chiu S, Kwan C-Y, Mishra RK. Enhanced [3H]spiroperidol binding in striatum of spontaneously hypertensive rat (SHR). Eur J Pharmacol. (1982) 82:243–4. doi: 10.1016/0014-2999(82)90522-2
89. Chiu P, Rajakumar G, Chiu S, Kwan C-Y, Mishra RK. Differential changes in central serotonin and dopamine receptors in spontaneous hypertensive rats. Prog Neuropsychopharmacol Biol Psychiatry. (1984) 8:665–8. doi: 10.1016/0278-5846(84)90033-2
90. Lim DK, Ito Y, Hoskins B, Rockhold RW, Ho IK. Comparative studies of muscarinic and dopamine receptors in three strains of rat. Eur J Pharmacol. (1989) 165:279–87. doi: 10.1016/0014-2999(89)90722-X
91. Kirouac GJ, Ganguly PK. Up-regulation of dopamine receptors in the brain of the spontaneously hypertensive rat: an autoradiographic analysis. Neuroscience. (1993) 52:135–41. doi: 10.1016/0306-4522(93)90188-L
92. Arnsten AFT, Wang M, Paspalas CD. Dopamine’s actions in primate prefrontal cortex: challenges for treating cognitive disorders. Pharmacol Rev. (2015) 67:681–96. doi: 10.1124/pr.115.010512
93. Le Moine C, Gaspar P. Subpopulations of cortical GABAergic interneurons differ by their expression of D1 and D2 dopamine receptor subtypes. Brain Res Mol Brain Res. (1998) 58:231–6. doi: 10.1016/S0169-328X(98)00118-1
94. Fan X, Xu M, Hess EJ. D2 dopamine receptor subtype-mediated hyperactivity and amphetamine responses in a model of ADHD. Neurobiol Dis. (2010) 37:228–36. doi: 10.1016/j.nbd.2009.10.009
95. Konofal E, Arnulf I, Lecendreux M, Mouren M-C. Ropinirole in a child with attention-deficit hyperactivity disorder and restless legs syndrome. Pediatr Neurol. (2005) 32:350–1. doi: 10.1016/j.pediatrneurol.2004.11.007
96. Walters AS, Mandelbaum DE, Lewin DS, Kugler S, England SJ, Miller M. Dopaminergic therapy in children with restless legs/periodic limb movements in sleep and ADHD. Dopaminergic Therapy Study Group. Pediatr Neurol. (2000) 22:182–6. doi: 10.1016/S0887-8994(99)00152-6
97. Gilbert DL, Dure L, Sethuraman G, Raab D, Lane J, Sallee FR. Tic reduction with pergolide in a randomized controlled trial in children. Neurology. (2003) 60:606–11. doi: 10.1212/01.WNL.0000044058.64647.7E
98. Quinn R. Comparing rat’s to human’s age: how old is my rat in people years? Nutr Burbank Los Angel Cty Calif. (2005) 21:775–7. doi: 10.1016/j.nut.2005.04.002
99. Leo D, Sorrentino E, Volpicelli F, Eyman M, Greco D, Viggiano D, et al. Altered midbrain dopaminergic neurotransmission during development in an animal model of ADHD. Neurosci Biobehav Rev. (2003) 27:661–9. doi: 10.1016/j.neubiorev.2003.08.009
100. Zhou R-Y, Wang JJ, You Y, Sun JC, Song YC, Yuan HX, et al. Effect of baicalin on ATPase and LDH and its regulatory effect on the AC/cAMP/PKA signaling pathway in rats with attention deficit hyperactivity disorder. Zhongguo Dang Dai Er Ke Za Zhi Chin J Contemp Pediatr. (2017) 19:576–82. doi: 10.7499/j.issn.1008-8830.2017.05.020
101. King JA, Barkley RA, Delville Y, Ferris CF. Early androgen treatment decreases cognitive function and catecholamine innervation in an animal model of ADHD. Behav Brain Res. (2000) 107:35–43. doi: 10.1016/S0166-4328(99)00113-8
102. Paus T. Mapping brain maturation and cognitive development during adolescence. Trends Cogn Sci. (2005) 9:60–8. doi: 10.1016/j.tics.2004.12.008
103. Casey BJ, Jones RM, Hare TA. The adolescent brain. Ann N Y Acad Sci. (2008) 1124:111–26. doi: 10.1196/annals.1440.010
104. Caballero A, Granberg R, Tseng KY. Mechanisms contributing to prefrontal cortex maturation during adolescence. Neurosci Biobehav Rev. (2016) 70:4–12. doi: 10.1016/j.neubiorev.2016.05.013
105. Reynolds LM, Pokinko M, Torres-Berrío A, Cuesta S, Lambert LC, Del Cid Pellitero E, et al. DCC receptors drive prefrontal cortex maturation by determining dopamine axon targeting in adolescence. Biol Psychiatry. (2018) 83:181–92. doi: 10.1016/j.biopsych.2017.06.009
106. Shaw P, Eckstrand K, Sharp W, Blumenthal J, Lerch JP, Greenstein D, et al. Attention-deficit/hyperactivity disorder is characterized by a delay in cortical maturation. Proc Natl Acad Sci USA. (2007) 104:19649–54. doi: 10.1073/pnas.0707741104
107. Vaidya CJ. Neurodevelopmental abnormalities in ADHD. Curr Top Behav Neurosci. (2012) 9:49–66. doi: 10.1007/7854_2011_138
108. Uylings HB, van Eden CG. Qualitative and quantitative comparison of the prefrontal cortex in rat and in primates, including humans. Prog Brain Res. (1990) 85:31–62. doi: 10.1016/s0079-6123(08)62675-8
109. Uylings HBM, Groenewegen HJ, Kolb B. Do rats have a prefrontal cortex? Behav Brain Res. (2003) 146:3–17. doi: 10.1016/j.bbr.2003.09.028
110. Lapish CC, Durstewitz D, Chandler LJ, Seamans JK. Successful choice behavior is associated with distinct and coherent network states in anterior cingulate cortex. Proc Natl Acad Sci U S A. (2008) 105:11963–8. doi: 10.1073/pnas.0804045105
111. Cowen SL, McNaughton BL. Selective delay activity in the medial prefrontal cortex of the rat: contribution of sensorimotor information and contingency. J Neurophysiol. (2007) 98:303–16. doi: 10.1152/jn.00150.2007
112. Euston DR, McNaughton BL. Apparent encoding of sequential context in rat medial prefrontal cortex is accounted for by behavioral variability. J Neurosci Off J Soc Neurosci. (2006) 26:13143–55. doi: 10.1523/JNEUROSCI.3803-06.2006
113. Quintana J, Fuster JM. Mnemonic and predictive functions of cortical neurons in a memory task. Neuroreport. (1992) 3:721–4. doi: 10.1097/00001756-199208000-00018
114. Puts NA, Ryan M, Oeltzschner G, Horska A, Edden RAE, Mahone EM. Reduced striatal GABA in unmedicated children with ADHD at 7T. Psychiatry Res Neuroimaging. (2020) 301:111082. doi: 10.1016/j.pscychresns.2020.111082
Keywords: attention-deficit/hyperactivity disorder, cortex, parvalbumin, dopamine receptor, tyrosine hydroxylase, spontaneously hypertensive rat, GABAergic system, animal model
Citation: Bogdańska-Chomczyk E, Równiak M, Huang AC-W and Kozłowska A (2024) Parvalbumin interneuron deficiency in the prefrontal and motor cortices of spontaneously hypertensive rats: an attention-deficit hyperactivity disorder animal model insight. Front. Psychiatry 15:1359237. doi: 10.3389/fpsyt.2024.1359237
Received: 21 December 2023; Accepted: 15 February 2024;
Published: 27 March 2024.
Edited by:
Rachita Yadav, Massachusetts General Hospital and Harvard Medical School, United StatesReviewed by:
Masaru Tanaka, University of Szeged (ELKH-SZTE), HungaryJoana Gonçalves, University of Coimbra, Portugal
Copyright © 2024 Bogdańska-Chomczyk, Równiak, Huang and Kozłowska. This is an open-access article distributed under the terms of the Creative Commons Attribution License (CC BY). The use, distribution or reproduction in other forums is permitted, provided the original author(s) and the copyright owner(s) are credited and that the original publication in this journal is cited, in accordance with accepted academic practice. No use, distribution or reproduction is permitted which does not comply with these terms.
*Correspondence: Ewelina Bogdańska-Chomczyk, ewelina.bogdanskachomczyk@student.uwm.edu.pl
†Deceased