 Abdul Razak M. S.
 C. R. Nirmala1
- 1Visvesvaraya Technological University, Belgaum, India
- 2Department of Software Engineering, College of Computer Science & Engineering, University of Jeddah, Jeddah, Saudi Arabia
A financial market is a platform to produce data streams continuously and around 1. 145 Trillion MB of data per day. Estimation and the analysis of unknown or dynamic behaviors of these systems is one the challenging tasks. Analysis of these systems is very much essential to strengthen the environmental parameters to stabilize society activities. This can elevate the living style of society to the next level. In this connection, the proposed paper is trying to accommodate the financial data stream using the sliding window approach and random forest algorithm to provide a solution to handle concept drift in the financial market to stabilize the behavior of the system through drift estimation. The proposed approach provides promising results in terms of accuracy in detecting concept drift over the state of existing drift detection methods like one class drifts detection (OCDD), Adaptive Windowing ADWIN), and the Page-Hinckley test.
Introduction
A financial market is a place for trading where the buyers and sellers make their transactions. The financial market includes stocks, bonds, derivatives, foreign exchange, and commodities. The data from the financial market is now available in a stream fashion and the analysis of the data has to be done at run time. The users in the financial market use these analyzed results for the purchase of goods or to sell their goods (Yoo et al., 2005). A financial market is very dynamic and there are a lot of fluctuations due to environmental factors and also due to some hidden factors (Fdez-Riverola et al., 2007). The AI model developed to predict the financial market will become obsolete due to changes in the financial market. These changes have to identify and have to be informed to users for their intelligent trading. Concept drift is the term used to describe the target changes involved in data (Gama et al., 2014). If there is concept drift, then the model accuracy will decrease and the model misclassifies the data. Whenever a concept drift occurs in the data then we need to identify and update the model with recent data. In our work, we will address how to handle concept drift by monitoring the performance of the classifier using a sliding window, random forest algorithm, and Hoeffding decision tree for anytime classification of financialdata streams.
Concept drift can be categorized as (Gama et al., 2014):
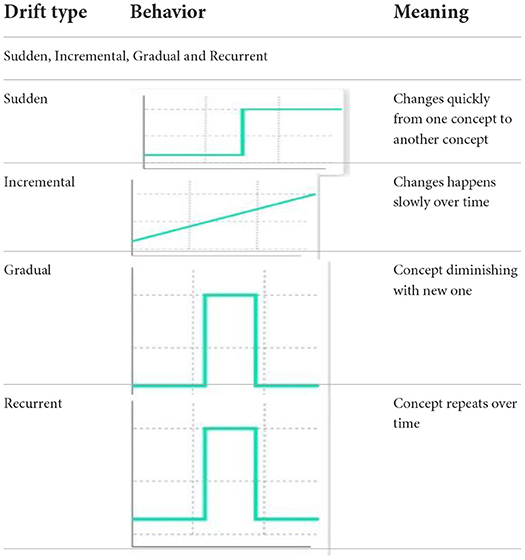
Above Table 1 summarizes the different types error-based classification algorithms available to handle the different types of concept drift.
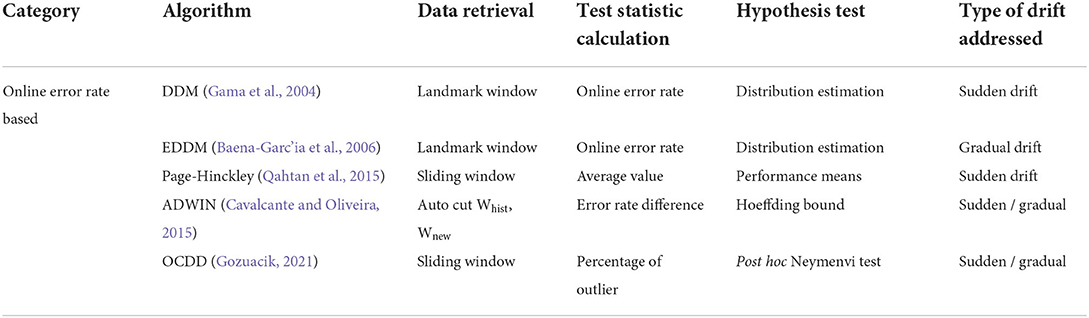
Table 1. Summary of Drift Detection algorithms (Firas et al., 2022).
There are five ways to deal with concept drift (Das, 2021):
• Online learning: The learner is regularly updated as the model processes each sample. Online learning is the most popular method for reducing concept drift in real-world applications.
• Periodically retrain: The model is activated when the model's performance falls below a predetermined level or when the average confidence score between two windows of data shows a significant drift.
• Periodically re-train on a representative sub-sample: The sample selects sub-samples from a large population in such a way that a portion of the sub-sampling sample represents the entire population. If concept drift is discovered, employ an instance selection strategy that employs the same probability distribution as the original data. Humans change the labels in the current dataset to fine-tune the model.
• Ensemble learning with model weighting: Multiple models are grouped together, and the weighted average of the individual model outputs is used as the overall output.
• Feature dropping: Another method for dealing with concept drift is feature dropping. Using a single feature, multiple models are built at the same time, and where the AUC-ROC response is inadequate, those features are dropped.
Contribution of work
• A framework to detect concept drift in financial data streams by monitoring the performance of the model developed using a random forest algorithm and sliding window.
• Builds a decision tree incrementally using the Hoeffding tree for anytime classification and reset the tree once the drift is detected.
• Accuracy comparison of the proposed framework with one class drifts detection (OCDD), Page-Hinckley, and Adaptive Windowing (ADWIN) methods.
• Addresses the statistical significance of proposed framework using the Mcnemar's test.
Organization of the paper
Chapter 1 gives the details about the introduction of our work. Chapter 2 gives the details about the literature methodology which will provide the essentials of our work. Chapter 3 addresses the background review of our topic which insights into the work carried out to detect concept drift in financial market data. Chapter 4 gives the process of our work i.e., the methodology we follow for the detection of concept drift. Chapter 5 provides the results of our work and comparison with the existing methods of drift detection. Chapter 6 gives the details about open research issues and research trends and chapter 7 details the future work to be done and chapter 8 gives the conclusion.
Literature methodology
The survey framework designed for the literature is as shown in Figure 1. The literature review process involves the following horizons. Table 2 describes the extensive literature work carried out by different authors and also mentioned the limitations of their work.
• Data collection for financial market data.
• Data collection for sliding window and random forest classifier.
• Stream classifier for incremental tree building.
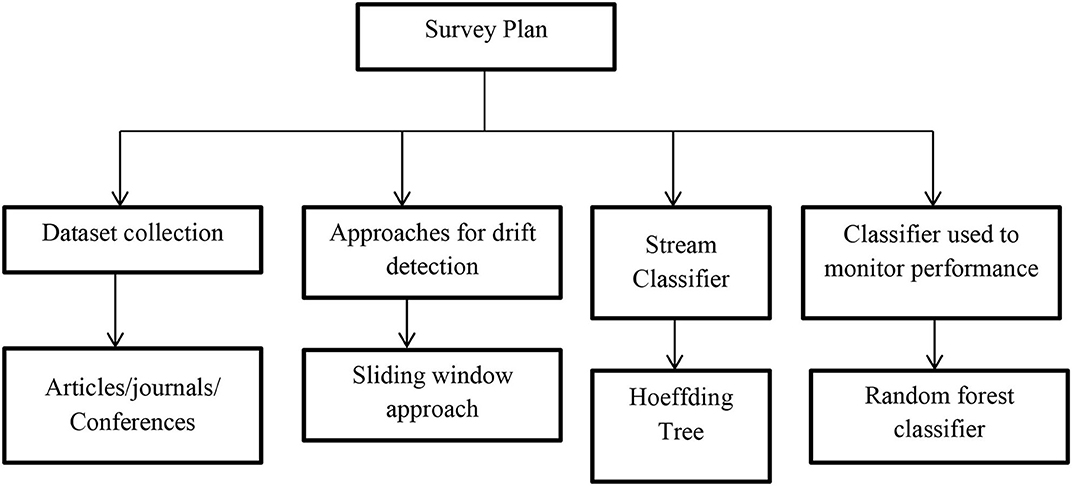
Figure 1. Literature methodology.
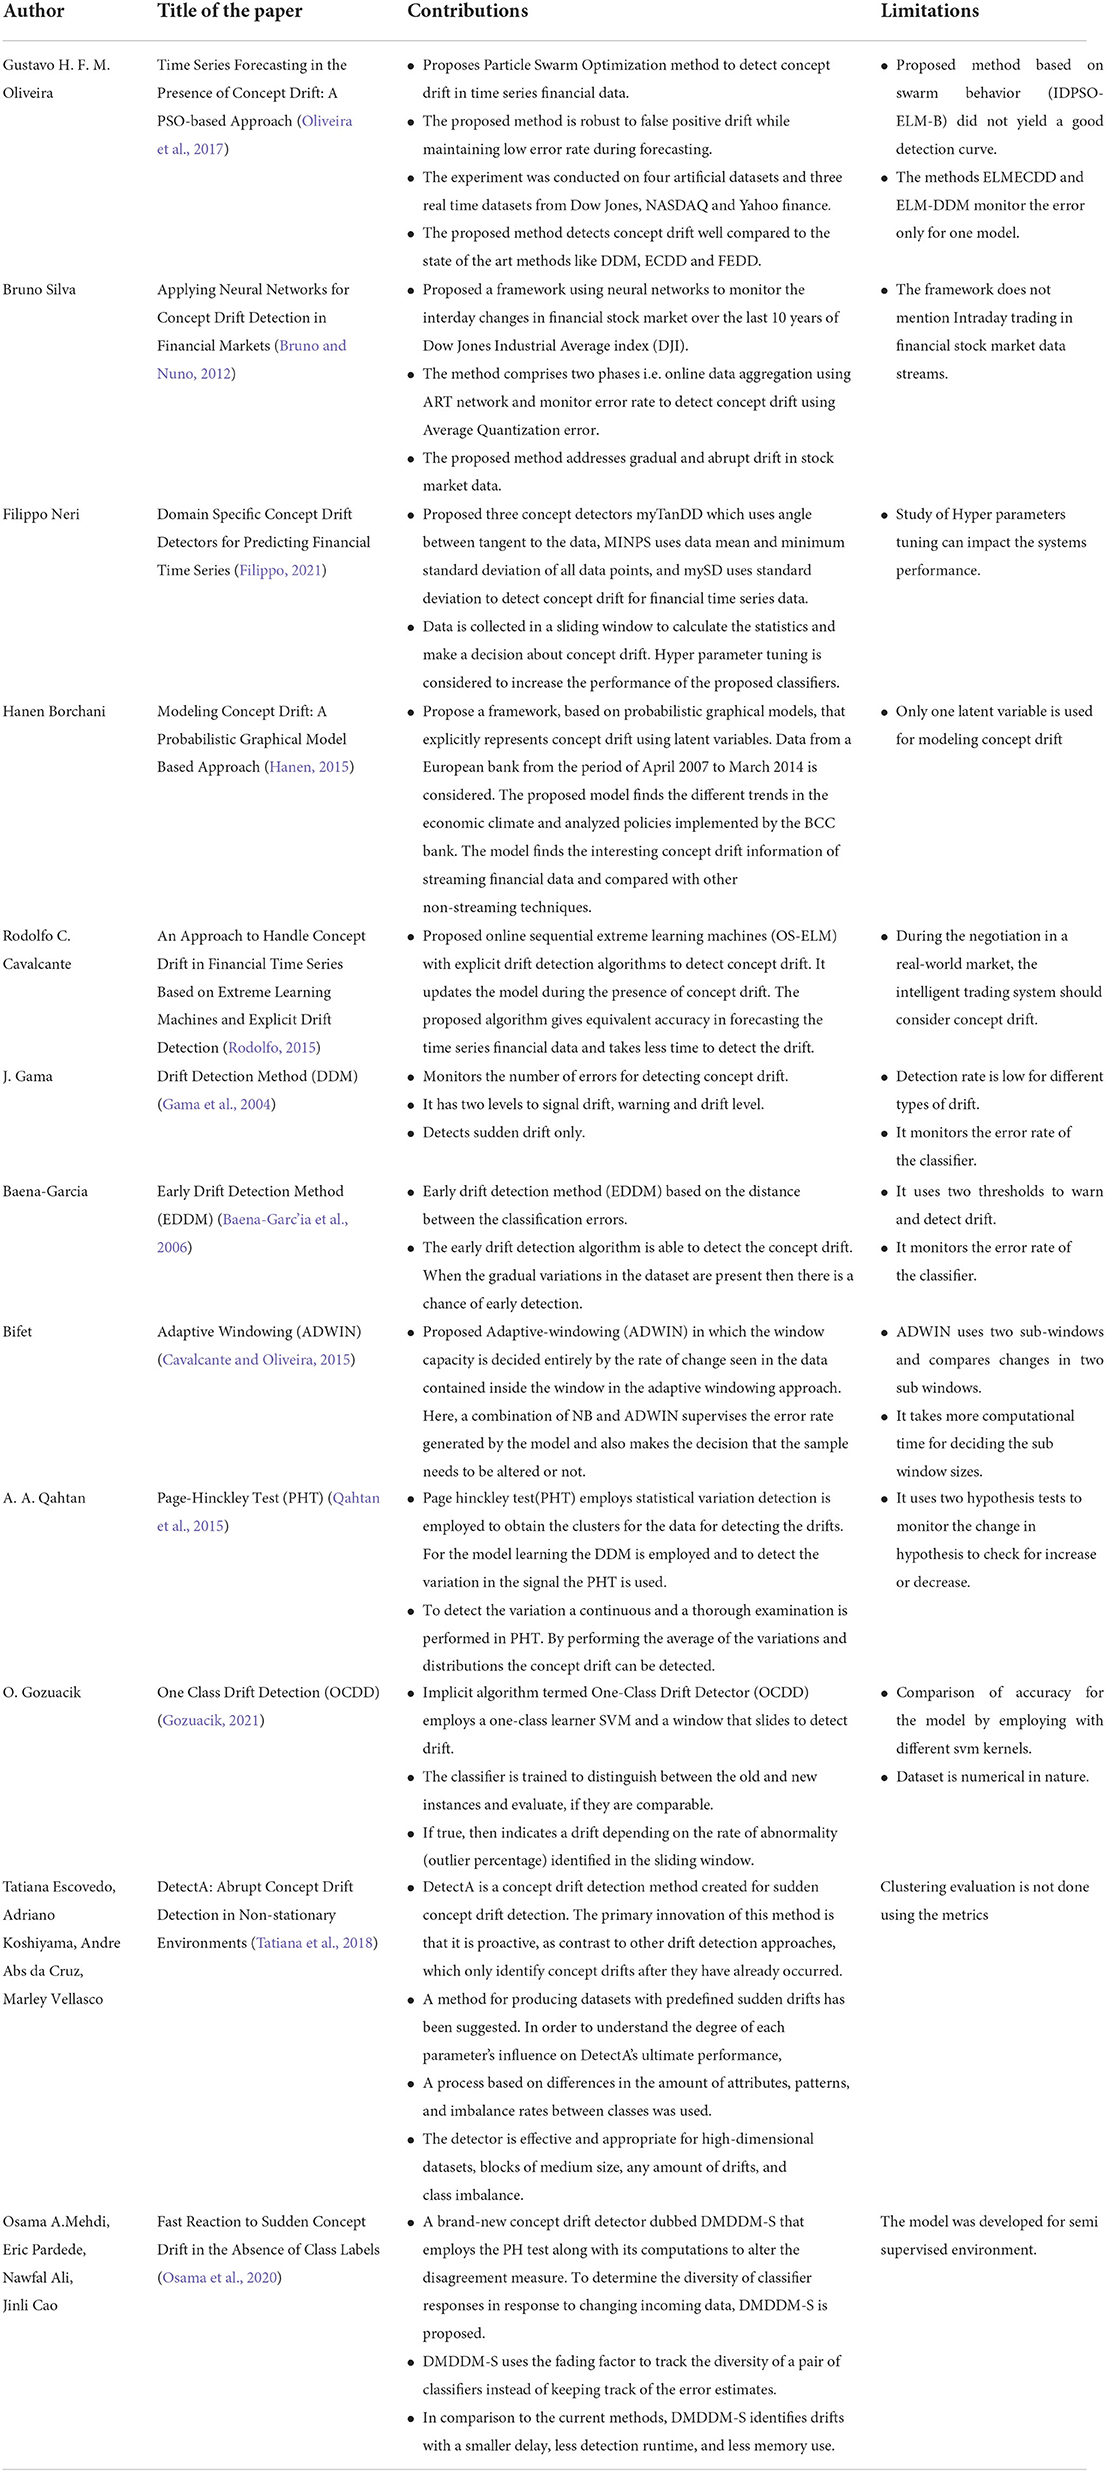
Table 2. Literature.
Background review
Methodology
As shown in Figure 2, the data blocks are read to the model in a streaming fashion [4] and the random forest algorithm is used to develop the AI model and the performance of the model is monitored through classification metrics. If the accuracy of the model is less than the threshold then the model is rebuilt over the new data. We read each instance in the window and start to build the Hoeffding tree incrementally using the Hoeffding stream classifier. Once the data in the window is full the window is subjected to a random forest algorithm to monitor the performance of the model. If the performance of the classifier is below the threshold value then concept drift is signaled and the current tree builds incrementally used for making decisions will be discarded and in the window, a new space will be made to fill out the new samples to reflect the current distribution.
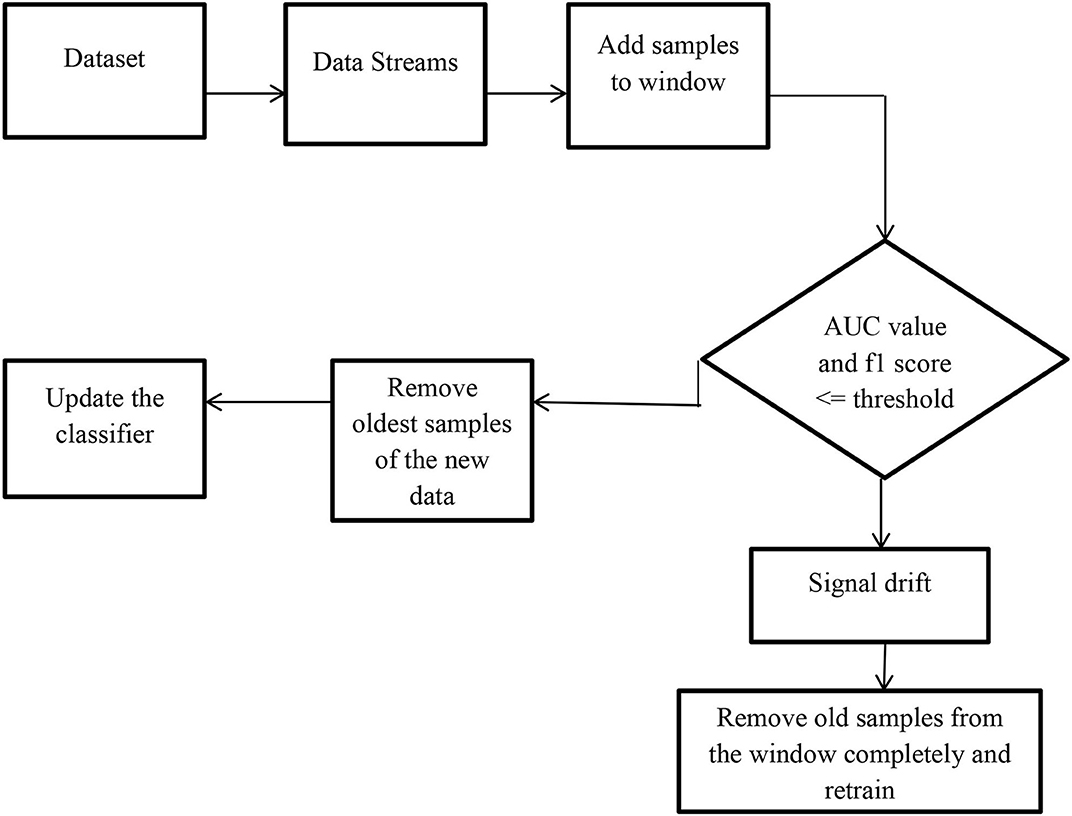
Figure 2. Framework to detect sudden concept drift in data streams.
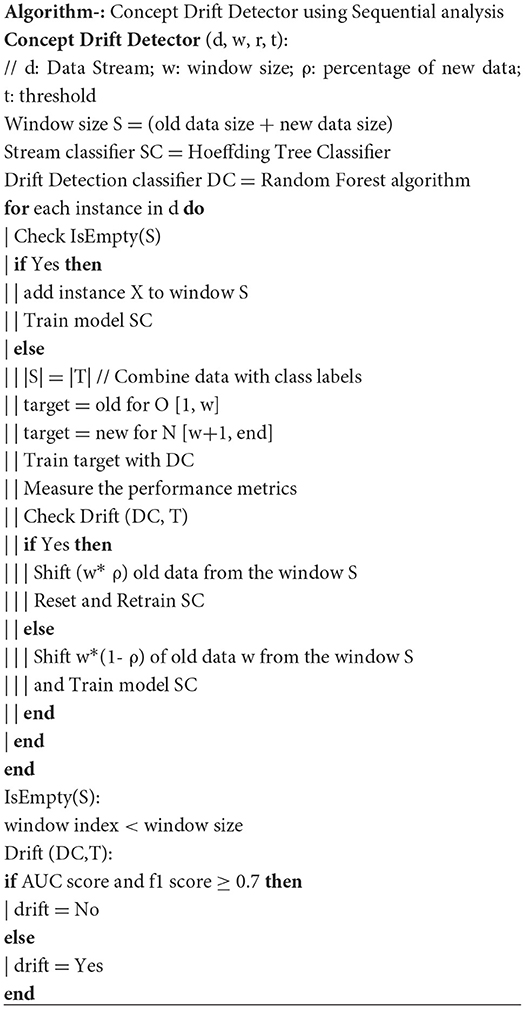
Algorithm
Step 1: Read data incrementally into the defined window size until the window becomes full.
Step 2: Train the model with the current window data using the Random forest algorithm and measure the performance of the model. If the performance of the model is less than the defined threshold then signal drift and go to step 3 else go to step 4.
Step 3: If there is a drift in the window data then remove the w* ρ samples completely from the window and go to step 1.
Step 4: If there is no drift then remove w*(1- ρ) data samples from the window and go to step 1.
Step 5: If there are no samples remaining from the incoming data source then go to step 6.
Step 6: Exit.
Pseudo code
Results and discussions
Dataset description
The dataset characteristics is presented in Table 3. The data is collected weekly from the poll done by the American association of individual investors and the dataset contains information from January 1st, 2003 to December 31st' 2020 from three different countries China, India, and UAE. The dataset contains the description of the US sentiment investors, Measure of Variability (spread) and US returns collected weekly, social and cultural development indicators like Human development, Gross development and Population growth (yearly), and other Sectors–Value Added (VA) as % GDP in achieving UN SDG 3 (Health and Wellbeing) & SDG 8 (Growth & Economic Development) like Human Development Index (HDI), Current Health Expenditure (CHE) as a percentage of GDP, and per capita, health expenditure in constant US$ are all factors in the health sector, Macro-Economic factors like risk rate, foreign direct investment, GDP (annual growth) and Inflation and also includes economic crisis and pandemic events as shown in Figure 3.
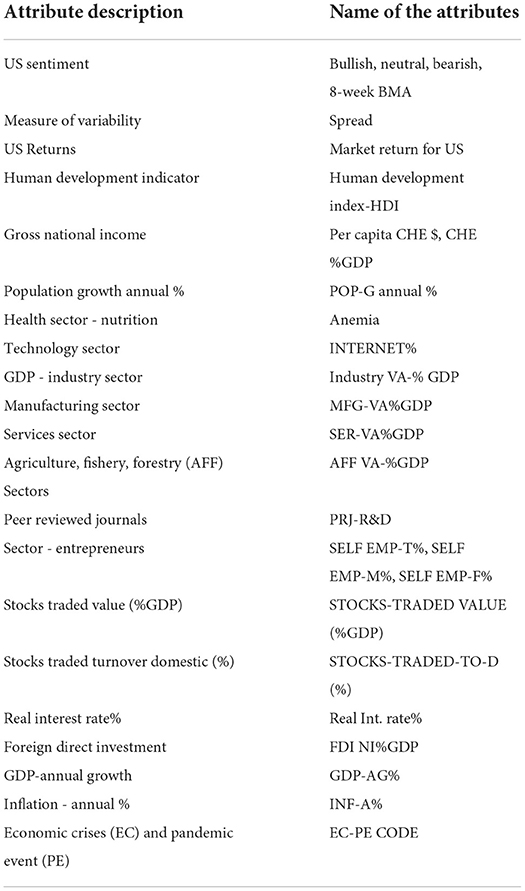
Table 3. Dataset features overview [18-23].
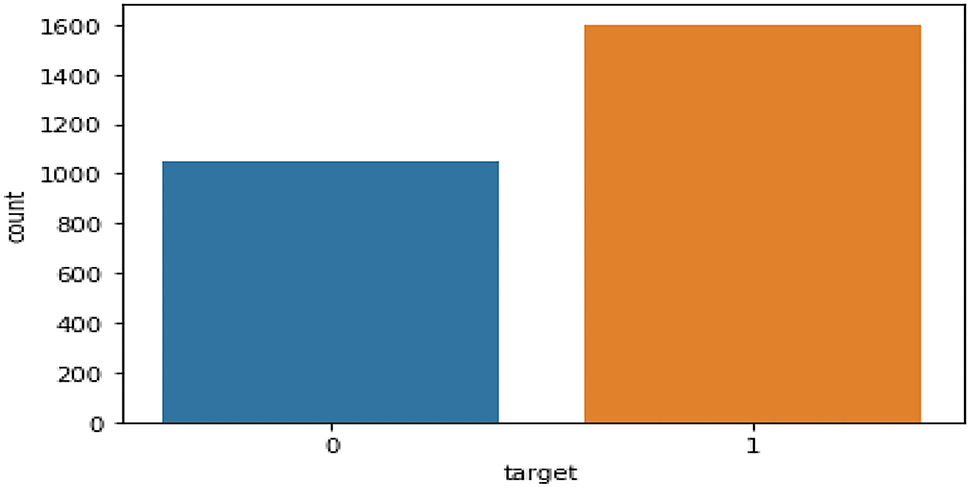
Figure 3. Data distribution of target variable.
The classification task is to tell whether the country (China, India, and UAE) is going to retain their investors every week. (1 - Yes and 0 - No) as shown in Figure 4. Table 3 describes the Dataset features1, 2, 3, 4, 5, 6, 7 used by the authors for their implementation.
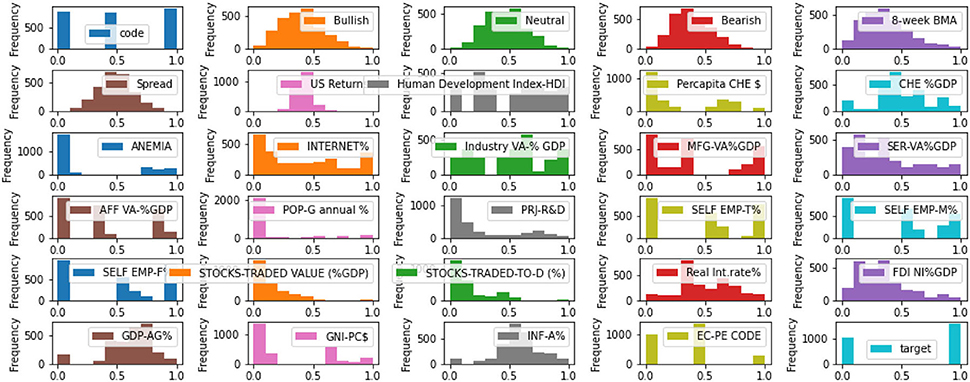
Figure 4. Data distribution of features.
Classification metrics
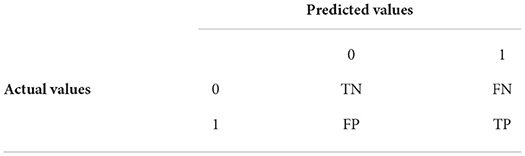
TP = True Positive, FP = False Positive
TN = True Negative, FN = False Negative
Accuracy = TP + TN / TP + TN + FP + FN
Precision = TP / TP + FP
Recall = TP / TP + FN
F1-score = 2*precision*Recall / Precision + Recall
Macro-avg is the mean average of the F1 score of all classes.
Macro-avg = (F1 score of class 0 + F1 score of class 1) / 2.
Tables 4–6 describes the accuracy metrics for different data blocks. The weighted-average is calculated by taking the mean of all per-class F1 scores while considering each class's support.

Table 4. Classification report for Figure 5A TP = 116, FN = 64, FP = 69, TN = 76.

Table 5. Classification report for Figure 5B TP = 124, FN = 87, FP = 76, TN = 113.
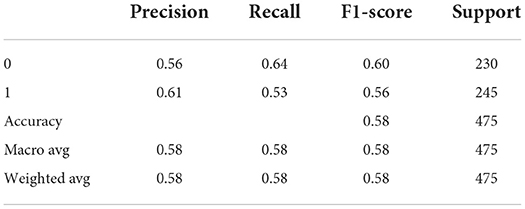
Table 6. Classification report for Figure 5C TP = 129, FN = 116, FP = 83, TN = 147.
Example: Classification report for Figure 5A TP = 116, FN = 64, FP = 69, TN = 76
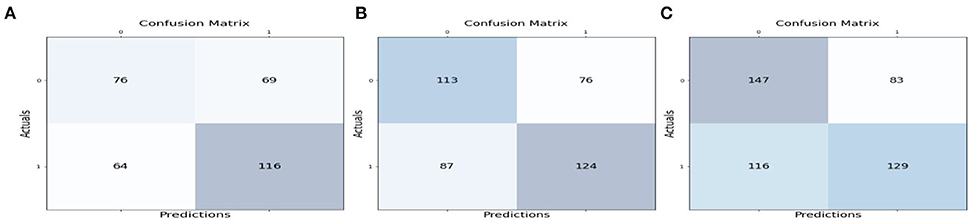
Figure 5. Confusion matrix values for the first three streaming blocks of data.
Macro Average = (F1 score of+ class 0 + F1 score of class 1) / 2.
= (0.53 +0.64) / 2 = 0.58
Weighted Average = Mean of all per-class F1 scores while considering each class's support.
= (0.53 * (145/325) + 0.64 * (180 /325))
= 0.59
Similar to Figure 5A, the calculation for macro average and weighted average will be done for 5B and C.
Table 7 displays the comparison bar graph between the proposed concept drift detection framework results and OCDD method results for different hyperparameter values like window size, threshold, and percentage of data in the sliding window. In comparison, the proposed framework gives good results for the accuracy metric over OCDD for smaller window sizes i.e. from window sizes 25 to 250.
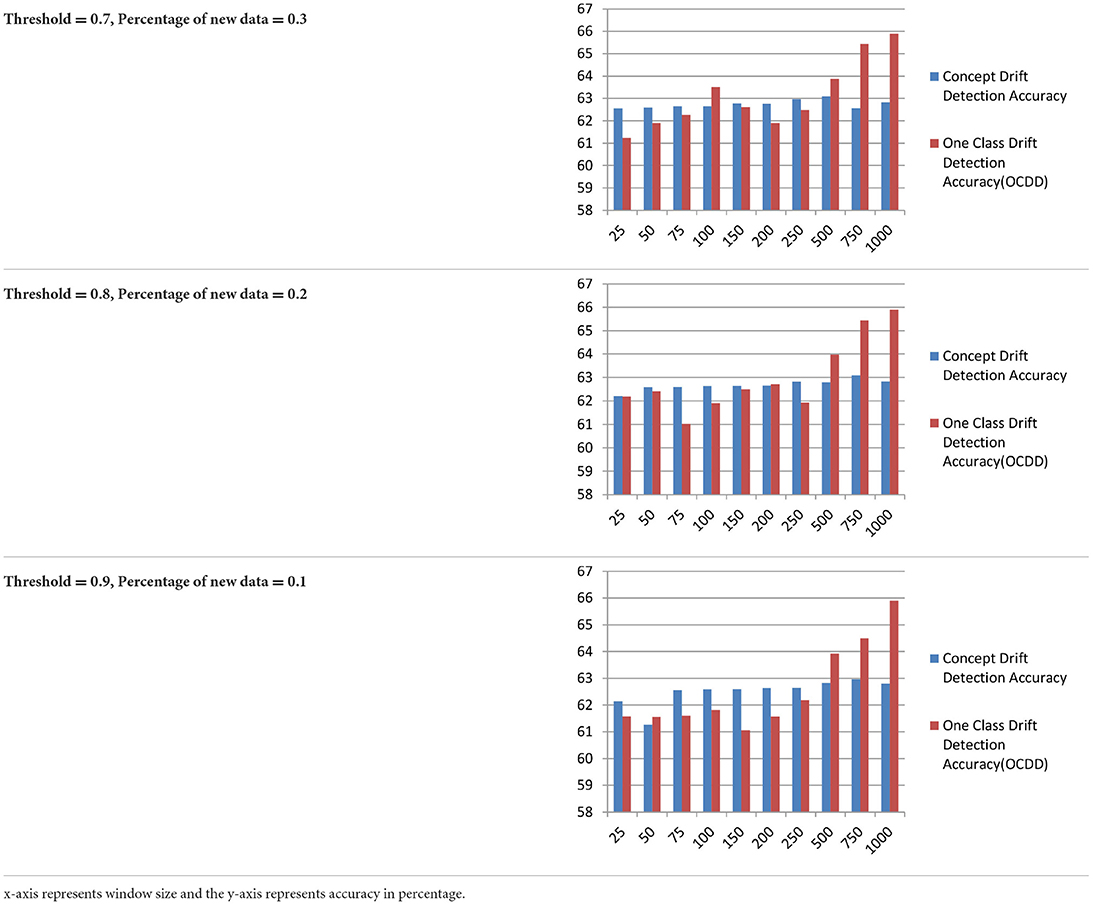
Table 7. Accuracy comparison of proposed concept drift detection technique with once class drift detection (OCDD) for different values of hyperparameters like window size, percentage of new data, and threshold.
The above Figures 6A–C diagrams depict the accuracy graph of the proposed concept drift detection technique for different hyperparameter values. The x-axis displays the percentage of data and the y-axis displays the accuracy. Whenever the accuracy of the model declines below 0.7 then concept drift will be signaled and the percentage of data will be added to the sliding window.
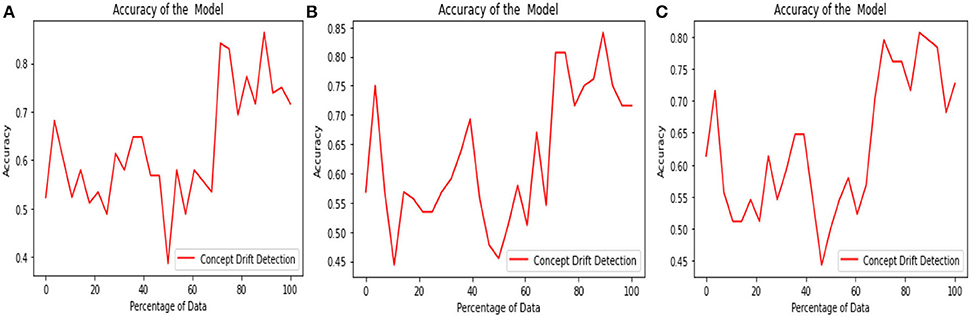
Figure 6. Accuracy Graph of proposed concept drift detection technique for window size =250, percentage of new data = [0.1, 0.2, and 0.3] and threshold = [0.9, 0.8, and 0.7].
The above Figures 7A–C diagrams depict the accuracy graph of one class drift detection technique for different hyperparameter values. The x-axis displays the percentage of data and the y-axis displays the accuracy.
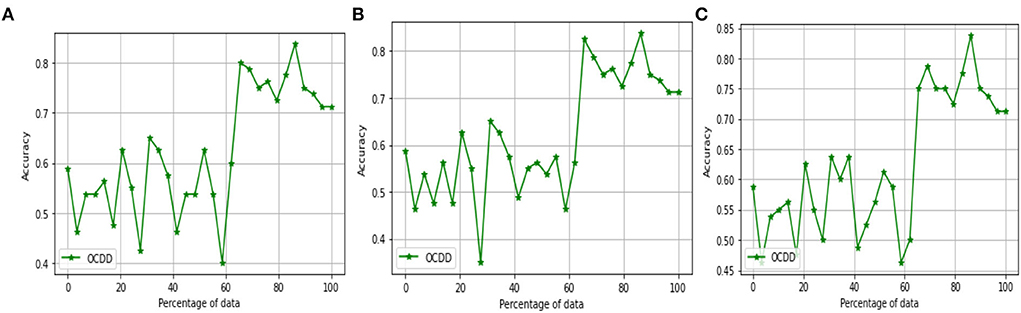
Figure 7. Accuracy Graph of one class drift detection technique [OCDD] for window size =250, percentage of new data = [0.1, 0.2, and 0.3] and threshold = [0.9, 0.8, and 0.7].
Figure 8 depicts the comparison of the proposed concept drift detector technique with the Page-Hinkley method and window-based method ADWIN. In comparison, the proposed method outstands in accuracy for different values of window size.
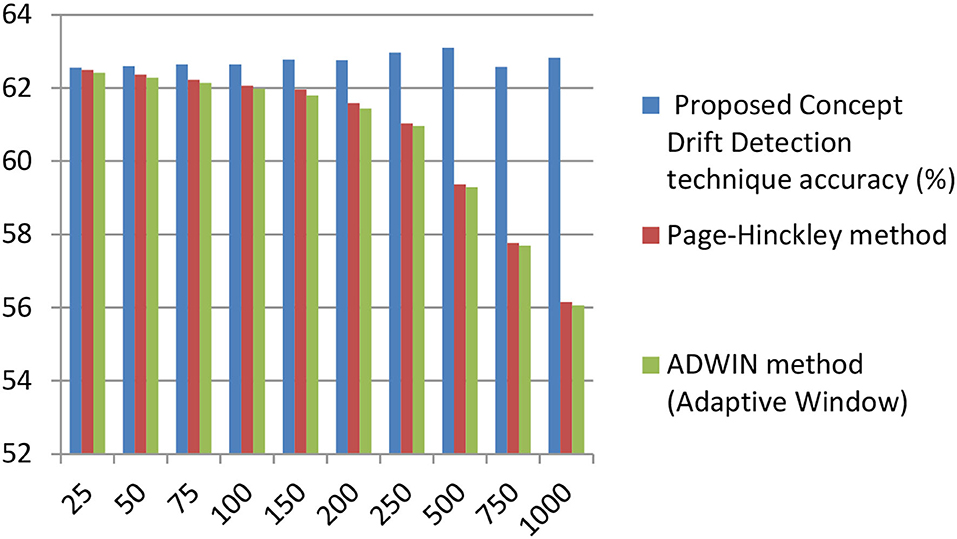
Figure 8. Accuracy comparison of proposed concept drift detector technique with Page –Hinckley, and ADWIN (adaptive window) method for varying window size. (x-axis represents window size and the y-axis represents accuracy).
A random forest algorithm is used in the proposed solution to develop the AI model and to monitor the performance. We have tuned the tree depth to create an appropriate balance between bias and variance to get the optimum generalization performance.
The following Tables 8–10 describe the tuning of the tree depth for the window size w =250 for threshold ε {0.7, 0.8, 0.9} and percentage of new data (ρ)ε {0.3, 0.2, 0.1}
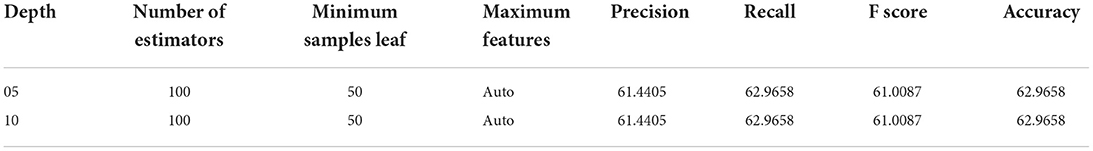
Table 8. Window size = 250, Threshold = 0.7 Percentage of new data = 0.3.

Table 9. Window size = 250, Threshold = 0.8 Percentage of new data = 0.2.
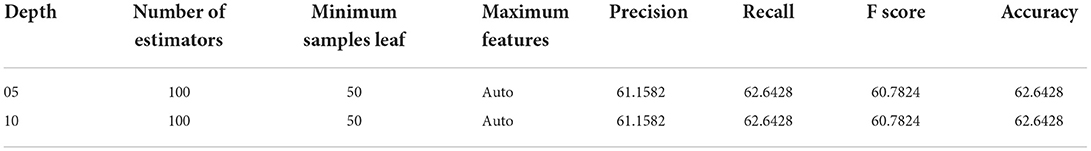
Table 10. Window size = 250, Threshold = 0.9 Percentage of new data = 0.1.
Tuning the hyperparameters of the random forest like depth of tree ε {05, 10}, a number of estimators ε {100, 200}, the minimum number of samples in leaf node ε {50,100}, we found that for window size 250 the classification metrics will provide the promising results for threshold value = 0.7 and percentage of new data = 0.3 compared to different values of threshold and percentage of new data as shown in Figure 9.
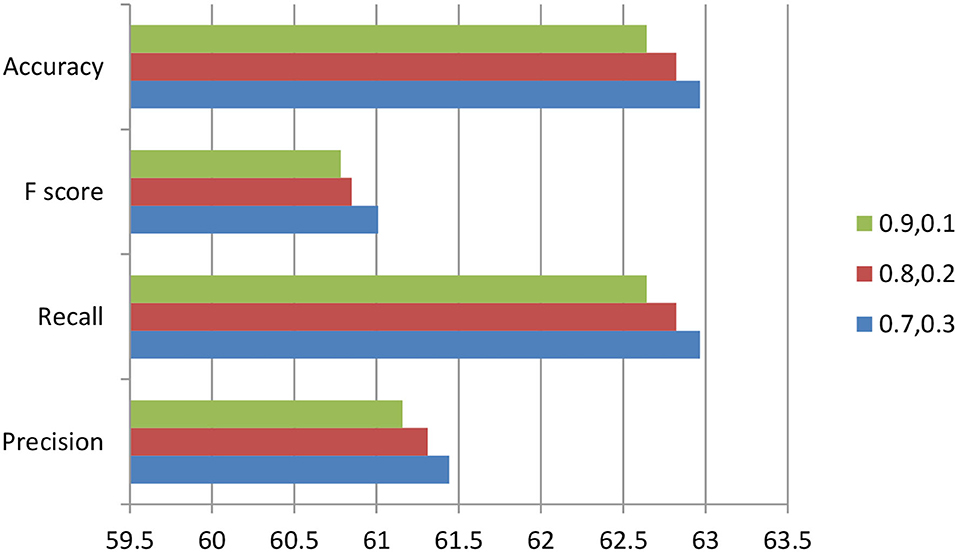
Figure 9. For Window Size =250, Threshold ∈ {0.9, 0.8, 0.7}, Percentage of new data ∈ {0.1, 0.2, and 0.3}.
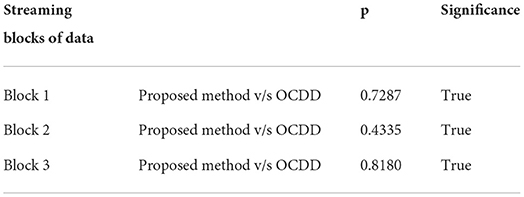
We use Mcnemar's test to perform a significance test for classification to compare the accuracy of our proposed concept drift technique with the accuracy of the OCDD technique. The McNemar's test is a paired nonparametric or distribution-free statistical hypothesis test. It is used to test the significance of two classifiers over a single dataset. In the Mcnemar's test, the null hypothesis we formulate is that the performance of two models is the same, and in the alternative hypothesis that the performance of two models is different.
The McNemar's test8 statistic (“chi-squared”) can be computed as follows
With one degree of freedom and an alpha value of 0.05, we compute the p-value for some blocks in the below table.
Open research issues and research trends
Research issues
The following are some of the research issues that can be addressed in the future:
• Handling outliers and class imbalance in data streams during concept drift detection.
• To design a single drift classifier that can address all types of drifts.
• The majority of methods rely too heavily on tracking the decline in learner accuracy. To have a stronger assumption on drift detection, a multiple hypothesis technique could be used in conjunction with other metrics being monitored.
Research trends
• To create data streaming techniques that scale to massive deep learning networks and are effective across all domains.
• Conducting online learning by utilizing distributed streaming engines, such as Apache Spark, Apache Flink, Apache Storm, and others, will be a key trend when dealing with massive amounts of data.
• Traditional deep learning methods must make numerous passes through the data. How to create models for concept drift detection in data streams that simply perform one pass through the data without saving the data.
• Unsupervised methods for handling concept drift in the absence of class labels.
Future enhancement
The proposed work employs a framework for the detection of concept drift in financial data streams. The data employed in the framework for concept drift detection is numerical in nature and in the future can be worked on categorical data for concept drift detection. The framework is developed for sudden concept drift and can be used and analyzed for different types of drift. Multiple real-world and synthetic financial datasets can be considered for analyzing the results of the proposed framework. The time complexity of the model can be studied as a future scope.
Conclusion
The proposed framework uses a random forest algorithm to detect sudden concept drift by monitoring the performance of the classification metrics like f1 score and AUC value with different threshold values for financial data streams. The proposed work detects sudden concept drift well for smaller window sizes and the results are compared with OCDD, Page-Hinckley, and ADWIN methods.
Data availability statement
The original contributions presented in the study are included in the article/Supplementary material, further inquiries can be directed to the corresponding author.
Author contributions
MA and CRN made substantial contribution to conception and design and acquisition of data. MA and SBR involved in analysis and interpretation of data. MA, CRN, and SBR drafted the article. MSAR contributed during the entire revision by answering to the reviewer comments and analysis of the proposed model results since from the first review process. All authors contributed to the article and approved the submitted version.
Conflict of interest
The authors declare that the research was conducted in the absence of any commercial or financial relationships that could be construed as a potential conflict of interest.
Publisher's note
All claims expressed in this article are solely those of the authors and do not necessarily represent those of their affiliated organizations, or those of the publisher, the editors and the reviewers. Any product that may be evaluated in this article, or claim that may be made by its manufacturer, is not guaranteed or endorsed by the publisher.
Supplementary material
The Supplementary Material for this article can be found online at: https://www.frontiersin.org/articles/10.3389/frai.2022.950659/full#supplementary-material
Footnotes
1. ^. “Multiflow,” scikit, June 17, 2020, https://scikit-multiflow.github.io/.
2. ^. Assets.kpmg. https://assets.kpmg/content/dam/kpmg/ae/pdf-2020/09/uae-healthcare-perspectives.pdf.
3. ^. “Investment Opportunities in China's Healthcare Sector after COVID-19.” China Briefing News, 26 Mar. 2020, https://www.china-briefing.com/news/investment-opportunities-chinas-healthcare-sector-aftercovid-19/.
4. ^. “China Stock Market - Shanghai Composite Index.” MacroTrends, https://www.macrotrends.net/2592/shanghai-composite-index-china-stock-market-chart-data.
5. ^. “Healthcare Industry in India, Indian Healthcare Sector, I...” Industry in India, Indian Healthcare Sector, Invest..., https://www.investindia.gov.in/sector/healthcare.
6. ^. Healthcare July 2019 - IBEF. https://www.ibef.org/download/Healthcare-July-2019.pdf.
7. ^. “Dubai: Global Healthcare Destination.” Medical Toursim, https://www.medicaltourism.com/destinations/dubai.
8. ^http://rasbt.github.io/mlxtend/user_guide/evaluate/mcnemar/.
References
Baena-Garc'ia, M., del Campo-Avila, J., Fidalgo, R., Bifet, A., Gavalda, R., and Morales-Bueno, R. (2006). “Early drift detection method,” in Proc. 4th Int. Workshop Knowledge Discovery from Data Streams, (2006).
Bruno, S., and Nuno, C. (2012). Marques “Applying neural networks for concept drift detection in financial markets”, in Conjunction with the 20th European Conference on Artificial Intelligence. Workshop on Ubiquitous Data Mining, UDM (2012), ECAI 960, 43–47.
Cavalcante, R., and Oliveira, A. (2015). An approach to handle concept drift in financial time series based on Extreme Learning Machines and explicit Drift Detection. 1–8. doi: 10.1109/JCNN.2015.7280721
Das, S. (2021). Best practices for dealing with concept drift - neptune.ai. Available: https://www.google.com/amp/s/neptune.ai/blog/conceptdrift-best-practices/amp (accessed 2021).
Fdez-Riverola, F., Iglesias, E. L., Diaz, F., Mendez, J. R., and Corchado, J. M. (2007). Applying lazy learning algorithms to tackle concept drift in spam filtering. Expert Syst. Appl. 33, 1, 36–48. doi: 10.1016/j.eswa.2006.04.011
Filippo, N. (2021). Domain Specific Concept Drift Detectors for Predicting Financial Time Series. Statistical Finance (q-fin.ST). Mach. Learn. (2021).
Firas, B., Bestoun, S., and Ahmed, A. K. (2022). From concept drift to model degradation: An overview on performance-aware drift detectors. Knowl. Based Syst. 245, 108632. doi: 10.1016/j.knosys.2022.108632
Gama, J., Medas, P., Castillo, G., and Rodrigues, P. (2004). “Learning with drift detection,” in Proc. 17th Brazilian Symp. Artificial Intelligence, Lecture Notes in Computer Science. Springer, (2004). Book Section, pp,. 286–295. doi: 10.1007/978-3-540-28645-5_29
Gama, J., Zliobaite, I., Bifet, A., Pechenizkiy, M., and Bouchachia, A. (2014). A survey on concept drift adaptation. ACM Comput. Surv. 46, 1–37. doi: 10.1145/2523813
Gozuacik, O. (2021). Concept learning using one-class classifiers for implicit drift detection in evolving data streams. Artif. Intell. Rev. 54, 3725–3747. doi: 10.1007/s10462-020-09939-x
Hanen, B. (2015). Modeling concept drift: a probabilistic graphical model based approach. International Symposium on Intelligent Data Analysis.
Oliveira, G. H. F. M., Cavalcante, R. C., Cabral, G. G., Minku, L. L., and Oliveira, A. L. I. (2017). “Time series forecasting in the presence of concept drift: A PSO-based approach,” in 2017 IEEE 29th International Conference on Tools with Artificial Intelligence (IEEE), 239–246. doi: 10.1109/ICTAI.2017.00046
Osama, A., Mahdi, E. P., Nawfal, A., and Jinli, C. (2020). Fast reaction to sudden concept drift in the absence of class labels. Appl. Sci. 10, 606. doi: 10.3390/app10020606
Qahtan, A. A., Alharbi, B., Wang, S., and Zhang, X. (2015). “A pca-based change detection framework for multidimensional data streams,” in Proc. 21th Int. Conf. on Knowledge Discovery and Data Mining. ACM, 2015 Conference Proceedings. p. 935–944. doi: 10.1145/2783258.2783359
Rodolfo, C. C. (2015). “An approach to handle concept drift in financial time series based on Extreme Learning Machines and explicit Drift Detection” in International Joint Conference on Neural Networks(IJCNN).
Tatiana, E., Adriano, K., da Cruz, A. A., and Marley, V. (2018). DetectA: abrupt concept drift detection in non-stationary environments. Appl. Soft Comput. 62, 119–133, doi: 10.1016/j.asoc.2017.10.031
Yoo, P. D., Kim, M. H., and Jan, T. (2005). “Machine learning techniques and use of event information for stock market prediction: a survey and evaluation”, in Computational Intelligence for Modeling. Control and Automation and Int. Conf on Intelligent Agents, Web Technologies and Internet Commerce. p. 835–84l.
Keywords: financial data, concept drift, sliding window, random forest, data stream
Citation: M. S. AR, Nirmala CR, Aljohani M and Sreenivasa BR (2022) A novel technique for detecting sudden concept drift in healthcare data using multi-linear artificial intelligence techniques. Front. Artif. Intell. 5:950659. doi: 10.3389/frai.2022.950659
Received: 23 May 2022; Accepted: 08 July 2022;
Published: 31 August 2022.
Edited by:
Manoj Kumar M. V., Nitte Meenakshi Institute of Technology, IndiaReviewed by:
Vishnu Yarlagadda, VIT University, IndiaShiva Darshan S. L., Nitte Meenakshi Institute of Technology, India
Prashanth B. S., Nitte Meenakshi Institute of Technology, India
Copyright © 2022 M. S., Nirmala, Aljohani and Sreenivasa. This is an open-access article distributed under the terms of the Creative Commons Attribution License (CC BY). The use, distribution or reproduction in other forums is permitted, provided the original author(s) and the copyright owner(s) are credited and that the original publication in this journal is cited, in accordance with accepted academic practice. No use, distribution or reproduction is permitted which does not comply with these terms.
*Correspondence: Abdul Razak M. S., bXNhYmR1bHJhemFrQGdtYWlsLmNvbQ==