 Mowei Zhou1*†
 James M. Fulcher1†
 Kevin J. Zemaitis1
 David J. Degnan2
 Yen-Chen Liao1
 Marija Veličković1
 Dušan Veličković1
 Lisa M. Bramer2
 William R Kew1
 Gary Stacey3
 Ljiljana Paša-Tolić1
- 1Environmental Molecular Sciences Laboratory, Earth and Biological Sciences Directorate, Pacific Northwest National Laboratory, Richland, WA, United States
- 2Biological Science Division, Earth and Biological Sciences Directorate, Pacific Northwest National Laboratory, Richland, WA, United States
- 3Divisions of Plant Sciences and Biochemistry, Christopher S Bond Life Sciences Center, University of Missouri, Columbia, MO, United States
Proteomic methods have been widely used to study proteins in complex biological samples to understand biological molecular mechanisms. Most well-established methods (known as bottom-up proteomics, BUP) employ an enzymatic digestion step to cleave intact proteins into smaller peptides for liquid chromatography (LC) mass spectrometry (MS) detection. In contrast, top-down proteomics (TDP) directly characterizes intact proteins including all possible post-translational modifications (PTMs), thus offering unique insights into proteoform biology where combinations of individual PTMs may play important roles. We performed TDP on soybean root nodules infected by the symbiotic Bradyrhizobium japonicum in both the wildtype bacterium and a nifH- mutant, which lacks the ability to fix nitrogen in the soybean root nodule. TDP captured 1648 proteoforms derived from 313 bacterial genes and 178 soybean genes. Leghemoglobin, the most abundant protein in the sample, existed in many truncated proteoforms. Interestingly, these truncated proteoforms were considerably more abundant in the wildtype relative to the nifH- mutant, implicating protease activity as an important factor in nitrogen fixation. Proteoforms with various PTMs and combinations thereof were identified using an unrestricted open modification search. This included less common PTMs such as myristoylation, palmitoylation, cyanylation, and sulfation. In parallel, we collected high resolution MS imaging (MSI) data of intact proteins and biopolymers (<20 kDa due to current technical limitations) from sections of the soybean root nodules using matrix-assisted laser desorption/ionization (MALDI) coupled to high resolution Orbitrap. Several detected proteoforms exhibited unique spatial distributions inside the infection zone and cortex, suggesting functional compartmentalization in these regions. A subset of peaks from the MALDI-MSI were assigned to proteoforms detected in TDP LCMS data based on matching accurate masses. Many of the proteins detected in both LCMS and MALDI-MSI are currently uncharacterized in UniProt: the PTM and spatial information presented here will be valuable in understanding their biological functions. Taken together, our study demonstrates how untargeted TDP approach can provide unique insights into plant proteoform biology. On-going technology developments are expected to further improve TDP coverage for more comprehensive high-throughput analysis of proteoforms.
1 Introduction
Mass spectrometry (MS)-based proteomics is a powerful technique to measure proteins in biological samples, especially for mapping and quantifying post-translational modifications (PTMs).(Angel et al., 2012; Schaffer et al., 2019) The high resolving power of modern mass spectrometers, combined with various separation techniques (primarily liquid chromatography, LC) enables deep characterization of the proteome from complex samples. Due to the large size of proteins, bottom-up proteomics (BUP) is the dominant approach for proteome characterization. In BUP, exogenous proteases (e.g., trypsin) are used to cleave intact proteins into short peptides that are easier to detect with current LCMS instrumentation. BUP is highly robust, and versatile when coupled to various chemical biology methods for quantitation and targeted identification.(Angel et al., 2012; Zhang et al., 2013) However, certain information, such as combinatorial PTMs, is difficult to retrieve using BUP because of the loss of connectivity from intact protein to digested peptides.(Lanucara and Eyers 2013; Schaffer et al., 2019) Although most proteins can be readily inferred from even a few peptides, the lack of complete protein sequence coverage can cause ambiguities. For example, protein homologs and isoforms share many sequences that are hard to differentiate with only a few peptides. In addition, endogenous protease cleavages are known to play essential regulatory roles in signaling and immunity, (Azad et al., 2018; Balakireva and Zamyatnin 2018; Fink and Jerala 2022), but may be challenging to identify with limited protein sequence coverage and complication with the use of exogenous proteases in BUP. Top-down proteomics (TDP) addresses these challenges by studying intact proteins or “proteoforms,” which is defined as the functional units of the proteome encompassing all combinations of PTMs.(Smith and Kelleher 2018; Schaffer et al., 2019; Melby et al., 2021) TDP bypasses the protease treatment step and directly analyzes intact proteins, allowing more facile proteoform level characterization than BUP. TDP and BUP are complementary in the sense that TDP better defines the stoichiometry of PTMs; while BUP generally offers better proteome coverage (e.g., higher overall sensitivity, and PTM localization resolution). Integration of both data types via bioinformatics tools is beneficial for a more complete understanding of the proteoforms and biology.(Schaffer et al., 2020)
Conventionally, both BUP and TDP proteomics are performed using proteins extracted from bulk tissues after many steps of cell lysis and solubilization. Absorptive losses to surfaces during sample handling have been one of the major factors restricting the sensitivity of the analysis. Recently introduced single-cell proteomic methods, (Zhu et al., 2018; Kelly 2020; Slavov 2021), which are largely built on microfluidics and microsampling technologies, reduce sample losses, thus allowing for spatial profiling of proteins in small tissue sections. In addition, spatial proteomics and in situ sampling methods facilitates MS imaging (MSI) of proteoforms directly from surfaces of biological samples.(Lundberg and Borner 2019; Taylor et al., 2021) These methods offer spatial distribution of proteoforms, information that is not accessible by bulk proteomic methods but provides critical information to understand the heterogeneity and biological context of proteins and proteoforms.
Herein, we show the utility of TDP for studying proteoforms in soybean root nodules infected by the symbiotic bacterium Bradyrhizobium japonicum. We performed comparative TDP LCMS analysis using symbiotes with wild type (WT) bacteria and nifH- mutant bacteria, which lack the ability to fix nitrogen.(Hahn et al., 1984; Agtuca et al., 2020) We used an open modification search tool, TopPIC (Kou et al., 2016) that reported many unexpected PTMs, several related to cysteine and several with significant abundance differences between the WT and the nifH- mutant groups, signifying their potential biological functions. We also observed interesting changes in the proteolysis activities against leghemoglobin, a highly abundant protein within the nodule. Defining the truncated proteoforms is straightforward using TDP, whereas BUP requires specialized informatics analysis and/or chemical labeling.(Tholey and Becker 2017) We highlighted several examples demonstrating facile TDP analysis of unexpected PTMs and truncations for better understanding of the proteoform heterogeneity.
In parallel, we interrogated spatial heterogeneity of proteoforms using matrix-assisted laser desorption/ionization (MALDI) MSI coupled to high resolution Orbitrap (Zemaitis et al., 2022) on thin tissue sections. The detected proteoforms were either concentrated in the infection zone, at the outer cortex, or nearly uniformly distributed across the tissue. Proteoforms in MSI data were assigned based on matching accurate mass to TDP LCMS derived database. Although not all species in MSI were assigned, we identified several proteoforms corresponding to highly abundant proteins (e.g., histones, ATP synthase subunits), and some cysteine-rich peptides from both soybean and bacterium. About ∼10% of the identified proteoforms in our TDP results are derived from “uncharacterized proteins” according to the UniProt reference database. Some of the PTM and spatial information obtained in this study can offer clues to disentangle their biological functions. Currently, the standard TDP methods used here are limited to small proteins up to 20–30 kDa.(Huguet et al., 2019; Su et al., 2022; Zemaitis et al., 2022). We also discussed new developments in TDP instrumentation that will gradually bridge the gap and allow full integration with BUP data.
2 Materials and methods
2.1 Soybean nodule materials
Plant growth and soybean nodule collection was performed at the University of Missouri as previously described.(Agtuca et al., 2020; Veličković et al., 2022) Briefly, the plants were inoculated at 3 days post-germination, and soybean nodules were harvested at day 21, plunge frozen into liquid nitrogen, and stored in −80°C. Five WT and five nifH- nodules were used for protein extraction and bulk LCMS analysis. For MSI, frozen soybean root nodules were embedded in the mixture of 7.5% HPMC ((Hydroxypropyl)-methylcellulose) and 2.5% PVP (Polyvinylpyrrolidone), cryosectioned (temperature set at −18C for both blade and specimen holder) using CryoStar NX-70 Cryostat (Thermo Scientific) and thaw-mounted onto indium-tin oxide (ITO) coated slides (Bruker Daltonics, Billerica, MA). Sectioning was completed at 12 µm for both wildtype and mutant bacteria inoculated nodules.
2.2 Bulk TDP LCMS
Five biological replicates of nifH− and WT soybean nodules were prepared for top-down proteomics. Proteins were extracted from homogenized frozen soybean nodules with the same methanol/choloroform protocol as described in detail previously (Veličković et al., 2022). The extracted proteins in lysis buffer (8 M urea, 50 mM ammonium bicarbonate, pH 8.0) were split for TDP and BUP with matching sample names in the raw data files. Protein concentrations were estimated by bicinchoninic acid assay (BCA) followed by diluting to 100 ng/μl with 0.2% formic acid in water. 500 ng of protein were injected to a Waters NanoAcquity LC (Millford, MA, United States ) with dual pumps configuration. Binary solvents for mobile phase (MP) A and B were 0.2% formic acid in water (MPA), and 0.2% formic acid in acetonitrile (MPB) for both pumps. The stationary phase material for in house packed reversed phase LC columns was C2 particle (SMTC2MEB2-3-300) from Separation Methods Technologies (Newark, DE). Proteins were first loaded onto a short trap column (150 µm i.d., ∼4 cm long) and desalted with a flow of 3 μl/min with 5% MPB for 5 min. Then the trap was connected to the analytical column (100 µm i.d.,∼50 cm long) with flow rate of 0.3 μl/min. Separation gradient started at 5% MPB and was linearly ramped to 50% MPB over 80 min. The ten samples were randomized and blanks (a shorter 60 min method) were inserted between each sample. MS data were collected on a Thermo QExactive HF Orbitrap MS (Bremen, Germany). MS resolution was 120 k for MS1 and 60 k for MS2. Automatic gain control (AGC) target was set to 3E6 for MS1 and 1E6 for MS2. Maximum injection time was set to 200 m s. Isolation window was 2 m/z and stepped normalized collision energy was used (20, 30, 40) for higher-energy collisional dissociation (HCD). Dynamic exclusion was set to 180 s and ions with charge states <4 were excluded.
MS instrument “.RAW” files were first converted into “.mzML” format with MSConvert before processing with the open-search software TopPIC Suite (version 1.4.13).(Kou et al., 2016) For TopFD deconvolution, a precursor window of 1 m/z, error tolerance of 0.02 m/z, MS1 signal to noise ratio (S/N) of 3, MS2 S/N = 1, maximum charge of 30, and maximum monoisotopic mass of 50,000 Da were applied. Specific settings for the TopPIC search included an error tolerance of 15 ppm, PrSM cluster tolerance of 3.2 Da, FDR of 0.01, max/min unknown mass shift of 500 Da, and a maximum of one unknown mass shift. Protein collections imported from UniProt included several Bradyrhizobium spp. in order to generate a pan proteome (59,134 entries, accessed 7 March 2021) that covered reviewed Swiss-Prot and unreviewed TrEMBL entries. Similarly, Glycine max entries were concatenated into this FASTA file for the search (74,863 entries, accessed 7 March 2021), as well as several common human contaminant proteins. All proteoform spectrum matches (PrSMs) were imported into R for further processing and quantitative analysis. To address issues related to ambiguous identifications and missing data, we utilized the TopPICR package to perform proteoform clustering and match-between-runs.(Martin 2021) Briefly, dataset retention times were aligned by shared proteoform’s peak intensities, and mass errors were corrected across datasets. Aligned and recalibrated datasets were then clustered based on retention time and precursor mass for all PrSMs. These clusters are referred to as “proteoform clusters” (PfCs). A minimum of 2 PrSMs were required per cluster, and PrSMs not meeting this criterion were pooled together as a “noise” cluster that was not utilized in label free quantification (LFQ). After clustering, we separated PfCs based on the organism of origin and performed median normalization and group summarization using the MSstats R package. All quantified PfCs were then analyzed and visualized with R. Note that all p-values presented below are FDR corrected using the Benjamini-Hochberg procedure. Selected proteoforms with unexpected mass shifts were manually examined in LcMsSpectator, a visualization tool in the InformedProteomics package.(Park et al., 2017)
2.3 MALDI proteoform imaging
Prior to analysis the tissue sections were desiccated under 61 kPa of vacuum for 30 min and then washed in fresh solutions of 70% ethanol for 30 s, 100% ethanol for 30 s, Carnoy’s solution (6:3:1 v/v ethanol/chloroform/glacial acetic acid) for 2 min, 100% ethanol for 30 s, water with 0.2% TFA for 15 s, and immediately washed in 100% ethanol for 30 s. Samples were then dried by stream of nitrogen gas prior to direct tissue acidification to improve signal intensity. The protocol was described in detail elsewhere (Zemaitis et al., 2022), briefly, a HTX Technologies M5 Sprayer (Chapel Hill, NC, United States) was used to apply 5% (v/v) acetic acid in 50% ethanol directly prior to application of MALDI matrix (2,5-dihydroxyacetophenone, DHA) at a coverage of 277 μg/cm2 for protein desorption/ionization. After the matrix was applied it was recrystallized with 5% (v/v) aqueous acetic acid at 38.5°C prior to analysis and dried for 3.5 min, using an apparatus similar to that previously reported.(Yang and Caprioli 2011) These samples were analyzed on an elevated pressure (EP) MALDI source (Spectroglyph LLC, Kennewick, WA, United States), (Belov et al., 2017), outfitted with a 2 kHz Explorer One Nd:YAG (349 nm) mounted on a modified Q Exactive HF Orbitrap (Thermo Fisher Scientific, Bremen, Germany). This instrument was upgraded with Q Exactive ultrahigh mass range (UHMR) boards and operated under custom privileges licenses. Detailed operation of this prototype instrument is described elsewhere, where ions were detected from tissue up to ∼17 kDa with isotopic resolution.(Zemaitis et al., 2022) Briefly, the instrument was set to acquire over a m/z range of 3,250 to 20,000 at a preset resolution of 240 k, this resulted in an observed experimental resolution of 35 k at m/z 11,300 with 500 laser shots per pixel. Spectra were acquired with a raster of 15 µm to achieve cellular spatial resolution.
MALDI images were generated by extracting singular isotopes using SCiLS Lab Pro (v.2021c). For peak assignment, proteoforms identified from TDP LCMS were used as custom databases. A software code (manuscript in preparation, https://github.com/PNNL-HubMAP-Proteoform-Suite/ProteoMatch) was used to generate candidate matches, which were then manually examined for confirmation. Accurate masses with <5 ppm mass error were considered for assignment. Isotope profiles were constructed with Rdisop (Böcker et al., 2008) using proteoform molecular formulas calculated with BRAIN (Dittwald et al., 2013) and Unimod (Creasy and Cottrell 2004). PTM mass shifts to resulting profiles. Peaks are matched with the base R findInterval () function as described previously (Degnan et al., 2021), and distributions with a Pearson correlation score of >= 0.7 were visualized. Visualization of summed spectra and comparison with simulated theoretical isotopic distribution of target proteoforms were also performed using PeakByPeak software (SpectroSwiss, v.2021.11.0.b2)(Nagornov et al., 2020).
3 Results
3.1 Quantitative TDP differentiates wildtype vs nifH- infected root nodules, and reveals differential proteolysis events of leghemoglobin
Overall, we quantified 1648 proteoforms composed of 738 soybean and 910 bacterial proteoforms from 178 to 313 genes, respectively (Figures 1A,B, full list of proteoforms in Supplementary Table S1). The abundance of the proteoforms detected spanned from E10 to E5 (arbitrary unit of the mass spectrometer), providing a dynamic range of ∼5 orders of magnitude that is generally consistent with the instrument specification. Among those, we observed expected change of the NifH proteoform in TDP. Although the full length NifH protein (UniProt accession: P06117) from Bradyrhizobium was not readily detected due to its relatively large size (∼31 kDa, outside the optimal detection range for the TDP method used here), several C-terminal truncations of NifH were abundant in the WT but virtually absent in nifH-. Sixteen unique NifH truncated proteoforms were detected and all spectral matches were from WT samples. Only two of the sixteen fragments showed low signal in mutant samples in LFQ after alignment and match-between-runs (MBR), which can likely be attributed to LC carry-over or false positive matches during MBR. Compared to the 3,653 soybean and 2,863 bacterial proteins from previous shotgun BUP data (Veličković et al., 2022) on the same sample, the global proteome coverage is lower in TDP. This is as expected given the known high protein molecular weight detection limitations in TDP. Additional separation and/or fractionation could improve the coverage. Encouragingly, TDP reported an average protein sequence coverage of 46% and 157 proteins with >90% coverage while BUP averaged 29% and only 19 proteins with >90% coverage. This highlights the advantage TDP has over BUP in providing more complete information, particularly with lower molecular weight proteins. WT and nifH- sample groups are also clearly differentiated by principal component analysis (PCA) using the TDP data (Supplementary Figure S1), indicating that biological differences are readily captured. Due to significantly different detection biases among different methods, we did not perform a comprehensive comparison of our TDP results with published BUP and transcriptomics data in this study. Herein, we focused on the analysis of TDP data and presented several unique pieces of information that can be readily obtained by a “shotgun” discovery TDP experiment.
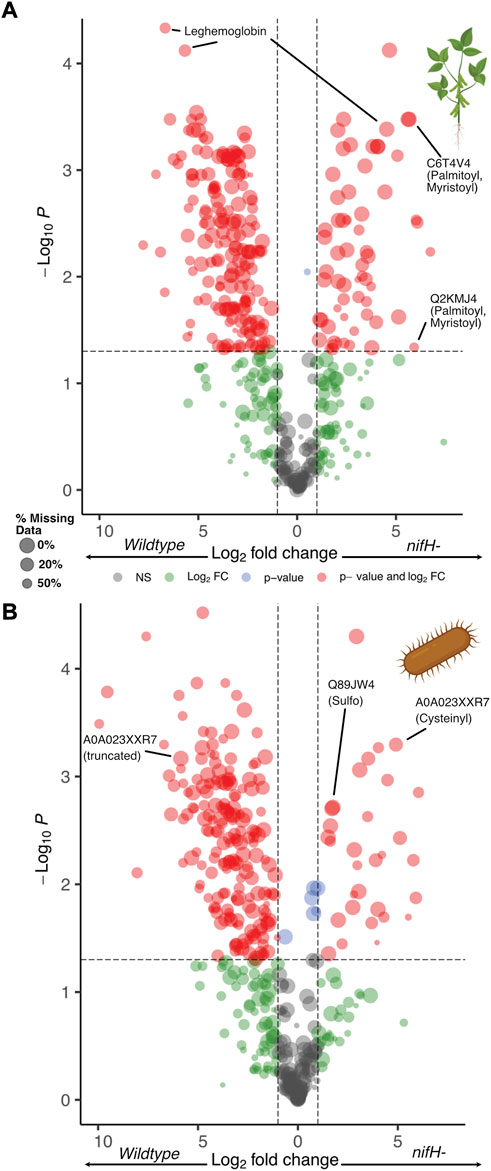
FIGURE 1. Volcano plot of proteoform abundance changes for (A) soybean, and (B) bacterium between the WT and nifH- mutant nodules. Selected proteoforms are highlighted within figure. Created with BioRender.com.
Leghemoglobins, a family of plant proteins essential for oxygen sequestering and transport, made up ∼25% of quantifiable soybean proteoform identifications in our TDP results. We identified a total of 221 proteoforms derived from the four leghemoglobin genes in soybean (LGB1, LGB2, LGB3, LGBA). Most of the proteoforms can be assigned to the correct gene despite their similar sequences (an average of ∼86% sequence identity between the different homologs, sequence alignment in Supplementary Figure S2). Less than 10% of the leghemoglobin proteoform identifications share amino acid sequences and therefore are ambiguous with respect to the gene of origin (Proteoform classification level 2D, 3E, and 4B (Smith et al., 2019), Supplementary Figure S3A). Across all WT and nifH- samples, there were no significant differences in TDP abundance between the four leghemoglobin genes (Supplementary Figure S3B). Furthermore, based on the BUP data collected on the same samples there were no significant differences in leghemoglobin abundance between wildtype and nifH- samples (Supplementary Figure S4). This is surprising as heme B was previously found to be less abundant within the infection zone of nifH- root nodules (Agtuca et al., 2020). The present results therefore suggest leghemoglobin and heme B abundance may change independently of leghemoglobin apoprotein abundance. Indeed, prior work has suggested that heme B is not essential for expression of apoleghemoglobin (O'Brian et al., 1987). It is also notable that soybean ferritin and Bradyrhizobium bacterioferritin, two heme-binding proteins that sequester iron, were found to be significantly upregulated in nifH- root nodules. A truncated bacterioferritin proteoform from the TDP quantification results was 16-fold increased while a 5-fold increase at the protein level was found in BUP. Of the seven soybean ferritin genes identified in our BUP data, three (Q948P5, C6TI81, and I1JL80) could be quantified from unique tryptic peptides and all three were 6- to 45-fold more abundant in the nitrogen fixation mutant nodules.
The lack of difference in leghemoglobin abundance between the two conditions is particularly interesting as the TDP data reveals significant changes in leghemoglobin processing and proteolysis (Figure 2). Because all samples were processed in the same manner, the observed difference in truncated proteoforms should be related to the sample differences and not simply a degradation artifact. Leghemoglobin proteoforms that were truncated due to proteolysis were considerably more abundant in wildtype symbionts, while intact leghemoglobin proteoforms were enriched in nifH-. Although many of the leghemoglobin proteolytic cleavage events appear to be stochastic, there are several regions of the leghemoglobin protein that are favored for processing (Figure 2B). The top three cleavage sites at positions 32–33, 68–69, and 111–112 do not share similar amino acid motifs, and in fact two of the sites contain residues that are polymorphic between the different leghemoglobin genes (Supplementary Figure S2). This suggests that a different enzyme may act on each site and different leghemoglobin genes, which would not be entirely unexpected given there are over 90 plant papain-like proteases in Glycine max and many of them participate in nodule development (Yuan et al., 2020). Alternatively, the degradation may have occurred via more promiscuous proteases at specific structural motifs. Indeed, in the structure of leghemoglobin A (Hargrove et al., 1997), each cleavage site is positioned within the middle of three different alpha-helices (Supplementary Figure S5). Taken together, these results underscore the potential role of leghemoglobin turnover in active root nodules. To further validate our hypothesis, applying chemical labeling approaches used in terminomics before tissue lysis (Tanco et al., 2015; Tholey and Becker 2017; Kaushal and Lee 2021) could help confirm the proteolysis events in vivo and differentiate them from potential ex vivo effects.
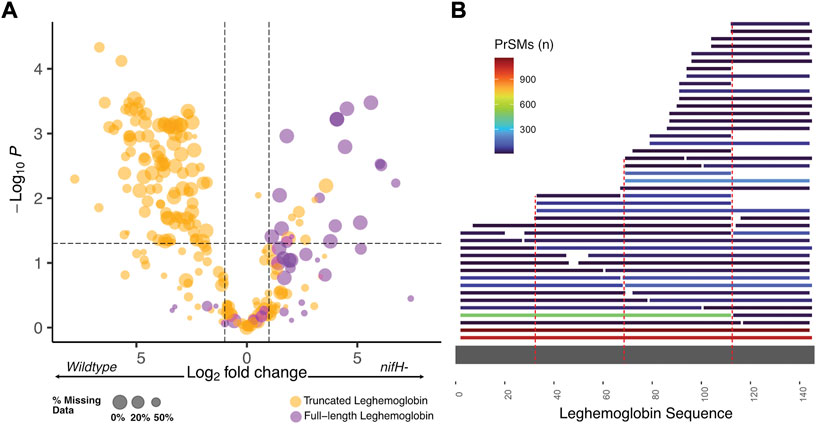
FIGURE 2. (A) Volcano plot showing differential regulation of leghemoglobin proteoforms. Truncated leghemoglobin is predominantly upregulated in the wildtype, while full-length leghemoglobin is more often found in nifH-. (B) Proteoform sequence map showing all unique proteoform sequences from all leghemoglobin genes mapped to full-length leghemoglobin LGB2 (LGB2 used for reference as it includes the additional C-terminal amino acid #145). Dotted red lines designate the top three junctions that appear to have increased proteolytic activity.
3.2 Open modification search reveals novel PTMs on both soybean and bacterial proteins
The open search approach we used allowed us to profile PTMs without restriction to a list of expected PTMs. In essence, the proteoform identifications from TopPIC report the amino acid sequence, which accounts for any truncations, and any additional mass shifts that originate from PTMs. The high-resolution MS measurements afforded high mass accuracy to infer the identity of the PTMs by manually curating them based on knowledge database (e.g., Unimod.org). In addition to the numerous proteoform truncations, we observe a multitude of unexpected mass shifts that correspond to chemical modifications or mutations (Figure 3). Some of the mass shifts can originate from multiple PTMs, or PTMs in combination with incorrectly assigned terminal residues (i.e., first methionine not excised). Due to this complexity, we did not exhaustively examine all mass shifts in detail. However, many of them can be explained based on known PTM databases in Unimod (Creasy and Cottrell 2004). For example, nitrogen regulatory protein PII from Bradyrhizobium (A0A0A3YVV6) was found to have an additional mass of 306.02 Da at Tyr51 (Supplementary Figure S6), which can be assigned to uridylylation, a well-documented PTM for this protein (referred to as PII-UMP). It is worth noting that PII-UMP is known to be increased under nitrogen-limiting conditions, (Francis and Engleman 1978; Huergo et al., 2013), which aligns with our observation that PII-UMP was only detectable in nifH- samples. More common mass shifts from methionine oxidation (+16 Da) and cysteine dioxidation (+32 Da) were found and may be attributable to spontaneous oxidation during sample storage and preparation. Additionally, many cysteine-containing proteoforms had –2 Da and –4 Da mass shifts likely representing disulfides. Such PTMs may be difficult to differentiate from deisotoping error, which are commonly seen in open search TDP due to uncertainty in precursor mass deconvolution (off by a few isotopes), and often need to be further validated by closely examining the precursor isotope distribution and fragmentation spectra.
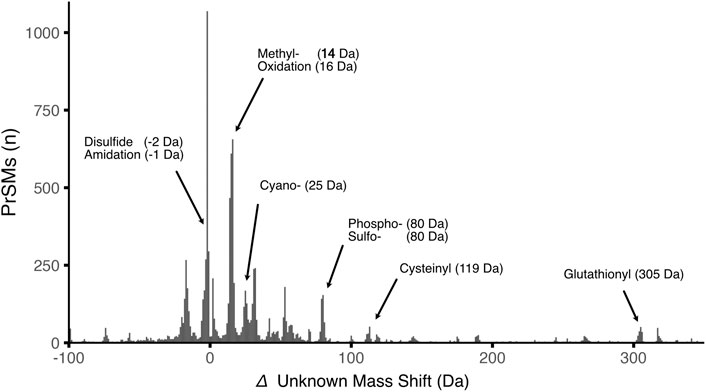
FIGURE 3. Histogram of unknown mass shifts assigned in our TDP results. The x-axis represents the delta unknown mass shift rounded to the nearest Da, while y-axis displays the number of proteoform spectrum matches (PrSM) for each mass shift. Arrows indicate putative PTMs with nominal masses acquired from the PTM database Unimod.
Other intriguing mass shifts were also detected. For example, two “uncharacterized” soybean proteins with high sequence similarity (UniProt accessions Q2KMJ4 and C6T4V4) both had + 317.39 Da localized to the first five amino acids of their N-termini with high spectral counts in Figure 3. Careful manual examination of the raw data revealed that this modification could be explained by excision of the first Met residue, N-terminal myristoylation, and Cys4 palmitoylation (Figure 4 for representative spectrum of C6T4V4, and Supplementary Figure S7 for Q2KMJ4). Encouragingly, the palmitoylation site could be confidently assigned based on complementary b/y ions in HCD, although other complementary fragmentation methods (e.g., electron-based and photon-based activation) could further improve the spectral quality. The N-terminal myristoylation was independently verified by the modified peptide from BUP data from the same sample (Supplementary Figure S8). Due to the thiol alkylation step used in the standard BUP protocol, no peptide spectrum was available to directly confirm the palmitoylation. It is noted that palmitoylated peptides can be difficult to detect with standard shotgun BUP workflows due to the hydrophobicity and instability of the PTM. (Ji et al., 2013) In addition, due to the identical N-terminal tryptic peptide for the two protein homologs, it can be ambiguous to assign the PTMs to a specific protein with only BUP data. Therefore, the TDP approach is advantageous in discovering such PTMs for further targeted analysis.
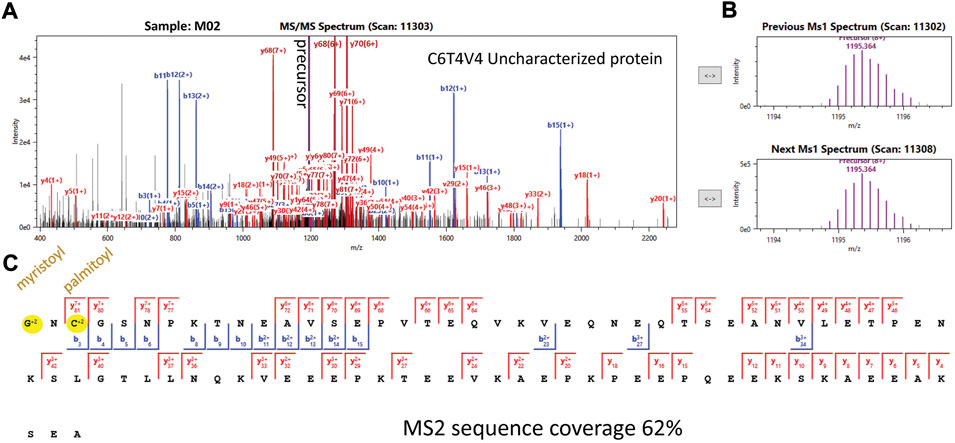
FIGURE 4. TDP spectra confirming the N-terminal myristoylation and cysteine palmitoylation proteoform of soybean protein C6T4V4, visualized in LcMsSpectator. (A) annotated fragmentation spectrum with most peaks matched to b/y sequence ions. The vertical axis was zoomed to cut out the high intensity precursor and better display the low intensity fragment ions. (B) Adjacent MS1 spectrum (before and after the MS2 spectrum) showing good match of the precursor ion matches of the expected proteoform. (C) MS2 sequence coverage map showing 62% residues were matched with fragment ions. Blue wedges showed the matched b ions from the N-terminus and red wedges show the y ions from the C-terminus along the protein sequence. The y81 ion was essential to locate the palmitoylation at the cysteine residue, leaving the remaining mass shift from myristoylation at the N-terminus.
These lipidation events are supported by previous findings suggesting the presence of a cysteine at amino acid position four or five is often palmitoylated in plant proteins that are N-terminally myristoylated, (Resh 1999; Podell and Gribskov 2004), which is the case for both proteins. Q2KMJ4 has also been found to be nodule specific and may be associated with the peribacteroid membrane (PBM), (Wienkoop and Saalbach 2003), and both proteins share homology with proteins from the model legume species Medicago truncatula and Lotus japonicus. Interestingly, the full-length lipidated proteoforms for Q2KMJ4 and C6T4V4 are both significantly upregulated in nifH- symbiotes with 60- and 51-fold increases in abundance in TDP data, respectively. Finally, it is noteworthy that neither protein was observed lacking the aforementioned lipid modifications, highlighting the importance these modifications presumably play in anchoring the protein to the PBM. (Jeong et al., 2006)
Cysteine modifications are important factors in regulating protein functions.(Waszczak et al., 2015) For example, a study in Arabidopsis (García et al., 2018) demonstrated the regulatory role of HCN and protein cyanylation. We examined two bacterial proteins (UniProt accession: Q89JW4 and A0A023XXR7) with cysteine residues that showed high spectral counts with many unexpected PTMs, including cyanylation of cysteine on both proteins (representative spectrum for Q89JW4 in Supplementary Figure S9A). In addition to full-length cyanylated Q89JW4, a proteoform cleaved at the cyanylated residue was also observed (Supplementary Figure S9B), consistent with the labile nature of the cyanyl-group which has been utilized for selective protein cleavage.(Jacobson et al., 1973; Wu et al., 1996) Other assigned Cys PTMs included glutathionylation and cysteinylation (Supplementary Figure S10, S11, respectively for A0A023XXR7 proteoforms). Additional mass shifts such as + 190 Da (Supplementary Figure S12), + 176 Da, + 145 Da could not be manually characterized and are likely combinations of PTMs. Glutathionylation and cysteinylation are known to confer a protective mechanism to thiols with redox functions. (Hochgräfe et al., 2007; Rouhier et al., 2008; Müller-Schüssele et al., 2021) Indeed, for A0A023XXR7 we observe a proteoform that is cysteinylated at Cys97 and was 30-fold higher abundance in nifH- root nodules. There is also a corresponding 17-fold decrease in abundance of a truncated proteoform whose C-terminal residue precedes Cys97, suggesting modification of Cys97 may have impacted the generation of this truncated proteoform (Supplementary Table S1, “Bradyrhizobium” tab, yellow highlighted proteoform). While glutathionyl and cysteinyl modifications are well established as playing important roles in vivo, we should note they may also originate from artifacts due to the highly reactive nature of free thiols.(Auclair et al., 2014)
We also detected a labile PTM of ∼79.96 Da which we assigned as sulfation (Supplementary Figure S13 for Q89JW4 proteoform). The PTM is readily lost upon activation by HCD, leaving no mark on the fragments. Although phosphorylation is another possible PTM with very similar mass (79.97 Da), fragment ions with the neutral loss are expected to carry water loss (–18 Da) instead of no mass shifts at all as known from observations for phosphor/sulfopeptide fragmentation.(Nemeth-Cawley et al., 2001; Medzihradszky et al., 2004; Chen et al., 2018) Unfortunately, the neutral loss prevented us from localizing the sulfation site. Given that we also observed proteoforms with sulfation and Cys dioxidation (sulfonic acid form) simultaneously (Supplementary Figure S14), we suspect the sulfation is appended to hydroxyl groups on Ser/Thr/Tyr. While future studies are needed to interrogate the biological significance of the PTMs, the TDP approach is a powerful way to discover these proteoforms.
3.3 MSI maps spatial distribution of proteoforms in tissue sections
The LCMS results revealed the proteoform changes in the bulk tissue of soybean nodules. It is known (Agtuca et al., 2020) that WT and nifH- mutant nodules have distinct morphology. WT nodules are generally larger and more red colored than the nifH- mutant, where the color difference is due to lower level of heme.(Agtuca et al., 2020) In order to better understand the heterogeneity of the proteoforms, we also attempted to profile the spatial distribution of the relatively small proteoforms in-situ using MALDI-MSI coupled to Orbitrap with high resolution Fourier transform MS detection. We were able to obtain high mass resolution (∼35 k at m/z 11,300) images at 15 µm spatial resolution. All major peaks were isotopically resolved, allowing easy matching to the known proteoforms from the TDP LCMS data via accurate mass and isotope distribution (as described in the method). The nifH- mutant and the WT tissue slices showed several common peaks (Figure 5). Notably, soybean histones were more abundant in the mutant, qualitatively consistent with our TDP (Supplementary Table S1, “GlycineMax” tab, yellow highlighted proteoforms) and previous BUP results (Veličković et al., 2022).
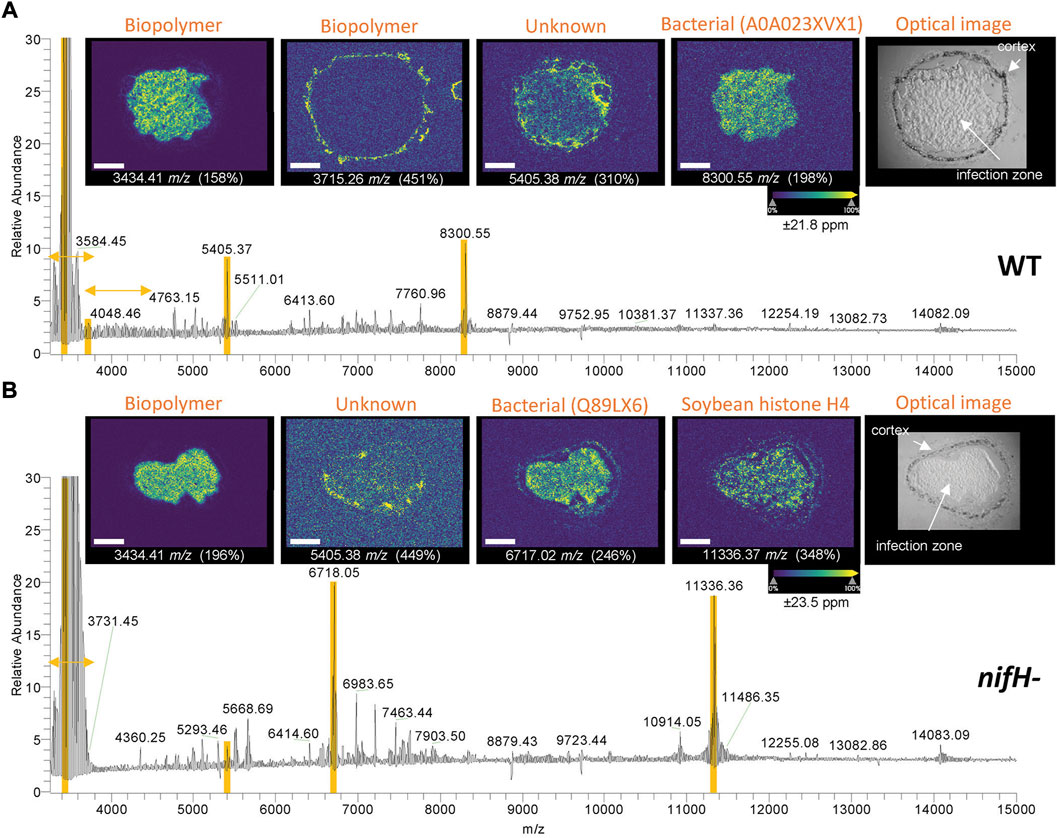
FIGURE 5. MALDI spectra with representative ion and optical images for (A) WT and (B) nifH- mutant nodule slices. The identities for the assigned species are shown above each image (protein name or UniProt accession if poorly annotated). Selected m/z values are shown below each image (mass window set to ±21.8 ppm for WT and ± 23.5 ppm for the mutant in SCiLS), and also highlighted in yellow in the spectra. The yellow horizontal arrows indicate the m/z range of the biopolymer species. Within each ion image, the color map was normalized to highest intensity in each image, and the normalization factor (%) to base peak in full spectrum are noted in parentheses (higher the number, lower the intensity). The white scale bars correspond to 600 µm. MALDI ion image were collected at 15 µm spatial resolution.
Generally, the spatial distribution of the species fell into 3 categories: enrichment in infection zone, in the cortex, and those with relatively uniform distributions. Strong signal for clusters of bio-oligomers was observed < m/z 4,000 for both WT and mutant samples. (Figure 5, note that the vertical axis was trimmed to 30% for better display of other species) The intense species centered around m/z 3,450 was found localized within the infection zone having mass differences of 14.02 Da that presumably are repeating units of CH2 from alkyl chains (see more ion images in Supplementary Figure S15). Detection of bio-oligomers (e.g., polyhydroxybutyrate, polysaccharide, polyglutamic acid with molecular weight less than ∼3,000 Da) of WT soybean nodule by MSI was recently reported.(Samarah et al., 2021) Because we did not collect data < m/z 3,000, we could not find sufficient overlap of species from the previous report and assign any of the biopolymers. The WT sample also showed a lower abundance, second distribution of bio-oligomers around m/z 3,700–4,600, which produced ion images to m/z 6,000 (Supplementary Figure S16), these species were localized within the cortex and mostly likely originated from plant. Because of the highly specific spatial distribution of these biopolymers, they are unlikely to be from general contaminations during the tissue embedding that are expected to show uniform signal across the whole sample. We attempted to perform MS/MS on the peaks with HCD, but the spectra were not informative to identify the species. Therefore, their exact identities remain unknown but could be further investigated in a more targeted manner.
Proteoform assignment for the MALDI spectra were achieved by matching the experimental data to the theoretical isotopic distributions from the identified proteoforms by TDP LCMS. The experimental proteoform database from LCMS significantly reduces the search space compared to in silico databases predicted from the full proteome, especially for PTMs. But the overlap of the proteoforms detected in LCMS and MALDI is essential for proteoform assignment. In contrast to our recent study of rat brain where most peaks were annotated, (Liao et al., 2022), only a few peaks in these MALDI data were confidently assigned to the identified proteoforms. Some of the unassigned species are likely from artifacts such as oxidation and sodium adduction. Alternatively, the different sample preparation protocols in LCMS TDP and MALDI MSI may contributed to detection biases of proteoforms, despite that both methods are optimized for detection of small proteins <20 kDa. The experimental protocols, especially the tissue treatment steps in MALDI, can greatly influence the signal for different proteins (Enthaler et al., 2013; Rešetar Maslov et al., 2019) and need to be carefully optimized based on experimental goals and the tissue type being analyzed. It is noted that the high mass resolution was important for confident assignments. Many proteoforms can be matched to the MALDI peaks by their nominal masses but clearly did not match to the accurate masses. One example to highlight the benefit of high resolution MALDI MSI data is given in Supplementary Figure S17, where two species within ∼50 ppm showed distinct spatial distributions and were obviously two different species. The MALDI spectra can be very congested with mixed signal from multiple peptides, proteoforms, and bio-oligomers. Therefore, higher mass resolution and orthogonal separation (e.g., ion mobility) can be beneficial.
The identified peaks included high abundance proteins (e.g., ATP synthase subunits, histones), bacterial cold shock proteins, and uncharacterized proteins (Figure 5, Supplementary Figure S18). Similar to LCMS results, many of the species are small protein fragments from longer gene sequences. Without additional information, these proteoform functional roles remain unknown and some of them may simply be degradation artifacts. Interestingly, a peak matching to a soybean protein C-terminal fragment rich in cysteine was detected in the cortex of both the WT and the mutant (Figure 6, proteoform MS/MS spectrum from LCMS TDP is in Supplementary Figure S19). The proteoform with matching accurate mass in TDP showed decent fragmentation sequence coverage. Due to the protection of fragmentation from the presumed disulfides in the C-terminal half of the proteoform, we were not able to assign the unknown –45 Da mass shift, other than assuming two disulfide bonds (–4 Da) and another unknown mass shift of –41 Da. Nonetheless, the characteristics of this protein fragment are reminiscent of secreted peptides that are known to be important for signaling and development including innate immune response.(Stonoha-Arther and Wang 2018; Segonzac and Monaghan 2019; Takahashi et al., 2019) In the ion images, this peptide showed more penetration into the infection zone than the mutant. Another example of a bacterial protein C-terminal fragment (∼7 fold more abundant in the mutant sample in LCMS TDP, adjusted p-value 5E-5) is included in Supplementary Figure S20. Given the potential role of secreted peptides in signaling in rhizosphere and root development, (Matsuzaki et al., 2010; Ku et al., 2020; Xiang et al., 2021), some of these proteoforms may have biological implications in symbiosis and/or immune response.
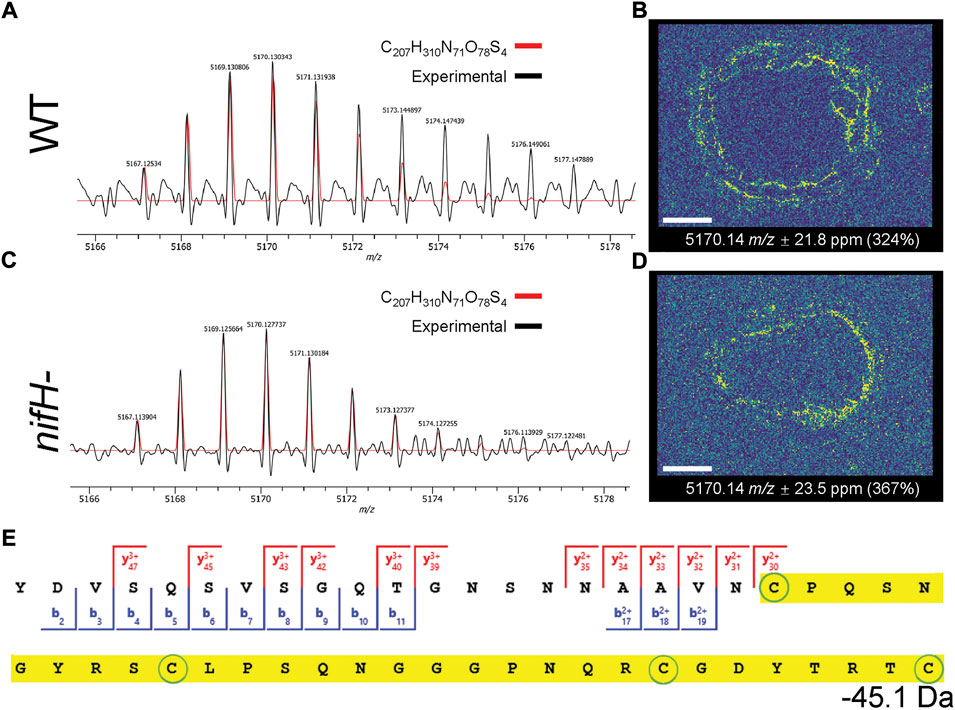
FIGURE 6. A shared species in the cortex of both WT and mutant samples at m/z 5,169, which was assigned to a disulfide-containing peptide of soybean origin based on accurate mass. (A,B) The accurate mass in MALDI spectra matched to the proteoform identified in LCMS TDP. (C,D) Corresponding ion image of the proteoforms in nodule tissue, showing its localization in the cortex. In (A–C), experimental spectra are plotted with black traces, overlaid with the theoretical isotopic distribution of the assigned proteoform in red (intensity offset to local median of experimental data for baseline correction). Note that the mass shift of −45.1 was represented as H13O2 in the molecular formula for matching accurate mass. Summed mass spectra and simulated isotope distributions were generated in PeakByPeak software. (E) The MS/MS sequence coverage of the assigned proteoform from LCMS TDP. It is a C-terminal fragment of uncharacterized soybean protein I1LLA5 (residue 55–104). An unknown mass shift of –45.1 Da was detected at the C-terminal region highlighted in yellow, which contained 4 cysteines. Given the lack of assigned b/y fragments in the region, the cysteines are presumably disulfide linked.
4 Discussion
PTMs are critical for tuning protein function and need to be characterized at the protein level because they are not directly encoded at the gene or transcript level. Although other non-MS based proteomics methods (e.g., nanopores, fluorescence and antibody-based methods) have emerged as attractive alternatives for protein sequencing, MS-based proteomics is currently the gold standard for untargeted PTM discovery. (Timp and Timp 2020) Recent advances in open modification search tools in BUP have inspired more studies into underexplored PTMs. (Chick et al., 2015; Kong et al., 2017; Schulze et al., 2021) Our TDP data presented here also took advantage of open modification search for “hypothesis-free” PTM discovery.
Compared to BUP, TDP has unique advantages for discovery-based experiments. First, TDP directly captures truncated proteoforms that otherwise cannot be seen with BUP.(Tholey and Becker 2017) As illustrated in Section 3.1, proteolytically truncated leghemoglobin proteoforms were significantly more abundant in the wildtype infected root nodules, while intact proteoforms were enriched in nifH- nodules. These changes appeared to be independent of total leghemoglobin abundance, which did not vary between the two conditions as measured by TDP and BUP. At first glance this result appears counterintuitive as more intact leghemoglobin could be interpreted as providing greater oxygen sequestering and activity. However, an alternative interpretation is that the more metabolically active wildtype root nodules produce reactive oxygen species, which leads to oxidative inactivation of the heme group or leghemoglobin protein (Jun et al., 1994a; Jun et al., 1994b). This effect necessitates increased turnover and degradation of these oxidized products in the form of proteolytic cleavage of leghemoglobin and release of the heme group. Also considering prior work (Agtuca et al., 2020) which showed heme B to be reduced in nifH-, we believe this suggests the proportion of leghemoglobin in the apo-state is increased when nitrogen fixation is lost.
A second advantage of TDP is the facile detection of PTMs that may be challenging to study by BUP. For example, cysteine palmitoylation (+238 Da) is a relatively large PTM for BUP that significantly changes the hydrophobicity of the peptide and requires specialized protocols to avoid the loss of the PTM during sample processing. In TDP, this PTM is smaller relative to the protein and leads to more modest impacts on its biochemical properties thereby ensuring a generic sample preparation protocol is sufficient for TDP characterization. And finally, TDP can measure combinations of PTMs (i.e., chemical modification, truncation) and amino acid substitutions among close homologs that may be separated into different peptides in BUP, which is often the case with hypermodified proteins such as histones (Taylor and Young 2021). Both of the above points could be demonstrated in our results within Section 3.2, specifically the uncharacterized proteins Q2KMJ4 and C6T4V4 which were both N-terminally myristoylated and palymitoylated. These are also exemplary as both proteins are significantly increased in abundance in the mutant sample (60- and 51-fold, respectively) based on quantification with TDP, and neither protein could be found unmodified which highlights the importance of these lipid modifications.
Third, TDP provides accurate masses of proteoforms that can directly correlate to MSI of intact proteins for determining their spatial distributions in situ, as demonstrated by the MALDI-MSI approach used here. Other MSI modalities have also been applied to proteoform imaging with complementary properties.(Garza et al., 2018; Yang et al., 2022) Proteoform assignment is typically achieved by searching in an intact mass database of theoretical proteoforms based on the proteins detected in BUP data, (Ryan et al., 2019), which often do not include all the possible PTMs and truncations due to incomplete sequence coverage. Simply opening up the search space by including more possible theoretical proteoforms will also more likely generate false positives, because combinations of PTMs and terminal truncations can force random matches. Direct fragmentation of proteoforms in situ during MSI have been demonstrated recently as the TDP methods and instruments improved.(Garza et al., 2018; Griffiths et al., 2020; Su et al., 2022; Yang et al., 2022) Herein, we have shown the assignment of several high abundance proteins and a few cysteine-rich peptides. Fully automated peak assignment for proteoform analysis is being actively developed. High mass resolution and accuracy is essential to minimize false positives. Additional metrics other than isotope fitting scores will also be beneficial to quantify the confidence level of the assignments in the future. We suspect many of the unassigned species were unknown biopolymers. Some proteins may also be differentially enriched/detected by the MALDI, to a large part due to the wash step. For example, leghemoglobins are highly abundant in LCMS but were barely seen in MALDI. They may have been removed in the wash steps due to high solubility. Such experimental conditions thus need to be carefully optimized for targeting specific proteoforms. Future improvements in fragmentation techniques can also help identify unknown species by performing targeted MS2 in situ for MALDI. This approach is increasingly applied within the other modalities aforementioned but difficult due to the singly charged nature of proteins generated by MALDI.
Despite the advantages of TDP, it has not been as widely adopted compared to BUP, largely due to the technical challenges discussed above in analysing intact proteins. Recent developments in instrumentation and informatics workflows have enabled large scale TDP studies, such as the Human Proteoform Atlas project.(Hollas et al., 2021; Smith et al., 2021; Melani et al., 2022) The limitations of intact protein sample complexity, low sensitivity, and sequence coverage against large proteins remain, but are being addressed with new experimental technologies including solution-phase separation and enrichment (Melby et al., 2021), ion mobility (Fulcher et al., 2021; Gerbasi et al., 2021), proton transfer reaction (Huguet et al., 2019; Ugrin et al., 2019) and charge detection mass spectrometry (Harper et al., 2019; Kafader et al., 2020; Todd et al., 2020; Worner et al., 2020; Su et al., 2022). Notably, charge detection-based method expanded the measurable proteoforms into 70 kDa range in a recent TDP tissue imaging study by nanospray desorption electrospray ionization (nanoDESI), (Su et al., 2022), highlighting the potential for easier access of high mass proteoforms. Our TDP results on soybean root nodule demonstrate the ways in which TDP can already make significant contributions in studying the proteome <25 kDa despite technologies not yet being mature enough for accessing the full proteome. As documented by recent literature (Takeda et al., 2007; Kereszt et al., 2018; Xiang et al., 2021) plant roots are known to be rich in proteases, secreted signaling peptides, and small proteins important for plant root development and function. Therefore, TDP is well suited for discovering molecular mechanisms related to uncommon PTMs and proteolytic events that are often overlooked by more common methods.
Data availability statement
The TDP and MALDI datasets generated for this study can be found in the at massive.ucsd.edu with MassIVE accession: MSV000089984 (https://massive.ucsd.edu/ProteoSAFe/dataset.jsp?task=6ac410bc49ec41f1a91f49e063943cce). The TDP data include search results from TopPIC, filtered proteoform identifications, and quantitation results. The MALDI data include instrument raw data and xml, which can be loaded in imaging software for visualization. The previously published bottom-up proteomics datasets reanalyzed in this study can be found at massive.ucsd.edu with MassIVE accession: MSV000088754.
Author contributions
MZ: conceptualization, formal analysis, investigation, writing—original draft, visualization, project administration, funding acquisition. JF: formal analysis, writing—original draft, visualization. KZ: formal analysis, investigation, writing—original draft, visualization. DD: software, original draft. Y-CL: formal analysis, investigation, writing—review and editing. MV: investigation, writing—review and editing. DV: investigation. LB: software, resources. WK: resources, funding acquisition. GS: resources, writing—review and editing, funding acquisition. LP-T: resources, writing—review and editing, funding acquisition.
Funding
This research was performed on project awards (10.46936/lser.proj. 2021.51846/60000343, G.S.; 10.46936/intm.proj. 2020.51671/60000250, M.Z.; 10.46936/intm.proj. 2019.51159/60000152, W.K.) from the Environmental Molecular Sciences Laboratory, a DOE Office of Science User Facility sponsored by the Biological and Environmental Research program. This work was also funded by a grant from the National Science Foundation (NSF) Plant Genome Program under award number IOS-1734145.
Acknowledgments
We thank Matthew Monroe for helping with data deposition.
Conflict of interest
The authors declare that the research was conducted in the absence of any commercial or financial relationships that could be construed as a potential conflict of interest.
Publisher’s note
All claims expressed in this article are solely those of the authors and do not necessarily represent those of their affiliated organizations, or those of the publisher, the editors and the reviewers. Any product that may be evaluated in this article, or claim that may be made by its manufacturer, is not guaranteed or endorsed by the publisher.
Supplementary material
The Supplementary Material for this article can be found online at: https://www.frontiersin.org/articles/10.3389/frans.2022.1012707/full#supplementary-material
References
Agtuca, B. J., Stopka, S. A., Evans, S., Samarah, L., Liu, Y., Xu, D., et al. (2020). Metabolomic profiling of wild-type and mutant soybean root nodules using laser-ablation electrospray ionization mass spectrometry reveals altered metabolism. Plant J. 103 (5), 1937–1958. doi:10.1111/tpj.14815
Angel, T. E., Aryal, U. K., Hengel, S. M., Baker, E. S., Kelly, R. T., Robinson, E. W., et al. (2012). Mass spectrometry-based proteomics: Existing capabilities and future directions. Chem. Soc. Rev. 41 (10), 3912–3928. doi:10.1039/c2cs15331a
Auclair, J. R., Salisbury, J. P., Johnson, J. L., Petsko, G. A., Ringe, D., Bosco, D. A., et al. (2014). Artifacts to avoid while taking advantage of top-down mass spectrometry based detection of protein S-thiolation. PROTEOMICS 14 (10), 1152–1157. doi:10.1002/pmic.201300450
Azad, G. K., Swagatika, S., Kumawat, M., Kumawat, R., and Tomar, R. S. (2018). Modifying chromatin by histone tail clipping. J. Mol. Biol. 430 (18), 3051–3067. doi:10.1016/j.jmb.2018.07.013
Balakireva, A. V., and Zamyatnin, A. A. (2018). Indispensable role of proteases in plant innate immunity. Int. J. Mol. Sci. 19 (2), 629. doi:10.3390/ijms19020629
Belov, M. E., Ellis, S. R., Dilillo, M., Paine, M. R. L., Danielson, W. F., Anderson, G. A., et al. (2017). Design and performance of a novel interface for combined matrix-assisted laser desorption ionization at elevated pressure and electrospray ionization with Orbitrap mass spectrometry. Anal. Chem. 89 (14), 7493–7501. doi:10.1021/acs.analchem.7b01168
Böcker, S., Letzel, M. C., Lipták, Z., and Pervukhin, A. (2008). SIRIUS: Decomposing isotope patterns for metabolite identification. Bioinformatics 25 (2), 218–224. doi:10.1093/bioinformatics/btn603
Chen, G., Zhang, Y., Trinidad, J. C., and Dann, C. (2018). Distinguishing sulfotyrosine containing peptides from their phosphotyrosine counterparts using mass spectrometry. J. Am. Soc. Mass Spectrom. 29 (3), 455–462. doi:10.1007/s13361-017-1854-1
Chick, J. M., Kolippakkam, D., Nusinow, D. P., Zhai, B., Rad, R., Huttlin, E. L., et al. (2015). A mass-tolerant database search identifies a large proportion of unassigned spectra in shotgun proteomics as modified peptides. Nat. Biotechnol. 33 (7), 743–749. doi:10.1038/nbt.3267
Creasy, D. M., and Cottrell, J. S. (2004). Unimod: Protein modifications for mass spectrometry. PROTEOMICS 4 (6), 1534–1536. doi:10.1002/pmic.200300744
Degnan, D. J., Bramer, L. M., White, A. M., Zhou, M., Bilbao, A., and McCue, L. A. (2021). PSpecteR: A user-friendly and interactive application for visualizing top-down and bottom-up proteomics data in R. J. Proteome Res. 20 (4), 2014–2020. doi:10.1021/acs.jproteome.0c00857
Dittwald, P., Claesen, J., Burzykowski, T., Valkenborg, D., and Gambin, A. (2013). Brain: A universal tool for high-throughput calculations of the isotopic distribution for mass spectrometry. Anal. Chem. 85 (4), 1991–1994. doi:10.1021/ac303439m
Enthaler, B., Bussmann, T., Pruns, J. K., Rapp, C., Fischer, M., and Vietzke, J.-P. (2013). Influence of various on-tissue washing procedures on the entire protein quantity and the quality of matrix-assisted laser desorption/ionization spectra. Rapid Commun. Mass Spectrom. 27 (8), 878–884. doi:10.1002/rcm.6513
Fink, T., and Jerala, R. (2022). Designed protease-based signaling networks. Curr. Opin. Chem. Biol. 68, 102146. doi:10.1016/j.cbpa.2022.102146
Francis, S. H., and Engleman, E. G. (1978). Cascade control of E. coli glutamine synthetase: I. Studies on the uridylyl transferase and uridylyl removing enzyme(s) from E. coli. Arch. Biochem. Biophys. 191 (2), 590–601. doi:10.1016/0003-9861(78)90397-1
Fulcher, J. M., Makaju, A., Moore, R. J., Zhou, M., Bennett, D. A., De Jager, P. L., et al. (2021). Enhancing top-down proteomics of brain tissue with FAIMS. J. Proteome Res. 20 (5), 2780–2795. doi:10.1021/acs.jproteome.1c00049
García, I., Arenas-Alfonseca, L., Moreno, I., Gotor, C., and Romero, L. C. (2018). HCN regulates cellular processes through posttranslational modification of proteins by S-cyanylation. Plant Physiol. 179 (1), 107–123. doi:10.1104/pp.18.01083
Garza, K. Y., Feider, C. L., Klein, D. R., Rosenberg, J. A., Brodbelt, J. S., and Eberlin, L. S. (2018). Desorption electrospray ionization mass spectrometry imaging of proteins directly from biological tissue sections. Anal. Chem. 90 (13), 7785–7789. doi:10.1021/acs.analchem.8b00967
Gerbasi, V. R., Melani, R. D., Abbatiello, S. E., Belford, M. W., Huguet, R., McGee, J. P., et al. (2021). Deeper protein identification using field asymmetric ion mobility spectrometry in top-down proteomics. Anal. Chem. 93 (16), 6323–6328. doi:10.1021/acs.analchem.1c00402
Griffiths, R. L., Hughes, J. W., Abbatiello, S. E., Belford, M. W., Styles, I. B., and Cooper, H. J. (2020). Comprehensive LESA mass spectrometry imaging of intact proteins by integration of cylindrical FAIMS. Anal. Chem. 92 (4), 2885–2890. doi:10.1021/acs.analchem.9b05124
Hahn, M., Meyer, L., Studer, D., Regensburger, B., and Hennecke, H. (1984). Insertion and deletion mutations within the nif region of Rhizobium japonicum. Plant Mol. Biol. 3 (3), 159–168. doi:10.1007/BF00016063
Hargrove, M. S., Barry, J. K., Brucker, E. A., Berry, M. B., Phillips, G. N., Olson, J. S., et al. (1997). Characterization of recombinant soybean leghemoglobin a and apolar distal histidine mutants. J. Mol. Biol. 266 (5), 1032–1042. doi:10.1006/jmbi.1996.0833
Harper, C. C., Elliott, A. G., Oltrogge, L. M., Savage, D. F., and Williams, E. R. (2019). Multiplexed charge detection mass spectrometry for high-throughput single ion analysis of large molecules. Anal. Chem. 91 (11), 7458–7465. doi:10.1021/acs.analchem.9b01669
Hochgräfe, F., Mostertz, J., Pöther, D.-C., Becher, D., Helmann, J. D., and Hecker, M. (2007). S-cysteinylation is a general mechanism for thiol protection of Bacillus subtilis proteins after oxidative stress. J. Biol. Chem. 282 (36), 25981–25985. doi:10.1074/jbc.C700105200
Hollas, M. A. R., Robey, M. T., Fellers, R. T., LeDuc, R. D., Thomas, P. M., and Kelleher, N. L. (2021). The human proteoform Atlas: A FAIR community resource for experimentally derived proteoforms. Nucleic Acids Res. 50 (D1), D526–D533. doi:10.1093/nar/gkab1086
Huergo, L. F., Chandra, G., and Merrick, M. (2013). PII signal transduction proteins: Nitrogen regulation and beyond. FEMS Microbiol. Rev. 37 (2), 251–283. doi:10.1111/j.1574-6976.2012.00351.x
Huguet, R., Mullen, C., Srzentic, K., Greer, J. B., Fellers, R. T., Zabrouskov, V., et al. (2019). Proton transfer charge reduction enables high-throughput top-down analysis of large proteoforms. Anal. Chem. 91 (24), 15732–15739. doi:10.1021/acs.analchem.9b03925
Jacobson, G. R., Schaffer, M. H., Stark, G. R., and Vanaman, T. C. (1973). Specific chemical cleavage in high yield at the amino peptide bonds of cysteine and cystine residues. J. Biol. Chem. 248 (19), 6583–6591. doi:10.1016/s0021-9258(19)43393-0
Jeong, S.-C., Yang, K., Park, J.-Y., Han, K. S., Yu, S., Hwang, T.-Y., et al. (2006). Structure, expression, and mapping of two nodule-specific genes identified by mining public soybean EST databases. Gene 383, 71–80. doi:10.1016/j.gene.2006.07.015
Ji, Y., Leymarie, N., Haeussler, D. J., Bachschmid, M. M., Costello, C. E., and Lin, C. (2013). Direct detection of S-palmitoylation by mass spectrometry. Anal. Chem. 85 (24), 11952–11959. doi:10.1021/ac402850s
Jun, H.-K., Sarath, G., and Wagner, F. W. (1994a). Detection and purification of modified leghemoglobins from soybean root nodules. Plant Sci. 100 (1), 31–40. doi:10.1016/0168-9452(94)90131-7
Jun, H. K., Sarath, G., Moran, J. F., Becana, M., Klucas, R. V., and Wagner, F. W. (1994b). Characteristics of modified leghemoglobins isolated from soybean (Glycine max merr.) root nodules. Plant Physiol. 104 (4), 1231–1236. doi:10.1104/pp.104.4.1231
Kafader, J. O., Melani, R. D., Durbin, K. R., Ikwuagwu, B., Early, B. P., Fellers, R. T., et al. (2020). Multiplexed mass spectrometry of individual ions improves measurement of proteoforms and their complexes. Nat. Methods 17 (4), 391–394. doi:10.1038/s41592-020-0764-5
Kaushal, P., and Lee, C. (2021). N-terminomics – its past and recent advancements. J. Proteomics 233, 104089. doi:10.1016/j.jprot.2020.104089
Kelly, R. T. (2020). Single-cell proteomics: Progress and prospects. Mol. Cell. Proteomics 19 (11), 1739–1748. doi:10.1074/mcp.R120.002234
Kereszt, A., Mergaert, P., Montiel, J., Endre, G., and Kondorosi, É. (2018). Impact of plant peptides on symbiotic nodule development and functioning. Front. Plant Sci. 9, 1026. doi:10.3389/fpls.2018.01026
Kong, A. T., Leprevost, F. V., Avtonomov, D. M., Mellacheruvu, D., and Nesvizhskii, A. I. (2017). MSFragger: Ultrafast and comprehensive peptide identification in mass spectrometry–based proteomics. Nat. Methods 14 (5), 513–520. doi:10.1038/nmeth.4256
Kou, Q., Xun, L., and Liu, X. (2016). TopPIC: A software tool for top-down mass spectrometry-based proteoform identification and characterization. Bioinformatics 32 (22), 3495–3497. doi:10.1093/bioinformatics/btw398
Ku, Y.-S., Cheng, S.-S., Gerhardt, A., Cheung, M.-Y., Contador, C. A., Poon, L.-Y. W., et al. (2020). Secretory peptides as bullets: Effector peptides from pathogens against antimicrobial peptides from soybean. Int. J. Mol. Sci. 21 (23), 9294. doi:10.3390/ijms21239294
Lanucara, F., and Eyers, C. E. (2013). Top-down mass spectrometry for the analysis of combinatorial post-translational modifications. Mass Spectrom. Rev. 32 (1), 27–42. doi:10.1002/mas.21348
Liao, Y.-C., Fulcher, J., Degnan, D., Williams, S., Bramer, L., Veličković, D., et al. (2022). Spatially resolved top-down proteomics of tissue sections based on a microfluidic nanodroplet sample preparation platform. ChemRxiv. doi:10.26434/chemrxiv-2022-pcn8c
Lundberg, E., and Borner, G. H. H. (2019). Spatial proteomics: A powerful discovery tool for cell biology. Nat. Rev. Mol. Cell Biol. 20 (5), 285–302. doi:10.1038/s41580-018-0094-y
Matsuzaki, Y., Ogawa-Ohnishi, M., Mori, A., and Matsubayashi, Y. (2010). Secreted peptide signals required for maintenance of root stem cell niche in Arabidopsis. Science 329 (5995), 1065–1067. doi:10.1126/science.1191132
Medzihradszky, K. F., Darula, Z., Perlson, E., Fainzilber, M., Chalkley, R. J., Ball, H., et al. (2004). O-Sulfonation of serine and threonine: Mass spectrometric detection and characterization of a new posttranslational modification in diverse proteins throughout the eukaryotes. Mol. Cell. Proteomics 3 (5), 429–440. doi:10.1074/mcp.M300140-MCP200
Melani, R. D., Gerbasi, V. R., Anderson, L. C., Sikora, J. W., Toby, T. K., Hutton, J. E., et al. (2022). The blood proteoform Atlas: A reference map of proteoforms in human hematopoietic cells. Science 375 (6579), 411–418. doi:10.1126/science.aaz5284
Melby, J. A., Roberts, D. S., Larson, E. J., Brown, K. A., Bayne, E. F., Jin, S., et al. (2021). Novel strategies to address the challenges in top-down proteomics. J. Am. Soc. Mass Spectrom. 32 (6), 1278–1294. doi:10.1021/jasms.1c00099
Müller-Schüssele, S. J., Bohle, F., Rossi, J., Trost, P., Meyer, A. J., and Zaffagnini, M. (2021). Plasticity in plastid redox networks: Evolution of glutathione-dependent redox cascades and glutathionylation sites. BMC Plant Biol. 21 (1), 322. doi:10.1186/s12870-021-03087-2
Nagornov, K. O., Kozhinov, A. N., Gasilova, N., Menin, L., and Tsybin, Y. O. (2020). Transient-mediated simulations of FTMS isotopic distributions and mass spectra to guide experiment design and data analysis. J. Am. Soc. Mass Spectrom. 31 (9), 1927–1942. doi:10.1021/jasms.0c00190
Nemeth-Cawley, J. F., Karnik, S., and Rouse, J. C. (2001). Analysis of sulfated peptides using positive electrospray ionization tandem mass spectrometry. J. Mass Spectrom. 36 (12), 1301–1311. doi:10.1002/jms.235
O'Brian, M. R., Kirshbom, P. M., and Maier, R. J. (1987). Bacterial heme synthesis is required for expression of the leghemoglobin holoprotein but not the apoprotein in soybean root nodules. Proc. Natl. Acad. Sci. U. S. A. 84 (23), 8390–8393. doi:10.1073/pnas.84.23.8390
Park, J., Piehowski, P. D., Wilkins, C., Zhou, M., Mendoza, J., Fujimoto, G. M., et al. (2017). Informed-proteomics: Open-source software package for top-down proteomics. Nat. Methods 14 (9), 909–914. doi:10.1038/nmeth.4388
Podell, S., and Gribskov, M. (2004). Predicting N-terminal myristoylation sites in plant proteins. BMC Genomics 5 (1), 37. doi:10.1186/1471-2164-5-37
Rešetar Maslov, D., Svirkova, A., Allmaier, G., Marchetti-Deschamann, M., and Kraljević Pavelić, S. (2019). Optimization of MALDI-TOF mass spectrometry imaging for the visualization and comparison of peptide distributions in dry-cured ham muscle fibers. Food Chem. 283, 275–286. doi:10.1016/j.foodchem.2018.12.126
Resh, M. D. (1999). Fatty acylation of proteins: New insights into membrane targeting of myristoylated and palmitoylated proteins. Biochim. Biophys. Acta 1451 (1), 1–16. doi:10.1016/s0167-4889(99)00075-0
Rouhier, N., Lemaire, S. D., and Jacquot, J.-P. (2008). The role of glutathione in photosynthetic organisms: Emerging functions for glutaredoxins and glutathionylation. Annu. Rev. Plant Biol. 59 (1), 143–166. doi:10.1146/annurev.arplant.59.032607.092811
Ryan, D. J., Spraggins, J. M., and Caprioli, R. M. (2019). Protein identification strategies in MALDI imaging mass spectrometry: A brief review. Curr. Opin. Chem. Biol. 48, 64–72. doi:10.1016/j.cbpa.2018.10.023
Samarah, L. Z., Tran, T. H., Stacey, G., and Vertes, A. (2021). Mass spectrometry imaging of bio-oligomer polydispersity in plant tissues by laser desorption ionization from silicon nanopost arrays. Angew. Chem. Int. Ed. Engl. 60 (16), 9071–9077. doi:10.1002/anie.202015251
Schaffer, L. V., Millikin, R. J., Miller, R. M., Anderson, L. C., Fellers, R. T., Ge, Y., et al. (2019). Identification and quantification of proteoforms by mass spectrometry. Proteomics 19 (10), 1800361. doi:10.1002/pmic.201800361
Schaffer, L. V., Millikin, R. J., Shortreed, M. R., Scalf, M., and Smith, L. M. (2020). Improving proteoform identifications in complex systems through integration of bottom-up and top-down data. J. Proteome Res. 19 (8), 3510–3517. doi:10.1021/acs.jproteome.0c00332
Schulze, S., Igiraneza, A. B., Kösters, M., Leufken, J., Leidel, S. A., Garcia, B. A., et al. (2021). Enhancing open modification searches via a combined approach facilitated by ursgal. J. Proteome Res. 20 (4), 1986–1996. doi:10.1021/acs.jproteome.0c00799
Segonzac, C., and Monaghan, J. (2019). Modulation of plant innate immune signaling by small peptides. Curr. Opin. Plant Biol. 51, 22–28. doi:10.1016/j.pbi.2019.03.007
Slavov, N. (2021). Single-cell protein analysis by mass spectrometry. Curr. Opin. Chem. Biol. 60, 1–9. doi:10.1016/j.cbpa.2020.04.018
Smith, L. M., Agar, J. N., Chamot-Rooke, J., Danis, P. O., Ge, Y., Loo, J. A., et al. (2021). The human proteoform project: Defining the human proteome. Sci. Adv. 7 (46), eabk0734. doi:10.1126/sciadv.abk0734
Smith, L. M., and Kelleher, N. L. (2018). Proteoforms as the next proteomics currency. Science 359 (6380), 1106–1107. doi:10.1126/science.aat1884
Smith, L. M., Thomas, P. M., Shortreed, M. R., Schaffer, L. V., Fellers, R. T., LeDuc, R. D., et al. (2019). A five-level classification system for proteoform identifications. Nat. Methods 16 (10), 939–940. doi:10.1038/s41592-019-0573-x
Stonoha-Arther, C., and Wang, D. (2018). Tough love: Accommodating intracellular bacteria through directed secretion of antimicrobial peptides during the nitrogen-fixing symbiosis. Curr. Opin. Plant Biol. 44, 155–163. doi:10.1016/j.pbi.2018.04.017
Su, P., McGee, J. P., Durbin, K. R., Hollas, M. A. R., Yang, M., Neumann, E. K., et al. (2022). Highly multiplexed, label-free proteoform imaging of tissues by individual ion mass spectrometry. Sci. Adv. 8 (32), eabp9929. doi:10.1126/sciadv.abp9929
Takahashi, F., Hanada, K., Kondo, T., and Shinozaki, K. (2019). Hormone-like peptides and small coding genes in plant stress signaling and development. Curr. Opin. Plant Biol. 51, 88–95. doi:10.1016/j.pbi.2019.05.011
Takeda, N., Kistner, C., Kosuta, S., Winzer, T., Pitzschke, A., Groth, M., et al. (2007). Proteases in plant root symbiosis. Phytochemistry 68 (1), 111–121. doi:10.1016/j.phytochem.2006.09.022
Tanco, S., Gevaert, K., and Van Damme, P. (2015). C-terminomics: Targeted analysis of natural and posttranslationally modified protein and peptide C-termini. PROTEOMICS 15 (5-6), 903–914. doi:10.1002/pmic.201400301
Taylor, B. C., and Young, N. L. (2021). Combinations of histone post-translational modifications. Biochem. J. 478 (3), 511–532. doi:10.1042/BCJ20200170
Taylor, M. J., Lukowski, J. K., and Anderton, C. R. (2021). Spatially resolved mass spectrometry at the single cell: Recent innovations in proteomics and metabolomics. J. Am. Soc. Mass Spectrom. 32 (4), 872–894. doi:10.1021/jasms.0c00439
Tholey, A., and Becker, A. (2017). Top-down proteomics for the analysis of proteolytic events - methods, applications and perspectives. Biochim. Biophys. Acta. Mol. Cell Res. 1864 (11), 2191–2199. doi:10.1016/j.bbamcr.2017.07.002
Timp, W., and Timp, G. (2020). Beyond mass spectrometry, the next step in proteomics. Sci. Adv. 6 (2), eaax8978. doi:10.1126/sciadv.aax8978
Todd, A. R., Barnes, L. F., Young, K., Zlotnick, A., and Jarrold, M. F. (2020). Higher resolution charge detection mass spectrometry. Anal. Chem. 92 (16), 11357–11364. doi:10.1021/acs.analchem.0c02133
Ugrin, S. A., English, A. M., Syka, J. E. P., Bai, D. L., Anderson, L. C., Shabanowitz, J., et al. (2019). Ion-ion proton transfer and parallel ion parking for the analysis of mixtures of intact proteins on a modified Orbitrap mass analyzer. J. Am. Soc. Mass Spectrom. 30 (10), 2163–2173. doi:10.1007/s13361-019-02290-8
Veličković, D., Liao, Y.-C., Thibert, S., Veličković, M., Anderton, C., Voglmeir, J., et al. (2022). Spatial mapping of plant N-glycosylation cellular heterogeneity inside soybean root nodules provided insights into legume-rhizobia symbiosis. Front. Plant Sci. 13, 869281. doi:10.3389/fpls.2022.869281
Waszczak, C., Akter, S., Jacques, S., Huang, J., Messens, J., and Van Breusegem, F. (2015). Oxidative post-translational modifications of cysteine residues in plant signal transduction. J. Exp. Bot. 66 (10), 2923–2934. doi:10.1093/jxb/erv084
Wienkoop, S., and Saalbach, G. (2003). Proteome analysis. Novel proteins identified at the peribacteroid membrane from Lotus japonicus root nodules. Plant Physiol. 131 (3), 1080–1090. doi:10.1104/pp.102.015362
Worner, T. P., Snijder, J., Bennett, A., Agbandje-McKenna, M., Makarov, A. A., and Heck, A. J. R. (2020). Resolving heterogeneous macromolecular assemblies by Orbitrap-based single-particle charge detection mass spectrometry. Nat. Methods 17 (4), 395–398. doi:10.1038/s41592-020-0770-7
Wu, J., Gage, D. A., and Watson, J. T. (1996). A strategy to locate cysteine residues in proteins by specific chemical cleavage followed by matrix-assisted laser desorption/ionization time-of-flight mass spectrometry. Anal. Biochem. 235 (2), 161–174. doi:10.1006/abio.1996.0108
Xiang, D., Meng, F., Wang, A., Wu, Y., Wang, Z., Zheng, S., et al. (2021). Root-secreted peptide OsPEP1 regulates primary root elongation in rice. Plant J. 107 (2), 480–492. doi:10.1111/tpj.15303
Yang, J., and Caprioli, R. M. (2011). Matrix sublimation/recrystallization for imaging proteins by mass spectrometry at high spatial resolution. Anal. Chem. 83 (14), 5728–5734. doi:10.1021/ac200998a
Yang, M., Hu, H., Su, P., Thomas, P. M., Camarillo, J. M., Greer, J. B., et al. (2022). Proteoform-selective imaging of tissues using mass spectrometry. Angew. Chem. Int. Ed. Engl. 61 (29), e202200721. doi:10.1002/anie.202200721
Yuan, S., Ke, D., Li, R., Li, X., Wang, L., Chen, H., et al. (2020). Genome-wide survey of soybean papain-like cysteine proteases and their expression analysis in root nodule symbiosis. BMC Plant Biol. 20 (1), 517. doi:10.1186/s12870-020-02725-5
Zemaitis, K. J., Velickovic, D., Kew, W., Fort, K. L., Reinhardt-Szyba, M., Pamreddy, A., et al. (2022). Enhanced spatial mapping of histone proteoforms in human kidney through MALDI-MSI by high-field UHMR-orbitrap detection. Anal. Chem. doi:10.1021/acs.analchem.2c01034
Zhang, Y., Fonslow, B. R., Shan, B., Baek, M.-C., and Yates, J. R. (2013). Protein analysis by shotgun/bottom-up proteomics. Chem. Rev. 113 (4), 2343–2394. doi:10.1021/cr3003533
Keywords: proteoform, mass spectrometry, proteomics, post-translational modification, imaging, symbiosis, soybean nodule, Rhizobia (Bradyrhizobium japonicum)
Citation: Zhou M, Fulcher JM, Zemaitis KJ, Degnan DJ, Liao Y-C, Veličković M, Veličković D, Bramer LM, Kew WR, Stacey G and Paša-Tolić L (2022) Discovery top-down proteomics in symbiotic soybean root nodules. Front. Anal. Sci. 2:1012707. doi: 10.3389/frans.2022.1012707
Received: 05 August 2022; Accepted: 12 September 2022;
Published: 30 September 2022.
Edited by:
Manfred Wuhrer, Leiden University Medical Center (LUMC), NetherlandsReviewed by:
Yanbao Yu, University of Delaware, United StatesTaufika Islam Williams, North Carolina State University, United States
Copyright © 2022 Zhou, Fulcher, Zemaitis, Degnan, Liao, Veličković, Veličković, Bramer, Kew, Stacey and Paša-Tolić. This is an open-access article distributed under the terms of the Creative Commons Attribution License (CC BY). The use, distribution or reproduction in other forums is permitted, provided the original author(s) and the copyright owner(s) are credited and that the original publication in this journal is cited, in accordance with accepted academic practice. No use, distribution or reproduction is permitted which does not comply with these terms.
*Correspondence: Mowei Zhou, bW93ZWkuemhvdUBwbm5sLmdvdg==
†These authors have contributed equally to this work and share first authorship