 Mitchell Tiessen
 Holly M. Fruehwald
 E. Bradley Easton
 Theresa Stotesbury
- 1Applied Bioscience Graduate Program, Ontario Tech University, Oshawa, ON, Canada
- 2Materials Science Graduate Program, Ontario Tech University, Oshawa, ON, Canada
- 3Faculty of Science, Ontario Tech University, Oshawa, ON, Canada
Blood is an important type of forensic evidence because it can be used for source identification, toxicological analyses, and bloodstain pattern interpretation. Determining the time that bloodshed occurred, often described as the bloodstain’s time since deposition (TSD), has important implications for crime scene investigation. In this work, we focus on using electrochemical methods to monitor the gradual oxidative changes and electron-transfer reactions of hemoglobin (Hb) occurring in degrading bloodstains using differential pulse and hydrodynamic voltammetry. Bloodstains were monitored across a two-week time series in five different temperature conditions. Linear mixed models generated from the differential pulse voltammograms (DPV) suggested that 7 of 27 variables related to the redox reactions associated with the blood film were significantly correlated with time (p < 0.033). Of these correlated variables, all were related to the reduction of bound oxygen to hemoglobin or the oxidation of hemoglobin degradation products within the film. Hydrodynamic voltammetry demonstrated that hemoglobin retains its catalytic activity for oxygen reduction when aged on an electrode surface with a shift to greater peroxide formation the longer it is aged. The time series models are improved when the biological replicate is considered as a random effect, and as well as when peak area ratios are included in the model. Interestingly, using linear mixed models we observed a significant change in redox response at the 96-h time point (p < 0.043) regardless of temperature condition. Overall, we demonstrate preliminary support for DPV as a technique for TSD estimation of bloodstains.
1 Introduction
Blood samples and bloodstained evidence remain amongst one of the most frequently collected substances by forensic professionals (Virkler and Lednev, 2009; Dinis-Oliveira et al., 2010). Bloodstains encountered at crime scenes and blood samples obtained for investigative purposes hold high evidentiary value because of its distinctive physical, chemical and biological properties (Barni et al., 2007; Liu et al., 2012; Attinger et al., 2013; Sparer et al., 2020; Streeting et al., 2020). Whole blood contains several biomolecules of interest to forensic and medical professionals including DNA and RNA, hemoglobin (Hb), as well as drugs and their respective metabolites. For example, forensic investigators collect blood evidence for source attribution through DNA profiling and, forensic toxicologists routinely analyze blood samples for the presence of illicit or impairing drugs, poisons, and prescribed medications (Peters, 2007; Dinis-Oliveira et al., 2010; Simões et al., 2018). Additionally, bloodstain pattern analysis can be applied to specific types of bloodstains and bloodstain patterns observed at crime scenes (James et al., 2005).
Within forensic science, estimating the time since deposition (TSD) of evidence is of major interest. Across the TSD literature, the unity of place and time is a primary objective in evidence analysis. Linking an individual or material to a location within a particular time frame offers a more detailed explanation to the sequence of events. This is valuable information for law enforcement and courtroom testimony. A number of forensically relevant samples that have been studied for TSD applications include: paints/inks (Lociciro et al., 2004; Weyermann et al., 2007), fingerprints (Weyermann et al., 2011), and various biological evidence including blood (Bauer et al., 2003; Anderson et al., 2011; Li et al., 2013; Doty et al., 2016, 2017; Shukla, 2017; Yinming Zhang et al., 2017; Salzmann et al., 2021).
Blood evidence holds a wealth of information for investigators but determining the time of bloodshed remains a challenging question to answer. Research regarding methods to estimate the TSD of a bloodstain has been conducted for roughly 20 years (Zadora and Menżyk, 2018), with a focus on studies that measure Hb and cellular component degradation through spectrometric techniques (Bremmer et al., 2011; Hanson et al., 2011; Doty et al., 2017) and the changes in DNA and/or RNA (Alshehhi and Haddrill, 2019; Fang et al., 2019; Fu and Allen, 2019; Cossette et al., 2021; Heneghan et al., 2021). However, there is currently no generally accepted method for determining the TSD of a bloodstain, and previously proposed methods are still being optimized for time resolution and extended age correlation (Mc Shine et al., 2017; Alshehhi and Haddrill, 2019). Complexity largely arises from the variation in the blood source and environmental conditions like temperature, humidity, and sunlight (Bremmer et al., 2011; Li et al., 2013; Zadora and Menżyk, 2018; Cossette et al., 2021).
For TSD estimates of bloodstains, Hb remains the primary biomolecule of interest because it comprises roughly 90% of the dry weight of red blood cells (RBCs) (James et al., 2005). The oxidative changes of Hb, particularly the central iron atom, demonstrate promising correlations with time in past forensic research initiatives (Hanson and Ballantyne, 2010; Bremmer et al., 2011; Hanson et al., 2011). In a healthy individual, Hb exists in three states: oxygenated Hb (oxyHb), deoxygenated Hb (deoxyHb), and methemoglobin (metHb). OxyHb refers to when the primary ligand, oxygen (O2), is reversibly bound to the central iron atom located in the protoporphyrin ring. There is debate whether iron is in its ferrous (Fe2+) or ferric (Fe3+) oxidation state during this configuration with the majority of the research supporting the ferrous state (Bremmer et al., 2012; Zadora and Menżyk, 2018). Upon O2 binding, the central iron atom is brought into plane with the protoporphyrin ring, adopting a low spin state. The absence of O2 in the Hb-protein complex refers to deoxyHb. In this state, the central iron atom is in a ferrous state and sits 0.4 Å outside the protoporphyrin ring to protect itself from oxidative damages (Umbreit, 2007; Zadora and Menżyk, 2018). These two states form the majority of Hb in a healthy individual. However, despite the stability of oxyHb, roughly 3% is oxidized daily to metHb (Toh et al., 2014; Zadora and Menżyk, 2018). During this process, the bound O2 is reduced to water, coupled with the oxidation of Hb from its Fe2+ to Fe3+ state. In its Fe3+ form, water is the primary ligand and the Hb protein is unable to carry O2. In a healthy individual the concentrations of metHb are maintained through internal reduction mechanisms such as glutathione peroxidase, cytochrome b5 oxidoreductase, and methemoglobin reductase (Shikama, 1998; Lemler et al., 2014; Zadora and Menżyk, 2018). These mechanisms effectively recycle metHb to deoxyHb where they can carry O2 again. Issues with these internal reduction systems are the primary causes for blood related conditions such as anemia and thalassemia (Bonaventura et al., 2013; Kassa et al., 2016; Hussain et al., 2017). In a bloodstain, similar oxidative changes to Hb occur over time with additional degradation processes to cellular components.
In ex vivo conditions, such as when a bloodstain is formed, the available deoxyHb is immediately saturated with atmospheric O2 and is converted to oxyHb. The high affinity for an O2 molecule by free heme is responsible for this immediate reaction (Bonaventura et al., 2013). From here, the oxyHb begins its gradual oxidation to metHb. The enzymes responsible for converting metHb back to deoxyHb are no longer available due to denaturation (Dissing et al., 2010). Following this, the degradation continues with both reversible and irreversible changes to the protein structure resulting in the formation of hemi- and hemochrome (HC). These species are named from the oxidation state of the iron, either in its ferric (hemichrome-Fe3+) or ferrous (hemochrome-Fe2+) states (Hanson and Ballantyne, 2010). Over time further degradation of the bloodstain is driven by environmental stresses leading to cellular damage and hemolysis. The ex vivo Hb degradation pathway is of interest to forensic researchers as it offers insight in TSD estimation changes that can be detecting using analytical techniques.
In this study, we use electrochemical methods to study degrading bloodstains, and assess if Hb related measurements are useful for TSD estimation. Electrochemical methods, including differential pulse voltammetry (DPV), offer sensitive analysis using small sample sizes and minimal sample preparation steps. Forensic electrochemistry has demonstrated significant advances in detecting and quantifying forensic samples including: explosives (Yu et al., 2017), gunshot residue (Harshey et al., 2021), alcohol consumption (Wigmore and Langille, 2009; Rahman et al., 2016; Easton et al., 2020b), and illicit drugs (Ramdani et al., 2013; Smith et al., 2013; Elbardisy et al., 2019; Mendes et al., 2019; Samyn and Wael, 2019; Naomi Oiye et al., 2020). Electrochemical techniques applied to blood samples for medical research purposes and have demonstrated applicability for diagnosing blood related diseases through Hb species differences (Xu et al., 2008; Amreen and Kumar, 2016; Doménech-Carbó et al., 2016). Similar autoxidative and cell damaging events that can be detected in the body can be translated to the natural degradation of Hb and blood in the environment. The bloodstain TSD literature is a current and important space in forensic chemistry as there are critical medico-legal implications for being able to provide a time-stamp to when a bloodstain was formed at a crime scene. Employing electrochemical techniques to probe the redox chemistry of degrading bloodstains complements the currently studied techniques surrounding TSD estimates and may support the combination of multiple methods answer these temporal questions.
2 Materials and Methods
2.1 Blood Source and Blood Property Measurements
Whole bovine blood with 12.5% v/v acid citric dextrose anticoagulant (ACD-A) was obtained from Windcrest Meat Packers (Port Perry, ON, Canada). The blood was used for electrochemical preparation and fluid property measurements within the first 4 h of collection, and was stored at 3°C when not in use.
Density was measured using a 1 ml Hamilton glass syringe and an analytical balance. Dry weight of the syringe and with 1 ml of blood was used to determine density in replicates of 5. The packed volume percentage (PCV%) measurements were obtained by centrifuging whole blood-filled capillary tubes at 12,000 rpm for 2 min using the Haematokrit 200 (Hettich Zentrifugen) in replicates of 8. Density and PCV% were measured at room temperature (22°C and RH%) for both property measurements, the same conditions as electrode preparation conditions.
2.2 Electrode Preparation and Bloodstain Imaging
Glassy carbon (GC) electrodes (CHI 104, purchased from CH Instruments, Austin, United States) were polished with 0.05 μm alumina slurry on a microcloth pad prior to film preparation and after each analysis. Blank electrode measurements were recorded for each electrode before blood deposition.
Using a Hamilton #75, 5 μl glass syringe, 1 μl of a 5 wt% Nafion 117 (Naf) solution was dispensed on the electrode surface followed by 1 μl of whole bovine blood and then with an additional 1 μl layer of the Naf solution. Five minutes for drying was allotted between each layering stage. Uniform layers were approved through manual inspection. Before the top layer of Naf was deposited, the electrode was placed in an ESPEC SH-262 environmental chamber for aging. Prior to analysis the top Naf layer was deposited. The final sequence of deposition for electrode preparation was Naf/Blood/Naf.
2.2.1 Imaging Methodology
Digital photography and SEM were used to characterize the blood films deposited on GC electrodes. An electrode was prepared in the previously described manner without the top layer of Naf. A Canon EOS Rebel T6i camera with a macro lens was used to image the electrode surface. The image specifications were: ¼ shutter speed, 100 ISO and 3.2 F-stop. Additionally, a FlexSEM 1000 was used for the analysis. The SEM working conditions were: 15.0 kV accelerating voltage, 3.57 cm working distance, and an emission current of 108 μA.
2.3 Electrochemical Measurements
2.3.1 DPV Measurements
Following electrode preparation steps the electrode was placed in an electrochemical cell filled with 0.05 M disodium phosphate buffer solution (Na2HPO4). The pH of this solution was adjusted using 85 wt% phosphoric acid to 7.0, and was measured prior to electrochemical measurements using a Mettler Toledo™ FiveEasy Plus™ FEP20 pH meter. All reagents were purchased from Sigma-Aldrich (Oakville, ON, Canada). The electrochemical cells were then purged with high purity N2 (99.998%) for 15 min to allow deoxygenation of the solution to occur. Immediately after purging, DPV was used to analyze the electrode.
Electrochemical measurements were obtained using a Pine Instruments model AFPC2 and Pine WaveDriver 20 potentiostat connected in a three-electrode system. The three electrodes include: a platinum wire counter electrode, a Hg/Hg2SO4 reference electrode saturated in K2SO4, and a working GC electrode with deposited Naf/Blood/Naf film. The GC working electrodes had a 3.0 mm carbon diameter (0.0707 cm2 surface area. The same Hg/Hg2SO4 reference electrode (CHI 151) was used for all analysis and the reported electrochemical potentials are adjusted to the reversible hydrogen electrode (RHE).
Cyclic DPVs were collected between 300 mV to −1,000 mV (vs. Hg/Hg2SO4) with a 10 mVs−1 scan rate. The initial potential was 300 mV and once the potential was reached −1,000 mV the potential was reversed to go back to 300 mV. The pulse parameters used for analysis were: height of 50 mV, width of 250 ms, and period of 2 s. All electrochemical analyses were performed at room temperature (22–25°C). Voltammograms were collected using AfterMath version 1.5.9807 software. All potentials were corrected to the reversible hydrogen electrode (RHE) potential. Faradaic currents were determined by subtracting the electrochemical response of the blank (bare GC electrode) measured under the same conditions. OriginPro 2019b was used for peak processing. The reduction and oxidation DPVs were first smoothed with the Savitzky-Golay method with five points of window and 2nd polynomial order. A manually defined baseline was established and the peak analyzer function in OrginPro was used to integrate resolved peaks in both the reduction and oxidation sweep. Unresolved peaks were processed similarly with the peak deconvolution function using a Gaussian distribution. For each peak the peak potential (V), area (μW), and height (μA) were recorded.
2.3.2 RDE Measurements
Using a Pine research E6R1 ChangeDisk Series rotating ring-disk glassy carbon working electrode (5.0 mm diameter, 0.1963 cm2 surface area) linear scan voltammograms (LSV) were obtained between 300 mV and −1,300 mV (vs. Hg/Hg2SO4). Consistent electrode preparation steps were maintained for creating the Naf/Blood/Naf film on this electrode. To keep the same mass loading of blood used on the 3.00 mm electrode, 2.75 μl of 5% wt Naf and whole bovine blood were deposited on the rotating ring-disk electrode.
Voltammograms were obtained through AfterMath version 1.5.9807 software. The electrode was held in a large voltammetric glass cell (approximately 250 ml) by a Pine research modulated speed rotator with the same counter and refence electrode as the DPV measurements.
After filling up the cell and securing the Naf/Blood/Naf rotating electrode the cell was purged with nitrogen gas for 20 min. Next, a blank LSV was obtained, and then the cell was then purged with O2 for 20 min. The rotator was then turned on and the O2 was set to a slow continuous purge. Voltammograms were collected at the following RPM: 1,000, 800, 600, 400, and 200.
Two electrolyte solutions were tested. The first being 0.05 M disodium phosphate buffer solution (Na2HPO4) with a pH of 7.0, which was adjusted using 85 wt% phosphoric acid. The other electrolyte solution was 0.1 M KOH (pH = 13.0). The same reference electrode was used for each electrolyte solution and was calibrated so the voltammograms could be plotted in the same potential range of 0.96 V to −0.64 V vs. RHE.
Measurements were completed with two separate bovine blood collections. The first involved the pH 7, 0.05 M PBS. Five replicates of fresh bovine blood were analyzed on the day of collection and 2 weeks after. The blood was stored in an opaque container in the refrigerator over the 2 weeks. Additionally, blood was deposited on the electrode after the first day of analysis without the top Naf layer. This electrode was aged for 3 days in the ESPEC SH-241 environmental chamber at 22°C and 40% RH. After the aging period the top Naf layer was deposited. The RDE analysis in the basic electrolytes were analyzed in replicates of five using fresh blood only. The data was used to conduct a Koutecky-Levich analysis of the Naf/Blood/Naf film in the separate conditions.
2.4 Time Series Experiments
For the time series, the electrodes were prepared within 4 h of the blood collection. A total of nine time series were conducted with the following timepoints (hours): 0, 1, 3, 6, 9, 24 (1 day), 48 (2 days), 72 (3 days), 96 (4 days), 168 (1 week), 240 (10 days), 336 (2 weeks). Five time series were completed at standard laboratory conditions: 22°C and 40% RH. The other four time series were completed at the following temperatures with constant RH of 40%: −20°C, 3°C, 30°C, and 40°C. The 22°C, 30°C, and 40°C temperatures were maintained in the environmental chamber. The −20 and 3°C temperatures were maintained in the freezer and refrigerator respectively. In the cold conditions, the electrodes were placed in a large glass beaker filled approximately a quarter volume with desiccant to maintain the desired 40% RH. A small dual temperature and humidity gauge was placed in the beaker with the electrodes to monitor RH.
Separate from the temperature time series, two additional time series were conducted at 25% and 55% PCV%. A centrifuge was used to separate the RBCs and plasma in fresh bovine blood for PCV adjustments. These time series were carried out in the 4°C and 40% RH condition and were compared to the natural PCV time series in the same environmental condition. A total of three time series were used to evaluate the effects of PCV on electrochemical responses.
2.4.1 Statistical Analysis
Following data collection, RStudio version 3.6.2 (2019) was used for statistical analysis and to generate linear regression plots. Ratios between the reduction and oxidations peak heights and areas were calculated.
Each measured electrochemical response was fitted using a linear correlation with Log(Time). The common logarithm was used to transform the time point (in hours) with the T0 time point set to 6 min (0.1 h), the realistic time when the first measurement was obtained. Pearson’s correlation coefficients were calculated for each response variable in the standard time studies with Log(Time) and to other measured responses.
Linear mixed models against Log(Time) and with biological replicate as a random effect were determined for each of the measured electrochemical responses. These correlated variables were then used to build the Principal Component Analysis (PCA) models to further investigate time affected correlations and temperature effects. This was completed with the standard time series first (22°C and 40% RH) and then temperature.
We used a Wilcoxon T-test to assess significant time differences before and after time points collected in our studies. The time groups chosen were: 24, 48, 72, 96, 168 h. The means, and confidence intervals of each significant response were calculated. This time separation division was then applied to the previously computed PCAs for data visualization purposes.
3 Results
3.1 SEM Results
The surface morphology of the dried blood is important when considering electron transfer kinetics. In relation to electrochemical analysis, even distribution of blood across the electrode surface is desirable. The goal of the electrode imaging was to understand how the blood films are drying on the electrode, specifically if uniform morphology was being achieved.
In Figure 1, image A shows the blood film under relatively low magnification. In this image, crack formations are visible and formed over the 2 days the blood was deposited on the electrode. Image B magnifies one of the cracks in this stain and possible RBC stacking is observed in the edges of the crack. Lastly, image C show a magnified SEM image at the center of the film, where the majority of cellular content was confirmed. This is also observed in digital images of the film which can be found in the Supplementary Material S1. The SEM images of the center of the film has an irregular morphology with no distinctly visible RBCs. These irregularities are likely from blood coagulation and non-uniform surface spreading during electrode preparation. The effects of RBC layering are of importance to electrochemical studies as it effects the accessibility to active Hb sites in the film.
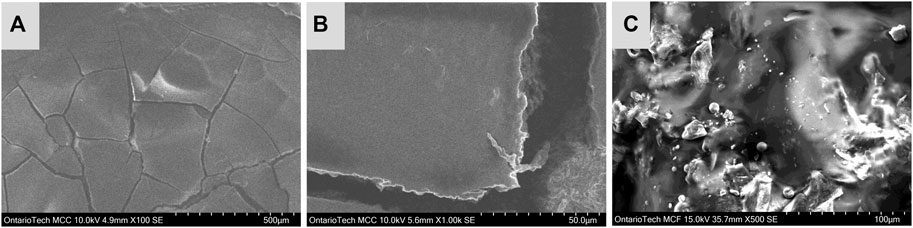
FIGURE 1. SEM images of blood film on GC electrode, image (A) shows approximately half of the blood film, image (B) magnifies on a crack formation at the center of the film and image (C) shows a magnified image taken from the center of the blood film.
3.2 DPV Analysis
The DPVs of the Naf/Blood/Naf film had reproducible peaks related to Hb redox reactions in the pH 7.0 PBS buffer conditions. In panel A of Figure 2 the full scan range DPV of the Naf/Blood/Naf film is shown, and panel B shows the anodic sweep with just the oxidation peaks. The peaks were labeled based on the order of occurrence during analysis and given ‘Red’ or “Ox” depending on whether they are observed on the cathodic or anodic sweeps respectively. A total of five peaks were observed at reproducible potentials: 1 Red (
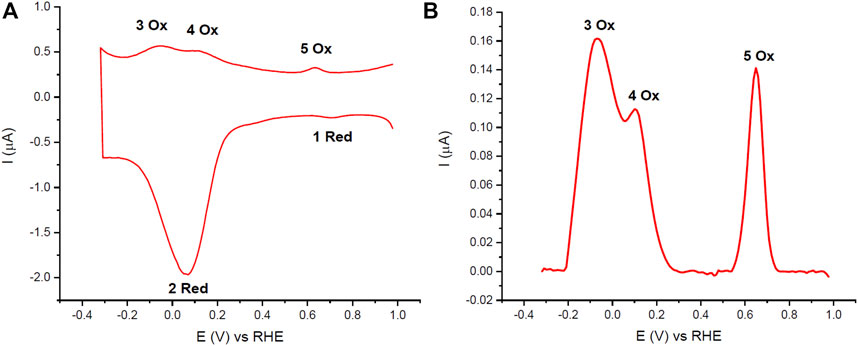
FIGURE 2. (A) Cyclic DPVs of 1 μl whole bovine blood deposited on GC electrodes (Naf/Blood/Naf) in pH 7.0 PBS (0.05 M). (B) Blank subtracted anodic sweep of cyclic DPV. 10 mV/s scan rate and purged with N2. The 2 Red peak corresponds to ferric Hb reduction and Hb catalyzed oxygen reduction, peaks 3 Ox and 4 Ox correspond to ferrous Hb oxidation in healthy and lysed RBCs respectively, and peaks 1 Red and 5 Ox correspond to quinone reduction or oxidation reactions respectively which are attributed to the GC electrode.
3.2.1 RDE
3.2.1.1 Neutral pH RDE Results
In the neutral pH PBS buffer fresh blood, liquid aged blood in the refrigerator (2-week) and a dried bloodstain (3 days) were studied. Figure 3 shows the LSVs of the fresh Naf/Blood/Naf film in the neutral pH and the Koutecky-Levich plot at the potential −0.6384 V vs. the RHE. The LSV curves show the beginning of the plateau and the plotting of near limiting currents show that this reaction is sluggish given the intercept greater than zero. Implying, the blood film and Hb accessibility remains the limiting factor here and is not governed by mass transport.
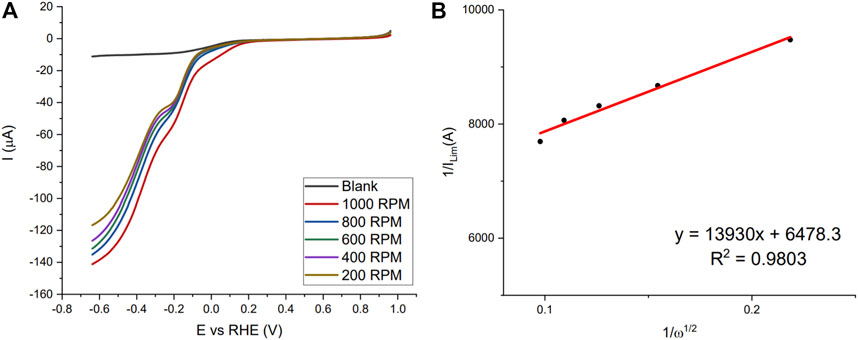
FIGURE 3. (A) LSV scans of fresh Naf/Blood/Naf film on GC-RDE in 0.05 M disodium phosphate buffer (pH = 7.0) with different RPM (200–1,000), purging gas O2. (B) Koutecky-Levich plot for currents at −0.6384 V vs. RHE.
Koutecky-Levich analysis and results are shown for each replicate in the Supplementary Materials S2–S4 including electron number calculations, correlation coefficients, kinetic current, and onset potential. For the fresh blood in the neutral pH the average was between two and three (2.27 ± 0.21). This implies that both the 4-electron and 2-electron processes are occurring forming water and hydrogen peroxide (Gaixia Zhang et al., 2017). The onset peak at approximately −0.2 V vs. the RHE supports the claim that peroxide formation is occurring.
In the neutral pH, the 2-week aged blood stored in the refrigerator saw an average electron number below two (1.58 ± 0.24). Therefore, as the blood ages its ability to directly reduce O2 to water decreases and is dominated by a 2-electron reduction process forming hydrogen peroxide. The blood aged 3 days on the electrode provided an electron number of 2.08, similar to the aged blood in the refrigerator. This relates to a 2-electron process and supports finding that the Hb within the blood aged on the electrode loses its catalytic activity to form water after 3 days.
3.2.1.2 Basic pH Results
Alkaline buffers are commonly used to study the ORR (Osmieri et al., 2016; Fruehwald et al., 2021). The lower pH provide a less corrosive environment to catalysts and the ORR kinetics are more rapid compared to acidic media (Ge et al., 2015). The basic pH samples did reach limiting currents and also had the similar onset peak to the neutral pH samples. Voltammograms and Koutecky-Levich analysis results are summarized for each replicate in the Supplementary Materials S5, S6. The average electron number involved in the reaction was close to two (1.72 ± 0.10), inferring that the two-electron pathway was occurring forming a hydrogen superoxide (Min et al., 2014; Ge et al., 2015). The results from the RDE analysis in the basic pH offer insight into the catalytic activity of Hb in whole blood for biofuel cell technologies (Ayato et al., 2014). As expected, the lower pH had higher onset ORR potentials (0.647 V ± 0.008 vs. RHE) when compared to the neutral pH condition.
3.3 Standard Condition Time Series Results
The blank subtracted and baseline corrected data from one of the standard time series (22°C, 40% RH) is shown in Figure 4. Visual interpretations of voltammograms indicate no clear correlations to time and a large amount of variation is observed between time points. Generally speaking, it was noticed that higher magnitude reduction peaks were often followed by higher magnitude oxidation peaks. This supports the hypothesis of using peak ratios for correlations with time opposed to single peak metrics.
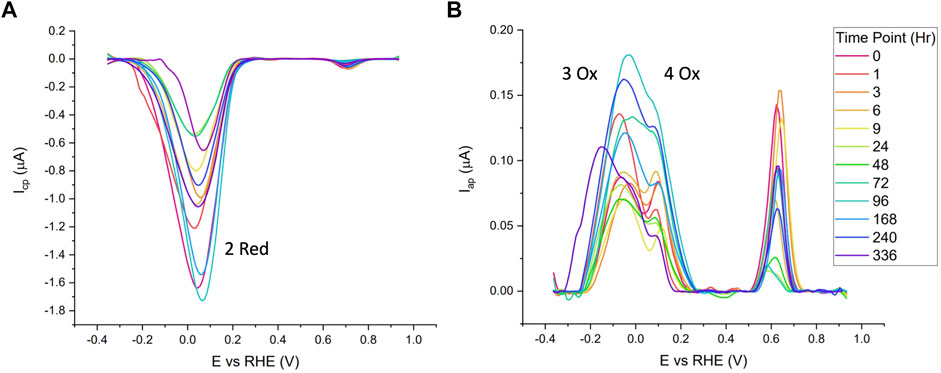
FIGURE 4. Cathodic (A) and anodic (B) of Naf/Blood/Naf film deposited on GC electrodes over a 2-week period, stored at 22°C and 40% RH. 10 mV/s scan rate and purged with N2 in 0.05 M PBS.
For the standard time series data, a Pearson’s correlation matrix was constructed to represent how the measured responses correlate to each other, independent of time. This matrix is found in Figure 5 and only includes the peaks related to the Hb within the Naf/Blood/Naf film. The Pearson’s correlation coefficient describes the strength and direction of two chosen variables. One observation from this matrix was that within a peak, the height and area were strongly correlated (Figure 5: outlined in red). This was expected and confirms that the general peak shapes are being maintained across time points and time series replicates.
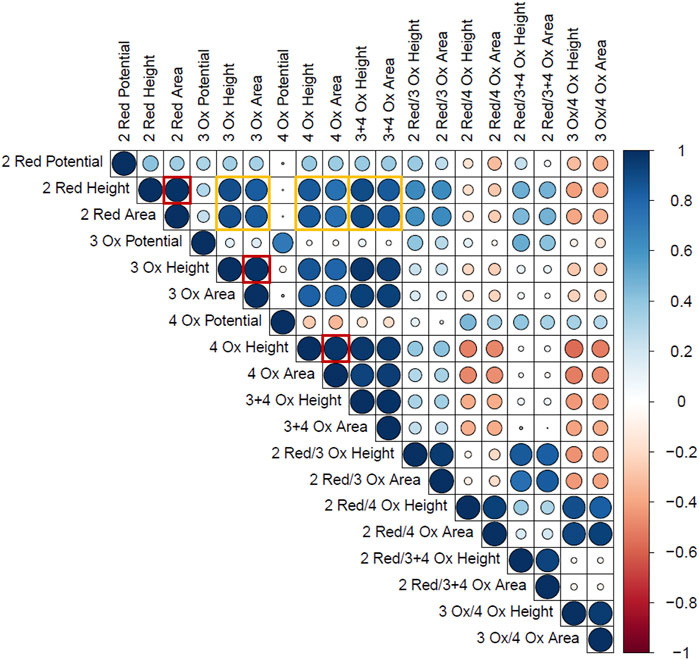
FIGURE 5. Pearson’s Correlation plot of the Hb electrochemical response variables. The size and colour represent the strength and direction of correlation respectively. (Blue = positive correlation, Red = negative correlation). The outlined red boxes highlight the correlations between peak height and area within single Hb peaks and the yellow boxes highlight the correlations between Hb reduction and oxidation peaks.
Another key finding was that the 2 Red peak height and area had a strong positive correlation with the 3 Ox and 4 Ox heights and areas, respectively (Figure 5: outlined in yellow). This supports the hypothesis that the Hb molecules able to undergo reduction or facilitate the ORR can participate in the oxidation reaction in the anodic sweep. In other words, greater reduction signals correspond to greater oxidation signals in the Hb related peaks due to the same active Hb sites being measured. This is also confirmed by the strong positive correlation seen between the height or area of the 2 Red peak and the height or area of the combined 3 + 4 Ox peak. The Pearson’s correlation matrix demonstrates how peak characteristics are changing with each other and was a starting point to begin assessing each of these dependent measurements with time.
3.3.1 Standard Condition Linear Modeling
Table 1 summarizes data from the linear mixed models for the standard time series (n = 5). The bolded response variables represent the significantly correlated variable (p < 0.05). There were 7 significantly correlated variables: the peak potential of the 2 Red peak, and the height and area ratios of the Hb related redox peaks (2 Red/3 Ox, 2 Red/4 Ox, and 2 Red/3 + 4 Ox). As predicted, the peaks associated with quinone redox reactions (1 Red and 5 Ox) were not correlated with time since they are from the GC electrodes. The potential shift to more positive potentials over time is possibly due to the degradation of cellular components leading to less resistant electron transfer pathways. This pattern is noticed in Figure 4 with the later time point cathodic sweeps having higher peak potentials.
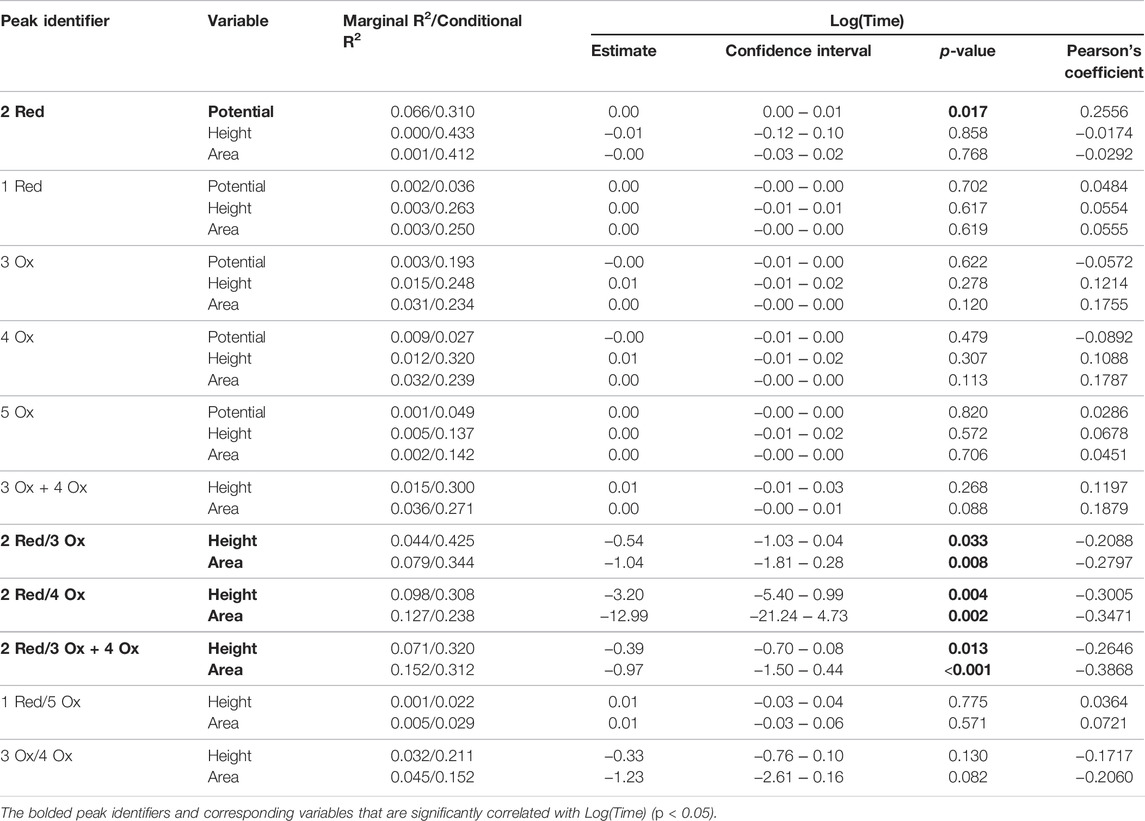
TABLE 1. Mixed linear models of laboratory condition time series (n = 5). All electrochemical responses were assessed.
The linear mixed models demonstrate weak correlations with time. Low Pearson correlation coefficients (i.e., 0.20–0.39) and R2 (i.e., 0.30–0.49) values relate to this, however when biological replicate (i.e., blood source) is considered, more variation is explained in the linear models.
3.4 Temperature Time Series Results
3.4.1 Temperature Incorporated Linear Models
The seven significantly correlated variables (p < 0.05) from the standard condition were assessed with the added temperature data. With this temperature combined dataset each of the seven electrochemical responses demonstrate significant correlation to Log(Time). The additional temperature time series were leveled to the standard condition replicates to make ‘temperature’ an independent variable. Using linear regressions, it was found that many of the electrochemical responses were significantly different from the standard condition time series replicates. The results from this analysis are summarized in Table 2 with the estimates, confidence intervals, and p-values for each measured electrochemical response in each measured temperature.
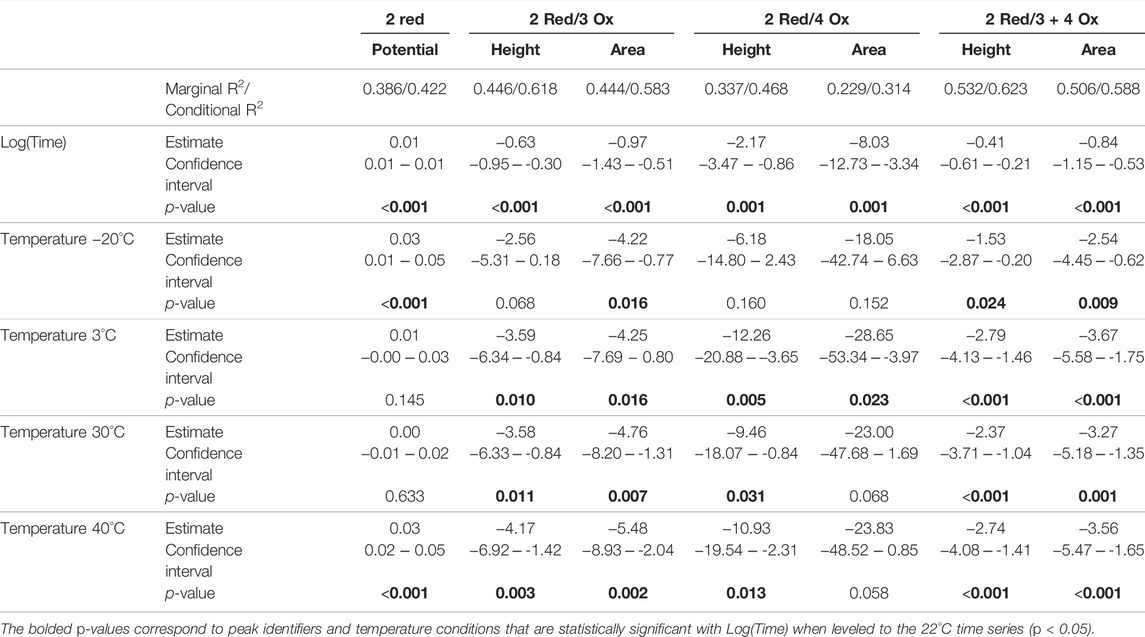
TABLE 2. Influencing effects of Log(Time) and temperature (leveled to 22°C) for measured electrochemical responses significantly correlated with Log(Time).
The marginal and conditional R2 values for the temperature combined dataset are consistent with the standard temperature time series. Demonstrating relatively weak correlations with a greater proportion of variance explained when biological replicate (i.e., blood source) is considered.
3.4.2 Influence of Temperature on TSD Signatures
The Wilcoxon Test was used to determine at which time point the most significant differences occur in the standard time series and temperature included datasets. Summary tables of these results can be found in the Supplementary Material for each of these datasets respectively Supplementary Materials S7–S8. The results suggest that the most electrochemical changes in the Hb related responses occur within our experimental conditions at the 96-h point for both datasets.
The mean and confidence interval for each of the significantly different electrochemical responses at the 96-h time division were calculated and are organized in Table 3. For standard condition dataset the 2 Red potential, 2 Red/4 Ox area ratio, and the 2 Red/3 + 4 Ox area ratio were significantly different (p < 0.05) between the below/above 96-h time point. The temperature included dataset had similar results with the same three electrochemical responses along with the 2 Red/4 Ox peak height ratio. The combined time series dataset serves as a preliminary dataset for future studies independent of temperature.
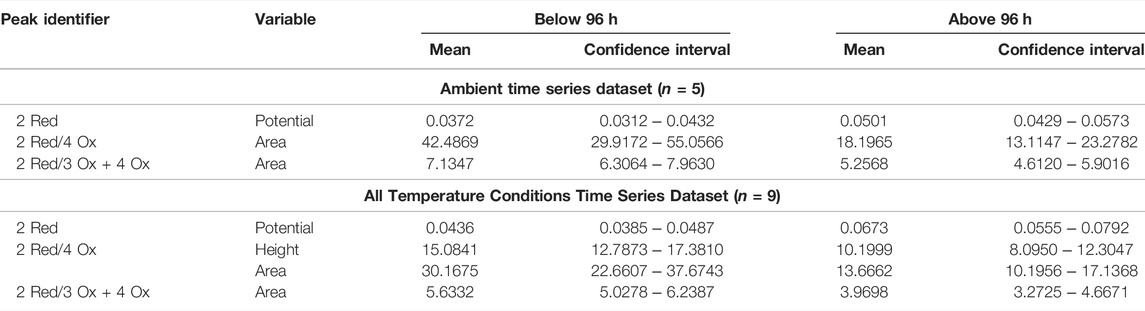
TABLE 3. The mean and confidence interval for the electrochemical responses, significantly different from the below/above 96-h for the standard time series and the temperature included dataset.
Labeling the 96-h time separation within the PCA plot for the temperature combined dataset is shown in Figure 6. Ellipses represent 95% confidence intervals around the two respective groups. The PCA considers the 2 Red peak potential and all of the area ratios for the Hb related peaks (2 Red/3 Ox, 2 Red/4 Ox, and 2 Red/3 + 4 Ox) to combine dependent variables and reduce the dimensionality of the data.
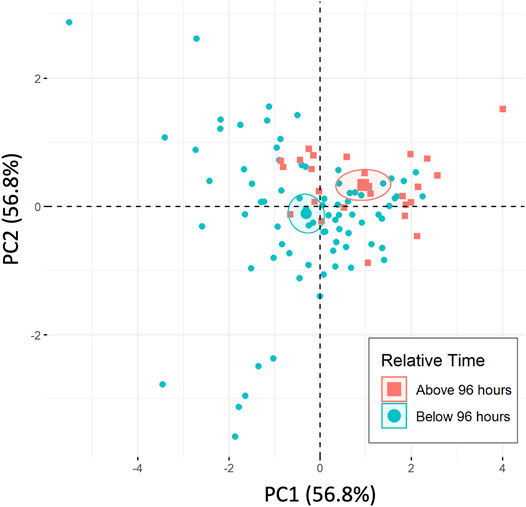
FIGURE 6. PCA of temperature included dataset separated by 96-h time separations, including standard time series (n = 5) and 4 temperature variations (each n = 1).
3.4.3 PCV Time Series
The Hb measured electrochemical responses correlated with Log(Time) determined through the standard time series experiments were used to compare the effects of PCV. Table 4 summarizes these results. The estimates and p-value for the adjusted PCVs (25% and 55%) were leveled to the average range blood PCV condition (45%). Significant differences are observed in the 25% PCV time series for each response except the height and area ratios for the 2 Red/4 Ox peak ratio. The 55% PCV time series had less significantly different responses from the 45% PCV replicate. Only the 2 Red peak potential and the 2 Red/4 Ox peak height ratio were significantly different.
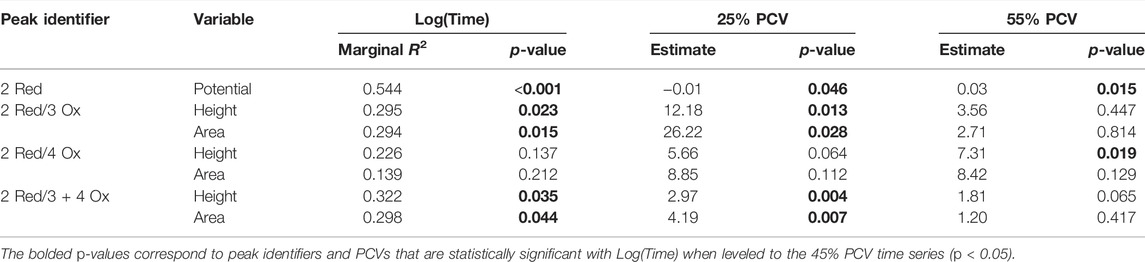
TABLE 4. Linear model results from PCV comparison experiment on electrochemical responses. Includes three time series carried out in 4°C and 40% RH with 45%, 25%, and 55% PCV. Results for the adjusted PCV were leveled to the average range blood PCV condition of 45%.
These time series were correlated to Log(Time) with the results shown in Table 4. These additional time series are consistent with the results from the standard and temperature time studies, finding overall weak correlations.
4 Discussion
4.1 Bloodstain Electrochemistry
Electrochemical techniques have been growing in popularity for forensic applications including drugs (Aymerich et al., 2018; Darzi and Garg, 2020; Naomi Oiye et al., 2020) and explosives (Yu et al., 2017). Electrochemical techniques have been and continue to be researched for medical applications related to blood analysis. The majority of these studies focus on the Hb/ORR redox system to diagnose blood related diseases such as anemia (Ogunlesi et al., 2009; Toh et al., 2014; Amreen and Kumar, 2016; Doménech-Carbó et al., 2016). These articles demonstrate the structural changes of Hb and its natural oxidation in vivo can be monitored using voltammetry methods for medical interpretations.
When electrochemical techniques were first being applied to blood analysis, the Hb electron mediated transfer was thought to be a slow and relatively difficult process to monitor due to the electroactive components being buried inside the cell membrane (Toh et al., 2014; Yu et al., 2014). For this reason, purified Hb and pretreated blood samples were primarily used for analysis. This, along with the risk of biofouling dissuaded the use of whole blood as a sample matrix. Given these early challenges, researchers have explored many variations of electrode materials and sample immobilization techniques to effectively study Hb redox reactions and have shown that direct electron transfer is possible through the cell membrane. A number of articles report a quasi-reversible to nearly reversible Hb corresponding redox peak using many electrode materials, including the well-studied GC electrode (Wang and Hu, 2001; Yao et al., 2007; Safavi et al., 2008; Sun et al., 2008; Xu et al., 2010).
The focus of this research was to take these principles of blood electrochemistry and apply them to forensic scenarios. The principles of Hb degradation and natural oxidation are consistent between diseased blood samples and bloodstains. This research supports the use of voltammetry and GC electrodes to studied whole blood samples, and specifically bloodstains created and aged on the electrode surface.
4.1.1 Electrochemical Characterization
The largest peak in the voltammograms is the 2 Red peak (
As previously mentioned HbFe2+ is able to catalyze the reduction of oxygen at the potential of HbFe3+ reduction, shown in Eq. 3, while preserving its ability to bind oxygen. In other words, during the process of oxygen reduction, HbFe2+ is able to stay in its healthy form without being oxidized to its physiologically damaging HbFe3+ form. The oxidation of HbFe2+ to HbFe3+ does occur and has the potential of initiating an oxidative cascade that leads to heme loss and cellular damages (Bonaventura et al., 2013). This reaction is shown in reaction 4. This reduction process of bound O2 while maintaining Hb in its physiological important oxidation state is critical to life and relates to the reusability of Hb. Given the high affinity HbFe2+ has for O2, any dissolved O2 in the buffer solution would bind and undergo reduction, increasing the magnitude of this peak. For this reason, the electrochemical cell was purged with N2 prior to analysis to remove any dissolved O2.
Coupled to the ORR and HbFe3+ reduction are peaks 3 Ox and 4 Ox in the anodic sweep, shown closer in Figure 1 panel B. Within the neutral pH buffer, the peak potential for the 3 Ox and 4 Ox reactions are,
The two regions of these peaks are seen across timepoints and replicates. It is proposed that these regions are related to the structural integrity of the RBCs. Similar peak characteristics were observed in the anodic sweep of research published by Doménech-Carbó et al. (2016) when studying hemolysis using square wave voltammetry. Both peaks relate to the electron transfer involving HbFe2+/HbFe3+ but peak potentials are shifted based on varying cell membrane properties that favour/resist electron transfer processes. Peak 3 Ox is proposed as corresponding to “healthy” or undamaged cells which contain HbFe2+. Electron transfers from the electrode surface are able to migrate through the cell membrane to the protected HbFe2+ contained within the cell’s microenvironment. Peak 4 Ox is proposed as the electron transfer process of lysed, or structurally faulty, cells (Doménech-Carbó et al., 2016). Drying conditions and exposure to the environment leads to the degradation of cell structures. As cellular components break down, damages to the cell membrane expose the Hb to environmental stresses that can change protein structures.
The peaks 1 Red (
4.2 Bloodstain TSD Through Electrochemistry
The trends from the time series experiments were predicted and present similar conclusions to other Hb related TSD techniques (Hanson and Ballantyne, 2010; Bremmer et al., 2011; Doty et al., 2017; Cossette et al., 2021). The mixed linear models from these time series support the use of peak height and area ratios for Hb related peaks when correlated with Log(Time). The use of peak ratios mitigates variation between replicates because the number of Hb molecules participating in the redox reactions is relative for each analysis. Variations in film morphology and the formation of complex 3D networks may influence the accessibility of electrons to the Hb sites and likely change how the film ages. This is supported by PCV time series experiments. Lowering the PCV observed more significant differences in electrochemical responses. A lower PCV theoretically allows greater space between RBCs and allows different 3D network arrangements for the cells, which would impact electron transfer pathways through the film. This implies that higher PCVs, where more RBCs deposited on a space defined surface, influence the drying morphology and create more complicated available electron pathways to Hb active sites. Understanding the magnitude of influence PCV has on electrochemical analysis is an important consideration as it likely affects the availability of Hb active sites and in turn diagnostic power of the test.
In the time series experiments, it was observed that all of the correlated ratios were decreasing over time, or in other words, the reduction peak was decreasing in magnitude and/or the collective oxidation peaks were increasing in magnitude. This makes sense with what is expected to be happening in the bloodstain as it ages. Natural environmental oxidative damages are expected; the Hb bound O2 is reduced to water with HbFe2+/HbFe3+ oxidation (Bremmer et al., 2011; Zadora and Menżyk, 2018). This correlates to the decreased available O2 to undergo reduction at the 2 Red peak and the increase in HeFe3+ is able to participate in oxidation reactions during the 3 Ox and 4 Ox peaks. The oxidative changes of Hb in bloodstains remains the primary analyte for bloodstain aging due to its abundance. The DPVs demonstrate the natural oxidation of HbFe2+ to HbFe3+ and O2 reduction in older bloodstains compared to fresher stains. This research supports the use of peak ratios for TSD estimates, as a means to account for signal variation from differences in bloodstain deposition, drying and Hb accessibility.
Similar to other forensic blood time studies, considering the biological replicate as a random effect improved correlation (Cossette et al., 2021). The variation of blood between individuals is a major obstacle for real work scenarios where the blood source may not be known. Bloodstains from different individuals and on different surfaces result in different drying and degradation processes (Brutin et al., 2012; Laan et al., 2016). Analytical techniques independent of blood source are desirable, but this level of sensitivity has not been reached. Advances and further study of analytical methods applied to blood TSD research may be able to quantify this variation but with real-world cases in mind, the identity of the blood source must be known. This is critical information for forensic bloodstain TSD estimations since it means that the blood source influences the electrochemical measurements. This is consistent with other TSD research, finding that biological replicate influences the degradation rates of blood-related molecules studied for TSD purposes such as Hb, RNA, and RBCs (Zadora and Menżyk, 2018; Cavalcanti and Silva, 2019; Cossette et al., 2021).
Another important consideration in TSD estimates is the effect of environmental conditions such as temperature, humidity, sunlight, and daily condition fluctuations. Many blood TSD researchers account for these metrics in model development and interpretation (Hanson and Ballantyne, 2010; Cavalcanti and Silva, 2019; Cossette et al., 2021). Understanding the effects of these factors on aging bloodstains is critical for TSD estimates. With the development of analytical techniques to study bloodstains, the application to TSD estimates in diverse and fluctuating environmental conditions remains a central area of study. In this work, temperature did have a significant effect the Hb related electrochemical measurements. Temperature is a necessary factor to consider, changing the kinetics of degradation and often increases the rate of change (Matsuoka et al., 1995; Fujita et al., 2005; Bremmer et al., 2011; Hanson et al., 2011).
Across the bloodstain TSD literature, similar correlations with time and associated challenges are discussed. Researchers have yet to pinpoint a universal method to accurately date bloodstains. For this reason, the combination of various techniques that focus on different physical and biochemical changes in degrading bloodstains is proposed. The shift to multivariate statistical analysis from single variable analysis is a part of the bloodstain TSD timeline. These trends will likely continue, with chemical methods being paired with PCR methods to monitor changes in Hb and RNA within a bloodstain (Hanson and Ballantyne, 2010; Boyd et al., 2011; Fu and Allen, 2019; Cossette et al., 2021). The combining of variables may prove effective in mitigating biological replicate variation and have stronger correlations with time when environmental conditions are considered.
4.3 Research Summary and Future Directions
Electrochemical methods have been used for blood analysis in medical fields and have many desirable characteristics for forensic analysis including: sensitivity, ease of use, quick analysis times and portability. Research design and proof-of-concept methodologies using electrochemical methods are the first steps toward applying electrochemical methods to TSD estimates. The results presented here demonstrate the proof-of-concept foundations for electrochemical applications to bloodstain TSD. Weak correlations to Hb related redox peaks were observed and statistical analysis shows promising applications to diagnostic dating metrics.
Future applications to case-specific experimentation are encouraged. This research created bloodstains directly on the electrode surface but transferring bloodstains to the electrode after they have dried is a more realistic forensic scenario, and one that has not yet been studied for electrochemical techniques. Additionally, research in optimizing electrode preparation methods and understanding the sensitivity of these methods in other static and dynamic environmental conditions, particularly humidity, is required.
The question of a bloodstain’s age is unanswered in forensic science and the studied TSD techniques have yet to obtain forensic level accuracy and precision. Many analytical techniques are increasing in sensitivity to study blood evidence and researchers are incorporating statistics to strengthen predictor models. Understanding the environmental effects on degradation and blood source variation are high priorities for researchers focused on TSD questions. The assemblage of other bloodstains TSD analytical methods to form multivariate statistical analysis is on the path ahead. Combining techniques that detect different biomolecules related to bloodstain degradation may improve TSD diagnostic power. Integrating a variety of analytical techniques, including electrochemical methods, opens the door to new and exciting perspectives on the toolkit of useful for techniques to age a bloodstain.
Data Availability Statement
The original contribution presented in the study are included in the article/Supplementary Material, further inquiries can be directed to the corresponding author.
Author Contributions
All authors listed have made a substantial, direct, and intellectual contribution to the work and approved it for publication.
Funding
This work was supported by the Natural Sciences and Engineering Research Council (NSERC) of Canada through the Discovery Grants Program (RGPIN-2020-05816 to TS, RGPIN2020-05152 to EE). MT acknowledges support from the Ontario Graduate Scholarship program. HF acknowledges support the from and NSERC Alexander Graham Bell Canada Graduate Scholarship-Doctoral (CGS-D).
Conflict of Interest
The authors declare that the research was conducted in the absence of any commercial or financial relationships that could be construed as a potential conflict of interest.
Publisher’s Note
All claims expressed in this article are solely those of the authors and do not necessarily represent those of their affiliated organizations, or those of the publisher, the editors and the reviewers. Any product that may be evaluated in this article, or claim that may be made by its manufacturer, is not guaranteed or endorsed by the publisher.
Acknowledgments
The authors would also like to thank Windcrest Meat Packers for the donation of bovine blood.
Supplementary Material
The Supplementary Material for this article can be found online at: https://www.frontiersin.org/articles/10.3389/frans.2022.900483/full#supplementary-material
References
Alshehhi, S., and Haddrill, P. R. (2019). Estimating Time since Deposition Using Quantification of RNA Degradation in Body Fluid-specific Markers. Forensic Sci. Int. 298, 58–63. doi:10.1016/J.FORSCIINT.2019.02.046
Amreen, K., and Kumar, A. S. (2016). Electrochemical Redox Signaling of Hemoglobin in Human Whole Blood and its Relevance to Anemia and Thalassemia Diagnosis. Analyst 141, 2145–2149. doi:10.1039/c5an02646f
Anderson, S. E., Hobbs, G. R., and Bishop, C. P. (2011). Multivariate Analysis for Estimating the Age of a Bloodstain*. J. Forensic Sci. 56, 186–193. doi:10.1111/j.1556-4029.2010.01551.x
Attinger, D., Moore, C., Donaldson, A., Jafari, A., and Stone, H. A. (2013). Fluid Dynamics Topics in Bloodstain Pattern Analysis: Comparative Review and Research Opportunities. Forensic Sci. Int. 231, 375–396. doi:10.1016/j.forsciint.2013.04.018
Ayato, Y., Sakurai, K., Fukunaga, S., Suganuma, T., Yamagiwa, K., Shiroishi, H., et al. (2014). A Simple Biofuel Cell Cathode with Human Red Blood Cells as Electrocatalysts for Oxygen Reduction Reaction. Biosens. Bioelectron. 55, 14–18. doi:10.1016/j.bios.2013.11.063
Aymerich, J., Márquez, A., Terés, L., Muñoz-Berbel, X., Jiménez, C., Domínguez, C., et al. (2018). Cost-Effective Smartphone-Based Reconfigurable Electrochemical Instrument for Alcohol Determination in Whole Blood Samples. Biosens. Bioelectron. 117, 736–742. doi:10.1016/j.bios.2018.06.044
Barni, F., Lewis, S. W., Berti, A., Miskelly, G. M., and Lago, G. (2007). Forensic Application of the Luminol Reaction as a Presumptive Test for Latent Blood Detection. Talanta 72, 896–913. doi:10.1016/j.talanta.2006.12.045
Bauer, M., Polzin, S., and Patzelt, D. (2003). Quantification of RNA Degradation by Semi-quantitative Duplex and Competitive RT-PCR: A Possible Indicator of the Age of Bloodstains? Forensic Sci. Int. 138, 94–103. doi:10.1016/j.forsciint.2003.09.008
Bonaventura, C., Henkens, R., Alayash, A. I., Banerjee, S., and Crumbliss, A. L. (2013). Molecular Controls of the Oxygenation and Redox Reactions of Hemoglobin. Antioxid. Redox Signal. 18, 2298–2313. doi:10.1089/ars.2012.4947
Boyd, S., Bertino, M. F., and Seashols, S. J. (2011). Raman Spectroscopy of Blood Samples for Forensic Applications. Forensic Sci. Int. 208, 124–128. doi:10.1016/j.forsciint.2010.11.012
Bremmer, R. H., de Bruin, D. M., de Joode, M., Buma, W. J., van Leeuwen, T. G., and Aalders, M. C. G. (2011). Biphasic Oxidation of Oxy-Hemoglobin in Bloodstains. PLoS ONE 6, e21845–6. doi:10.1371/journal.pone.0021845
Bremmer, R. H., de Bruin, K. G., van Gemert, M. J. C., van Leeuwen, T. G., and Aalders, M. C. G. (2012). Forensic Quest for Age Determination of Bloodstains. Forensic Sci. Int. 216, 1–11. doi:10.1016/j.forsciint.2011.07.027
Brutin, D., Sobac, B., and Nicloux, C. (2012). Influence of Substrate Nature on the Evaporation of a Sessile Drop of Blood. J. Heat Transf. 134, 1–7. doi:10.1115/1.4006033
Cavalcanti, D. R., and Silva, L. P. (2019). Application of Atomic Force Microscopy in the Analysis of Time since Deposition (TSD) of Red Blood Cells in Bloodstains: A Forensic Analysis. Forensic Sci. Int. 301, 254–262. doi:10.1016/j.forsciint.2019.05.048
Cossette, M.-L., Stotesbury, T., and Shafer, A. B. A. (2021). Quantifying Visible Absorbance Changes and DNA Degradation in Aging Bloodstains under Extreme Temperatures. Forensic Sci. Int. 318, 110627. doi:10.1016/j.forsciint.2020.110627
Darzi, E. R., and Garg, N. K. (2020). Electrochemical Oxidation of Δ9-Tetrahydrocannabinol: A Simple Strategy for Marijuana Detection. Org. Lett. 22, 3951–3955. doi:10.1021/acs.orglett.0c01241
Dinis-Oliveira, R. J., Carvalho, F., Duarte, J. A., Remião, F., Marques, A., Santos, A., et al. (2010). Collection of Biological Samples in Forensic Toxicology. Toxicol. Mech. Methods 20, 363–414. doi:10.3109/15376516.2010.497976
Dissing, J., Søndervang, A., and Lund, S. (2010). Exploring the Limits for the Survival of DNA in Blood Stains. J. Forensic Leg. Med. 17, 392–396. doi:10.1016/j.jflm.2010.08.001
Doménech-Carbó, A., Villamón, E., Luna, I., Ramos, D., Doménech-Casasús, C., and Cebrián-Torrejón, G. (2016). Transmembrane Electrochemistry of Erythrocytes: Direct Electrochemical Test for Detecting Hemolysis in Whole Blood. Sens. Actuators B Chem. 226, 419–428. doi:10.1016/j.snb.2015.12.001
Doty, K. C., McLaughlin, G., and Lednev, I. K. (2016). A Raman “Spectroscopic Clock” for Bloodstain Age Determination: the First Week after Deposition. Anal. Bioanal. Chem. 408, 3993–4001. doi:10.1007/s00216-016-9486-z
Doty, K. C., Muro, C. K., and Lednev, I. K. (2017). Predicting the Time of the Crime: Bloodstain Aging Estimation for up to Two Years. Forensic Chem. 5, 1–7. doi:10.1016/j.forc.2017.05.002
Easton, E. B., Fruehwald, H. M., Randle, R., Saleh, F. S., and Ebralidze, I. I. (2020a). Probing the Degradation of Carbon Black Electrodes in the Presence of Chloride by Electrochemical Impedance Spectroscopy. Carbon 162, 502–509. doi:10.1016/j.carbon.2020.02.086
Easton, E. B., Rahman, M. R., Allan, J. T. S., and Geoffrey, H. L. (2020b). The Design of Low Pt Loading Electrodes for Use in Fuel Cell-Based Breath Alcohol Sensors. J. Electrochem. Soc. 167, 147509. doi:10.1149/1945-7111/abc5de
Elbardisy, H. M., García-Miranda Ferrari, A., Foster, C. W., Sutcliffe, O. B., Brownson, D. A. C., Belal, T. S., et al. (2019). Forensic Electrochemistry: The Electroanalytical Sensing of Mephedrone Metabolites. ACS Omega 4, 1947–1954. doi:10.1021/acsomega.8b02586
Fang, C., Zhao, J., Li, J., Qian, J., Liu, X., Sun, Q., et al. (2019). Massively Parallel Sequencing of microRNA in Bloodstains and Evaluation of Environmental Influences on miRNA Candidates Using Realtime Polymerase Chain Reaction. Forensic Sci. Int. Genet. 38, 32–38. doi:10.1016/j.fsigen.2018.10.001
Fruehwald, H. M., Ebralidze, I. I., Zenkina, O. V., and Easton, E. B. (2021). Effect of Transition Metal on the Oxygen Reduction Reaction Activity of Novel M-N3/C Active Site. ChemElectroChem 8, 53–61. doi:10.1002/celc.202000954
Fu, J., and Allen, R. W. (2019). A Method to Estimate the Age of Bloodstains Using Quantitative PCR. Forensic Sci. Int. Genet. 39, 103–108. doi:10.1016/j.fsigen.2018.12.004
Fujita, Y., Tsuchiya, K., Abe, S., Takiguchi, Y., Kubo, S.-i., and Sakurai, H. (2005). Estimation of the Age of Human Bloodstains by Electron Paramagnetic Resonance Spectroscopy: Long-Term Controlled Experiment on the Effects of Environmental Factors. Forensic Sci. Int. 152, 39–43. doi:10.1016/j.forsciint.2005.02.029
Ge, X., Sumboja, A., Wuu, D., An, T., Li, B., Goh, F. W. T., et al. (2015). Oxygen Reduction in Alkaline Media: From Mechanisms to Recent Advances of Catalysts. ACS Catal. 5, 4643–4667. doi:10.1021/acscatal.5b00524
Hanson, E. K., and Ballantyne, J. (2010). A Blue Spectral Shift of the Hemoglobin Soret Band Correlates with the Age (Time since Deposition) of Dried Bloodstains. PLoS ONE 5, e12830–11. doi:10.1371/journal.pone.0012830
Hanson, E., Albornoz, A., and Ballantyne, J. (2011). Validation of the Hemoglobin (Hb) Hypsochromic Shift Assay for Determination of the Time since Deposition (TSD) of Dried Bloodstains. Forensic Sci. Int. Genet. Suppl. Ser. 3, e307–e308. doi:10.1016/j.fsigss.2011.09.016
Harshey, A., Srivastava, A., Das, T., Nigam, K., Shrivastava, R., and Yadav, V. K. (2021). Trends in Gunshot Residue Detection by Electrochemical Methods for Forensic Purpose. J. Anal. Test. 5, 258–269. doi:10.1007/s41664-020-00152-x
Heneghan, N., Fu, J., Pritchard, J., Payton, M., and Allen, R. W. (2021). The Effect of Environmental Conditions on the Rate of RNA Degradation in Dried Blood Stains. Forensic Sci. Int. Genet. 51, 102456. doi:10.1016/j.fsigen.2020.102456
Hussain, K. K., Moon, J.-M., Park, D.-S., and Shim, Y.-B. (2017). Electrochemical Detection of Hemoglobin: A Review. Electroanalysis 29, 2190–2199. doi:10.1002/elan.201700308
James, S. H., Kish, P. E., and Sutton, T. P. (2005). Principles of Bloodstain Pattern Analysis: Theory and Practice. 1st Editio. Boca Raton: CRC Press. doi:10.1201/9781420039467
Kassa, T., Jana, S., Meng, F., and Alayash, A. I. (2016). Differential Heme Release from Various Hemoglobin Redox States and the Upregulation of Cellular Heme Oxygenase‐1. FEBS Open Bio 6, 876–884. doi:10.1002/2211-5463.12103
Laan, N., Smith, F., Nicloux, C., and Brutin, D. (2016). Morphology of Drying Blood Pools. Forensic Sci. Int. 267, 104–109. doi:10.1016/j.forsciint.2016.08.005
Lemler, P., Premasiri, W. R., DelMonaco, A., and Ziegler, L. D. (2014). NIR Raman Spectra of Whole Human Blood: Effects of Laser-Induced and In Vitro Hemoglobin Denaturation. Anal. Bioanal. Chem. 406, 193–200. doi:10.1007/s00216-013-7427-7
Li, B., Beveridge, P., O'Hare, W. T., and Islam, M. (2013). The Age Estimation of Blood Stains up to 30days Old Using Visible Wavelength Hyperspectral Image Analysis and Linear Discriminant Analysis. Sci. Justice 53, 270–277. doi:10.1016/j.scijus.2013.04.004
Liu, J. Y., Zhong, C., Holt, A., Lagace, R., Harrold, M., Dixon, A. B., et al. (2012). AutoMate ExpressTM Forensic DNA Extraction System for the Extraction of Genomic DNA from Biological Samples. J. Forensic Sci. 57, 1022–1030. doi:10.1111/j.1556-4029.2012.02084.x
Lociciro, S., Dujourdy, L., Mazzella, W., Margot, P., and Lock, E. (2004). Dynamic of the Ageing of Ballpoint Pen Inks: Quantification of Phenoxyethanol by GC-MS. Sci. Justice 44, 165–171. doi:10.1016/S1355-0306(04)71709-8
Matsuoka, T., Taguchi, T., and Okuda, J. (1995). Estimation of Bloodstain Age by Rapid Determinations of Oxyhemoglobin by Use of Oxygen Electrode and Total Hemoglobin. Biol. Pharm. Bull. 18, 1031–1035. doi:10.1248/bpb.18.1031
Mc Shine, S., Suhling, K., Beavil, A., Daniel, B., and Frascione, N. (2017). The Applicability of Fluorescence Lifetime to Determine the Time since the Deposition of Biological Stains. Anal. Methods 9, 2007–2013. doi:10.1039/c6ay03099h
Mendes, L. F., Souza e Silva, Â. R., Bacil, R. P., Serrano, S. H. P., Angnes, L., Paixão, T. R. L. C., et al. (2019). Forensic Electrochemistry: Electrochemical Study and Quantification of Xylazine in Pharmaceutical and Urine Samples. Electrochim. Acta 295, 726–734. doi:10.1016/j.electacta.2018.10.120
Min, X., Chen, Y., and Kanan, M. W. (2014). Alkaline O2 Reduction on Oxide-Derived Au: High Activity and 4e- Selectivity without (100) Facets. Phys. Chem. Chem. Phys. 16, 13601–13604. doi:10.1039/c4cp01337a
Naomi Oiye, É., Midori Toia Katayama, J., Fernanda Muzetti Ribeiro, M., Oka Duarte, L., de Castro Baker Botelho, R., José Ipólito, A., et al. (2020). Voltammetric Detection of 3,4-methylenedioxymethamphetamine (Mdma) in Saliva in Low Cost Systems. Forensic Chem. 20, 100268. doi:10.1016/j.forc.2020.100268
Ogunlesi, M., Okiei, W., Akanmu, A. S., Popoola, T., Okafor, K., and Akore, O. (2009). Novel Method for the Determination of Haemoglobin Phenotypes by Cyclic Voltammetry Using Glassy Carbon Electrode. Int. J. Electrochem. Sci. 4, 1593–1606. https://ir.unilag.edu.ng/bitstream/handle/123456789/4655/Novel%20method%20for%20the%20determination%20of%20haemoglobin%20phenotypes%20by%20cyclic%20voltammetry%20using%20glassy%20carbon%20electrode..pdf?sequence=1
Osmieri, L., Monteverde Videla, A. H. A., and Specchia, S. (2016). Optimization of a Fe-N-C Electrocatalyst Supported on Mesoporous Carbon Functionalized with Polypyrrole for Oxygen Reduction Reaction under Both Alkaline and Acidic Conditions. Int. J. Hydrogen Energy 41, 19610–19628. doi:10.1016/j.ijhydene.2016.05.270
Peters, F. T. (2007). Stability of Analytes in Biosamples-An Important Issue in Clinical and Forensic Toxicology? Anal. Bioanal. Chem. 388, 1505–1519. doi:10.1007/s00216-007-1267-2
Rahman, M. R., Allan, J. T. S., Zamanzad Ghavidel, M., Prest, L. E., Saleh, F. S., and Easton, E. B. (2016). The Application of Power-Generating Fuel Cell Electrode Materials and Monitoring Methods to Breath Alcohol Sensors. Sensors Actuators B Chem. 228, 448–457. doi:10.1016/j.snb.2016.01.061
Ramdani, O., Metters, J. P., Figueiredo-Filho, L. C. S., Fatibello-Filho, O., and Banks, C. E. (2013). Forensic Electrochemistry: Sensing the Molecule of Murder Atropine. Analyst 138, 1053–1059. doi:10.1039/c2an36450f
Safavi, A., Maleki, N., Moradlou, O., and Sorouri, M. (2008). Direct Electrochemistry of Hemoglobin and its Electrocatalytic Effect Based on its Direct Immobilization on Carbon Ionic Liquid Electrode. Electrochem. Commun. 10, 420–423. doi:10.1016/j.elecom.2007.12.026
Salzmann, A. P., Russo, G., Kreutzer, S., and Haas, C. (2021). Degradation of Human mRNA Transcripts over Time as an Indicator of the Time since Deposition (TsD) in Biological Crime Scene Traces. Forensic Sci. Int. Genet. 53, 102524. doi:10.1016/j.fsigen.2021.102524
Samyn, N., and Wael, K. d. (2019). Electrochemical Strategies for Adulterated Heroin Samples. Anal. Chem. 91, 7920–7928. doi:10.1021/acs.analchem.9b01796
Shikama, K. (1998). The Molecular Mechanism of Autoxidation for Myoglobin and Hemoglobin: A Venerable Puzzle. Chem. Rev. 98, 1357–1374. doi:10.1021/cr970042e
Shukla, R. K. (2017). Forensic Application of Comet Assay: an Emerging Technique. Forensic Sci. Res. 2, 180–184. doi:10.1080/20961790.2017.1379893
Simões, S. S., Casta, A., and Dias, M. J. (2018). Dried Blood Spots Combined to an UPLC-MS/MS Method for the Simultaneous Determination of Drugs of Abuse in Forensic Toxicology. J. Pharm. Biomed. Analysis 147, 634–644. doi:10.1016/j.jpba.2017.02.046
Smith, J. P., Metters, J. P., Kampouris, D. K., Lledo-fernandez, C., Sutcliffe, O. B., and Banks, C. E. (2013). Forensic Electrochemistry: the Electroanalytical Sensing of Rohypnol (Flunitrazepam) Using Screen-Printed Graphite Electrodes without Recourse for Electrode or Sample Pre-treatment. Analyst 138, 6185–6191. doi:10.1039/c3an01352a
Sparer, A., Serp, B., Schwarz, L., and Windberger, U. (2020). Storability of Porcine Blood in Forensics: How Far Should We Go? Forensic Sci. Int. 311, 110268. doi:10.1016/j.forsciint.2020.110268
Streeting, C. A., Chaseling, J., Krosch, M. N., and Wright, K. (2020). A Comparison of ABAcard® Hematrace® and RSIDTM-Blood Tests on Dried, Diluted Bloodstains Treated with Leucocrystal Violet or Luminol. Aust. J. Forensic Sci. 54, 108–118. doi:10.1080/00450618.2020.1781256
Sun, W., Wang, D., Li, G., Zhai, Z., Zhao, R., and Jiao, K. (2008). Direct Electron Transfer of Hemoglobin in a CdS Nanorods and Nafion Composite Film on Carbon Ionic Liquid Electrode. Electrochim. Acta 53, 8217–8221. doi:10.1016/j.electacta.2008.06.021
Toh, R. J., Peng, W. K., Han, J., and Pumera, M. (2014). Direct In Vivo Electrochemical Detection of Haemoglobin in Red Blood Cells. Sci. Rep. 4, 1–7. doi:10.1038/srep06209
Umbreit, J. (2007). Methemoglobin-It's Not Just Blue: A Concise Review. Am. J. Hematol. 82, 134–144. doi:10.1002/ajh.20738
Virkler, K., and Lednev, I. K. (2009). Analysis of Body Fluids for Forensic Purposes: From Laboratory Testing to Non-destructive Rapid Confirmatory Identification at a Crime Scene. Forensic Sci. Int. 188, 1–17. doi:10.1016/j.forsciint.2009.02.013
Wang, L., and Hu, N. (2001). Direct Electrochemistry of Hemoglobin in Layer-By-Layer Films with Poly(vinyl Sulfonate) Grown on Pyrolytic Graphite Electrodes. Bioelectrochemistry 53, 205–212. doi:10.1016/S0302-4598(01)00095-2
Wedege, K., Dražević, E., Konya, D., and Bentien, A. (2016). Organic Redox Species in Aqueous Flow Batteries: Redox Potentials, Chemical Stability and Solubility. Sci. Rep. 6 (1), 1–13. doi:10.1038/srep39101
Weyermann, C., Kirsch, D., Vera, C. C., and Spengler, B. (2007). A GC/MS Study of the Drying of Ballpoint Pen Ink on Paper. Forensic Sci. Int. 168, 119–127. doi:10.1016/j.forsciint.2006.06.076
Weyermann, C., Roux, C., and Champod, C. (2011). Initial Results on the Composition of Fingerprints and its Evolution as a Function of Time by GC/MS Analysis. J. Forensic Sci. 56, 102–108. doi:10.1111/j.1556-4029.2010.01523.x
Wigmore, J. G., and Langille, R. M. (2009). Six Generations of Breath Alcohol Testing Instruments: Changes in the Detection of Breath Alcohol since 1930. An Historical Overview. Can. Soc. Forensic Sci. J. 42, 276–283. doi:10.1080/00085030.2009.10757614
Xu, Y., Hu, C., and Hu, S. (2008). Direct Electron-Transfer of Native Hemoglobin in Blood: Kinetics and Catalysis. Bioelectrochemistry 72, 135–140. doi:10.1016/j.bioelechem.2008.01.002
Xu, H., Dai, H., and Chen, G. (2010). Direct Electrochemistry and Electrocatalysis of Hemoglobin Protein Entrapped in Graphene and Chitosan Composite Film. Talanta 81, 334–338. doi:10.1016/j.talanta.2009.12.006
Yao, H., Li, N., Xu, J., and Zhu, J. (2007). Direct Electrochemistry and Electrocatalysis of Hemoglobin in Gelatine Film Modified Glassy Carbon Electrode. Talanta 71, 550–554. doi:10.1016/j.talanta.2006.04.025
Yu, X., and Manthiram, A. (2018). Electrochemical Energy Storage with an Aqueous Quinone-Air Chemistry. ACS Appl. Energy Mater. 1 (6), 2424–2428. doi:10.1021/acsaem.8b00536
Yu, C., Wang, L., Zhu, Z., Bao, N., and Gu, H. (2014). Trans-membrane Electron Transfer in Red Blood Cells Immobilized in a Chitosan Film on a Glassy Carbon Electrode. Microchim. Acta 181, 55–61. doi:10.1007/s00604-013-1060-1
Yu, H. A., Detata, D. A., Lewis, S. W., and Silvester, D. S. (2017). Recent Developments in the Electrochemical Detection of Explosives: Towards Field-Deployable Devices for Forensic Science. TrAC Trends Anal. Chem. 97, 374–384. doi:10.1016/j.trac.2017.10.007
Zadora, G., and Menżyk, A. (2018). In the Pursuit of the Holy Grail of Forensic Science - Spectroscopic Studies on the Estimation of Time since Deposition of Bloodstains. TrAC Trends Anal. Chem. 105, 137–165. doi:10.1016/j.trac.2018.04.009
Zhang, G., Wei, Q., Yang, X., Tavares, A. C., and Sun, S. (2017). RRDE Experiments on Noble-Metal and Noble-metal-free Catalysts: Impact of Loading on the Activity and Selectivity of Oxygen Reduction Reaction in Alkaline Solution. Appl. Catal. B Environ. 206, 115–126. doi:10.1016/j.apcatb.2017.01.001
Keywords: forensic chemistry, red blood cells, hemoglobin, heme redox activity, transmembrane electron transfer, rotating disk electrode, oxygen reduction reaction
Citation: Tiessen M, Fruehwald HM, Easton EB and Stotesbury T (2022) Insights Into Bloodstain Degradation and Time Since Deposition Estimation Using Electrochemistry. Front. Anal. Sci. 2:900483. doi: 10.3389/frans.2022.900483
Received: 20 March 2022; Accepted: 09 May 2022;
Published: 08 June 2022.
Edited by:
Lynn Dennany, University of Strathclyde, United KingdomReviewed by:
Marcel De Puit, Netherlands Forensic Institute, NetherlandsKelly Brown, University of Strathclyde, United Kingdom
Copyright © 2022 Tiessen, Fruehwald, Easton and Stotesbury. This is an open-access article distributed under the terms of the Creative Commons Attribution License (CC BY). The use, distribution or reproduction in other forums is permitted, provided the original author(s) and the copyright owner(s) are credited and that the original publication in this journal is cited, in accordance with accepted academic practice. No use, distribution or reproduction is permitted which does not comply with these terms.
*Correspondence: Theresa Stotesbury, VGhlcmVzYS5TdG90ZXNidXJ5QG9udGFyaW90ZWNodS5jYQ==