 Rong Fu
 Diane J. Sutcliffe
 Ashok R. Dinasarapu
 Ellen J. Hess1,3
 H. A. Jinnah
- 1HPLC Bioanalytical Core, School of Medicine, Emory University, Atlanta, GA, United States
- 2Departments of Neurology, Human Genetics, and Pediatrics, Emory University, Atlanta, GA, United States
- 3Department of Pharmacology and Chemical Biology, Emory University School of Medicine, Atlanta, GA, United States
Defects in numerous aspects of purine metabolism are well-recognized causes for human diseases. The applicability of ultra performance liquid chromatography (UPLC) with photodiode array (PDA) detection for analysis of the most abundant biological relevant purines metabolites is described. This method was optimized to resolve and quantify 15 purine metabolites including ATP, ADP, AMP, adenosine, adenine, GTP, GDP, GMP, IMP, ZMP, guanosine, hypoxanthine, inosine, xanthine and uric acid in 33 min with a 5 μL injection volume. With purified standards, the detection was linear in a range from 0.1 to 100 μM. The within-run and between-run variances were <2% overall, indicating excellent reproducibility and reliability. Samples from cultured human cells were prepared to assess the applicability of the method in biological samples. When compared to normal cell lines, mutant cell lines in which purine salvage was absent showed small or no changes for most intracellular purines. Conditioned medium contained no detectable purines, except for hypoxanthine, which was elevated in the mutant lines as expected. Compared to previous methods, this new UPLC-PDA method provides better resolution of key purine metabolites, higher sensitivity with a smaller sample size and half the run time. Similar to prior methods, the new method appears well suited to the simultaneous analysis of the most abundant biologically relevant purines in biological samples.
1 Introduction
The purines are an important group of small organic molecules that play essential roles for many biological processes in all cells. The purines are usually divided into two groups (Figure 1). The first group includes the base adenine, its nucleoside derivative in which adenine is combined with ribose (adenosine), and its phosphorylated nucleotides (AMP, ADP, ATP). ATP is a building block for RNA, and its deoxy derivative (dATP) is a building block for DNA. ATP also serves as an energy source for many biochemical reactions. Some ATP derivatives serve as signaling factors (e.g., cAMP or adenosine) or as intracellular co-factors for enzymatic reactions (e.g., FAD, NAD, NADP). The second group of purines includes the base guanine, its nucleoside derivative (guanosine), and its nucleotide derivatives (GMP, GDP, GTP). Like the adenine nucleotides, guanine-based derivatives serve as building blocks for nucleic acids (DNA and RNA). GTP can serve as an energy source for certain biochemical reactions, and GTP or its derivatives (e.g., cGTP) play important roles in cellular signaling.
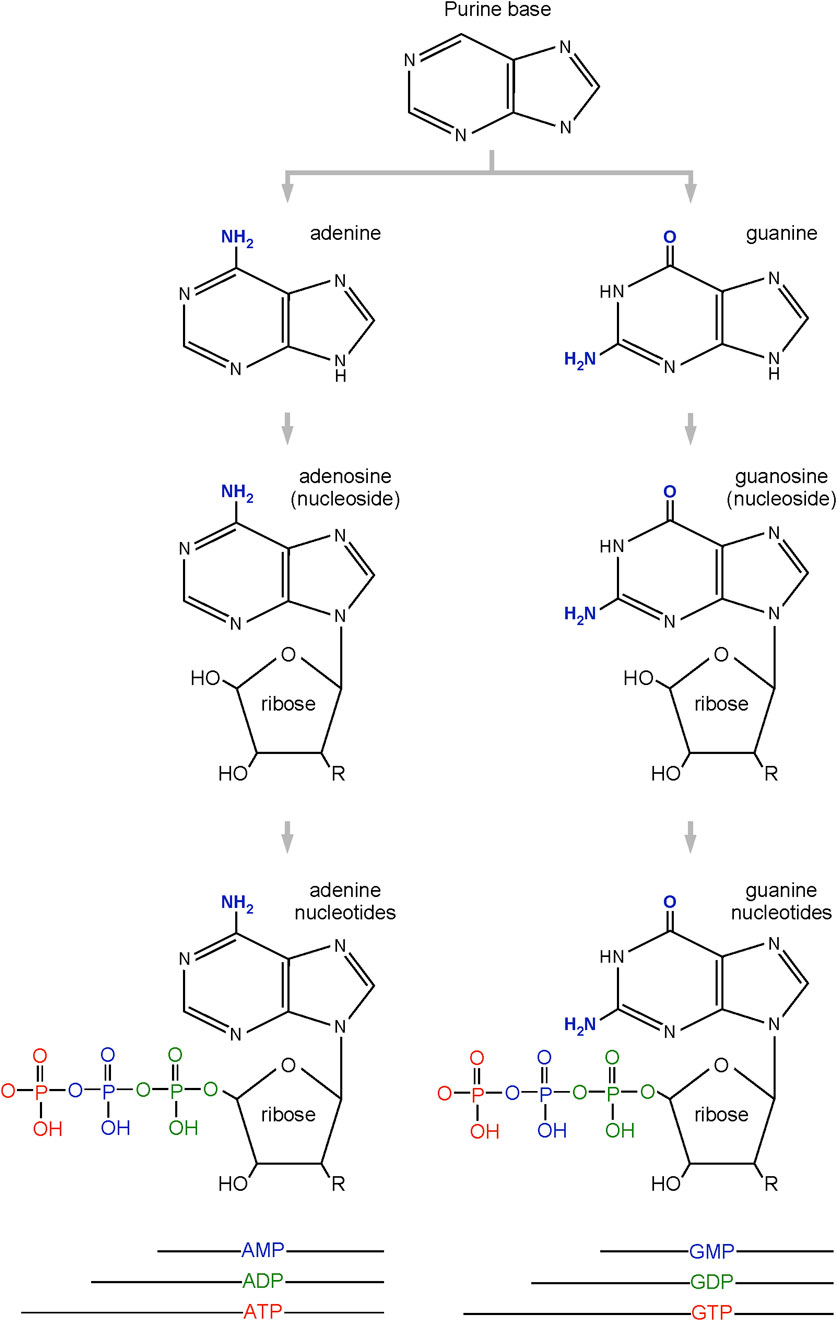
Figure 1. Most biologically abundant purines.
Defects in numerous aspects of purine metabolism are well-recognized causes for human diseases (Jinnah, 2025). Because of the central role of purines in biology and medicine, many methods have been developed to measure them. Most of these methods target specific subsets of purines, but some provide more comprehensive assessments for the majority of purines found in mammalian cells (Bakay et al., 1978; Nissinen, 1980; Zakaria and Brown, 1981; Malliaros et al., 1988; Smolenski et al., 1990). We previously described a method that involved high pressure liquid chromatography (HPLC) with ultraviolet photodiode array detection (PDA) to measure 13 of the most abundant purines found in mammalian tissues. This method has been applied to numerous samples including human blood, urine, cerebrospinal fluid, and cultured cells (Shirley et al., 2007; Goettle et al., 2013; Sampat et al., 2016; Lopez et al., 2020; Sutcliffe et al., 2021). Since then, the method has been adapted to measure other purine derivatives that are detected only during certain pathological circumstances, such as Z-nucleotides (5-aminoimidazole-4-carboxamide riboside 5′-monophosphate) and its derivatives (AICA and AICAr), 2,8-dihydroxyadenine, as well as purine-related medications and derivatives (allopurinol and oxipurinol) (Lopez et al., 2020). The purpose of the current report is to describe a new method based on ultra performance liquid chromatography UPLC with PDA detection that has improved sensitivity and separation with a shorter run time.
2 Methods
2.1 UPLC separation and quantification
Purines were measured by ultra high-performance liquid chromatography UPLC with photodiode array (PDA) ultraviolet detection. The system consisted of a Waters ACQUITY H-Class plus (CH-A) core, quaternary solvent manager, and PDA eLambda detector. Analytes were separated using reverse-phase chromatography on a Waters ACQUITY Premier HSS C18 VanGuard FIT Column, 1.8 µm, 2.1 mm × 100 mm. Elution was conducted at 0.5 mL/min with a stepped gradient of buffer A (10 mM ammonium acetate and 1.5 mM tetrabutylammonium phosphate, pH 5.0) and buffer B (10 mM ammonium phosphate, 1.5 mM TBAP, 25% acetonitrile, pH 7.0 before adding acetonitrile). The gradient consistent of the following sequence: 100% buffer A for 11 min; A linear gradient to 75% buffer B over 1 min, 3 min at 75% buffer B, a linear gradient to 100% buffer B over 4 min, 100% buffer B for 4 min, and a linear gradient to 0% buffer A over 30 s. The column was then re-equilibrated with 100% buffer A for 9.5 min prior to next run.
Reference standards for purines were obtained from Sigma Chemical Co. and prepared in distilled water. Purines in biological samples were identified by comparing their retention times and spectral profiles to known standards, and quantified at a detection wavelength of 254 nm. The injection volume was 5 μL. The column temperature was 40°C and autosampler was 4°C.
2.2 Sample preparation
To assess performance in biological samples, samples from cultured human cells were prepared as previously described (Sutcliffe et al., 2021). The cells included 3 publicly available induced pluripotent stem cells (iPSCs) in the undifferentiated state, each with and without a c.508C>T stop codon mutation in the HPRT1 gene that causes complete loss of the enzyme (hypoxathine-guanine phosphoribosyltransferase) that is associated with the purine disorder Lesch-Nyhan disease (Fu et al., 2014). The iPSCs included KOLF2.0, NCRM1, and PGP-1. In brief, cultures were grown in 6 well plates to 60%–80% confluency for approximately 1 million cells. The culture medium was freshly replaced 24 h before sample collection.
To measure purines released into the culture medium, a 450 µL aliquot of the medium was mixed with 50 µL of 1 mol/L perchloric acid to produce a final concentration of 0.1 mol/L perchloric acid. The sample was then stored at −80°C. When all samples were ready, they were thawed on ice and a 200 µL aliquot centrifuged for 15 min at 4°C at 13,000 g. Then 12 µL of 3.5 mol/L K2CO3 was added and the sample was stored on ice to precipitate potassium perchlorate. The sample was then centrifuged again at 13,000 g for 15 min, and the supernatant further clarified with PVDF microcentrifuge filter tubes (5,000 g for 5 min). Injection volume was 5 µL.
To measure intracellular purines, all culture medium was removed, cells were released from the plate by trypsinization, pelleted at 500 g × 5 min, and the pellet was mixed with 200 µL 0.2 mol/L perchloric acid. At this point, samples could be stored at −80°C. When all samples were ready, they were thawed on ice. Cell pellets were sonicated at 50% amplitude and pulse 2 s on and 2 s off for 1 min using a Q500A cup horn sonicator with the chiller at 4°C (QSONICA, Newtown, CT). The sample was then centrifuged at 13,000 g for 15 min at 4°C. The supernatant containing purines was removed to a fresh tube, the pH neutralized with 11 µL of 3.5 mol/L K2CO3, and the sample left on ice for 1 h to precipitate potassium perchlorate. The sample was then centrifuged again at 13,000 g for 5 min, and the supernatant further clarified with PVDF microcentrifuge filter tubes (8,000 g for 3 min). Injection volume was 5 µL. Protein pellets were dissolved in 2% SDS, and the total protein concentration was determined with the Pierce BCA kit (Thermo Fisher Scientific, Rockford IL).
2.3 Data analysis
Analytes were identified using a combination of retention time and UV spectrum, and each was quantified by comparison to known standards. For intracellular purines, results were expressed as nmoles per mg total cellular protein, to adjust for any differences in cell numbers at harvest. For extracellular purines, results were corrected according to the volume of tissue culture medium and culture duration (24 h) and expressed as nmoles per mg protein per 24 h.
The energy state of the cells was estimated using the adenylate energy charge (AEC) calculated with the formula ([ATP] + 0.5 × [ADP])/([ATP] + [ADP] + [AMP]). The AEC varies between 0 and 1, with normal healthy cells usually having a value >0.80 (Oakhill et al., 2012). Results for each measure were expressed as average values ± SEM from 3 independent replicates. Comparisons between groups involved ANOVA with post hoc Tukey t-tests.
3 Results
3.1 Standards
With a run time of 33 min per sample, the method was capable of resolving and quantifying the most abundant biologically relevant purine metabolites including ATP, ADP, AMP, adenosine, adenine, GTP, GDP, GMP, IMP, ZMP, guanosine, hypoxanthine, inosine, xanthine and uric acid (Figure 2).
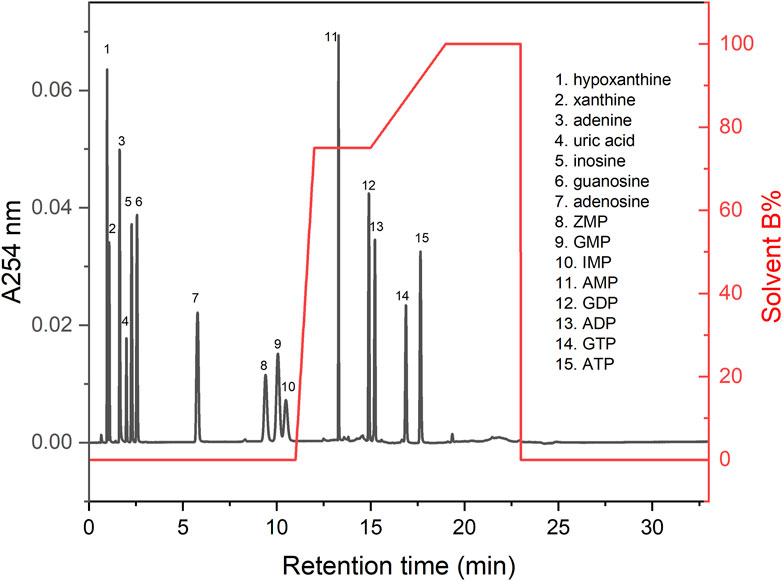
Figure 2. Chromatogram of standards. This figure shows a representative chromatogram for the standards mixed in a single run at 20 µM each. The UV absorbance at 254 nm (A254 nm) is shown on the left vertical axis, the solvent gradient is shown on the right vertical axis (% Solvent B), and the retention time is shown on the horizontal axis.
Assessing each metabolite at 9 different concentrations confirmed that detection was linear in a range from 0.1 to 100 µM (Figure 3). With a 5 µL volume, all metabolites could be detected down to a level of approximately 100 nM.
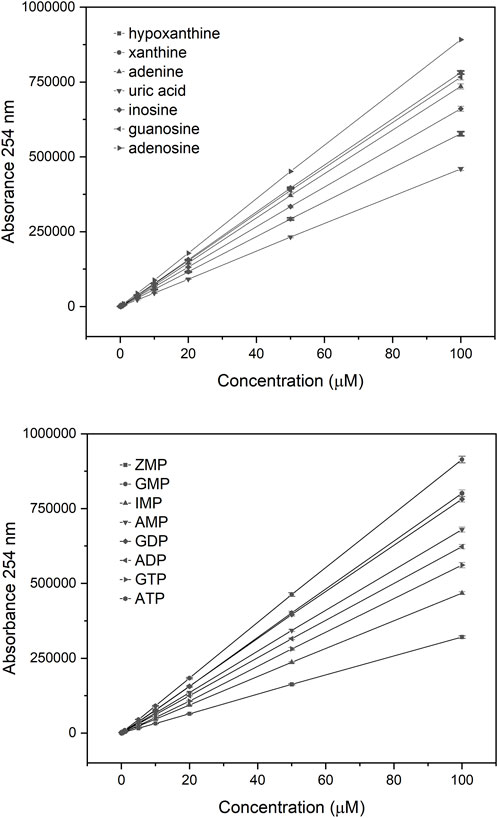
Figure 3. Linear range for individual purine metabolites. Each analyte was tested using 9 different concentrations, shown on the horizontal axis. The total UV absorbance at 254 nm is shown as the area under the peak for each analyte on the vertical axis.
To assess reproducibility the same sample was evaluated 5 times within a batch run, as well as in 3 separate batches on different days. The within-run coefficient of variance averaged 0.8% within a single batch, and the between-run variance averaged 1% for most analytes, confirming excellent reproducibility over time.
3.2 Biological samples
In keeping with prior studies of other mammalian cells (Shirley et al., 2007; Goettle et al., 2013; Lopez et al., 2020; Sutcliffe et al., 2021), intracellular adenine derivatives in the iPSCs were quantitatively more abundant than guanine derivatives, with ATP being found in greatest amounts (Table 1; Figure 4, top). The AEC fell between 0.81 and 0.88, confirming good preservation of nucleotide energy state. The variance (SEM) between biological samples depended on the total amount measured but averaged 10.7% of the measured value across all measurements.
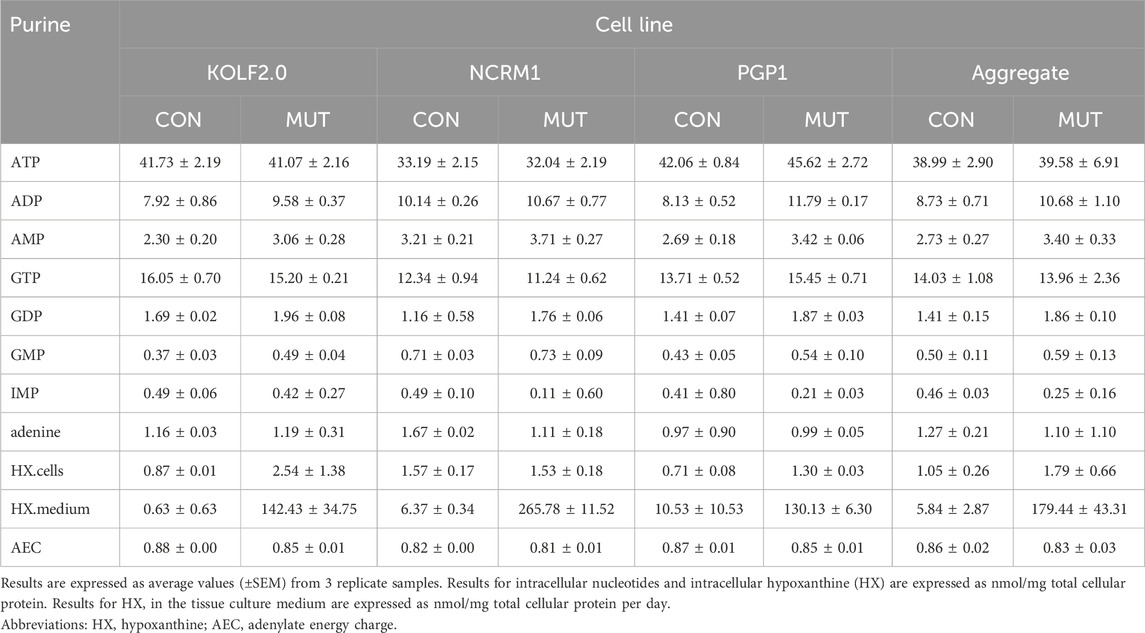
Table 1. Purine levels in normal and HPRT1-mutant cells.
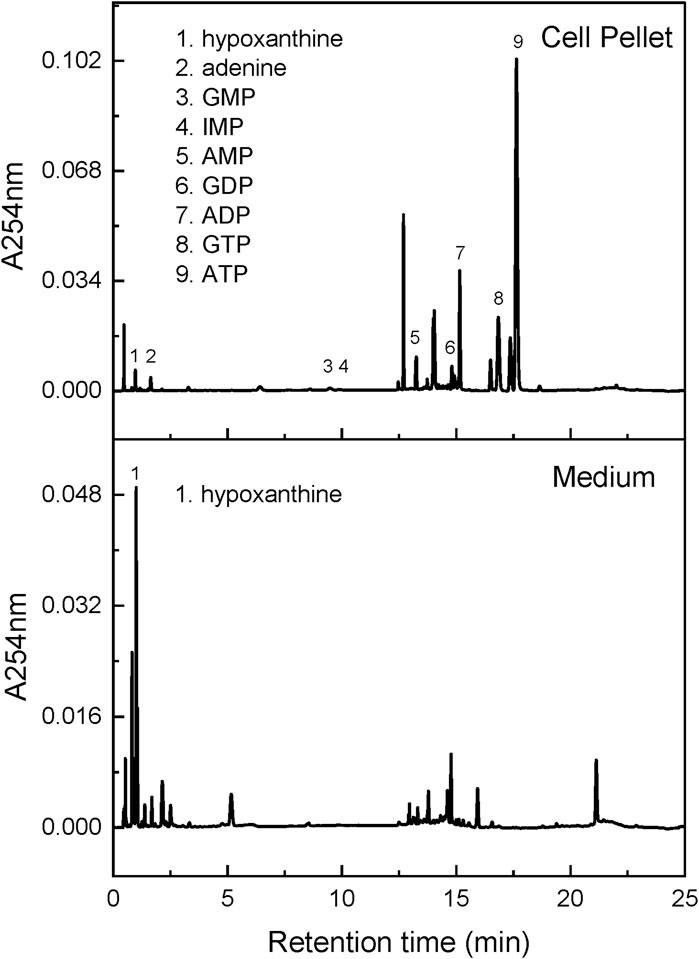
Figure 4. Chromatogram for cell samples. This figure shows representative chromatograms for intracellular purines and purines released into the tissue culture medium over a 24 h period. The X-axis shows retention time and the Y-axis shows UV absorbance at 254 nm.
Also in keeping with prior studies, control lines and their corresponding HPRT1 mutants showed small or no changes for most intracellular purines. Conditioned medium contained no detectable purines, except for hypoxanthine (Table 1; Figure 4 bottom). Although intracellular hypoxanthine was very low and not significantly different between control and mutant cell lines, extracellular hypoxanthine was elevated by an average of 30-fold in the HPRT1 mutants (range 12–225-fold depending on the cell line). This finding is expected since the mutations result in complete loss of the enzyme that recycles hypoxanthine, so cells cannot use it and instead dump it into the extracellular space.
Results for cellular purines were subject to 2-way MANOVA to account for potential relationships among the metabolites, followed by ANOVA for individual purine metabolites separately with a Benjamini–Hochberg correction for multiple comparisons (Table 1). The MANOVA showed significant main effects for both mutation status (controls vs. mutants; p < 0.01) and cell type (KOLF2.0 vs. NCRM1 vs. PGP1; p < 0.001), as well as a significant interaction between these variables (p < 0.05). For individual purine metabolites there were significant effects of mutation status for hypoxanthine in the medium (FDR = 1.3 × 10⁻⁷), as well as intracellular ADP (FDR = 0.0078) and AMP (FDR = 0.0049). There were also significant differences between cell types for ATP (FDR = 0.0016), AMP (FDR = 0.0021), GTP (FDR = 0.0011), GMP (FDR = 0.0011) and HX in medium (FDR = 0.0042).
4 Discussion
These studies describe a new method based on UPLC with UV-PDA detection capable of measuring the most abundant bioactive purines found in mammalian tissues. In 33 min, the method can quantify 15 of the most biologically abundant purines down to a level of approximately 100 nM with a 5 μL injection volume. Quantitative results were linear in the range of 0.1–100 μM. The within-run and between-run variances were <2% overall, indicating excellent reproducibility and suggesting the feasibility of comparing results across runs.
Compared to the original HPLC-PDA method, the new UPLC-PDA method has a run time shortened from 65 to 33 min. The new UPLC-PDA method also achieves higher sensitivity with half the sample volume. In addition, the new method is capable of discriminating GMP and IMP, whereas these two co-eluted with the older method. Therefore, the new UPLC-PDA method has many advantages over the older HPLC-PDA method. The new method has broad utility for scientific studies of the role of purines in cell biology and their abnormalities that occur in disorders of purine metabolism.
In keeping with many prior studies (Shirley et al., 2007; Goettle et al., 2013; Lopez et al., 2020; Sutcliffe et al., 2021), application of this new method to cultured cells revealed the major intracellular purines to be nucleotides. To normalize for small differences in cell numbers at harvest, results for intracellular purines retained in the cell pellet were expressed as nmol/mg total cellular protein. Results can also be expressed as nmol/cell, if cells are counted or as mM inside cells, if total intracellular protein volume is known (Traut, 1994). Cells retain relatively low concentrations of purine nucleosides and bases, because they are mainly released from cells to the extracellular environment. As a result, conditioned medium from cells contains higher amounts of nucleosides and bases, and no detectable nucleotides. For purines released into the tissue culture medium, results are also normalized according to time cultured. The HPRT1 mutant cells demonstrate the value of measuring extracellular purines, where changes in extracellular purines were far more obvious than intracellular purines.
This method has some limitations that should be acknowledged. The first is that it focusses mainly on free purines, and it does not include many biologically relevant purines incorporated into more complex molecules such as DNA, RNA, NAD(H), NADP(H), FAD(H), or others. The method can be adapted to more selectively measure some of these additional purine derivatives. The second is that some important purines occur at levels too low for detection (such as cyclic nucleotides, or deoxynucleotides used for nucleic acid synthesis) without prior sample concentration.
Purines are extremely rapidly metabolized in cells and tissues, so special precautions are needed to preserve them for high quality measurements (Ponten et al., 1973; Rauckhorst et al., 2022). Within seconds, ATP is dephosphorylated to ADP, and then to AMP. Within a few minutes, AMP begins to be further catabolized to adenosine, inosine, hypoxanthine, and uric acid. To preserve intracellular purines, cultured cells must be harvested within minutes, using special precautions to inactive enzymes that metabolize purines, such as perchloric acid. Measuring purines in mammalian tissues can be even more challenging, because degradation occurs even with the fastest of tissue dissections. To achieve best results, it has been argued that tissues should be freeze-clamped in situ, or enzymes inactivated by focused microwave irradiation (Ponten et al., 1973; Rauckhorst et al., 2022).
There are numerous other methods to measure purines, but most of them focus on one or a few metabolites. One of the most frequently measured targets is ATP, because it is often used as an estimate of cellular energy state. It is worth noting that isolated measures of ATP can be misleading because they cannot discriminate dephosphorylation of ATP (energy state) from loss of the entire adenine nucleotide backbone (purine depletion). The energy state of a cell is best determined by the ratio of ATP to its dephosphorylated derivates, ADP and AMP, most often calculated as the AEC (Oakhill et al., 2012). Calculation of the AEC requires simultaneous measurement of all three adenine nucleotides. Healthy cells and tissues usually have an AEC > 0.80. A low AEC may reflect energy impairment or poor sample quality.
Data availability statement
The raw data supporting the conclusions of this article will be made available by the authors, without undue reservation.
Ethics statement
The studies involving humans were approved by Emory University Institutional review board. The studies were conducted in accordance with the local legislation and institutional requirements. The human samples used in this study were acquired from primarily isolated as part of your previous study for which ethical approval was obtained. Written informed consent for participation was not required from the participants or the participants’ legal guardians/next of kin in accordance with the national legislation and institutional requirements.
Author contributions
RF: Data curation, Investigation, Methodology, Writing – review and editing. DS: Investigation, Methodology, Writing – review and editing. AD: Data curation, Methodology, Writing – review and editing. EH: Project administration, Supervision, Writing – review and editing. HJ: Conceptualization, Funding acquisition, Methodology, Project administration, Supervision, Writing – original draft, Writing – review and editing.
Funding
The author(s) declare that financial support was received for the research and/or publication of this article. This work was supported by NIH grants R01 NS109242 and R01 NS119758. It is also supported by the Emory HPLC Bioanalytical Core (EHBC), which is subsidized by the Emory University School of Medicine and is one of the Emory Integrated Core Facilities. Additional support was provided by the Georgia Clinical & Translational Science Alliance of the National Institutes of Health under Award Number UL1TR002378.
Conflict of interest
The authors declare that the research was conducted in the absence of any commercial or financial relationships that could be construed as a potential conflict of interest.
Generative AI statement
The author(s) declare that no Generative AI was used in the creation of this manuscript.
Publisher’s note
All claims expressed in this article are solely those of the authors and do not necessarily represent those of their affiliated organizations, or those of the publisher, the editors and the reviewers. Any product that may be evaluated in this article, or claim that may be made by its manufacturer, is not guaranteed or endorsed by the publisher.
Supplementary material
The Supplementary Material for this article can be found online at: https://www.frontiersin.org/articles/10.3389/frans.2025.1600781/full#supplementary-material
References
Bakay, B., Nissinen, E., and Sweetman, L. (1978). Analysis of radioactive and nonradioactive purine bases, nucleosides, and nucleotides by high speed chromatography on a single column. Anal. Biochem. 86, 65–77. doi:10.1016/0003-2697(78)90319-6
Fu, R., Ceballos-Picot, I., Torres, R. J., Larovere, L. E., Yamada, Y., Nguyen, K. V., et al. (2014). Genotype-phenotype correlations in neurogenetics: Lesch-nyhan disease as a model disorder. Brain 137, 1282–1303. doi:10.1093/brain/awt202
Goettle, M., Burhenne, H., Sutcliffe, D., and Jinnah, H. A. (2013). Purine metabolism during neuronal differentiation: the relevance of purine synthesis and recycling. J. Neurochem. 127, 805–818. doi:10.1111/jnc.12366
Jinnah, H. A. (2025). Disorders of purine and pyrimidine metabolism. Nelson textbook of pediatrics. Philadelphia: Elsevier.
Lopez, J. M., Outtrim, E. L., Fu, R., Sutcliffe, D. J., Torres, R. J., and Jinnah, H. A. (2020). Physiological levels of folic acid reveal purine alterations in Lesch-Nyhan disease. Proc. Natl. Acad. Sci. U. S. A. 117, 12071–12079. doi:10.1073/pnas.2003475117
Malliaros, D. P., Debenedetto, M. J., Guy, P. M., Tougas, T. P., and Jahngen, E. G. E. (1988). LC-EC determination of nucleotides and nucleic acids: application to enzyme assays and the analysis of DNA fragments. Anal. Biochem. 169, 121–131. doi:10.1016/0003-2697(88)90262-x
Nissinen, E. (1980). Analysis of purine and pyrimidine bases, ribonucleosides, and ribonucleotides by high-pressure liquid chromatography. Anal. Biochem. 106, 497–505. doi:10.1016/0003-2697(80)90554-0
Oakhill, J. S., Scott, J. W., and Kemp, B. E. (2012). AMPK functions as an adenylate charge-regulated protein kinase. Trends Endocrinol. Metab. 23, 125–132. doi:10.1016/j.tem.2011.12.006
Ponten, U., Ratcheson, R. A., Salford, L. G., and Siesjo, B. K. (1973). Optimal freezing conditions for cerebral metabolites in rats. J. Neurochem. 21, 1127–1138. doi:10.1111/j.1471-4159.1973.tb07567.x
Rauckhorst, A. J., Borcherding, N., Pape, D. J., Kraus, A. S., Scerbo, D. A., and Taylor, E. B. (2022). Mouse tissue harvest-induced hypoxia rapidly alters the in vivo metabolome, between-genotype metabolite level differences, and (13)C-tracing enrichments. Mol. Metab. 66, 101596. doi:10.1016/j.molmet.2022.101596
Sampat, R., Young, S., Rosen, A., Bernhard, D., Millington, D., Factor, S., et al. (2016). Potential mechanisms for low uric acid in Parkinson disease. J. Neural Transm. 123, 365–370. doi:10.1007/s00702-015-1503-4
Shirley, T. L., Lewers, J. C., Egami, K., Majumdar, A., Kelly, M., Ceballos-Picot, I., et al. (2007). A human neuronal tissue culture model for Lesch-Nyhan disease. J. Neurochem. 101, 841–853. doi:10.1111/j.1471-4159.2007.04472.x
Smolenski, R. T., Lachno, D. R., Ledingham, S. J. M., and Yacoub, M. H. (1990). Determination of sixteen nucleotides, nucleosides and bases using high-performance liquid chromatography and its application to the study of purine metabolism in hearts for transplantation. J. Chromatogr. 527, 414–420. doi:10.1016/s0378-4347(00)82125-8
Sutcliffe, D. J., Dinasarapu, A. R., Visser, J. E., Hoed, J. D., Seifar, F., Joshi, P., et al. (2021). Induced pluripotent stem cells from subjects with Lesch-Nyhan disease. Sci. Rep. 11, 8523. doi:10.1038/s41598-021-87955-9
Traut, T. W. (1994). Physiological concentrations of purines and pyrimidines. Mol. Cell Biochem. 140, 1–22. doi:10.1007/BF00928361
Keywords: purine, UPLC-PDA, quantification, biological sample, human diseases
Citation: Fu R, Sutcliffe DJ, Dinasarapu AR, Hess EJ and Jinnah HA (2025) Comprehensive measurement of purines in biological samples. Front. Anal. Sci. 5:1600781. doi: 10.3389/frans.2025.1600781
Received: 26 March 2025; Accepted: 18 July 2025;
Published: 31 July 2025.
Edited by:
Zhanjun Yang, Yangzhou University, ChinaReviewed by:
Jibin Abraham Punnoose, SUNY Albany, United StatesChen Zong, China Pharmaceutical University, China
Copyright © 2025 Fu, Sutcliffe, Dinasarapu, Hess and Jinnah. This is an open-access article distributed under the terms of the Creative Commons Attribution License (CC BY). The use, distribution or reproduction in other forums is permitted, provided the original author(s) and the copyright owner(s) are credited and that the original publication in this journal is cited, in accordance with accepted academic practice. No use, distribution or reproduction is permitted which does not comply with these terms.
*Correspondence: H. A. Jinnah, aGppbm5haEBlbW9yeS5lZHU=