 Baiba Renerte
 Jan Hausfeld
 Torsten Twardawski3
- 1Department of Banking and Finance, University of Zurich, Zurich, Switzerland
- 2CREED, Faculty of Economics and Business, University of Amsterdam, Amsterdam, Netherlands
- 3Department of Economics, University of Konstanz, Konstanz, Germany
Organizational decisions are often made by groups rather than individuals. Depending on the group composition, each member's characteristics—like gender and motivated beliefs—can influence the final group investment decision. To capture this, we design two types of investment situations in a randomized controlled laboratory experiment—one with fixed chances of success and one with performance-dependent chances of success. This novel design entails the perceived ability to “beat the odds” of the investment and thus models real-life investment situations more accurately than standard lottery choice. Our results demonstrate the benefits of mixed group composition in terms of both gender and overconfidence: Groups with all men and/or all overconfident group members consistently overinvest when a possibility to “beat the odds” is present, but not in standard situations. We explore several channels for our results and find that (i) individual probability perception, (ii) leader responsibility allocation and (iii) spillover effects from priming show significant effects.
1. Introduction
Imagine the following two scenarios. In the first scenario, there is a one in million chance of winning a national lottery, yet people still are buying lottery tickets. In the second scenario, there is a one in million chance of ending up in a “unicorn” status (1+ billion USD valuation) after founding a company, yet people still are launching startups. Some level of “I can beat the odds” mentality—and thus overconfidence—is associated with both, but in two very distinct ways.
Overconfidence is a commonly observed motivated belief that can have a range of real-life consequences—from positive psychological effects (Johnson and Fowler, 2011) and hiring advantages (Anderson et al., 2012; Reuben et al., 2014) to negative trading and investment outcomes (Barber and Odean, 2001; Malmendier and Tate, 2005; Trinugroho and Sembel, 2011). The focus in the literature has mostly been on individual overconfidence—defined as an excessive belief in one's own judgment or abilities, namely as the difference between one's confidence and actual performance (Klayman et al., 1999)—although important economic decisions are often made by groups rather than individuals, e.g., teams, committees or boards of directors vs. chief executives or general managers. A parallel strand of research examines gender differences in economic decision making (among others, Powell and Ansic, 1997; Gneezy and Croson, 2009; Eckel and Füllbrunn, 2015). Again, more attention has been dedicated to individual decision making, although there is a growing literature on group composition and diversity (Campbell and Mínguez-Vera, 2008; Hannagan and Larimer, 2010; Apesteguia et al., 2011; Charness and Rustichini, 2011; Kim and Starks, 2016; Bracha et al., 2019). We combine these two strands of literature in a laboratory experiment to investigate how collective investment decisions are affected by the inflated perceived ability to beat the odds, in combination with overconfidence and gender of the group members.
Previous research suggests that, e.g., boards of directors discuss details of merger and acquisition (M&A) investment decisions in interactive board meetings (Fama and Jensen, 1983; Hillman and Dalziel, 2003; Schwartz-Ziv and Weisbach, 2013) and that various board characteristics affect the performance of the approved deals (Khorana et al., 2007; Kolasinski and Li, 2013). A largely overlooked aspect in the investment decision literature is the group members' perceived ability to “beat the odds” of the market. Previous studies show that an experience-based proxy measure of board overconfidence can be negatively related to M&A success and positively related to overpricing, such that having more experience leads to poorer M&A decisions (Menkhoff et al., 2013). This could be a result of biased risk perception, e.g., due to a feeling of above-average knowledge that allows outperforming the market (Holzmeister et al., 2020).
In this study, we investigate the perceived ability to “beat the odds” of investment decisions in a laboratory experiment. We examine two types of investment situations: (i) standard-modeled investment situations (lotteries) with objectively-given chances of success and (ii) ability-related investment situations with performance-dependent chances of success. As the latter situations entail possible biases in ability-based risk perception, we argue that these capture various real-life investment situations more accurately than the standard situations. To illustrate, consider a standard lottery with a 50% chance of a positive outcome, zero otherwise. In comparison, consider now an equivalent ability-related lottery with a positive outcome if and only if one successfully solves a task that the general population is able to solve in 50% of cases. Would decision makers evaluate the subjective chances of success as the same in both situations? Possibly, but not necessarily; for example, due to the “better-than-others” (overplacement) aspect of the overconfidence phenomenon, which is often linked to gender (Lichtenstein and Fischhoff, 1977; Barber and Odean, 2001; Bengtsson et al., 2005; Ring et al., 2016 among others).
We use these two types of investment situations to construct a randomized controlled experiment that models an interactive meeting of a team, committee or board of directors (or any other group or dyad making an investment decision). We find that gender and overconfidence have a stronger effect on the investment levels in performance-dependent situations than in standard situations. Namely, groups with more men and more overconfident group members tend to overinvest only when a possibility to “beat the odds” of success is present (while gender and overconfidence are not strongly related in our sample). We further use different experimental treatments to examine the potential reasons behind this finding, including risk perception biases, preferences for assuming leadership, and risk perception spillovers through priming and communication. We find more overinvestment if the group members are first primed with performance-dependent investment situations. Thus, our results suggest that more diversity, in terms of both overconfidence and gender, improves group decision making—and so does perceiving the investment success chances as objective.
2. Related literature
We investigate how group investment decisions are influenced by the gender composition of the group and the overconfidence of the group members. In terms of the research question, the empirical studies on the decision making of boards of directors by Levi et al. (2014) and Twardawski and Kind (2016) are most closely related to our experimental study. Twardawski and Kind (2016) find that the directors' overconfidence is negatively related to later M&A success. In a different setup, Levi et al. (2014) find that the directors' gender is related to theM&A success, in that female directors help create shareholder value.1 In addition, Chen et al. (2019) conclude that male CEOs are less overconfident when female directors are on the board. Thus, the literature suggests that group members' overconfidence leads to overinvestment, while more gender-balanced groups make more optimal investment decisions. Yet, it remains unclear how pronounced the effects of group composition for different types of investment situations are, e.g., see the evidence on “betting on oneself” by Blavatskyy (2009) or Benoit et al. (2020).
Groups in certain settings such as the military, emergency health care and financial day-trading are of particular interest for understanding how teams make investment decisions as a function of gender and confidence (and even time pressure). For example, a substantial body of research in economics and finance find a link between overconfidence of individuals and faulty individual investment decision making (Lichtenstein and Fischhoff, 1977; Weinstein, 1980; Taylor and Brown, 1988). Early experimental studies show that almost 80% of respondents rate themselves in the top 50% of car drivers (Svenson, 1981), and more recent studies also demonstrate overconfidence in one's professional abilities (Meyer et al., 2013) and physical fitness (Obling et al., 2015). This phenomenon has been observed in chief executives (Roll, 1986; Malmendier and Tate, 2005, 2008; Billett and Qian, 2008; Huang and Kisgen, 2013) as well as private and institutional traders (Barber and Odean, 2001; Deaves et al., 2009), security analysts (Hilary and Menzly, 2006) and general-population experiment participants (Camerer and Lovallo, 1999; Biais et al., 2005; Dittrich et al., 2005; Ring et al., 2016; Friehe and Pannenberg, 2019).
Similarly, several studies have demonstrated gender differences in individual decision making.2 Yet, it is not clear whether and to what extent these individual overconfidence and gender effects translate into group investment decisions. While there have been a few studies investigating group decision making and overconfidence (Sniezek, 1992; Zarnoth and Sniezek, 1997; Kerr and Tindale, 2004; Healy and Pate, 2011; Cheng et al., 2020), these often do not consider risky investment decisions. In contrast, Kocher and Sutter (2005) and Viscusi et al. (2011), among others, do consider risky group investment decisions while neglecting the respective overconfidence of the group members. There are several ways how overconfidence in a group environment can differ from individual overconfidence. On the one hand, the group could mitigate individual overconfidence due to, for example, countering or compromising in the negotiation process (Shupp and Williams, 2008; Masclet et al., 2009). On the other hand, several group decision-making phenomena, such as groupthink, irrational exuberance or risky shift could aggravate the effects of individual overconfidence (Bénabou, 2013, 2015). These effects can interact with gender too, e.g., Healy and Pate (2011) have showed that men are more confident in their own performance than their group's, while women are more confident in their group's performance than their own. Performance-based investment opportunities and task responsibility can thus be particularly appealing to male group members.
All these factors play a role in group investment decisions. In our laboratory study, we can further include important control variables, such as: (i) individual risk preferences that might be driving the overconfidence effects and gender differences (Johnson and Fowler, 2011) and (ii) various individual personality traits, such as optimism, that are known to correlate with overconfidence (Schaefer et al., 2004; Trevelyan, 2008). We can also disentangle different components of overconfidence, considering whether the investment decision at hand requires judgment about the optimal prospect (overstatement) or rather abilities to carry out the prospect (overplacement).
3. Experimental design
In this study, we extend the previous empirical work on overconfidence and gender in group investment decisions by testing the proposed underlying mechanisms experimentally and including the respective controls. We construct a randomized controlled experiment that models several elements of an interactive meeting of a team, committee or board of directors by using dyads in a minimal-group design. Importantly, we introduce investment situations with performance-dependent odds of success and compare them to the commonly used objective-odds investment situations.
The general structure of our experimental design is as follows: Each subject faces ten investment situations. Each situation is faced twice, first individually and then in a two-member group using the unanimity rule (i.e., renegotiation for 90 s until a unanimous decision can be reached; alternatively, the “status quo” lowest investment level was selected if no option was chosen after 90 s). Five of the investment situations are standard Objective situations (see sub-section standard objective investment situations) and the other five are performance-dependent Ability situations (see sub-section performance-dependent ability investment situations). Finally, in addition to these within-subject comparisons, we examine two possible channels for the effects by introducing two between-subjects variations (see sub-section Explorative: spillover channels for overinvestment levels: priming and communication): We vary whether subjects first face the standard or performance-dependent situations and whether they are allowed to communicate before each of the group decisions.
3.1. Definition and measurement of overconfidence
We define overconfidence as an excessive belief in one's own judgment or abilities, namely as a difference between confidence (in the said judgment or abilities) and actual performance (among others, Klayman et al., 1999; Moore and Healy, 2008). To extract a bias score for each subject, we use an established multiple-choice general-knowledge task with 18 questions, which are adjusted for neutrality to hard-easy effects (Michailova and Katter, 2014; Michailova and Schmidt, 2016). As an example, one of the questions reads as follows: “Who is the author of the opera Tosca?” The subjects can provide one of the three possible answers to this question: G. Puccini, G. Verdi or A. Vivaldi. After choosing one of the answers, the subjects report their certainty that their answer was correct, between 33% (absolute guessing, chance level) and 100% (absolute certainty).
The bias score for each subject is calculated as the difference between the average confidence level across all questions (non-incentivized) and the proportion of the correct answers (incentivized) as seen in formula (1) below.3 A positive bias score represents overconfidence, a negative bias score represents underconfidence, and a bias score of zero indicates an accurately calibrated (neutral) subject.
We measure individual overconfidence using the bias score and afterwards check the robustness of our measure using two questions (incentivized) that map to the two core properties of the overconfidence phenomenon: (i) overestimation of one's actual performance and (ii) overplacement of one's performance relative to others. Namely, we ask for the subjects' estimates of how many of the items they answered correctly (0 to 18 items) and their estimates of what performance rank they have in the session (1 to n, where n is the number of subjects in a given session).
3.2. Definition and measurement of above-optimum investment levels
We construct an investment spectrum that allows measuring the closeness to a risk-neutral optimum of the chosen investment level in each investment situation (while controlling for risk preferences in all upcoming regression analyses), in which overinvestment above this optimum is always related lower expected return. The investment options in each situation are distributed non-linearly and the optimal choice in terms of the expected value lies either in the higher or lower middle sections of the spectrum or in one of the extremes of the spectrum. For each of the investment situations, subjects receive an endowment of 50 monetary units (MU) and can decide how much to invest.
3.2.1. Standard objective investment situations
Tables 1a, b illustrate an exemplary investment situation and a full list of all investment situations, respectively. The left-hand side refers to the standard investment situations (denoted Objective). In these situations, the listed probabilities are fixed and correspond to the actual probabilities of success in an “objective” sense. The column (a) of Table 1a depicts a list of investment levels that a subject can choose from after receiving the 50 MU endowment. Each investment level corresponds to an investment in a lottery. For example, if a subject chooses the third row, she invests 10 MU of her endowment to play a lottery offering an 80% chance of winning 20 MU (final outcome: 50 – 10 + 20 = 60 MU), but also a 20% chance of winning nothing and only losing the invested 10 MU (final outcome: 50 – 10 = 40 MU). In the example investment situation depicted in Table 1a, the optimum investment in terms of the expected value (EV) in column (g) is 10 or 15 MU. We compare how such investment decisions are made in groups with various gender and overconfidence compositions. We keep the group size of two and the (renegotiated) unanimity decision rule fixed.
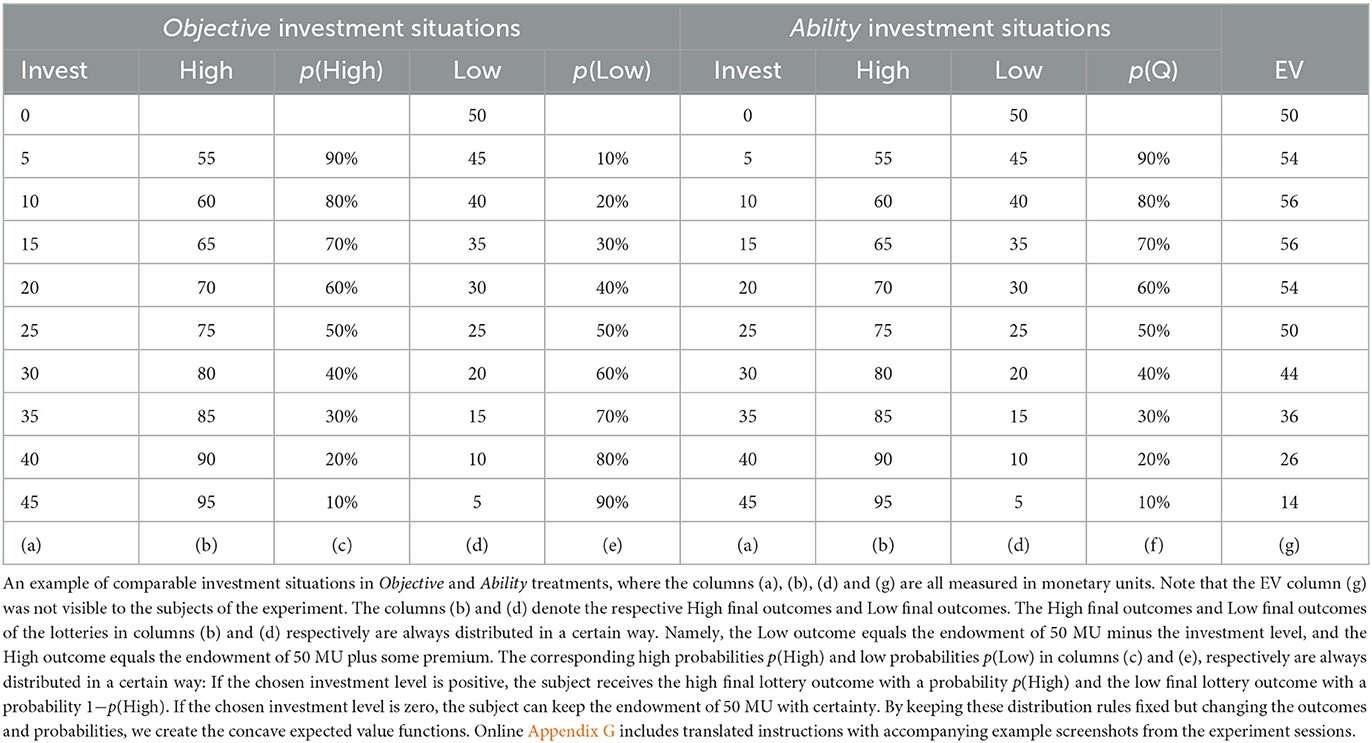
Table 1a. Exemplary decision situation.
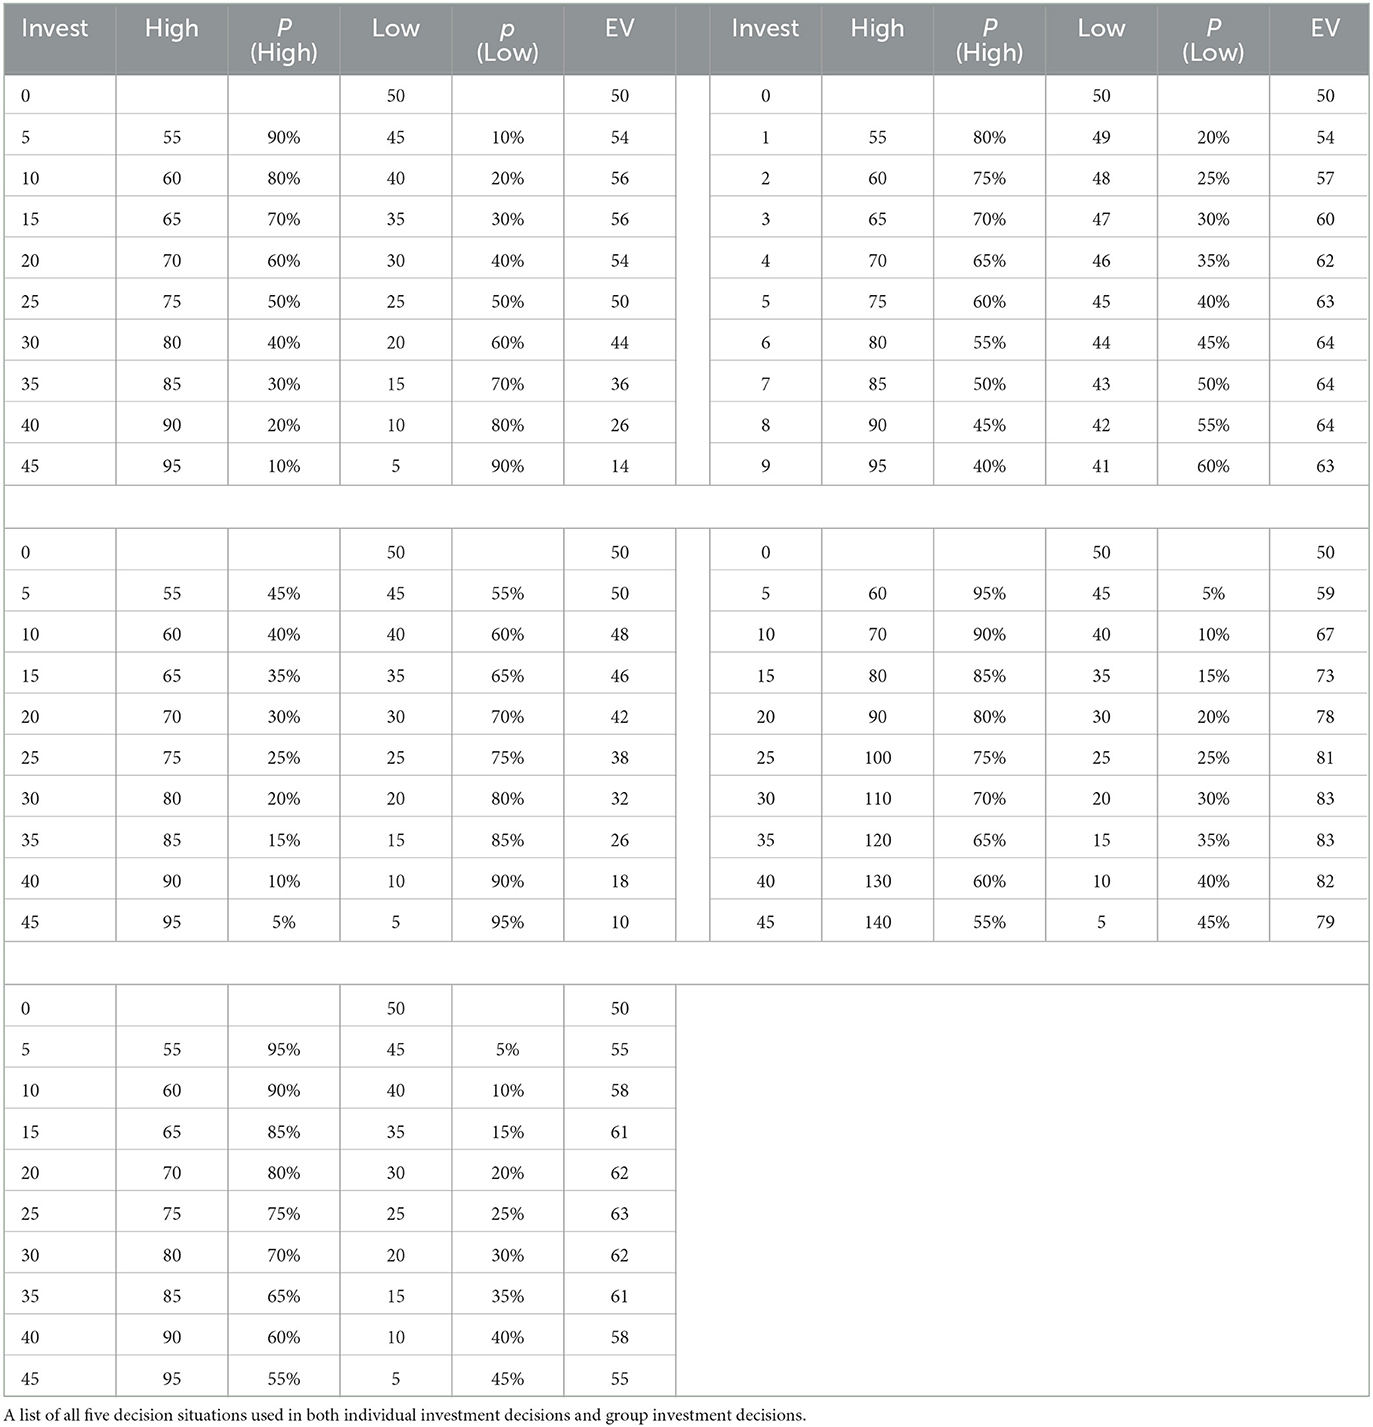
Table 1b. Overview of decision situations.
3.2.2. Performance-dependent ability investment situations
Subjects play half of the rounds with the described Objective type of investment situations with fixed (objective) odds of success. The other half of the rounds, however, are played with a second type of investment situations that differ in how the odds of success are portrayed. The performance-dependent investment situations (denoted Ability) are depicted on the right-hand side of Table 1a. In these investment situations, we allow the subjects to potentially “beat the odds” of the lotteries. By doing so, we mimic the willingness and perceived ability of the team or committee members or board directors to “outperform the market” in real-life investment decisions.
The Ability treatment with performance-dependent probabilities is a unique feature of our design and work as follows: We add a task to each of the investment levels, and the probabilities in column (f) indicate how easy or difficult the associated task will be. In other words, instead of receiving the High final outcome with the respective given probability as in the Objective investment situations, the subjects in the Ability situations receive the High final outcome if they successfully do a task for which we know from a large non-representative sample of general population what the task success chances in fact are. For this, we use data from a popular TV show in Germany called QuizDuell, where everyone watching the show can vote on their preferred answers to the displayed multiple-choice questions in a mobile application to compete with the guest in the studio.4
For example, the task associated with the 10 MU investment was successfully answered by 80% of the large non-representative general population sample, as indicated by the column (f) in Table 1a. To receive the High final outcome associated with this investment level, the subjects need to answer the same question as well. If a subject answers correctly, she receives the High outcome (in total 60 MU). If not, she receives the Low outcome (in total 40 MU). The probabilities in the column (f) of the Ability treatment thus correspond to the probabilities in the column (c) of the Objective treatment, as it shows how often, on average, the High outcome is achieved.
Based on the literature (e.g., Twardawski and Kind, 2016; Chen et al., 2019; Cheng et al., 2020), we hypothesize that the group composition with respect to overconfidence and gender are positively linked to above-optimum investment levels, such that groups with more overconfident and more male group members decide in favor of more above-optimum investments.
Hypothesis 1. Groups with more overconfident and more male members tend to make above-optimum investment levels. This holds in the Ability treatment, not necessarily in the Objective treatment.
After each subject first chooses the investment level and does the respective task on her own, an equivalent group decision follows. In the group decisions, one of the two group members (henceforth the “manager” of the task) steps forward to assume responsibility for the tasks. Note that all group decisions take place anonymously, with no communication before the task responsibility mechanism. Also, no details, such as gender, are revealed to other group members, in line with Eckel and Füllbrunn (2017) and in contrast to Eckel and Füllbrunn (2015). Without this feature, effects from stereotype threat, among others, could not be ruled out (Hoyt and Murphy, 2016; Chen and Houser, 2019).
Who does the task for the group? The manager for each two-person group is chosen in a preference-consistent way after the first individual decision and before the first group decision (or any communication) of each group, in accordance with ranked self-reports of the willingness to become the manager (on a four-point scale from, which is binarized for the purposes of some analysis). We chose this approach to model real-life decision making in teams, committees or boards, where task leadership roles, comparable to that of the task manager in our experimental design, are rarely assigned randomly. If both members of the group indicate the same willingness level, the manager is chosen randomly. Given the vast literature on preferences for taking on leadership roles (Eagly and Karau, 2002; Ertac and Gurdal, 2012; Coffman, 2014; Coffman et al., 2021) and overriding others' decisions (Sinclair and Kunda, 2000; Guo and Recalde, 2022), we expect that men and overconfident group members would be more willing to become the task manager. We can thus add a second hypothesis regarding the group dynamics.
Hypothesis 2. Overconfident and male group members are more likely to take charge of the group tasks in the Ability treatment.
In summary, the experimental design allows us to compare investment situations in the Objective and Ability treatments. The probabilities are equal for neutrally calibrated subjects who think that they are neither better nor worse than the general population. However, given the “better-than-others” (overplacement) property of overconfidence, the perceived probabilities in the Objective and Ability treatments might differ. We can thus add another within-subject hypothesis. While we anticipate overinvestment in groups with more overconfident and male group members in both Objective and Ability treatments, we expect the Ability treatment to show the effect more strongly (Menkhoff et al., 2013). This follows, firstly, from the differences in the investment situations: While the Objective situations reveal the overstatement and overprecision components of overconfidence, the Ability situations also trigger the overplacement component. Secondly, this also follows from the effects stated in Hypothesis 2.
Hypothesis 3. The above-optimum investment is more pronounced in the Ability treatment than in the Objective treatment.
3.3. Explorative: Spillover channels for overinvestment levels: Priming and communication
We examine two additional channels for how individual overconfidence might affect group decisions. Firstly, by changing the order of the Objective and Ability investment decision blocks (Order treatment), we consider the spillover effects of the subjects' mindsets associated with the respective investment types. For example, if the subjects start with the Ability investment situations, they might continue with the perceived ability to beat the odds also in the Objective investment situations and overinvest more than otherwise, and vice versa. Spillovers are thus defined as a type of carry-over effects or inertia in this context.
Secondly, and as a robustness check, we add a treatment with pre-decision communication in a free-text chat format (Communication treatment) to consider the “behavioral signature” of the overconfident group members. For example, previous studies have shown that overconfident persons exhibit characteristics that appear like competence to others (Anderson et al., 2012). We thus give subjects a chance to exhibit such influence in a chat environment. Each group could communicate for 45 s before each decision (the task manager was determined before the first communication round). These treatments allow us to add Hypothesis 4A about the described priming effects. In addition, if communication allows the overconfident group members to reveal their “behavioral signature” and exert more influence on the group decision-making process, we can expect the group investment levels to be higher after pre-decision communication and add Hypothesis 4B.
Hypothesis 4A. Due to the priming effects from the “beat the odds” mindset, the average investment levels are higher if the group members first face Ability situations.
Hypothesis 4B. Due to the increased influence of the overconfident group members, the effects on the average investment levels are amplified by pre-decision communication.
Figure 1 provides a summary of the experimental design with the counter-balanced between-subjects treatments Order and Communication underlined: Order treatment, subjects begin with either the Objective or the Ability block; Communication treatment, subjects either do or do not have a pre-decision communication stage before each group decision. None of the outcomes of the tasks were revealed to the subjects until the end of the experiment. To avoid spillovers between sessions, none of the answers to the knowledge questions were explicitly revealed either.
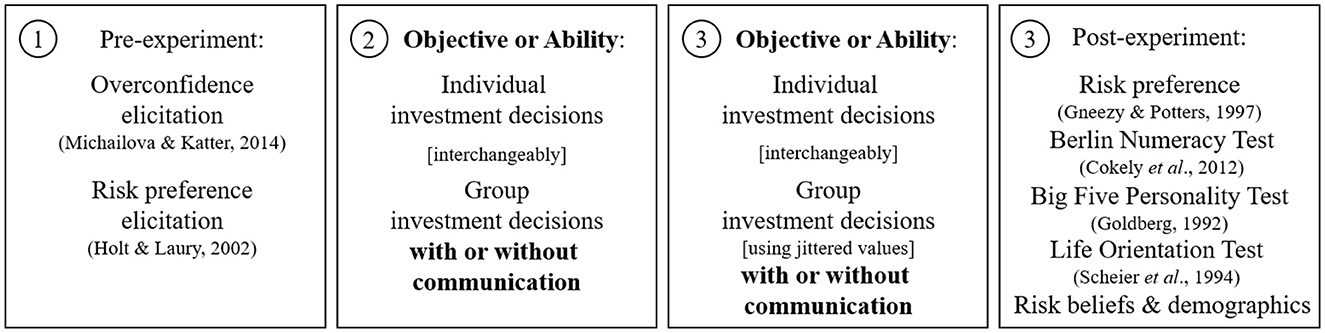
Figure 1. Summary of the experimental design in four stages, with the between-subject treatments (Order and Communication) in bold font. In total, half of the investment decisions are with Objective probabilities (5 decision situations) and the other half with Ability-based probabilities (5 decision situations, counter-balanced between sessions). Of these halves, respectively, each investment decision is made twice, first individually (5) and then in a two-member group (5) using the unanimity rule. We thus report all implemented experimental conditions and disclose all measured variables.
3.4. Procedure
We used the z-Tree software (Fischbacher, 2007) and the ORSEE recruitment platform (Greiner, 2015) for the experiment with student subjects. We gathered a balanced dataset on n=160 subjects over seven experiment sessions in May to November 2017, in order to result in 80 dyads per Objective and Ability situation type and an equal split of 40 subjects per treatment.5 42.5% of the subjects were male, with an average age of 21.7 ± SD 2.5 years and an average payment of 16.5 ± SD 4.2 EUR for an approximately 90-minute in-person laboratory session. Unless indicated otherwise, we use pooled data on all 160 subjects for our analyses.
4. Main results
4.1. Confidence bias score
Figure 2 depicts the distribution of the overconfidence bias scores: A positive bias score represents overconfidence, and a negative bias score represents underconfidence. The mean and median scores among our subjects are larger than zero and in line with the previous literature: Most of the subjects are overconfident. In our sample, we find no significant differences between the bias score of male and female subjects (Wilcoxon-Mann-Whitney rank sum test, p = 0.258, Spearman rank-order correlation of −0.089, p = 0.259) and, therefore, can examine the effects of overconfidence and gender both in parallel and jointly. We divide the subjects at zero to create two categories: overconfident subjects (OC) and underconfident subjects (UC). Online Appendix B shows a correlation table of the main variables of interest and further robustness results for the bias score.
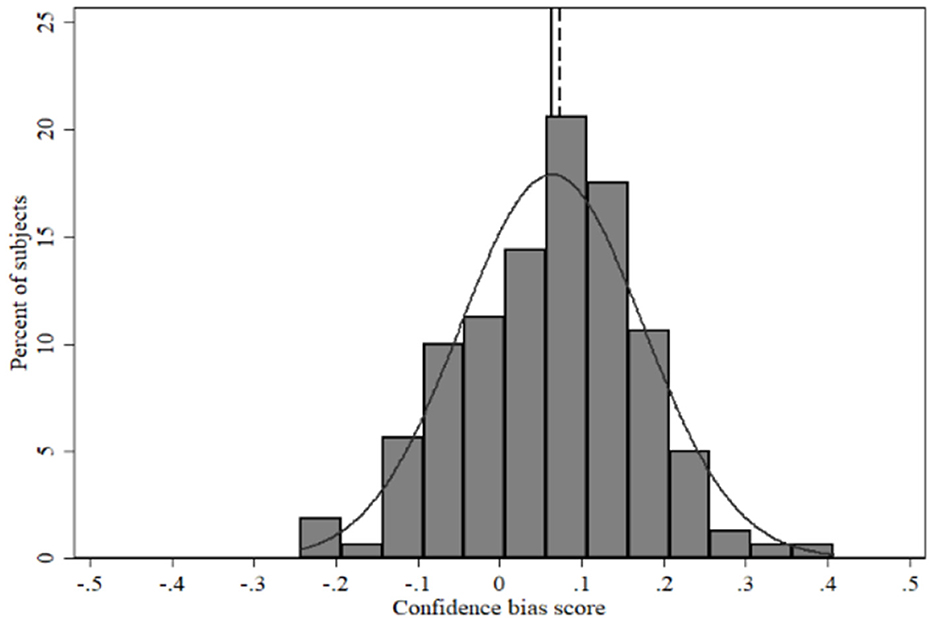
Figure 2. Distribution of the individual confidence bias scores. The solid and dashed lines denote the mean and median score, respectively, and the dotted line shows a normal distribution.
4.2. Group confidence, gender composition and group investments
We use the bias score measure of overconfidence to investigate how overconfidence shapes group decision making, juxtaposing these effects with gender effects.6 We find an upward trend in both individual and group decisions: The investment levels are related to individual characteristics, as depicted in Figures 3A, B, and amplified by the group compositions with respect to overconfidence and gender, as depicted on the left-hand side and right-hand side of Figures 4A, B, respectively. This group effect appears to be stronger for gender than for overconfidence in the Ability investment situations (Figure 4B), while the effect is of similar magnitude in the Objective situations (Figure 4A). Considered jointly, groups with more overconfident members and more male members make higher investments in the Ability situations but not in the Objective situations.
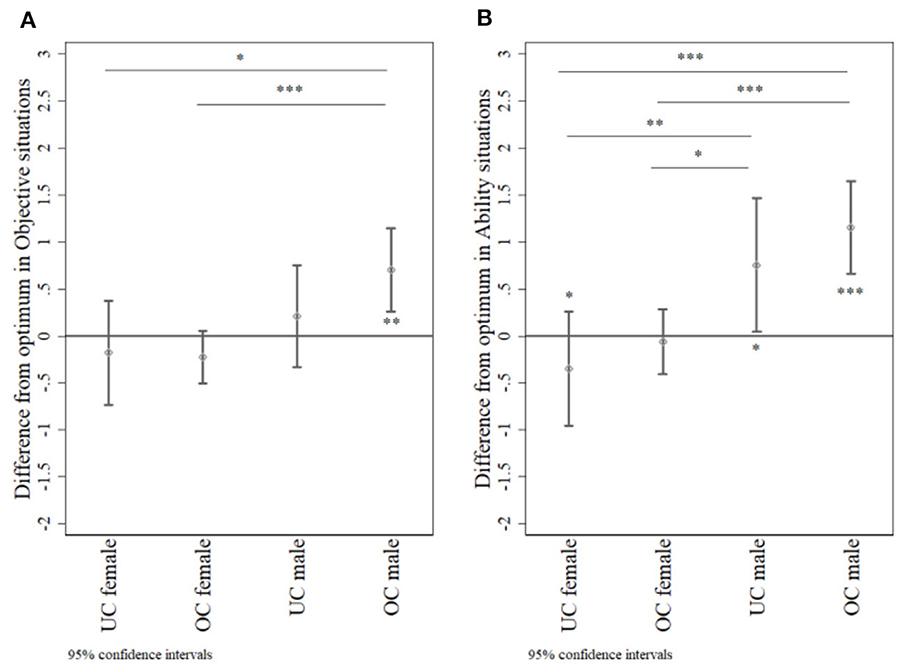
Figure 3. Individual investment difference from the risk-neutral optimum in the Objective (left) and Ability (right) treatments, by gender and overconfidence bias score and compared to zero (solid line). (A) Individual investment levels in objective situations. (B) Individual investment levels in ability situations. The asterisks indicate Wilcoxon-Mann-Whitney rank sum tests for differences between the investment levels and Wilcoxon signed rank tests for differences from zero. ***p < 0.001, **p < 0.01, *p < 0.05.
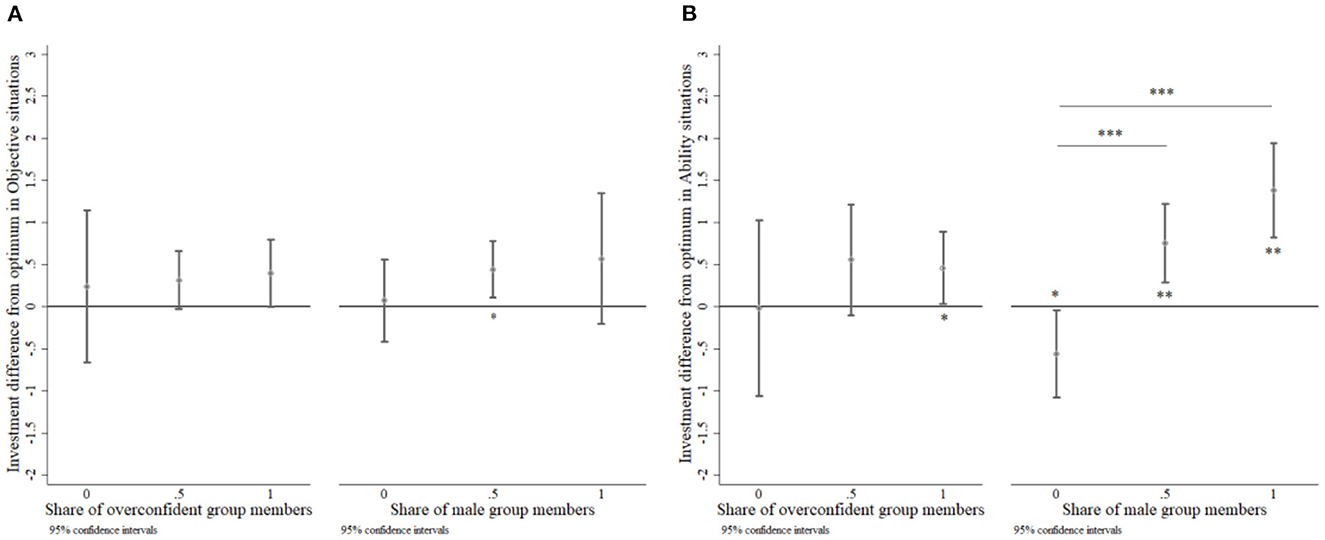
Figure 4. Group investment difference from the risk-neutral optimum in the Objective (3A left) and Ability (3B right) treatments, by group overconfidence bias score and group composition with respect to gender, firstly, separately and, secondly, compared to zero (solid line). (A) Group investment levels in Objective situations. (B) Group investment levels in Ability situations. Sub-samples with 7 UC+UC, 31 UC+OC, 42 OC+OC groups and 24 F+F, 44 F+M, 12 M+M groups. The asterisks indicate Wilcoxon-Mann-Whitney rank sum tests for differences between the investment levels and Wilcoxon signed rank tests for differences from zero. ***p < 0.001, **p < 0.01, *p < 0.05.
Table 2 shows the combined effects of group overconfidence and gender group compositions using regression models with the deviation from the risk-neutral optimum investment levels as the dependent variable and confirms the above results. We use the average continuous overconfidence bias score per group as the independent variable for group overconfidence and the share of men per group as the independent variable for group gender composition. We run linear ordinary least squares (OLS) regressions and correct for experiment data dependencies using robust clustered errors at the matching-group level. Due to the specific construction of the investment situations, all models in Table 2 control for risk preferences (Holt and Laury, 2002). The models in columns 4 and 8 also control for additional factors and show that there still remains a significant upward trend with respect to both group overconfidence and group gender composition in the Ability treatment (columns 5 to 8) and a much weaker trend in the Objective treatment (columns 1 to 4).
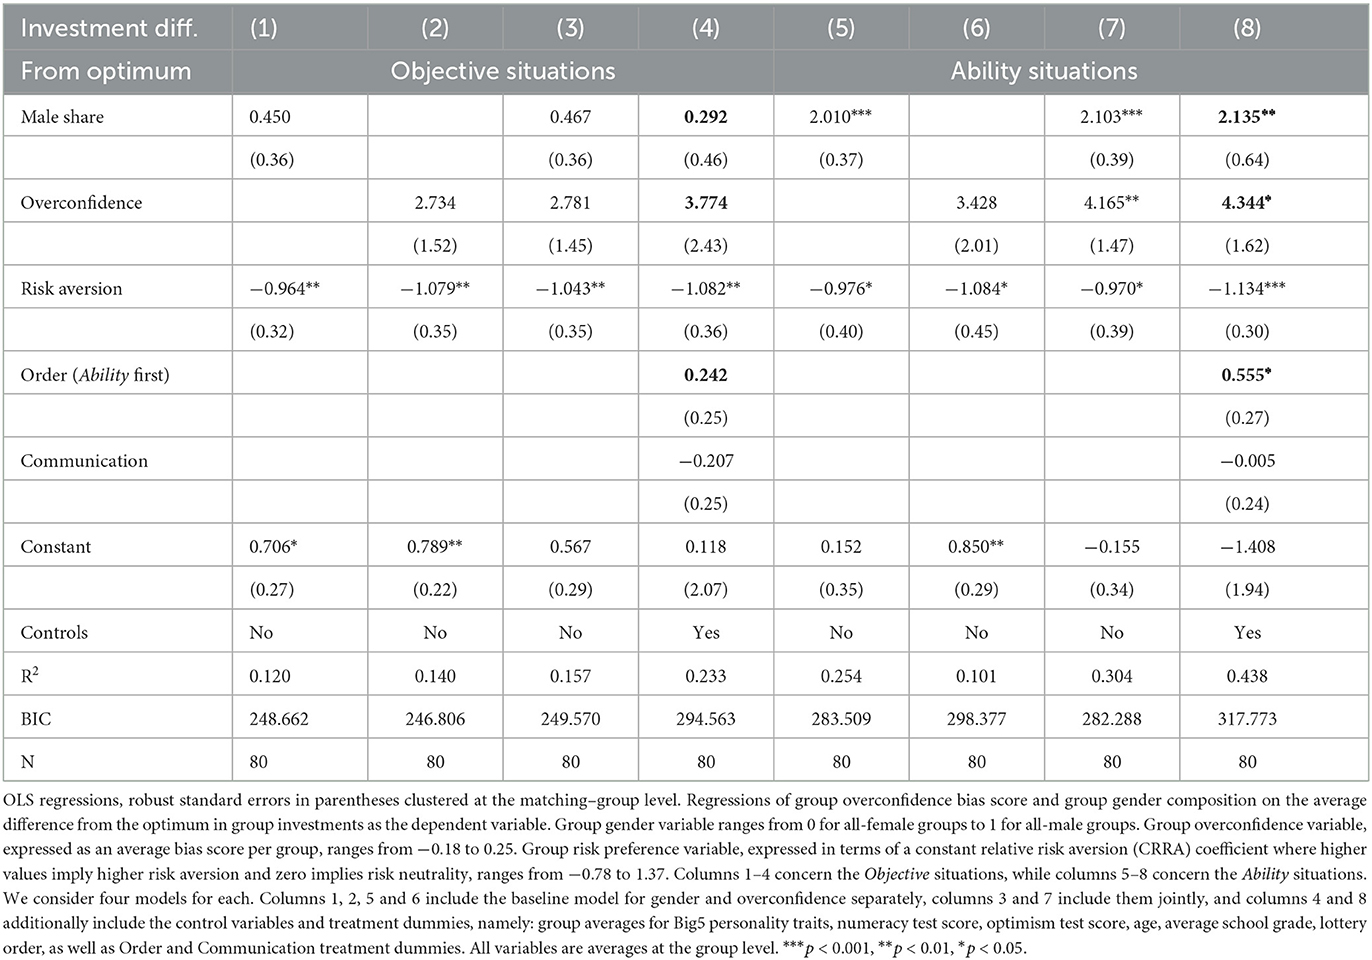
Table 2. Group investments: Regressions on the difference from the risk-neutral optimum.
We thus find some support for Hypothesis 1: The higher the group overconfidence and share of men in the group, the higher the average group investment levels. We also find support for Hypothesis 3 in that the Ability situations allow more pronounced overconfidence and gender effects than the Objective situations. Online Appendix C includes full regression models7; and for comparison, see equivalent results for individual investment decisions in Online Appendix D.
Comparing across different regression models, including models using all overconfidence measures beyond the bias score in Table 2, reveals that risk preferences play a lesser role in the Ability situations than in the Objective situations, as depicted in Figure 5. Hence, all main analyses use a risk-neutral expected value maximizing optimum as a benchmark for analyzing the levels of overinvesting, while controlling for risk preferences in the regression analysis separately.
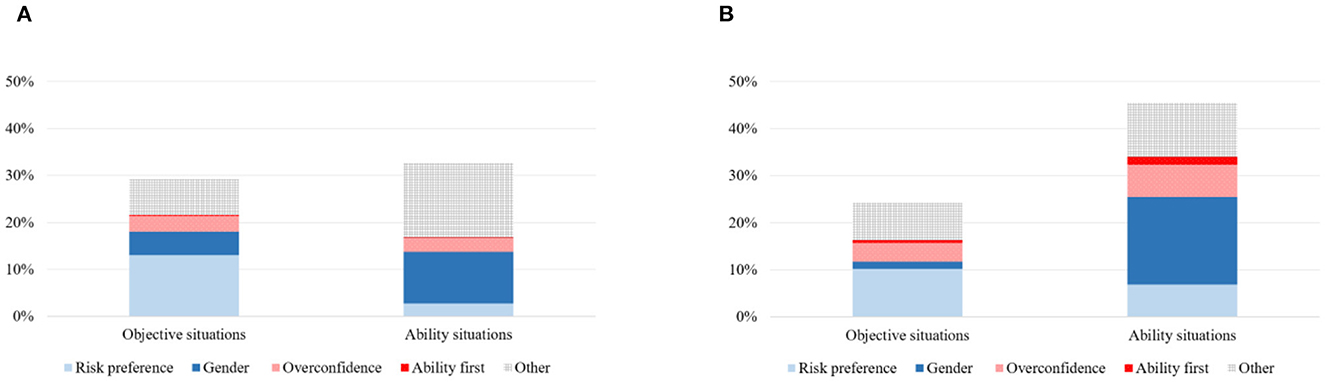
Figure 5. Breakdown of explained variance in regression analyses by explanatory variable type in individual decisions (a left) and group decision (b right), comparing Objective and Ability treatments. (A) Explained variance in individual investment decisions. (B) Explained variance in group investment situations.
Result 1. On average, both overconfidence and gender are associated with group overinvestment in Ability situations, but not in Objective situations. This holds also after controlling for risk preferences.
5. Further results
5.1. Moderators for the differences between objective and ability situations
5.1.1. Probability perception in Ability investment situations
One reason behind Result 1 could be related to the differences between how the probabilities in the Objective and Ability situations are viewed. Consider the following self-reports of perceived success chances that we gathered in the post-experiment questionnaire adapted from Dohmen et al. (2022). We asked the subjects two questions about their individual decisions: “In your opinion, how successful will your 50%-success-chance investment be in (i) the Objective situations and (ii) the Ability situations?” The answers were provided on an 11-point Likert scale, where the middle point is the theoretical prediction in both cases.
We find significant differences in the results between the two situations. In the Objective situations, as depicted in Figure 6A, both overconfident and underconfident subjects provide answers that do not significantly differ from the expected 50% answer. In contrast, in the Ability situations, as depicted in Figure 6B, all subjects except the underconfident female sub-sample provide answers that significantly differ (exceed) from the 50% answer (Wilcoxon signed rank tests, p < 0.033). On average, the perceived chances in the Ability situations answers are significantly higher than the perceived chances in the Objective situations (Wilcoxon-Mann-Whitney rank sum tests, all p < 0.001). We thus find further evidence in favor of Hypothesis 3.
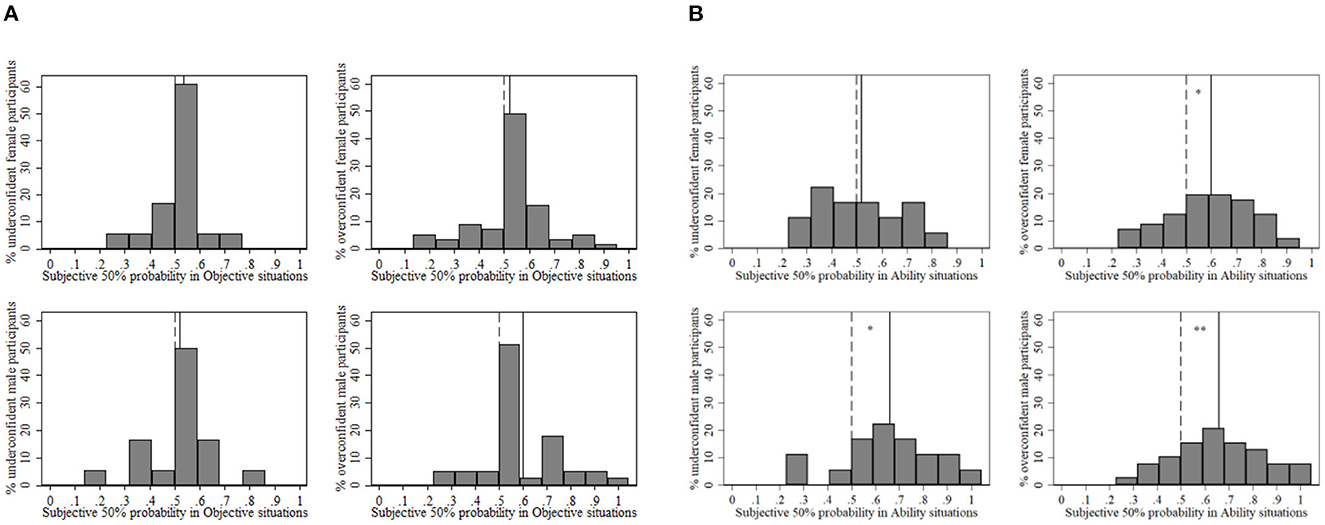
Figure 6. Subjective perceived success chances in the Objective (4a left) and Ability (4b right) treatments for a 50–50 lottery, divided by gender (female top, men bottom) and overconfidence (underconfident left, overconfident right). (A) Subjective 50% probability perception in Objective situations. (B) Subjective 50% probability perception in Ability situations. The solid lines denote the mean perceived success chances, the dashed line denotes the theoretical prediction. The asterisks indicate Wilcoxon signed rank tests for differences from the theoretical prediction. ***p < 0.001, **p < 0.01, *p < 0.05.
Result 2. The Ability investment situations lead to more upwards-biased perceived probabilities of success than the Objective situations.
5.1.2. Task responsibility in group Ability investment situations
Another reason behind Result 1 could be related to the differences in group dynamics between Objective and Ability investment decisions. In Ability situations, one of the two group members steps forward to take charge of the tasks associated with the chosen group investment levels (i.e., provide answers to the question tasks). The task manager for each two-person group is chosen in a preference-consistent way, in accordance with ranked self-reports of the willingness to assume responsibility for group tasks. After each group member privately reports their willingness on a four-point scale, one of the two group members is assigned the role of the manager if she indicates higher willingness or, in case of both group members indicating the same willingness, on a random basis. In the following, we consolidate the four-point scale into a binary variable to indicate willingness (or high willingness) as opposed to unwillingness (or high unwillingness) to assume responsibility for the group tasks.
Figure 7 compares the various factors that influence the willingness to become a task manager using probit regressions with clustered standard errors at the matching group level. Our analysis shows that the willingness to assume responsibility for the group tasks is not strongly related to individual overconfidence, but it is significantly related to gender (Figure 7A). On average, the subjects who indicate willingness to become the task manager are more likely to be male and more competent, including in terms of the bias score question correctness, which can be used as an ex-ante measure of expected performance in the Ability tasks. We further find gender differences in what characteristics affect the willingness to become a manager (Figures 7B, C). In particular, the more competent female subjects drive the link between competence and assuming task responsibility. For these female subjects, the ex-ante bias score performance is on par with and not significantly different from male subjects (Wilcoxon-Mann-Whitney rank sum tests between the unwilling female subjects and the other three sub-samples, p < 0.001).
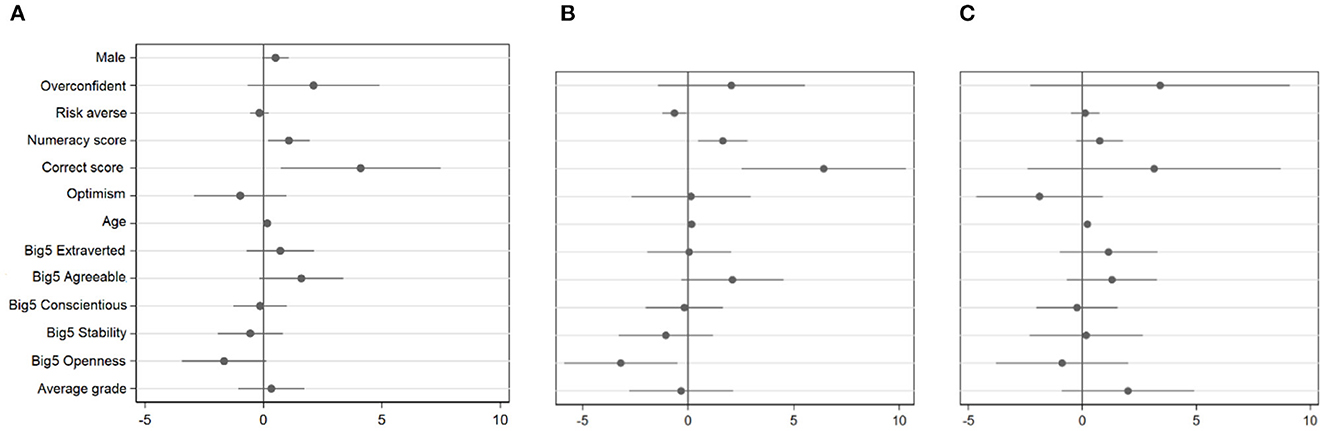
Figure 7. Willingness to take charge of group tasks, with 1 corresponding to high willingness and 0 to low willingness: Regression coefficient plot for from probit models; see respective marginal effects in Online Appendix E. (A) Willingness to take charge—all subjects. (B) Female subjects. (C) Male subjects. Regressions of individual confidence and competence on the willingness to assume responsibility for the group tasks, including all subjects, the female sub-sample, and the male sub-sample. The bias score task correctness (Correct score) is used as an ex-ante measure of expected performance in the Ability tasks (denoted as ex-ante ability). Additional controls include the Big5 personality traits and average school grade. Probit regressions with a binary dependent variable, robust standard errors in parentheses clustered at the matching group level.
We have thus found some evidence in support of Hypothesis 2, in that the male group members are more likely to step forward and take charge of the group tasks than the female group members. The factors seem to differ between genders: competence and risk aversion matter for women, but not for men. These effects could partly explain the higher group investment levels in Ability situations as compared to Objective situations. Yet, they cannot explain the similar levels of individual overinvestment in Ability situations (as shown in Figures 3, 4 above).
Result 3. Male subjects are more willing to take charge of the group than female subjects.
Meanwhile, it is important to note that the above-mentioned characteristics are not as strongly related to the subjects actually becoming task managers. This is likely due to the procedure to choose a task manager (as outlined above, this role allocation is random if both group members indicate the same willingness on a four-point scale). While there is a slight tendency for group managers (in group-decision tasks) to perform better than all individuals on average (in individual-decision tasks) and individual men to perform better than individual women, we identify no significant differences in any of these comparisons (in individual-decision tasks).
Comparing the study subjects to the general population, however, there is evidence that, on average, subjects perform significantly worse individually than the general population (Wilcoxon signed rank test, p < 0.001, also for male and female subjects separately), while group managers perform similarly to the general population (Wilcoxon signed rank test, p < 0.063), hinting toward self-selection into assuming responsibility (see Online Appendix E for further details and regression analysis).
5.1.3. Explorative: Priming and probability perception spillovers on Ability investment situations
A third reason behind Result 1 could be related to the priming that occurs through facing Objective investment decisions first in the session compared to facing Ability first. As outlined in Explorative: Spillover channels for overinvestment levels: Priming and communication sub-section, we check for differences in response to (i) the main variation which alternates whether the subjects start with the Ability or the Objective investment situations (Order treatment) and to (ii) pre-decision communication in a chat format (Communication treatment). As illustrated in Figure 8, we find that investment levels throughout the session are on average higher whenever the Ability treatment is the first one in a session. There is a strong upward shift in group Ability investments, as depicted also in the regressions with control variables in the Table 2. We thus find some support for Hypothesis 4A and conclude that we can identify spillover effects of the respective Objective or Ability mindset on the subsequent decisions.
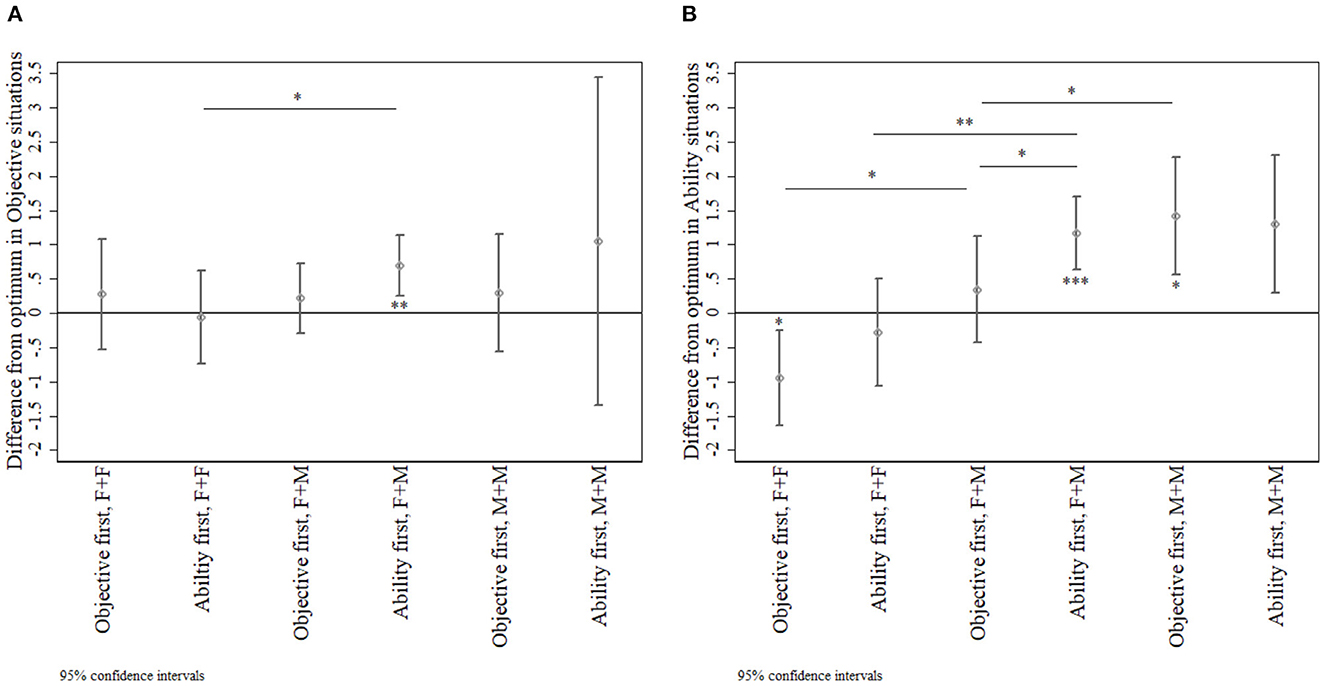
Figure 8. Group investment difference from optimum in the Objective (left) and Ability (right) treatments, divided by the Order treatment and group gender composition. (A) Group investment levels in Objective situations. (B) Group investment levels in the Ability situations. The asterisks indicate Wilcoxon-Mann-Whitney rank sum tests for differences between the investment levels and Wilcoxon signed rank tests for differences from zero. ***p < 0.001, **p < 0.01, *p < 0.05. For brevity, in the right sub-figure, only the significance for comparisons between a given column and at most two columns further right (e.g., “Objective first, F+F” vs “Objective first, F+M”) are depicted; the differences between further columns are significant at least at a 5% level, where “F+F” indicates groups with two female participants.
For the purposes of this comparison, we pull the Communication and NoCommunication data together. As we show in Online Appendix F, the Communication intervention alone does not lead to significant differences in the investment levels (Hypothesis 4B). Yet, we find some differences in how the communication stage is used. The overconfident subjects are the first ones to talk significantly more often than the underconfident subjects in the pre-decision communication stages of the mixed UC+OC groups in the Ability situations (Wilcoxon-Mann-Whitney rank sum test, p < 0.001), while the underconfident subjects initiate the conversation more often in the Objective situations (p < 0.001). We can thus conclude that, depending on the situations, overconfident and underconfident subjects do indeed tend to have different “behavioral signatures”.
Result 4. Facing first the Ability investment situations creates spillovers that result in higher investment levels in the subsequent decisions.
6. Discussion and conclusions
We investigate situations in which the probability of winning is based on a random draw and situations in which the probability is based on ability. We show that the way in which success chances of an investment opportunity are perceived can play a significant role in individual and group decisions. Although the Objective and Ability investment situations are by construction equivalent, the decision makers tend to treat them quite differently—both in terms of how overconfidence and gender manifests itself in the chosen investment levels and in how much overinvestment occurs (as outlined in Results 1 to 3). But the differences are not in the investment behavior alone. We find that the decision makers judge these situations differently and communicate about these situations differently. On average, both men and women and both overconfident and underconfident decision makers tend to invest more “overconfidently” if first primed with the Ability investment situations (as outlined in Result 4).
Given that many important economic decisions are made by groups, not just individuals, our experimental results provide potential implications for team, committee or board composition policies with respect to gender and overconfidence. One policy recommendation implies attempting to further increase the diversity in management teams, executive committees and boards, echoing the empirical results by Levi et al. (2014) and Chen et al. (2019), among others. Indeed, as once expressed by Christine Lagarde, the former Head of the International Monetary Fund and the current President of the European Central Bank: “If Lehman Brothers had been “Lehman Sisters,” today's economic crisis clearly would look quite different” (The New York Times, 2010).
Our results on the willingness to take charge of the group task also demonstrate gender differences. In general, men are more likely to take charge, which echoes the empirical findings on women shying away from leadership roles (e.g., Born et al., 2022). The mentioned reasons in former studies include, for example, ability differences, sensitivity to negative feedback, family-career balance and discrimination (Ertac and Gurdal, 2012; Berlin and Dargnies, 2016; Kirsch, 2018; Shastry et al., 2020). Among women, the willingness to take charge increases with competency and risk seeking (which relates to the self-selection into skill-based session by Danková and Servátka, 2019). These results in combination with the result above emphasize the potential hazard of bias spillovers both between the decisions and within the groups themselves. One implication for better group decisions thus includes attempting to frame group investment decisions with objective odds of success as much as possible—to downplay the perception of being able to beat the odds.8
Our main comparison is between investment levels in Ability and Objective situations using a within-subject design. Previous work (e.g., Gillen et al., 2019; Van Veldhuizen, 2022) have shown that measurement errors in one of the explanatory variables (e.g., risk preferences) can shift the observed effect of the outcome variable (e.g., competitiveness) in a biased way. Importantly, even though only the Ability treatment allows to look at the beating-the-odds feature, both situations have in theory the same risky investment situations, which allows to control for individual risk preferences by design. Further studies could look more into the question of how to additionally distinguish (i) whether the overconfident group members see themselves as overly able to choose the optimal investment in terms of its objective success odds, i.e., the intrapersonal overstatement and overprecision components of overconfidence [with its directional effect implied by correlates of overconfidence such as the illusion of control, see Langer (1975) among others] or (ii) whether they just see themselves as able to “beat the odds” of the investment, i.e., the interpersonal overplacement.
Meanwhile, this study provides only partial insight into how individual overconfidence and gender can influence group decisions, and there remain many directions to add to this line of research. Indeed, the potential effects of the design choices in this study and the corresponding limitations in terms of external validity have not yet been explored in detail. For example, decision making under time constraints is more characteristic in military, emergency health care and financial day-trading contexts than, say, in supervisory contexts. The design of this study could thus be expanded in several ways, for example, by varying the time constraints, group size or the voting rule for the group decisions, or by varying the manager selection procedure or task success-chance reference population (from general population to specific populations). Further extensions could also include different categories of tasks (e.g., requiring less crystalized and more lucid intelligence) that the subjects need to solve in the performance-dependent situations. Finally, we acknowledge that the current experiment setting includes treatment sub-groups of relatively modest sizes, and we strongly encourage future studies to invest the necessary resources for recruiting larger participant pools. Last, the primary research question could also benefit from empirical data (e.g., experiments at firms) that sheds light on our research question in male-dominated corporate environments.
Data availability statement
The raw data supporting the conclusions of this article will be made available by the authors, without undue reservation.
Ethics statement
The studies involving human participants were reviewed and approved by Ethics Committee of the University of Konstanz. The participants provided their written informed consent to participate in this study.
Author contributions
JH and TT conceived of the initial presented idea. BR and JH conceived and planned the experiments. BR programmed and carried out the experiments and performed the analysis. BR and JH wrote the manuscript in consultation with TT. All authors contributed to the article and approved the submitted version.
Funding
We are grateful to the Graduate School of Decision Sciences at the University of Konstanz and the German Research Foundation (Deutsche Forschungsgemeinschaft, DFG) for financing the experiment. We also gratefully acknowledge support from the DFG through the research unit FOR 1882 Psychoeconomics.
Acknowledgments
The authors would like to thank the research group at the Thurgau Institute of Economics (TWI) and the Department of Economics at the University of Konstanz for helpful comments along the way. We also thank the participants at the European Economic Association Meeting, the Thurgau Experimental Economics Meeting, as well as the Behavioral Decision-Making Workshop and the Organization Economics Workshop for fruitful discussions.
Conflict of interest
The authors declare that the research was conducted in the absence of any commercial or financial relationships that could be construed as a potential conflict of interest.
Publisher's note
All claims expressed in this article are solely those of the authors and do not necessarily represent those of their affiliated organizations, or those of the publisher, the editors and the reviewers. Any product that may be evaluated in this article, or claim that may be made by its manufacturer, is not guaranteed or endorsed by the publisher.
Supplementary material
The Supplementary Material for this article can be found online at: https://www.frontiersin.org/articles/10.3389/frbhe.2023.1111317/full#supplementary-material
Footnotes
1. ^In contrast, see also Adams and Ferreira (2009) who show that, under certain conditions, gender quotas for directors can actually reduce firm value and Ivanova-Stenzel and Kübler (2011) who demonstrate a potential conflict between maximizing overall performance and minimizing gender inequality.
2. ^For example, risk preferences (Charness and Gneezy, 2010; Hardies et al., 2013; Booth et al., 2014; Hügelschäfer and Achtziger, 2014), leadership preferences (Melkas and Anker, 1997; Eagly and Karau, 2002; Ertac and Gurdal, 2012; Grossman et al., 2019) and competitiveness (Niederle and Vesterlund, 2007; Gneezy et al., 2009; Reuben et al., 2012; Datta et al., 2013) often differ between men and women (see Gneezy and Croson, 2009 for an overview of gender differences in preferences). Although gender and overconfidence tend to be related (Lichtenstein and Fischhoff, 1977; Barber and Odean, 2001; Soll and Klayman, 2004; Bengtsson et al., 2005; Danková and Servátka, 2019), investment decision making can call for gender differences that go beyond overconfidence.
3. ^This particular measure of overconfidence was mainly chosen because the tasks are in essence similar to the tasks in the Ability decision situations. We could thus later instruct the subjects that the Ability task questions would be “similar in format to those they already saw in previous part of the experiment”. We follow the methodology proposed by Michailova and Katter (2014) and applied, e.g., by Michailova and Schmidt (2016) who also incentivize correctness, but not confidence. The authors mention two arguments against incentivized scoring such as the quadratic soring rule: (i) the assumption of risk neutrality (Offerman et al., 2009) and bias toward 50% probability in the presence of risk aversion (e.g., Winkler and Murphy, 1970) and (ii) the difficulty of understanding the mechanism for the subjects (Artinger et al., 2010). Concerning the first argument, we acknowledge that other methods for incentivizing belief elicitation (e.g., Schotter and Trevino, 2014; Schlag et al., 2015; Schlag and Tremewan, 2021) would not suffer from these mentioned drawbacks. However, we opted for eliciting the beliefs as easily understandable as possible and thus opted for non-incentivized beliefs, at the expense of potential measurement validity concerns. In general, both incentivizing and not-incentivizing the beliefs have their benefits and drawbacks (e.g., Read, 2005).
4. ^QuizDuell is a widely known erudition show in Germany. According to a press release, the QuizDuell mobile application was downloaded at least 1.6 million times, with 1.3 million registered users, 54% of them male. On average, 150,000 users were active in each TV show episode (Presseportal, 2015). While we do not make any claims about representativeness of this sample, we see it fit to instruct the participants of our experiment that the success chances stem from “a large sample of general population”, which is the only provided information about the success chances. The subjects are also told that the questions are “similar in format to those they already saw in previous part of the experiment” (overconfidence calibration test). The questions cover a wide range of topics, from food and drinks to technology and money. As an example, one of the questions reads as follows: “What kind of Italian pasta is literally translated as “butterflies”?” Possible answers: Cannelloni, Penne, Fusilli and Farfalle. The correct answer “Farfalle” was chosen by 84.4 of the QuizDuell participants. We compare the performance of our sample to the performance of this non-representative general population sample in Online Appendix E. This insight in combination with counterbalancing of the within-subject treatments help us rule out concerns about experimenter demand effects as a crucial driver of the results.
5. ^This sample size is similar to Hügelschäfer and Achtziger (2014), who use a 2 × 2 design to study the effect of different mindsets of judgment and decision making. One of their tasks also measures confidence in one's own performance.
6. ^The data includes choices in which no agreement was reached within 90 seconds (< 2% of all decisions). In that case, the “status quo” was the automatically chosen decision. The average time until unanimity ranged from 66 to 76 seconds in the Objective treatment and from 63 to 78 seconds in the Ability treatment.
7. ^Note that Appendix C also includes regression analyses using the single-questions overconfidence robustness measures (overstatement and overplacement) instead of the 18-question bias score, in which we find significant gender effects, but non-significant overconfidence effects.
8. ^One can even go a bit further: in the Ability treatment, we found that task competence was correlated with volunteering to answer the question (for women). If the link between task performance and leading is non-existent or of minor importance, for example if perceived performance or being faster to volunteer are mainly determining who leads, then we would expect the effect of overconfidence and gender to be even stronger. On the other hand, if the selection of who carries out the task is fully or mostly based on actual performance, we would expect that overconfidence affects group decisions less, since the more unjustly overconfident group members are then less likely to lead.
References
Adams, R. B., and Ferreira, D. (2009). Women in the boardroom and their impact on governance and performance. J. Finan. Econom. 94, 291–309.
Anderson, C., Brion, S., Moore, D. A., and Kennedy, J. A. (2012). A status-enhancement account of overconfidence. J. Pers. Soc. Psychol. 103, 718. doi: 10.1037/a0029395
Apesteguia, J., Azmat, G., and Iriberri, N. (2011). The impact of gender composition on team performance and decision making: evidence from the field. Manage. Sci. 58, 78–93. doi: 10.1287/mnsc.1110.1348
Artinger, F., Exadaktylos, F., Koppel, H., and Sääksvuori, L. (2010). Applying Quadratic Scoring Rule Transparently in Multiple Choice Settings: A Note' (No. 2010, 021). Jena Economic Research Papers.
Barber, B., and Odean, T. (2001). Boys will be boys: gender, overconfidence, and common stock investment. Q. J. Econ. 116, 261–292. doi: 10.1162/003355301556400
Bénabou, R. (2013). Groupthink: collective delusions in organizations and markets. Rev. Econ. Stud. 80, 429–62. doi: 10.1093/restud/rds030
Bénabou, R. (2015). The economics of motivated beliefs. Revue D'économie Politique. 125, 665–685. doi: 10.3917/redp.255.0665
Bengtsson, C., Persson, M., and Willenhag, P. (2005). Gender and overconfidence. Econ. Lett. 86, 199–203. doi: 10.1016/j.econlet.2004.07.012
Benoit, J-. P., Dubra, J., and Romagnoli, G. (2020). Belief elicitation when more than money matters. Am. Econ. J. Microecon. 14, 837–888. doi: 10.2139/ssrn.3437038
Berlin, N., and Dargnies, M. P. (2016). Gender differences in reactions to feedback and willingness to compete. J. Econ. Behav. Organ. 130, 320–336. doi: 10.1016/j.jebo.2016.08.002
Biais, B., Hilton, D., Mazurier, K., and Pouget, S. (2005). Judgemental overconfidence, self-monitoring, and trading performance in an experimental financial market. Rev. Econ. Stud. 72, 287–312. doi: 10.1111/j.1467-937X.2005.00333.x
Billett, M., and Qian, Y. (2008). Are overconfident CEOs born or made? Evidence of self-attribution bias from frequent acquirers. Manage. Sci. 54, 1037–1051. doi: 10.1287/mnsc.1070.0830
Blavatskyy, P. R. (2009). Betting on own knowledge: experimental test of overconfidence. J. Risk Uncertain. 38, 39–49. doi: 10.1007/s11166-008-9048-7
Booth, A., Cardona-Sosa, L., and Nolen, P. (2014). Gender differences in risk aversion: Do single-sex environments affect their development?. J. Econom. Behav. Organ. 99, 126–154.
Born, A., Ranehill, E., and Sandberg, A. (2022). Gender and willingness to lead: does the gender composition of teams matter?. Rev. Econ. Stat. 104, 259–275. doi: 10.1162/rest_a_00955
Bracha, A., Cohen, A., and Conell-Price, L. (2019). The heterogeneous effect of affirmative action on performance. J. Econ. Behav. Organ. 158, 173–218. doi: 10.1016/j.jebo.2018.11.019
Camerer, C., and Lovallo, D. (1999). Overconfidence and excess entry: an experimental approach. Am. Econ. Rev. 89, 306–318. doi: 10.1257/aer.89.1.306
Campbell, K., and Mínguez-Vera, A. (2008). Gender diversity in the boardroom and firm financial performance. J. Bus. Ethics. 83, 435–451. doi: 10.1007/s10551-007-9630-y
Charness, G., and Gneezy, U. (2010). Portfolio choice and risk attitudes: An experiment. Econom. Inquiry. 48, 133–146.
Charness, G., and Rustichini, A. (2011). Gender differences in cooperation with group membership. Games Econ. Behav. 72, 77–85. doi: 10.1016/j.geb.2010.07.006
Chen, J., and Houser, D. (2019). When are women willing to lead? The effect of team gender composition and gendered tasks. Leadership Quarterly. 30, 101340. doi: 10.1016/j.leaqua.2019.101340
Chen, J., Leung, W. S., Song, W., Goergen, M., et al. (2019). Why female board representation matters: The role of female directors in reducing male CEO overconfidence. J. Empirical Finance. 53, 70–90. doi: 10.1016/j.jempfin.2019.06.002
Cheng, J. T., Anderson, C., Tenney, E. R., Brion, S., Moore, D. A., and Logg, J. M. (2020). The social transmission of overconfidence. J. Exp. Psychol. 150, 157. doi: 10.1037/xge0000787
Coffman, K., Flikkema, C. B., and Shurchkov, O. (2021). Gender stereotypes in deliberation and team decisions. Games Econ. Behav. 129, 329–349. doi: 10.1016/j.geb.2021.06.004
Coffman, K. B. (2014). Evidence on self-stereotyping and the contribution of ideas. Q. J. Econ. 129, 1625–1660. doi: 10.1093/qje/qju023
Danková, K., and Servátka, M. (2019). Gender robustness of overconfidence and excess entry. J. Econ. Psychol. 72, 179–199. doi: 10.1016/j.joep.2019.03.006
Datta, G. N., Poulsen, A., and Villeval, M. C. (2013). Gender matching and competitiveness: Experimental evidence. Econom. Inquiry. 51, 816–835.
Deaves, R., Lueders, E., and Luo, G. (2009). An experimental test of the impact of overconfidence and gender on trading activity. Rev. Finance. 13, 555–575. doi: 10.1093/rof/rfn023
Dittrich, D., Güth, W., and Maciejovsky, B. (2005). Overconfidence in investment decisions: an experimental approach. Eur. J. Finance. 11, 471–491. doi: 10.1080/1351847042000255643
Dohmen, T., Quercia, S., and Willrodt, J. (2022). On the Psychology of the Relation between Optimism and Risk Taking. IZA Discussion Paper No. 15763.
Eagly, A. H., and Karau, S. J. (2002). Role congruity theory of prejudice toward female leaders. Psychol. Rev. 109, 573. doi: 10.1037/0033-295X.109.3.573
Eckel, C. C., and Füllbrunn, S. C. (2015). Thar she blows? Gender, competition, and bubbles in experimental asset markets. Am. Econ. Rev. 105, 906–920. doi: 10.1257/aer.20130683
Eckel, C. C., and Füllbrunn, S. C. (2017). Hidden vs. known gender effects in experimental asset markets. Econ. Lett. 156, 7–9. doi: 10.1016/j.econlet.2017.04.009
Ertac, S., and Gurdal, M. Y. (2012). Deciding to decide: Gender, leadership and risk-taking in groups. J. Econ. Behav. Organ. 83, 24–30. doi: 10.1016/j.jebo.2011.06.009
Fama, E., and Jensen, M. (1983). Separation of ownership and control. J. Law Econ. 26, 301–325. doi: 10.1086/467037
Fischbacher, U. (2007). Z-Tree: Zurich toolbox for ready-made economic experiments. Exp. Econ. 10, 171–178. doi: 10.1007/s10683-006-9159-4
Friehe, T., and Pannenberg, M. (2019). Overconfidence over the lifespan: evidence from Germany. J. Econ. Psychol. 74, 102207. doi: 10.1016/j.joep.2019.102207
Gillen, B., Snowberg, E., and Yariv, L. (2019). Experimenting with measurement error: techniques with applications to the caltech cohort study. J. Polit. Econ. 127, 1826–1863. doi: 10.1086/701681
Gneezy, U., and Croson, R. (2009). Gender differences in preferences. J. Econ. Literature. 47, 448–474. doi: 10.1257/jel.47.2.448
Gneezy, U., Leonard, K. L., and List, J. A. (2009). Gender differences in competition: Evidence from a matrilineal and a patriarchal society. Econometrica. 77, 1637–1664.
Greiner, B. (2015). Subject pool recruitment procedures: organizing experiments with ORSEE. J. Econ. Sci. Assoc. 1, 114–125. doi: 10.1007/s40881-015-0004-4
Grossman, P. J., Eckel, C., Komai, M., and Zhan, W. (2019). It pays to be a man: Rewards for leaders in a coordination game. J. Econom. Behav. Organ. 161, 197–215.
Guo, J., and Recalde, M. P. (2022). Overriding in teams: The role of beliefs, social image, and gender. Manage. Sci. doi: 10.1287/mnsc.2022.4434
Hannagan, R. J., and Larimer, C. W. (2010). Does gender composition affect group decision outcomes? Evidence from a laboratory experiment. Political Behavior. 32, 51–67. doi: 10.1007/s11109-009-9087-z
Hardies, K., Breesch, D., and Branson, J. (2013). Gender differences in overconfidence and risk taking: Do self-selection and socialization matter?. Econom. Lett. 118, 442–444.
Healy, A. J., and Pate, J. G. (2011). Overconfidence, social groups, and gender: evidence from the lab and field. SSRN Electron. J. doi: 10.2139/ssrn.934320
Hilary, G., and Menzly, L. (2006). Does past success lead analysts to become overconfident?. Manage. Sci. 52, 489–500. doi: 10.1287/mnsc.1050.0485
Hillman, A., and Dalziel, T. (2003). Boards of directors and firm performance: integrating agency and resource dependence perspectives. Acad. Manage. Rev. 28, 383–396. doi: 10.2307/30040728
Holt, C., and Laury, S. (2002). Risk aversion and incentive effects. Am. Econ. Rev. 92, 1644–1655. doi: 10.1257/000282802762024700
Holzmeister, F., Huber, J., Kirchler, M., Lindner, F., Weitzel, U., and Zeisberger, S. (2020). What drives risk perception? a global survey with financial professionals and laypeople. Manage. Sci. 66, 3977–4002. doi: 10.1287/mnsc.2019.3526
Hoyt, C. L., and Murphy, S. E. (2016). Managing to clear the air: stereotype threat, women, and leadership. Leadership Quarterly. 27, 387–399. doi: 10.1016/j.leaqua.2015.11.002
Huang, J., and Kisgen, D. J. (2013). Gender and corporate finance: are male executives overconfident relative to female executives?. J. financ. econ. 108, 822–39. doi: 10.1016/j.jfineco.2012.12.005
Hügelschäfer, S., and Achtziger, A. (2014). On confident men and rational women: It's all on your mind (set). J. Econom. Psychol. 41, 31–44.
Ivanova-Stenzel R. and Kübler, D.. (2011). Gender differences in team work and team competition. J. Econom. Psychol. 32, 797–808.
Johnson, D., and Fowler, J. (2011). The evolution of overconfidence. Nature. 477, 317–320. doi: 10.1038/nature10384
Kerr, N., and Tindale, R. (2004). Group performance and decision making. Annu. Rev. Psychol. 55, 623–655. doi: 10.1146/annurev.psych.55.090902.142009
Khorana, A., Tufano, P., and Wedge, L. (2007). Board structure, mergers, and shareholder wealth: a study of the mutual fund industry. J. Financ. Econ. 85, 571–598. doi: 10.1016/j.jfineco.2006.05.002
Kim, D., and Starks, L. T. (2016). Gender diversity on corporate boards: do women contribute unique skills?. Am. Econ. Rev. 106, 267–71. doi: 10.1257/aer.p20161032
Kirsch, A. (2018). The gender composition of corporate boards: a review and research agenda. Leadership Quarterly. 29, 346–364. doi: 10.1016/j.leaqua.2017.06.001
Klayman, J., Soll, J., González-Vallejo, C., and Barlas, S. (1999). Overconfidence: it depends on how, what, and whom you ask. Organ. Behav. Hum. Decis. Process. 79, 216–247. doi: 10.1006/obhd.1999.2847
Kocher, M., and Sutter, M. (2005). The decision maker matters: individual vs. group behaviour in experimental beauty-contest games. Econ. J. 115, 200–223. doi: 10.1111/j.1468-0297.2004.00966.x
Kolasinski, A., and Li, X. (2013). Can strong boards and trading their own firm's stock help CEOs make better decisions? Evidence from acquisitions by overconfident CEOs. J. Financial Quantitative Anal. 48, 1173–1206. doi: 10.1017/S0022109013000392
Langer, E. J. (1975). The illusion of control. J. Pers. Soc. Psychol. 32, 311. doi: 10.1037/0022-3514.32.2.311
Levi, M., Li, K., and Zhang, F. (2014). Director gender and mergers and acquisitions. J. Corporate Finance. 28, 185–200. doi: 10.1016/j.jcorpfin.2013.11.005
Lichtenstein, S., and Fischhoff, B. (1977). Do those who know more also know more about how much they know?. Organ. Behav. Hum. Perform. 20, 159–183. doi: 10.1016/0030-5073(77)90001-0
Malmendier, U., and Tate, G. (2005). CEO overconfidence and corporate investment. J. Finance. 60, 2661–2700. doi: 10.1111/j.1540-6261.2005.00813.x
Malmendier, U., and Tate, G. (2008). Who makes acquisitions? CEO overconfidence and the market's reaction. J. Financ. Econ. 89, 20–43. doi: 10.1016/j.jfineco.2007.07.002
Masclet, D., Colombier, N., Denant-Boemont, L., and Loheac, Y. (2009). Group and individual risk preferences: a lottery-choice experiment with self-employed and salaried workers. J. Econ. Behav. Organ. 70, 470–484. doi: 10.1016/j.jebo.2007.11.002
Melkas, H., and Anker, R. (1997). Occupational segregation by sex in Nordic countries: An empirical investigation. Int'l Lab. Rev. 136, 341.
Menkhoff, L., Schmeling, M., and Schmidt, U. (2013). Overconfidence, experience, and professionalism: an experimental study. J. Econ. Behav. Organ. 86, 92–101. doi: 10.1016/j.jebo.2012.12.022
Meyer, A. N. D., Payne, V. L., Meeks, D. W., Rao, R., and Singh, H. (2013). Physicians' diagnostic accuracy, confidence, and resource requests: a vignette study. JAMA Intern. Med. 73, 1952–1958. doi: 10.1001/jamainternmed.2013.10081
Michailova, J., and Katter, J. (2014). Quantifying overconfidence in experimental finance. Int. J. Behav. Account. Finance. 4, 351–367. doi: 10.1504/IJBAF.2014.067629
Michailova, J., and Schmidt, U. (2016). Overconfidence and bubbles in experimental asset markets. J. Behav. Finance. 17, 280–292. doi: 10.1080/15427560.2016.1203325
Moore, D., and Healy, P. (2008). The trouble with overconfidence. Psychol. Rev. 115, 502. doi: 10.1037/0033-295X.115.2.502
Niederle, M., and Vesterlund, L. (2007). Do women shy away from competition? Do men compete too much?. Q. J. Econom. 122, 1067–1101.
Obling, K. H., Hansen, A-L. S., Overgaard, K., Normann, K., Sandbaek, A., and Maindal, H. T. (2015). Association between self-reported and objectively measured physical fitness level in a middle-aged population in primary care. Prevent. Med. Rep. 2, 462–466. doi: 10.1016/j.pmedr.2015.05.010
Offerman, T., Sonnemans, J., Van de Kuilen, G., and Wakker, P. P. (2009). A truth serum for non-bayesians: correcting proper scoring rules for risk attitudes. Rev. Econ. Stud. 76, 1461–1489. doi: 10.1111/j.1467-937X.2009.00557.x
Powell, M., and Ansic, D. (1997). Gender differences in risk behaviour in financial decision-making: an experimental analysis. J. Econ. Psychol. 18, 605–628. doi: 10.1016/S0167-4870(97)00026-3
Presseportal. (2015). Das Erste: “Quizduell” mit Jörg Pilawa: Erfolgreiche Bilanz der aktuellen Staffel Die interaktive Live-Show wird nach der Sommerpause fortgesetzt. Presseportal. Available online at: https://www.presseportal.de/pm/6694/3022097 (accessed April 27, 2019).
Read, D. (2005). Monetary incentives, what are they good for?. J. Econ. Methodol. 12, 265–276. doi: 10.1080/13501780500086180
Reuben, E., Rey-Biel, P., Sapienza, P., and Zingales, L. (2012). The emergence of male leadership in competitive environments. J. Econ. Behav. Organ. 8, 605–628. doi: 10.1016/j.jebo.2011.06.016
Reuben, E., Sapienza, P., and Zingales, L. (2014). How stereotypes impair women's careers in science. Proc. Natl. Acad. Sci. USA. 111, 4403–4408. doi: 10.1073/pnas.1314788111
Ring, P., Neyse, L., David-Barett, T., and Schmidt, U. (2016). Gender differences in performance predictions: evidence from the cognitive reflection test. Front. Psychol. 25, 4403–8. doi: 10.3389/fpsyg.2016.01680
Schaefer, P. S., Williams, C. C., Goodie, A. S., and Campbell, W. K. (2004). Overconfidence and the Big Five. J. Res. Pers. 38, 473–480. doi: 10.1016/j.jrp.2003.09.010
Schlag, K., and Tremewan, J. (2021). Simple belief elicitation: an experimental evaluation. J. Risk Uncertain. 62, 137–155. doi: 10.1007/s11166-021-09349-6
Schlag, K. H., Tremewan, J., and Van der Weele, J. J. (2015). A penny for your thoughts: a survey of methods for eliciting beliefs. Experimental Economics. 18, 457–490. doi: 10.1007/s10683-014-9416-x
Schotter, A., and Trevino, I. (2014). Belief elicitation in the laboratory. Annu. Rev. Econom. 6, 103–128. doi: 10.1146/annurev-economics-080213-040927
Schwartz-Ziv, M., and Weisbach, M. (2013). What do boards really do? Evidence from minutes of board meetings. J. Financ. Econ. 108, 349–366. doi: 10.1016/j.jfineco.2012.04.011
Shastry, G. K., Shurchkov, O., and Xia, L. L. (2020). Luck or skill: how women and men react to noisy feedback. J. Behav. Exp. Econ. 88, 101592. doi: 10.1016/j.socec.2020.101592
Shupp, R. S., and Williams, A. W. (2008). Risk preference differentials of small groups and individuals. Econ. J. 118, 258–83. doi: 10.1111/j.1468-0297.2007.02112.x
Sinclair, L., and Kunda, Z. (2000). Motivated stereotyping of women: she's fine if she praised me but incompetent if she criticized me. Pers. Soc. Psychol. Bull. 26, 1329–1342. doi: 10.1177/0146167200263002
Sniezek, J. A. (1992). Groups under uncertainty: an examination of confidence in group decision making. Organ. Behav. Hum. Decis. Process. 52, 124–155. doi: 10.1016/0749-5978(92)90048-C
Soll, J. B., and Klayman, J. (2004). Overconfidence in interval estimates. J. Exp. Psychol. Learn. Memory Cogn. 30, 299–314. doi: 10.1037/0278-7393.30.2.299
Svenson, O. (1981). Are we all less risky and more skillful than our fellow drivers?. Acta Psychol. 47, 143–148. doi: 10.1016/0001-6918(81)90005-6
Taylor, S. E., and Brown, J. D. (1988). Illusion and well-being: a social psychological perspective on mental health. Psychol. Bull. 103, 193. doi: 10.1037/0033-2909.103.2.193
The New York Times (2010). Lagarde: What If It Had Been Lehman Sisters? - The New York Times. Available online at: https://dealbook.nytimes.com/2010/05/11/lagarde-what-if-it-had-been-lehman-sisters/ (accessed October 14, 2020).
Trevelyan, R. (2008). Optimism, overconfidence and entrepreneurial activity. Manage. Decision. 46, 986–1001. doi: 10.1108/00251740810890177
Trinugroho, I., and Sembel, R. (2011). Overconfidence and excessive trading behavior: an experimental study. Int. J. Bus. Manage. 6, 147. doi: 10.5539/ijbm.v6n7p147
Twardawski, T., and Kind, A. (2016). Board overconfidence in mergers and acquisitions: a self-attribution bias. Acad. Manage. J. doi: 10.5465/ambpp.2016.18240abstract
Van Veldhuizen, R. (2022). Gender differences in tournament choices: Risk preferences, overconfidence or competitiveness?. J. Eur. Econ. Assoc. 20, 1595–1618. doi: 10.1093/jeea/jvac031
Viscusi, W., Phillips, O., and Kroll, S. (2011). Risky investment decisions: How are individuals influenced by their groups?. J. Risk Uncertain. 43, 81. doi: 10.1007/s11166-011-9123-3
Weinstein, N. (1980). Unrealistic optimism about future life events. J. Pers. Soc. Psychol. 39, 806. doi: 10.1037/0022-3514.39.5.806
Winkler, R. L., and Murphy, A. H. (1970). Nonlinear utility and the probability score. J. Appl. Meteorol. Climatol. 9, 143–148. doi: 10.1175/1520-0450(1970)009<0143:NUATPS>2.0.CO;2
Keywords: diversity, overconfidence, gender differences, risky decisions, laboratory experiment, behavioral finance
Citation: Renerte B, Hausfeld J and Twardawski T (2023) Male and overconfident groups overinvest due to inflated perceived ability to beat the odds. Front. Behav. Econ. 2:1111317. doi: 10.3389/frbhe.2023.1111317
Received: 29 November 2022; Accepted: 16 February 2023;
Published: 09 March 2023.
Edited by:
Siri Isaksson, Norwegian School of Economics, NorwayReviewed by:
Le Zhang, Macquarie University, AustraliaManuel Grieder, UniDistance Suisse, Switzerland
Copyright © 2023 Renerte, Hausfeld and Twardawski. This is an open-access article distributed under the terms of the Creative Commons Attribution License (CC BY). The use, distribution or reproduction in other forums is permitted, provided the original author(s) and the copyright owner(s) are credited and that the original publication in this journal is cited, in accordance with accepted academic practice. No use, distribution or reproduction is permitted which does not comply with these terms.
*Correspondence: Baiba Renerte, YmFpYmEucmVuZXJ0ZUBiZi51emguY2g=