 Mequanint B. Melesse
- International Crops Research Institute for the Semi-Arid Tropics (ICRISAT), Nairobi, Kenya
This paper investigates how individual decisions are aggregated to team decisions under risk in field experiment with a sample of Ethiopian farmers and the team decision-making process behind this aggregation. In an experiment structurally similar to the Gneezy-Potters' risk game, subjects make decisions first individually and then jointly with a random anonymous partner. In the aggregate, teams make higher allocation into the risky asset compared to the average of individual decisions. However, teams are neither polarizing nor simply averaging individual preferences. Instead, team decisions are consistent with an outcome of group bargaining and deliberation process based on intensity of individual preferences. But more risk-taking subjects have a stronger influence on team decisions. This influence of more risk-taking members on the group decision is leveraged by their better education levels. Analysis of the team decision-making process reveals several interesting insights. About 54% of the teams do not reach immediate agreement with initial allocations. Both less risk-taking and more risk-taking team members are equally likely to disagree with initial allocations but for different reasons. Teams that disagreed with initial allocations reached final team decisions significantly different from disagreed initial allocations. Less risk-taking subjects are more willing to concede to allocations proposed by more risk-taking subjects to reach at an agreed team decision. Demanding messages in group communications have a stronger effect on outcomes of group decision-making. Finally, teams with greater differences in willingness to take risk among members are more likely to disagree with initial team allocations, take more rounds of deliberations to come to a decision, and make choices further away from the average of individual decisions. Our results permit to better characterize the process of group decision-making beyond differences between individual and group decisions.
1 Introduction
Many important real-life economic decisions are made by formal and informal teams, such as families, business partnerships, management committees and company boards. Teams are believed to make better decisions than individuals, and decisions made by teams are accepted to a larger extent by those who are affected (Kocher et al., 2006). In the last couple of decades, team decision-making under risk has attracted considerable attention in social psychology and experimental economics. Earlier studies in social psychology introduced such concepts as “risky shift,” where groups make riskier decisions than individuals (Fraser et al., 1970), “cautious shift,” where groups take less risk than their members (Wallach et al., 1964), and “group polarization,” where teams make more extreme decisions than would be derived by the average of their individual members (Moscovici and Zavalloni, 1969). Similarly, most recent laboratory experiments (mostly in economics) documented significant differences between decisions of teams and individuals, with some studies reporting that groups take more risk than individuals (e.g., Sutter, 2007; Zhang and Casari, 2012; Bougheas et al., 2013; Nieboer, 2015), and some others finding that groups take less risk than individuals (e.g., Bateman and Munro, 2005; Baker et al., 2008; Masclet et al., 2009). Shupp and Williams (2008) offered some reconciliatory evidence that teams are more risk averse with decisions involving high-risk but are increasingly more risk-taking with choices involving low-risk situations.
However, most of the literature on group decision-making under risk has hardly dealt with how individual decisions are aggregated to team decisions. As a result, little is understood about how individual decisions are aggregated to team decisions and the team decision-making process behind this aggregation (Zhang and Casari, 2012; Ambrus et al., 2015). Additionally, most research on group decision-making under risk is based on data from student samples in Western, educated, industrialized, rich, and democratic (WEIRD) countries (Henrich et al., 2010). Importantly, the generalizability of results based on student samples to behavior in real economic settings has been debated (Henrich et al., 2010). Laboratory experiments also lack the diversity to explore what personal and community characteristics determine team decisions (Ertac and Gurdal, 2012; Nieboer, 2015).
This paper investigates how individual decisions are aggregated to team decisions under risk in a lab-in-the-field experiment with a sample of Ethiopian farmers and the team decision-making process behind this aggregation. Much of the existing literature explicitly or implicitly assumes that a simple averaging process emerges naturally from team discussions, even if teams do not consciously focus on calculating the mean or median of individual decisions (e.g., Shupp and Williams, 2008; Bougheas et al., 2013; Nieboer, 2015). This general approach of comparing team decisions with averages of members' individual decisions may obscure our understanding of the dynamics of team decision-making (Vidmar, 1970; Ambrus et al., 2015). Alternatively, the team decision-making process can be viewed as an unstructured team deliberation and bargaining among different team members with given individual preferences, where team decisions are assumed to reflect the intensity of personal preferences and the relative influence of each member (Deck et al., 2012; Ambrus et al., 2015). The current study makes empirical comparisons between these competing preference aggregation mechanisms in teams.
Relatedly, few recent experimental studies investigate individual decisions' influence on team decisions. Ambrus et al. (2015) found that the median or close to the median members significantly impact the group decision in five-person groups, suggesting the importance of the relative position of members in teams. Considering two-person teams, Deck et al. (2012) documented that team decisions are a compromise between team members' individual decisions, consistent with subjects bargaining over outcomes. Zhang and Casari (2012) studied how three-member groups aggregate personal preferences and found that extrovert subjects are more likely to lead the group outcome when members do not reach immediate agreement. These studies relied on the risk preference elicitation task of Holt and Laury (2002) and did not explicitly analyze the team decision-making process. This study examines the team decision-making process to gain insights into how groups make decisions and how team decisions evolve when members do not immediately agree with initial allocations. In the present work, we also examine the role of risk composition within teams in shaping the internal dynamics and outcomes of team decision-making.
Our experiment is based on a variant of the risk allocation game of Gneezy and Potters (1997), which involves allocating a fixed amount of money between risky and riskless options with real payoffs at stake. Subjects had to first make individual decisions and then were randomly paired to make team decisions with the same parameters. In our design, individual and team decisions are observed independently but on the same subjects. We use a semi-structured team communication mechanism to facilitate information exchange, encourage participation by all members and focus the team interaction on how to aggregate individual decisions. We call for a unanimous decision rule and teams can go up to 14 rounds of negotiation, permitting for more deliberation, disagreements and changes of opinion among team members. This has offered us a rich environment to understand how groups aggregate individual decisions. The Gneezy-Potters design combines simplicity with absence of strategic considerations, providing a relevant framework to analyze group decision-making without imposing significant structural constraints.
The main results are summarized as follows. In the aggregate, team decisions involve more risk than individual choices. But team choices are neither equally weighted averages of individuals' decisions nor more polarized than individual choices. Instead, they are consistent with members bargaining and deliberating over the outcome based on the intensity of their individual preferences, with more risk-taking subjects being more influential in the team decision-making. About 54% of the teams do not reach immediate agreement with initial allocations. Both less risk-taking and more risk-taking team members are equally likely to disagree with initial allocations, but for different reasons. Teams with greater differences in risk-taking among members are more likely to disagree with initial allocations, take more rounds of deliberation to come to a decision, and make team choices further away from the average of individual preferences. Analysis of the team decision-making process generates several interesting insights, which we report in detail below.
The remainder of the paper proceeds as follows. Section 2 presents the study context and how communities make decisions. Section 3 describes the experimental design and data. Section 4 reports results, while Section 5 provides the discussion and conclusion.
2 The study context and community decision-making
Rural communities are social groups with shared interests, social values, beliefs and sense of belongingness in a specific bounded geographic location (Bettez, 2013), and group decision-making is a regular feature of their everyday life. In the study areas, rural communities often make group decisions in various domains, including agricultural producer organizations, marketing cooperatives, collective resource managements, water governance, maintenance of community public goods (e.g., roads, dams, etc.), community development committee, and community policing and conflict resolutions. Many of these decisions play an important role in community livelihoods and are closely tied to household livelihood strategies. Many households live on the edge of extreme food insecurity, and risk considerations are important elements of relevant decisions of farm households (Melesse and Cecchi, 2017). As a result, they often develop ex-ante strategies of coping through choosing low-risk enterprises that often yield lower but more predictable incomes (Dercon and Christiaensen, 2011).
Further, community decision-making is deeply embedded in their culture and social characteristics and thus extends beyond normative assumptions of constrained-optimization and risk considerations. Rural communities in Africa possess their own socially and culturally specific ideas about what decision-making power is, who can hold it, and how it can be transferred in the community (Melesse et al., 2018). In hierarchal communities, decision-making power is closely linked to social status. In the study communities, such status is socially ascribed based on age, education, gender and wealth, specifically land and livestock ownership. With this, we consider differences between team variables to explain outcomes of team decision-making in our experiment and analysis.
Another important aspect in community decision-making is the role that social norms play in how disagreements in community decisions and conflicts are settled. In Ethiopia, local elders and religious leaders are the customary judges, especially in rural communities, who ensure that arbitration outcomes are strongly embedded into community dynamics (Cecchi and Melesse, 2016). Such traditional conflict resolutions focus on restoration and narrowing of differences through deliberations and negotiations. This decision context could lead team discussions to some sort of averaging process of individual decisions. In other words, team decisions may reveal taste against group polarization. Overall, while this brief description of the dynamics of community decision-making is informative, it is important to note that team members in our experiment remain anonymous to each other. This anonymity may attenuate expectations related to the dynamics of power in community decision-making, positional concerns and gender differences.
3 Materials and methods
3.1 Experimental design and procedure
We elicit individual and team risk preferences using a simple risk game from 532 randomly sampled farmers from 18 kebeles (municipalities) in Amhara region, Ethiopia. The experiments were conducted by 20 experimenters in the autumn of 2014 over October and November. A session covered the experiments and short post-experiment survey and lasted for about 1.5 hours. This research was conducted in the purview of the School of Social Sciences through its Social Sciences Ethics Committee at Wageningen University.
The overall incentive structure of the game is similar to that of the investment task of Gneezy and Potters (1997). Table A1 gives the detailed procedure of the game. Subjects receive an endowment of about US$2.8, or around twice the local average daily income during the survey time1, and subsequently decide on how much of their endowment to invest in a risky asset with 50% probability of doubling and 50% probability of halving the invested amount. The incentive structure of the experiment implies a tradeoff between the expected value of the allocation to the risky asset and its variance; thus, an increase in expected return implies increasing the risk of losing a larger amount. Formally, the experimental choices can be described using the expected utility framework. In expected utility maximization, the unique optimum depends on the curvature of the utility function and the expected return of income a subject possesses (Jehle and Reny, 2011). Further, as much choices are guided by the expected utility maxim, the mean–variance analysis can provide necessary and sufficient conditions that approximate the maximization of expected utility (Markowitz, 2014). Practically, this involves a careful choice from a mean–variance efficient frontier that can approximately maximize expected utility for a wide variety of concave (risk-averse) utility functions. Following this argument, the optimal choice can be related to the asset's expected return and variance of the portfolio allocation. The expected value of the allocation to the risky asset (x) is E(x) = 1.25x and its variance is var(x) = 0.5625x22. The tradeoff becomes more favorable for subjects whose allocation to the risky asset (x) is greater than the threshold of the equality of the expected mean and variance equations, which is about 2 Ethiopian Birr. Thus, experimental choices exhibit the more plausible decreasing absolute risk aversion (DARA) for almost the entire decision task. To be precise, DARA applies to subjects who invested an amount greater than the threshold level in the risky asset, given initial endowments allocated to them. The experimental procedure consisted of two parts. Subjects first make choices individually and then a team choice with a random anonymous paired member from their community. Teams were jointly provided with new but the same amount of endowment.
The team decision-making proceeds as follows. One of the team members was randomly selected to initiate the team deliberation by making an initial allocation between cash and the risky asset, while the paired member has the option to either accept or decline it and propose a new allocation with an explanation supporting her new allocation for the group decision, through oral messages collected and delivered by experimenters. In this way, teams could continue to deliberate until an agreement was reached on the team decision or 14 rounds of deliberations were completed. The experimenter would intervene to end the game by taking the average of all individual allocations if a team failed to reach agreement after 14 rounds. But no team had relied on experimenters, as the maximum number of rounds of deliberation reached by teams was seven.
We used a semi-structured communication strategy for team deliberations, where experimenters carefully collected, recorded, and delivered oral messages of team members, allowing us to collect data on the team deliberation process to understand how groups resolve disagreements and internal dynamics of group decision-making. Generally, the literature uses either face-to-face discussion (e.g., Baker et al., 2008; Shupp and Williams, 2008) or computer-based chat (e.g., Zhang and Casari, 2012) for team communication. While we avoided face-to-face discussion as it involves many confounds (from uncontrolled interactions) of team decision-making process, we were not able to use an electronic chat due to low levels of literacy among our subject pool. The content of messages was not restricted, except for forbidding abusive language and revealing one's identity in any manner. The fact that subjects remain anonymous minimizes roles of confounding factors related to prior acquaintance or societal status of members. Anonymity attenuates concerns related to repeated play that are invariably present within naturally occurring teams, such as couples and business partners, and avoids the risk of any conflict or retaliation among participants after the experiments.
While a within-subject experimental design allows a more direct analysis of aggregation of individual decisions to team decisions, a possible concern is that it might exhibit order effects. However, order effects are more likely to be minimal in tasks where preferences play a major role (Baker et al., 2008; Masclet et al., 2009). Subjects were informed about the prospect of team decision-making after individual decisions were submitted. Subjects did not receive any feedback about the outcome of individual decisions before the team decision was completed. Strategic considerations are absent in the risk allocation task, and there were no time limits or any other hard constraints on deliberations during the team decision-making. Subjects were randomly assigned a unique identifier, physically separated from one another, and kept in private locations throughout the experiment, and team communication was carried out in a non-identifiable manner through experimenters. Subjects face identical per capita expected monetary payoff in individual and team decisions. At the end of the experiment, a random payment scheme was applied to control for wealth effects and to induce subjects to reveal true preferences in individual and team treatments. When the individual task was chosen for payment, subjects were paid based on the outcomes of their own individual decisions. Otherwise, subjects were paid the same payoff based on the outcomes of the team decision. On average, subjects earned about 60 Ethiopian Birr ($3.29). Finally, data on subjects' sociodemographic and other background characteristics were collected as part of a survey.
3.2 Data
Table 1 presents the summary statistics of participants. Column (a) shows summary statistics of variables at the individual level. The majority (97%) of the subjects are male. This is because males are culturally recognized as heads of households in the research communities, which unfortunately limits the power of analysis with respect to gender dynamics. But restricting the sample to household heads eliminates potentially confounding factors due to different roles and age differences within the household. The average subject is 44 years old and has about 3 years of formal schooling. The average household comprises about six family members and works on about eight timads3 of land with a livestock herd of seven tropical livestock units4. The annual average per capita income (from all possible sources) for sampled households is about 3,188 Ethiopian Birr (about $175).
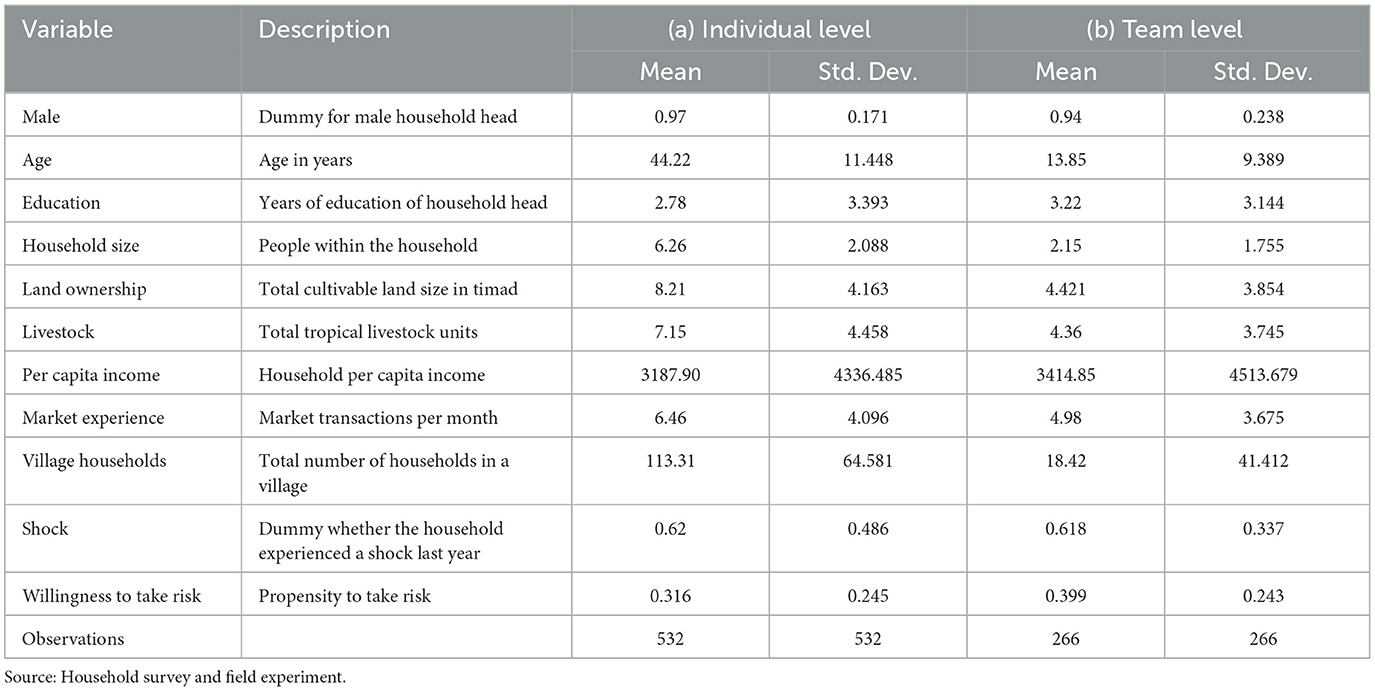
Table 1. Individual and team summary statistics for the experimental subject pool.
Market experience is captured by the average number of transactions of the household in a typical month and the average household conducts about seven transactions per month. The average participant resides in a village which is home to about 113 farm households, a proxy for village population. Finally, the variable shock captures whether a household experienced a major shock (drought, flood, crop damage or illness of the head), and about 60% of the households experienced at least one form of these shocks in the year prior to the survey. The variables market experience, village population, and shock tend to capture community level aspects, while other variables measure individual level characteristics. Column (b) gives the values of the above variables at team level. The male dummy at a team level indicates teams that comprise only men members. The shock dummy at a team level indicates that at least one of the team members experienced a shock. Observations for other variables at team level are differences between individual observations of members within a team.
The key outcome variable is risk-taking by individuals and teams. The propensity of individuals and teams to take risk is measured by the proportion of the endowment which was committed to the risky asset relative to the total endowment. Individuals and teams, respectively, allocate about 32 and 40% of their endowment to the risky asset (Table 1). It is observed that both individual and team choices are relatively risk averse, which is consistent with previous literature on risk behavior of poor farmers elsewhere in developing countries (e.g., Binswanger, 1980; Harrison et al., 2010). Figure 1 presents the distribution of risk-taking by individuals (Figure 1A) and teams (Figure 1B). The figure reveals that there are considerable differences in risk-taking in both individual and team treatments. While all individuals and teams chose to invest some positive amount in the risk asset (i.e., the minimum of the risk index is >0), only one individual chose to invest her entire endowment in the individual decision, but no team invested its entire endowment in the risky asset.
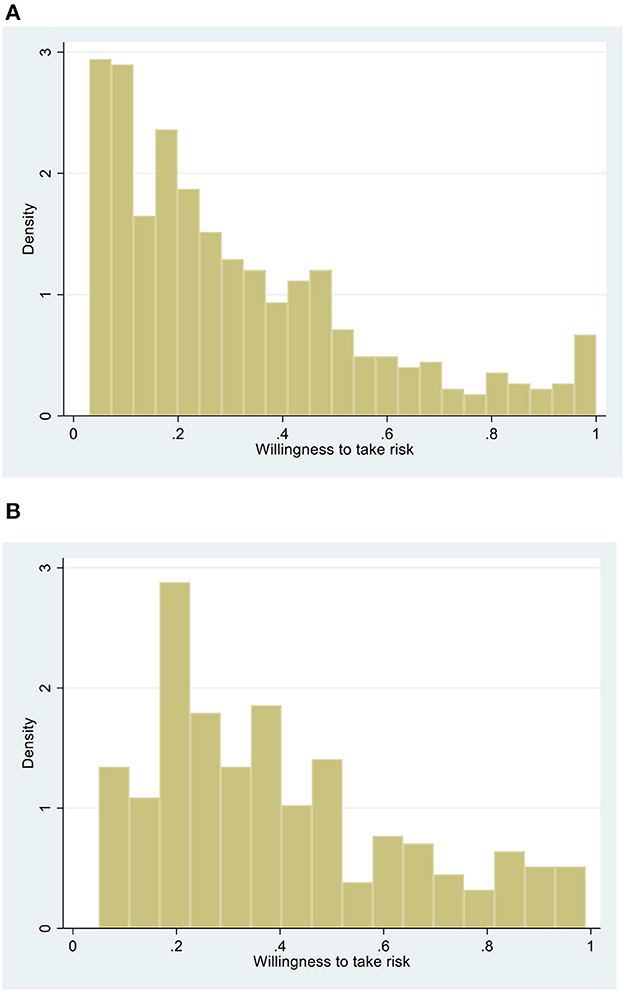
Figure 1. Histogram distributions of willingness to take risk by (A) individuals and (B) teams.
What may drive the observed differences in risk-taking among individual subjects? To identify factors that influence individuals' willingness to take risk in the individual portfolio allocation decisions, we run an ordinary least squares (OLS) model of the individual risk-taking measure on several covariates of subjects. We return to a similar analysis for team decisions below. The results are reported in Table A2. Individual risk-taking appears to be correlated with a range of covariates. All significant results are consistent with expectations and the literature. Male subjects are relatively high-risk takers as compared to female subjects. Age matters for risk-taking, with risk-taking behavior of subjects decreasing significantly with age, perhaps due to low earning power and less time to recover from losses. However, this relationship is non-linear, and there is a threshold, as age square enters significantly positive, indicating that people would instead become risk lovers when they get too old. Individuals' risk-taking increases with education, household size and market experience.
4 Results
4.1 Aggregate statistics analyses
We conduct a series of pair-wise comparisons of aggregate statistics that help answering whether individual and team decisions are different. When observations are independent, we run Mann–Whitney unmatched (Wilcoxon rank sum) test that does not require distributional assumptions. We use dependent t-test for comparisons when observations are not independent due to the within-subject design of our experiment. Several interesting informal observations emerge from these comparisons (Table 2). First, teams take more risk than individuals (two sample dependent t-test; p < 0.01). But variances of the risk indices are statistically indistinguishable between individual and team decisions (p = 0.443; Levene F-test). This indicates that, while teams take higher risk, the distribution of team decisions are not extremely dispersed compared to preferences of individuals. Second, females are clearly more risk averse than males. Third, teams with a female member take less risk than do teams with only male members. But our sample is highly gender unbalanced and limited the power of investigating gender differences in decision-making within groups, as only 6% of the teams had a female member. There was no team with only female members5.
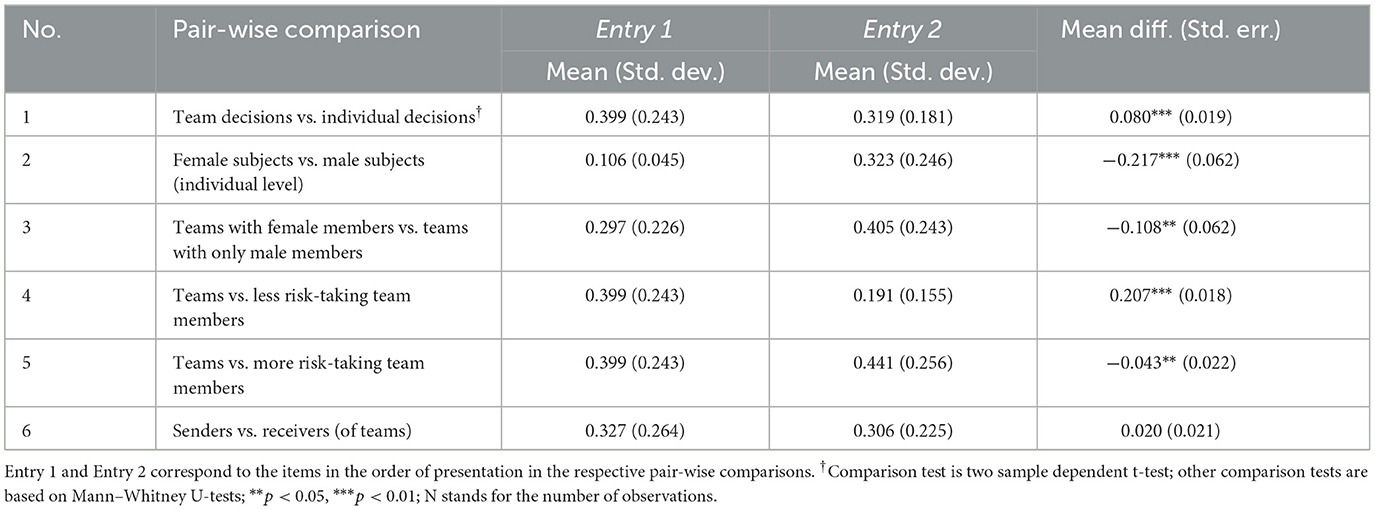
Table 2. Statistical tests comparing risk-taking by groups, group members and other sub-samples.
Furthermore, the fourth and the fifth tests are comparisons of team decisions with individual decisions of the less risk-taking and the more risk-taking individuals within a team. It is important to note that the characterization of “less risk-taking” and “more risk-taking” individuals is only with reference to a team, and refers, respectively, to members of the team with “lower” and “higher” willingness to take risk, i.e., allocations to the risky asset. With this, the comparisons reveal that team choices are significantly different from individual decisions of both less risk-taking and more risk-taking team members. Specifically, team decisions involve more risk than the average of less risk-taking members, but less risk than the average of more risk-taking members.
Lastly, the final comparison is between senders and receivers at the initial round of the team decision-making. This grouping is based on the random assignment of participants to the sender and receiver roles in the initiation of the team decision-making process. The result shows that senders and receivers do not significantly differ in risk-taking (Mann–Whitney U-test; p = 0.948), suggesting a successful randomization of assignments into these roles. Table A3 also reports balance statistics tests for several covariates of senders and receivers. Almost all covariates are not significantly different, further confirming the success of the randomization.
4.2 Main results
At this point, the analysis is focused on how teams aggregate individual decisions and the relative influence of team members on outcomes of team decisions. Focusing on the relationship between individual and team choices, we emphasize that the team decision is the outcome variable and that individual decisions of team members are the key explanatory variables. To formalize arguments, let yt denote the team decision for the tth team, and individual decisions of team members are ordered such that xt1 ≥ xt2, i.e., subject 1 is the more risk-taking member of the team. Assuming team decisions are a linear function of individual preferences, the regression specification is modeled as:
where Xt is a vector of team members' covariates and characteristics of the team decision process, and ϵt is a random error term. Differences between variables of team members are considered in the regressions to make β and γ a function of characteristics.
The preference aggregation mechanisms can be assessed by observing parameter estimates from Equation (1) and performing some post-estimation tests. First is the averaging process that conjectures the mean of individual preferences predicts the team decision, which leads to two hypotheses. The weak mean hypothesis states that individuals within a team have an equal influence on the team decision. In the econometric model, this implies testing whether β = γ. The strong mean hypothesis which further requires the mean to exactly predict the team decision with equal influence of members and involves testing the hypothesis that .
The alternative is that team decision-making is an unstructured bargaining and deliberation process among team members, and team decisions are a function of the intensity of individuals' willingness to take risk and relative influence of members in the decision-making process. While individual decisions reflect the preferred outcome of team members, they may have different weights to drive the team decision closer to their preferred decision. In other words, one member may simply have significantly more intense preference for her choice, while the other member's preference may be weaker in the sense that she is willing to change to come to a team agreement. Thus, individuals with a greater intensity of preference are more likely to dominate the team decisions. In terms of the econometric model, this implies testing whether coefficients of individual decisions sum up to one, i.e., β+γ = 1. In particular, β≠γ and β+γ = 1 indicates that the team decision that varies with individual decisions is a convex combination of members' individual decisions, and that coefficients of individual decisions can be interpreted as different weights of members' influence in shaping the team decision. For instance, team decisions that are dominated by more risk-taking members would imply β> γ.
Table 3 reports results from OLS estimation explaining a team's choice as a function of its members' individual decisions and other covariates6. Team communication was facilitated by experimenters. While this approach has a merit of providing a more controlled team decision-making environment to preserve anonymity and attenuate confounding factors, it may not be neutral with respect to its influence on team communications. More specifically, despite the intensive training to experimenters and piloting for feedback, experimenters might have different levels of effectiveness in conveying messages to subjects. To account for this, we report standard errors clustered at the experimenter level. We first estimate a more parsimonious specification with only individual risk preferences as regressors (1) and subsequently include other covariates to reach the elaborated specification (2). In both models, the coefficients on more risk-taking and less risk-taking team members are positive and significant, indicating that both team members play important roles in explaining the team decisions. The value of adjusted R2 (model 1) is substantially high, indicating that individual decisions considerably explain the variation in team decisions. The dummy for the more risk-taking sender is not significant (model 2), implying that assignment to the ‘sender' and ‘receiver' roles in the initial round of the team deliberation did not affect team decisions.
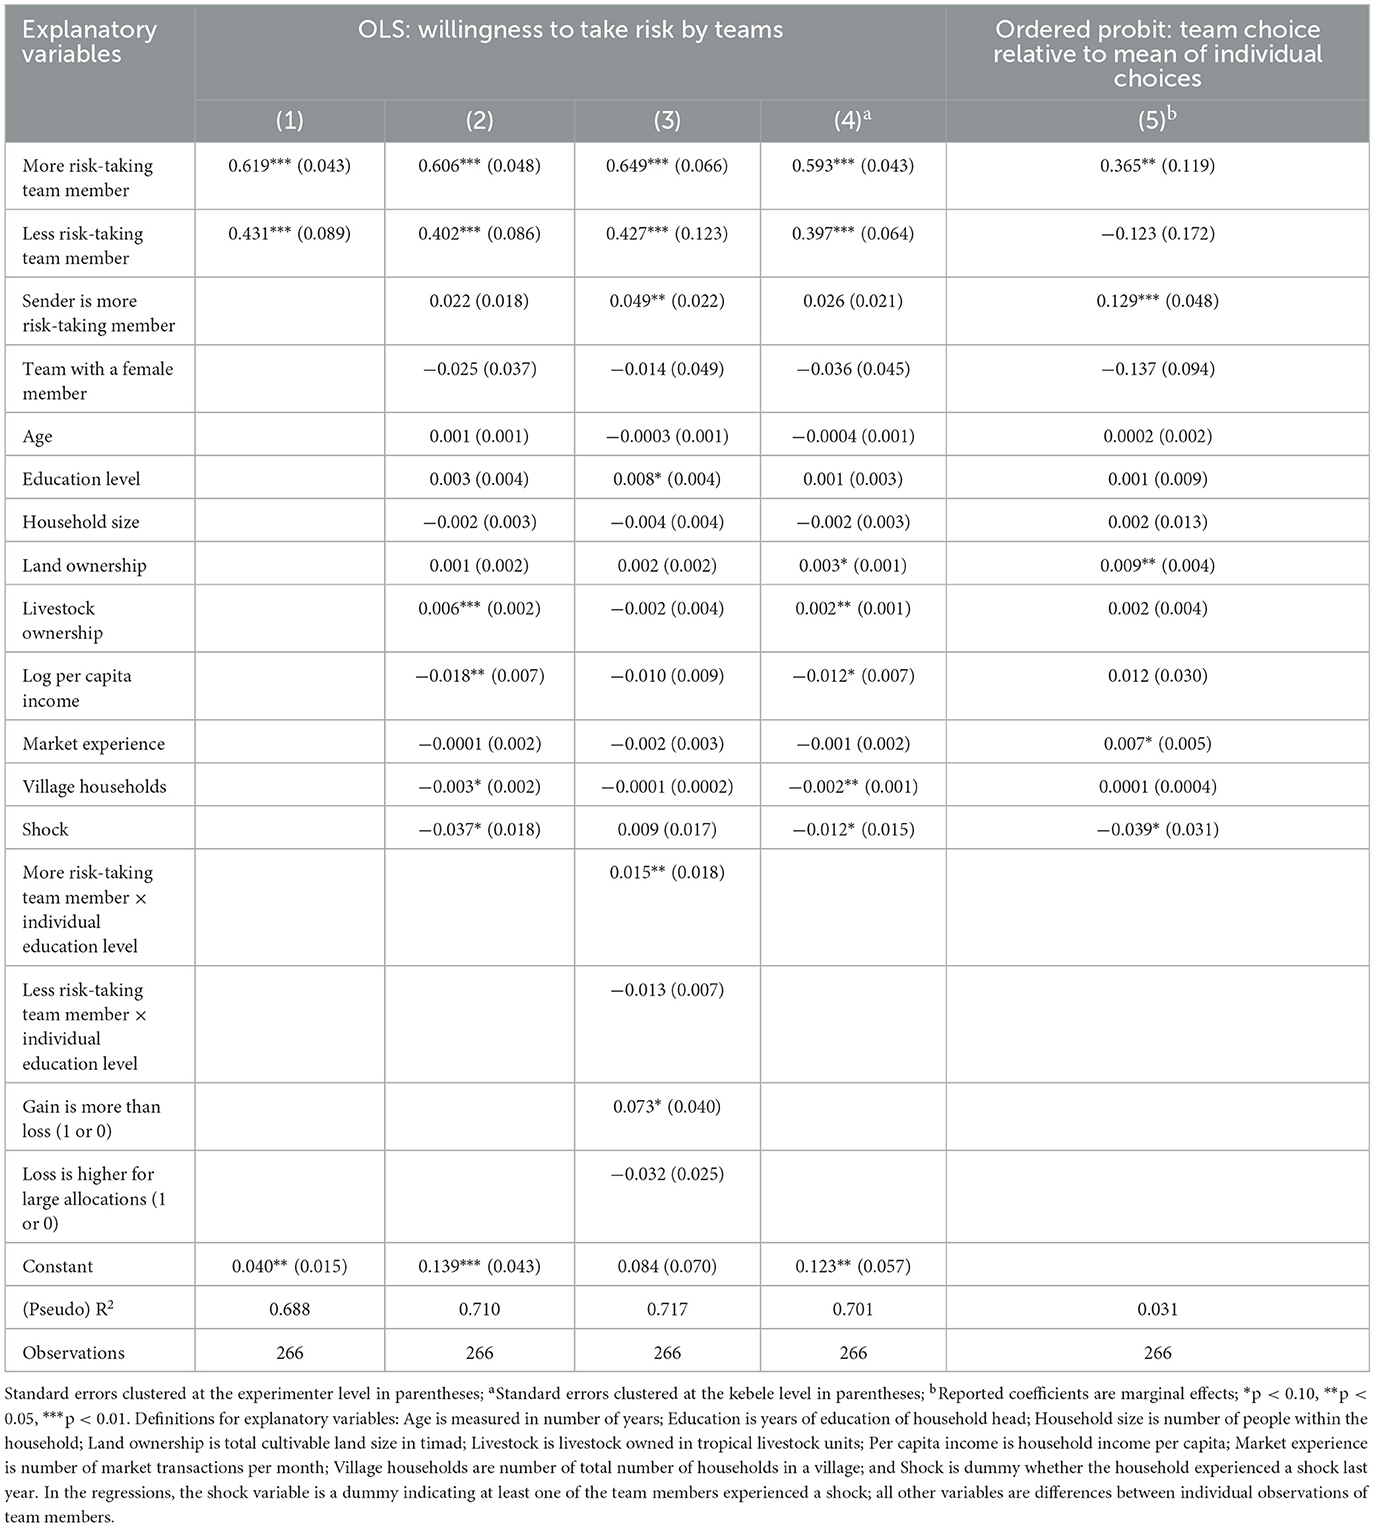
Table 3. Team choices as a function of members' individual decisions and characteristics.
Following this, we carried out post-estimation tests based on the elaborated model (2) to analyze the hypotheses related to competing preference aggregation mechanisms7. Table 4 reports the results. The test results reject both the weak and strong versions of the mean hypothesis, which suggests that team decisions are not equally weighted averages of members' decisions. This is consistent with the findings of Deck et al. (2012) and Ambrus et al. (2015). The coefficients for more risk-taking and less risk-taking members are significantly different (p < 0.1; F-statistic = 3.01). Alternatively, we cannot reject the hypothesis that the sum of the coefficients on team members' individual decisions is one. This is consistent with the team decision that varies with individual decisions is a convex combination of members' decisions, and that team decisions are outcomes of negotiation and deliberation process among members. Overall, our data support an explanation of team decision-making based on the intensity and relative influence of individual preferences, where team decisions represent an intensity weighted averaging of individual decisions.
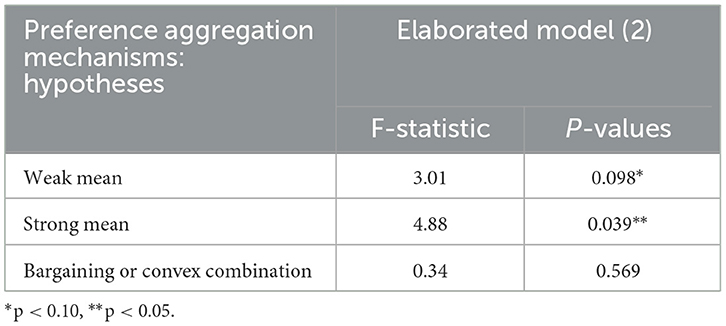
Table 4. Post-estimation hypothesis tests based on results of the elaborated model (2).
We further assess the sensitivity of these results in two ways. First, while we employed the simplest and neatest risk game in the literature8, it is plausible that some participants might have limited financial literacy to fully comprehend the experimental task, leading them to use heuristics or decide erratically, which can result in lower average investment into the risky asset. In a group decision context, less financially literate individuals might be paired with more knowledgeable counterparts, who can help guide them through the communication channel to arrive at better-informed decisions, leading the groups to use less heuristics or make fewer erratic choices. To examine this concern, we conduct further investigation into the role of education and its potential impact on the slope of effects by testing for interaction effects between individual risk-taking and education level. Additionally, we include most frequently exchanged messages during group decision-making as additional regressors to get a deeper understanding of how group communication influences decision-making (see next Section for details). “Gain is more than loss” was the most frequent argument in demanding messages to support increasing allocations to the risky asset in group communications, while ‘loss is higher for large allocations' was the most frequent argument in deferring messages to support decreasing allocations to the risky asset. We include dummies in our regression whether these arguments were mentioned during decision-making in groups. Model 3 (Table 3) provides the corresponding results. While the basic results (model 2) remain robust, the results provide additional valuable insights. The interaction between individual risk-taking and education level is significant for more risk-taking group members, supporting that the influence of more risk-taking members on the group decision is leveraged by their better education level. Evidently, more risk-taking members (mean = 3.641) had significantly more years of schooling than less risk-taking team members (mean = 1.919) (Mann–Whitney U-test; p < 0.01). Similarly, there is a higher allocation into the risky asset in groups where the argument that “gain is more than loss” was used to support more allocation into the risky asset in group decisions. This suggests that demanding messages in group communications have a stronger effect on outcomes of group decision-making. Taken together, the interpretation of these results greatly aligns with the argument that group decisions are outcomes of group bargaining and deliberation process.
Second, we reported standard errors clustered at experimenter level in the main econometric specifications. However, as outlined in Section 2, decision-making in communities is deeply embedded in their culture and social characteristics. To account for this concern, we run the main regression and report standard errors clustered at the kebele level (model 4 in Table 3). Once again, the main results remain robust for clustering standard errors at the kebele level.
Overall, the results show that more risk-taking members have greater influence on team decisions, suggesting they are more likely to lead outcomes of the team decision-making. To further assess this claim, we estimate an ordered probit model to examine what caused teams to go above or below the individual mean decisions. A team choice below the individual mean is given a value of 0 (23% of team decisions). If the two are equal, the dependent variable is 1 (10%), while it is 2 if above (67%). Table 3 (model 5) provides results of the ordered probit estimation for team choices relative to mean of individual choices. The parameter estimates for the “more risk-taking team member” and “sender is more risk-taking member” are positive and significant, supporting that more risk-taking individuals drive teams to make choices above the individual mean choices of their members. Taken together, the results suggest that more risk-taking members dominate the team decision-making process, leading to risky shifts in team choices.
To formalize this claim, we consider, for example, the following specific risk-aversion utility function:
where w is the level of income and σ is measure of risk-aversion. The higher σ means the more risk averse. Given the incentive structure of our experiment, for the problem at hand, this implies that . This function is convex for risk-averse households. Thus, for any convex combination of preference parameters, the resulting choice of x lies below the convex combination of the two original x values, i.e., x(λσ1+(1−λ)σ2) ≤ λx(σ1) + (1−λ)x(σ2). As long as farmers remain risk averse, which is supported by our experimental data, the result that team choices are more risk-taking than the ‘average' of individual choices of team members reverses this definition for any convex combination of preference parameters. As a result, we can interpret that team choices tend to be closer to choices of more risk-taking members as evidence that more risk-taking team members are more likely to dominate the team decision-making and its outcome.
Evidence on alternative interpretations and possible mechanisms that support our finding has widely been documented in the literature. One mechanism is leadership in team decision-making. Most risk-taking team members are shown to be more persuasive and influential (Hoyt and Stoner, 1968), more likely to take the lead in team decisions (Van Knippenberg et al., 2000), and more willing to make decisions on behalf of a team (Ertac and Gurdal, 2012). Another potentially relevant explanation is the rationality argument. It is expected that team discussion permits members to pool their cognitive resources to improve performance in team decisions. While the optimality of any specific decision is less likely to be demonstrable for non-intellective and subjective tasks, like risk preferences, it is possible that the expected value of each level of allocation could emerge as the objectively demonstrable criterion for the decision. If so, our experimental design is consistent with the rationality argument, since the expected return associated with a certain level of risk-taking is always higher than its expected loss. On a different note, risk-taking is valued more positively than conservatism in many communities, and the social setting in teams may generate greater risk-taking as a socially desirable outcome.
Regarding other covariates, the results in Table 3 from the most elaborated basic specification (model 2) show that risk-taking by teams is partly explained by other factors. The larger the difference in team members' livestock ownership, the greater is the willingness of teams to take more risk. Perhaps, this is because livestock ownership in rural communities is a significant buffering mechanism against household income and consumption shocks. On the other hand, differences in team members' per capita income and village population are negatively correlated with risk-taking by teams. While counterintuitive, these correlations may not be inconsistent with the context of the research communities. Income is the major criterion for extending support by social protection programs in poor communities. Usually, beneficiaries are individuals at the lower spectrum of the income distribution, leaving those poor individuals with a relatively higher income to deal with any risk on their own. Similarly, rural communities in developing countries have complex structures and often form informal insurance and risk-sharing networks based on close geographic proximity and kinship (e.g., Fafchamps and Guberg, 2007). A large population in a community may reduce trust, and hence weaken community level risk sharing mechanisms by creating risk externalities and moral hazard in mutual insurance, ultimately reducing the willingness of the community to take risk. The shock variable is negatively correlated with team risk-taking, suggesting that teams with members who experienced shock are likely to be more risk averse.
4.3 Analysis of the team decision-making process
We now turn to analyzing the team decision-making process to gain further insights into how teams come to an agreed team decision. A special focus is to understand how groups resolve disagreements and the resulting internal dynamics of team decision-making. This analysis is facilitated by the semi-structured communication strategy that provided a controlled, albeit noisy, environment for the decision-making process. As outlined, teams could only communicate by proposing choices to each other through experimenters. In case of a disagreement on the initial allocation, teams could go on deliberating by sending counter allocations to each other until agreement on a team decision was reached. Several interesting insights emerge from this analysis and are discussed below.
4.3.1 Evolution of the team decision-making process
Overall, there were 488 allocations made by teams in the team decision-making process. On average, teams made 1.83 rounds of deliberations, with a maximum of seven deliberation rounds by one team before reaching an agreement on a team decision. We first consider how team decisions are distributed in relationship with their members' individual decisions and means of individual decisions (Table 5). Table 5(a) presents classifications of team choices relative to individual decisions. About 46% of the team choices are strictly between individual decisions of team members. Conversely, about 37% of the team choices are equal to the individual choice of one or both team members. About 4% of these teams consist of homogeneous types (same individual choices), for which team choices corresponded to individual choices9. Of the 37% teams that acted according to the preferences of one of the team members, about 26% did so equal to the choices of the more risk-taking members, again providing clear evidence on the dominance of these members in the team decision-making. But the remaining 17% of team choices lie outside the range defined by individual choices, with nearly all (16%) going in the direction of the more risk-taking member. These team choices are consistent with group polarization in team decisions. Yet, collectively 83% of the team choices fall weakly within the range defined by individual choices of team members.
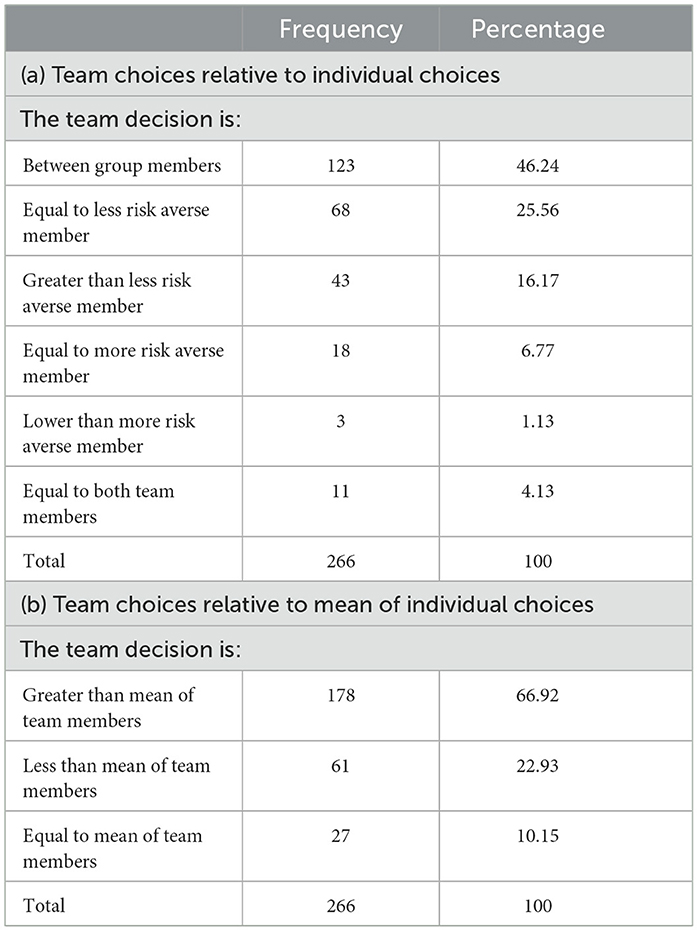
Table 5. Team choices relative to individual choices and mean of individual choices of team members.
Table 5(b) presents distributions of team choices relative to means of individual choices. Overall, about 90% of the team decisions are different from the average of individual choices, though the nature and direction of the differences vary. About 67% of team decisions are more risk-taking than the mean of individual decisions, exhibiting a “risky shift.” In contrast, about 23% of the team decisions are more risk averse than the mean of individual decisions, generating a “cautious shift.” Only 10% of the teams have decisions equal to the mean of individual decisions of their members. Importantly, a Kruskal–Wallis (non-parametric) test shows that team choices across the three mutually exclusive categories are statistically significantly different (χ2(2) = 30.337, p = 0.000). Altogether, the results indicate that about 90% of the team decisions are inconsistent with the simple averaging of individual preferences in team decisions. Instead, this evidence, combined with the absence of strong group polarization in team choices, implies that the data are generally consistent with team decisions being essentially an outcome of team bargaining and deliberation process, with more risk-taking team members driving the team decision-making.
Turning to the deliberation and decision-making process to understand how teams resolve disagreements, about 46% of the teams reached at team decisions with initial allocations. The remaining 54% of the teams disagreed with initial allocations and needed to deliberate on subsequent allocations to arrive at team decisions, with 29.7% reaching an agreement in the second round, 20.3% after a third round, 3.38% after a fourth or fifth round, and only one team reaching an agreement in the seventh round. The average number of rounds for the subsample of the teams that disagreed with initial allocations was about 3. Analysis of accepted and rejected initial allocations offers useful insights to characterize the types of initial allocations that are more likely to be accepted and those that are more likely to be rejected. Generally, Table 6 shows that accepted initial allocations involve significantly less risk (mean = 0.34) than disagreed initial allocations (mean = 0.49) (Mann–Whitney U-test; p < 0.01). Further, both immediately accepted and rejected initial allocations are significantly higher than averages of individual decisions of team members (two sample dependent t-test; p < 0.1 and p < 0.01, respectively, for teams accepting and rejecting initial allocations). But the absolute difference between team decisions and averages of individual decisions is significantly greater for groups that rejected initial allocations (mean = 0.18) than that of groups accepted initial offers (mean = 0.09) (Mann–Whitney U-test; p < 0.05).
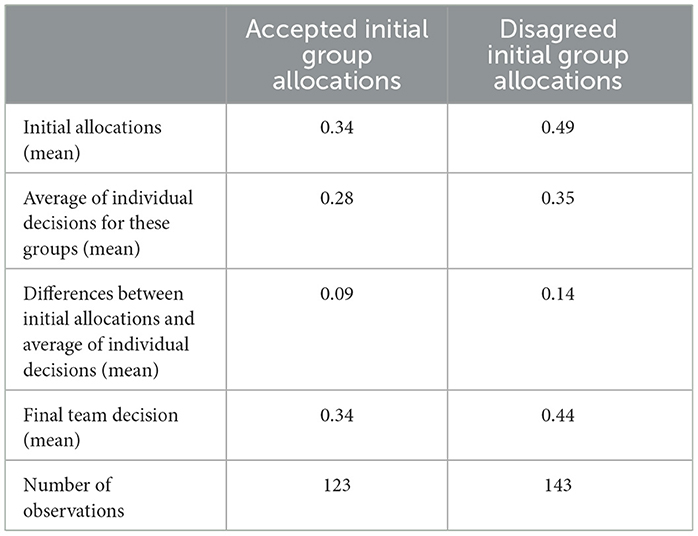
Table 6. Evolution of team decision-making from initial allocations for team decisions.
Teams who disagreed on initial allocations ultimately settle, on average, for final team decisions that are significantly different from disagreed allocations. Table 7 summarizes the information when initial allocations disagreed. Of the teams with disagreement on initial allocations, about 52% of the disagreed first allocations are in the direction of taking more risk, while for the remaining 48%, first allocations were disagreed to reduce allocations to the risky assets. Panel (a) presents mean comparisons for these decisions. Teams with disagreed initial allocations in favor of increasing allocations to the risky assets settled for significantly higher team allocations compared to disagreed initial allocations (two sample dependent t-test; p < 0.01; n = 75). Equally, teams with disagreed initial allocations in favor of reducing allocations settled for significantly lower final team decisions compared with disagreed initial allocations for these teams (two sample dependent t-test; p < 0.01; n = 68). We also conduct median comparisons to account for possible outlier effects following extremely low (high) initial allocations. The non-parametric equality-of-medians tests [panel (b) of Table 7] yield similar conclusions. Further, final team decisions reached at with acceptance of initial allocations (mean = 0.34) are significantly less than final decisions of teams that disagreed with initial allocations (mean = 0.44) (Mann–Whitney U-test; p < 0.01). Overall, these results substantiate that team decisions are indeed outcomes of bargaining and deliberation process between members rather than being the result of a simple averaging process or social facilitation in team interactions.
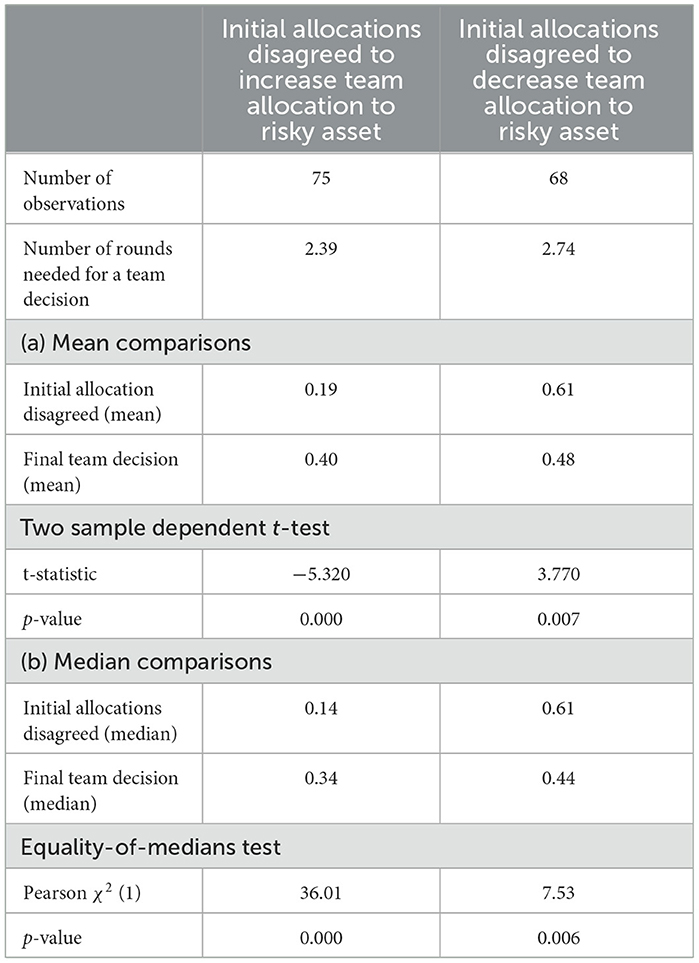
Table 7. Team decision-making when initial allocations disagreed (n = 143).
We also carried out content analysis of the arguments in messages communicated during team deliberation to gain further insights into the process of aggregating individual decisions and to understand what the driving forces are behind the team decision-making process. Proposers of initial allocations were not required to back up their allocations with an explanation. In other words, teams communicated messages only when initial allocations were disagreed. Overall, teams that disagreed with initial allocations exchanged 222 messages before reaching an agreement, with each team exchanging on average about 2 messages. The arguments were framed as demanding messages to support allocations with more risk-taking (104 messages) or deferring to justify decreasing team allocations to the risky asset (118 messages). Table 8 contains the list of the most frequently voiced (translated) arguments. The argument ‘gain is more than loss' was the most frequent argument in demanding messages to support increasing allocations to the risky asset. On the other hand, ‘loss is higher for large allocations' was the most frequent argument in deferring messages to support decreasing allocations to the risky asset.
Table 8. Main arguments in messages of team communications.
Certain regularities are observed between decisions of team members and the team decision-making process. First, more risk-taking and less risk-taking team members are equally likely to disagree with initial allocations, but for different reasons. The null hypothesis that more risk-taking and less risk-taking team members are equally likely to disagree with initial allocations cannot be rejected (binomial test; p = 0.50). The 143 disagreed initial allocations are distributed almost equally: 71 disagreements were made by more risk-taking team members, while 72 of the disagreements were by less risk-taking members. But the direction of the disagreements is remarkably different for more risk-taking and less risk-taking team members. In 67 of the 71 disagreements, more risk-taking team members made counter allocations to increase allocations to the risky assets, while 64 of the 72 disagreements by less risk-taking team members are in the direction of decreasing team allocations to the risky assets.
Second, more risk-taking and less risk-taking team members displayed different patterns of willingness to concede in the team decision-making process. In 57% of the team choices, less risk-taking team members conceded to allocations proposed by more risk-taking members to reach at team decisions. For the remaining 43% of the cases, more risk-taking team members conceded to allocations from less risk-taking members. The difference is statistically significant (Mann–Whitney U-test; p < 0.01). This indicates that less risk-taking team members are relatively more willing to change their decisions to accept team allocations, perhaps suggesting one plausible explanation for why more risk-taking team members lead the outcomes of the team decision-making. Third, the team choice is significantly further away from the average of less risk-taking members' choices than from that of the average of more risk-taking members. Team choices are significantly different from choices of both more risk-taking and less risk-taking team members (see Table 2). But the absolute value of the difference between the average of less risk-taking members' decisions and the team decision (mean = 0.210) is significantly greater than the absolute value of the difference between the average of more risk-taking members' decisions and the team decision (mean = 0.111) (Mann–Whitney U-test; p < 0.01). Once again, this confirms that more risk-taking members dominate the team decision-making process.
4.3.2 Team risk composition and team decision-making process
What role does team risk heterogeneity (i.e., the difference in risk-taking between team members) play in the team decision-making process? We formulate a set of hypotheses based on team risk heterogeneity. First, arriving at team decisions would be more difficult for teams consisting of members of different risk types. Thus, the number of deliberations needed to reach an agreement are likely to increase with the distance between individual risk choices. Second, and partly implied by the first hypothesis, teams with members of different risk types are likely to come to a team decision that strictly reflects a compromise between individual choices due to greater rounds of team bargaining and deliberation. Third, teams that start with a larger difference between individual risk choices are more likely to engage in disagreement, defined as a situation where the initial allocation was disagreed. Fourth, the difference between team choices and mean of individual choices is likely to be greater for teams consisting of members with greater differences in risk-taking.
Table 9 presents results that largely corroborate these predictions. Using a negative binomial model for allocation count, column (1) shows that the difference in risking-taking between team members is positive and significant at 1% significant level. This suggests that teams with different individual risk types require greater rounds of team bargaining and deliberation to reach at team decisions. Similarly, column (2) indicates that teams with members of different risk types are more likely to make compromised team decisions. Overall, about 46% of the teams made compromised team decisions, decisions strictly between individual choices of team members. As expected, teams making compromised decisions involve a significantly greater number of bargaining rounds (mean= 2.10) as compared with non-compromised (i.e., to mean not strictly between individual choices) team decisions (mean = 1.61).
Table 9. Team risk composition and the team decision-making process.
Column (3) presents a probit regression on the likelihood of difficulty in reaching a team agreement with the initial allocation. Predictably, the larger the difference between individual decisions, the less likely are the teams to reach team agreement immediately, and they are more likely to engage in disagreement. Finally, column (4) of Table 9 contains OLS regression for the correlation between differences in risk-taking between team members and the absolute value of differences between team choices and the mean of individual choices. The result shows that the more heterogeneous the team is, the further is the team choice from the mean of individual choices. Given more risk-taking members dominate the team decision-making, this result implies that the leverage of more risk-taking team members to influence the team choice tends to increase as team members' risk heterogeneity increases.
4.3.3 Role of the social setting in team decision-making
The social setting in team interactions may partly play a role in explaining team decisions (Charness et al., 2007). While it is important to note that our experiments are not particularly designed to test the effect of the social setting on team decisions, several observations lend some tentative support to the potential role played by the social setting in team decisions. First, senders make initial allocations (mean = 0.37) for team decisions that are significantly greater than their corresponding individual decisions (mean = 0.33) (Mann–Whitney U-test; p < 0.05; n = 266). This is particularly interesting as team members have remained anonymous in the experiment, attenuating confounding factors that might result from strategic interactions among team members. Second, some receiving team members accepted straightaway initial allocations that are significantly higher than their individual decisions. As has already been indicated, initial allocations were accepted as team decisions for 46% of the teams. On average, accepted initial allocations (mean = 0.34) for these teams are significantly greater than average individual decisions (mean = 0.28) of accepting members (Mann–Whitney U-test; p < 0.01). Third, 43 team choices fall outside the range defined by individual choices and are thus inconsistent with both simple and intensity weighted averaging and bargaining processes. Importantly, 32 of these team choices are outcomes of accepting initial allocations as team decisions.
5 Discussion and conclusion
In this paper, we analyze how individual decisions are aggregated to team decisions under risk and the relative influence of individuals on team decisions in a lab-in-the-field experiment with Ethiopian farmers as participants. Using the Gneezy-Potter task, subjects first make portfolio allocation decisions both individually and in groups of two with the same parameters. The study context and setting involve from a non-western industrial society. Another novelty is that team communications facilitated by experimenters, offering a controlled environment to understand how teams resolve disagreements and internal dynamics of team decision-making.
In the aggregate, teams make higher allocation into the risky asset compared to the average of individual decisions. Typically, team decisions neither are an equally weighted average of individual decisions nor polarize to decisions more extreme than individual choices of members. Instead, team decisions are largely an outcome of bargaining and deliberation process based on intensity of individual decisions of members. Generally, team choices lie between individual choices of team members, with a tendency to be closer to the choices of more risk-taking members. The influence of more risk-taking members on the group decision is leveraged by their better education levels, as supported by the significance of the interaction between their risk-taking and education levels. A detailed analysis of the team decision-making process reveals important insights. Overall, about 54% of the teams do not reach immediate agreement with initial allocations. Both less risk-taking and more risk-taking team members are equally likely to disagree with initial allocations but in different directions. About 94% of the disagreements initiated by more risk-taking team members were to increase allocations to the risky asset, while about 89% by less risk-taking team members were to decrease allocations to the risky asset. Importantly, teams disagreed with initial allocations settled for final team decisions that were significantly different from the disagreed initial allocations. Less risk-taking subjects are more likely to concede to allocations proposed by more risk-taking members. Demanding messages in group communications have a stronger effect on outcomes of group decision-making. Finally, teams with greater difference in risk-taking among members are more likely to disagree with initial allocations, require greater rounds of team deliberation to reach at team decisions, and make team choices further away from the average of individual decisions. While they are largely explained by individual decisions of team members, team decisions are associated with certain personal and community characteristics. Household level factors, such as livestock ownership and income, and community level variables, such as shock experience and village population, significantly correlated with team decisions. Additionally, the social setting of team interactions may have played some role in shaping the group outcome.
Overall, the results reveal that team decisions exhibited a shift toward taking more risk, generating a “risky shift” in team decisions. The “risky shift” phenomenon was documented by other studies that used the Gneezy and Potters (1997) task with standard student pool (e.g., Sutter, 2007; Bougheas et al., 2013; Nieboer, 2015). Thus, our findings extend this finding to subjects from a non-western industrial society with real incentives. But most laboratory studies using the lottery choice of Holt and Laury (2002) instead reported a “cautious shift” in group decisions (e.g., Bateman and Munro, 2005; Baker et al., 2008; Masclet et al., 2009; Sheremeta and Zhang, 2010). A few exceptions exist, such as Zhang and Casari (2012) and Brunette et al. (2015) used the Holt-Laury lottery task and found a “risky shift” in group decisions. Zhang and Casari (2012) called for a severe default rule of “no choice and zero earnings” for disagreement. Brunette et al. (2015) showed that group decisions based on the unanimity rule are significantly less risk averse than those based on the majority rule. This suggests that differences in experimental tasks, designs, decision rules, and methodologies may have played a significant role in driving differences in results.
For the development literature, the results reported in this paper have important implications for (community) decision-making by poor farm households. Risk preferences are important determinants of many economic decisions of farm households, such as adoption of new technologies, crop choices, and many other long-term investments. Poor farm households in developing countries are usually characterized by a high degree of risk aversion (e.g., Binswanger, 1980; Harrison et al., 2010), leading to risk-induced ‘poverty traps' (Dercon and Christiaensen, 2011). Our data are consistent with high levels of risk aversion amongst poor farmers. On a positive note, our findings suggest that team decision-making may help to reduce poor farmers' excessive risk aversion if implemented in contexts and types of decisions where team decision-making is likely to work effectively. Practical settings to test this hypothesis may involve comparing decisions under risk by individual farmers and their groups, such as producer organizations and farmer marketing cooperatives.
To conclude, this research has highlighted the need to understand how teams aggregate individual decisions beyond differences between individual and team decisions. More specifically, unpacking the team decision-making process can help to understand internal dynamics of team decision-making and “risky shifts” in group decisions relative to averages of individual decisions. Such understanding can inform modeling of team decision-making. This study has also demonstrated that team discussions may not routinely lead to a simple averaging of individual decisions. Perhaps, more direct comparative evidence on risk elicitation tasks is needed to explain differences in findings in the literature. Also, more work is needed to understand how incentives to internally negotiate to reach at agreed decisions and interaction rules in team communications affect team decision-making process and its outcomes. An ensuing step would be to assess effects of different team decision rules and communication characteristics that could shed additional light into the decision-making process (e.g., Brunette et al., 2015).
Data availability statement
The raw data supporting the conclusions of this article will be made available by the authors, without undue reservation.
Ethics statement
This research was conducted in the purview of the School of Social Sciences at Wageningen University & Research. The study was conducted in accordance with the local legislation and institutional requirements. The participants provided their informed consent to participate in the study.
Author contributions
MM solely contributed to conception and design of the study, organized the database, performed the statistical analysis, and wrote the manuscript.
Funding
The author gratefully acknowledges financial support for this study from the Dutch Research Council (NWO) (grant # 453-10-001).
Acknowledgments
The author is grateful to Erwin Bulte, Francesco Cecchi, Goytom Kahsay, Ian Levely, Michel Handgraaf, and Yohannes Mulu for constructive comments and suggestions. All remaining errors are my own.
Conflict of interest
The author declares that the research was conducted in the absence of any commercial or financial relationships that could be construed as a potential conflict of interest.
Publisher's note
All claims expressed in this article are solely those of the authors and do not necessarily represent those of their affiliated organizations, or those of the publisher, the editors and the reviewers. Any product that may be evaluated in this article, or claim that may be made by its manufacturer, is not guaranteed or endorsed by the publisher.
Supplementary material
The Supplementary Material for this article can be found online at: https://www.frontiersin.org/articles/10.3389/frbhe.2023.1236215/full#supplementary-material
Footnotes
1. ^US$1 was approximately equal to 18.213 Ethiopian Birr during the survey period.
2. ^.
3. ^One timad is the land area ploughed by a pair of oxen in one day, and approximately equals 0.25 hectare.
4. ^Tropical livestock unit is a common unit used to quantify a range of livestock species to a single value. We used the tropical livestock unit applicable for sub-Saharan Africa (SSA).
5. ^Six female subjects were senders of an initial allocation, while 10 female subjects played a receiver role in the initial round of team decision-making.
6. ^Risk-taking by teams is a continuous variable but censored at zero from below and at one from above, suggesting a tobit model. However, there was no actual censoring at these values. For completeness, we estimated the tobit model, and results were qualitatively similar to the OLS estimations.
7. ^Tests are done assuming a linear structural model of aggregation of individual decisions to team decisions. For brevity, we run model (2) by including non-linear (square) and interaction terms of individual preferences, but none of the terms is significant, and reported results remain qualitatively unaffected.
8. ^Charness et al. (2013) provide a review and discussion of common risk games in the literature.
9. ^There were 22 teams with members having equal individual decisions. Of these 22 teams, 11 teams made decisions that are equal to individual decisions; 10 teams made decisions greater than individual decisions; and the decision for one team was lower than individual decisions of members.
References
Ambrus, A., Greiner, B., and Pathak, P. A. (2015). How individual preferences are aggregated in groups: an experimental study. J. Pub. Econ. 129, 1–13. doi: 10.1016/j.jpubeco.2015.05.008
Baker, R. J., Laury, S. K., and Williams, A. W. (2008). Comparing small-group and individual behavior in lottery-choice experiments. Southern Econ. J. 75, 367–382. doi: 10.1002/j.2325-8012.2008.tb00909.x
Bateman, I., and Munro, A. (2005). An experiment on risky choice amongst households. Econ. J. 115, C176–C189. doi: 10.1111/j.0013-0133.2005.00986.x
Bettez, S. C. (2013). Community building in social justice work: a critical approach. Educ. Stu. 49, 45–66. doi: 10.1080/00131946.2012.749478
Binswanger, H. (1980). Attitudes toward risk: experimental measurement in rural India. Am. J. Agric. Econ. 62, 395–407. doi: 10.2307/1240194
Bougheas, S., Nieboer, J., and Sefton, M. (2013). Risk-taking in social settings: Group and peer effects. J. Econ. Behav. Org. 92, 273–283. doi: 10.1016/j.jebo.2013.06.010
Brunette, M., Cabantous, L., and Couture, S. (2015). Are individuals more risk and ambiguity averse in a group environment or alone? Results from an experimental study. Theo.y Decision 78, 357–376. doi: 10.1007/s11238-014-9432-5
Cecchi, F., and Melesse, M. B. (2016). Formal law and customary change: a lab-in-field experiment in Ethiopia. J. Econ. Behav. Org. 125, 67–85. doi: 10.1016/j.jebo.2016.01.006
Charness, G., Gneezy, U., and Imas, A. (2013). Experimental methods: eliciting risk preferences. J. Econ. Behav. Org. 87, 43–51. doi: 10.1016/j.jebo.2012.12.023
Charness, G., Karni, E., and Levin, D. (2007). Individual and group decision-making under risk: an experimental study of Bayesian updating and violations of first-order stochastic dominance. J. Risk Uncertainty 35, 129–148. doi: 10.1007/s11166-007-9020-y
Deck, C., Lee, J., Reyes, J., and Rosen, C. (2012). Risk-taking behavior: AN experimental analysis of individuals and dyads. Southern Econ. J. 79, 277–299. doi: 10.4284/0038-4038-2010.026
Dercon, S., and Christiaensen, L. (2011). Consumption risk, technology adoption and poverty traps: evidence from Ethiopia. J. Dev. Econ. 96, 159–173. doi: 10.1016/j.jdeveco.2010.08.003
Ertac, S., and Gurdal, M. Y. (2012). Deciding to decide: gender, leadership and risk-taking in groups. J. Econ. Behav. Org. 83, 24–30. doi: 10.1016/j.jebo.2011.06.009
Fafchamps, M., and Guberg, F. (2007). The formation of risk sharing networks. J. Dev. Econ. 83, 326–350. doi: 10.1016/j.jdeveco.2006.05.005
Fraser, C., Gouge, C., and Bellig, M. (1970). Risky shifts, cautious shifts, and group polarization. Eur. J. Soc. Psychol. 1, 7–30. doi: 10.1002/ejsp.2420010103
Gneezy, U., and Potters, J. (1997). An experiment on risk-taking and evaluation periods. Q. J. Econ. 112, 631–645. doi: 10.1162/003355397555217
Harrison, G., Humphrey, S., and Verschoor, A. (2010). Choice under uncertainty: evidence from Ethiopia, India and Uganda. Econ. J. 120, 80–104. doi: 10.1111/j.1468-0297.2009.02303.x
Henrich, J., Heine, S. J., and Norenzayan, A. (2010). The weirdest people in the world. Behav. Brain Sci. 33, 61–83. doi: 10.1017/S0140525X0999152X
Holt, C. A., and Laury, S. K. (2002). Risk aversion and incentive effects. Am. Econ. Rev. 92, 1644–1655. doi: 10.1257/000282802762024700
Hoyt, G. C., and Stoner, J. A. F. (1968). Leadership and group decisions involving risk. J. Exp. Soc. Psychol. 4, 275–284. doi: 10.1016/0022-1031(68)90056-5
Jehle, G. A., and Reny, P. J. (2011). Advanced Microeconomic Theory, 3rd End. Harlow England: Pearson Education Limited.
Kocher, M., Strauß, S., and Sutter, M. (2006). Individual or team decision-making: causes and consequences of self-selection. Games Econ. Behav. 56, 259–270. doi: 10.1016/j.geb.2005.08.009
Markowitz, H. (2014). Mean–variance approximations to expected utility. Eur. J. Operational Res. 234, 346–355. doi: 10.1016/j.ejor.2012.08.023
Masclet, D., Colombier, N., Denant-Boemont, L., and Loheac, Y. (2009). Group and individual risk preferences: a lottery-choice experiment with self-employed and salaried workers. J. Econ. Behav. Org. 70, 470484. doi: 10.1016/j.jebo.2007.11.002
Melesse, M. B., and Cecchi, F. (2017). Does market experience attenuate risk aversion? Evidence from landed farm households in Ethiopia. World Dev. 98, 447–466. doi: 10.1016/j.worlddev.2017.05.011
Melesse, M. B., Dabissa, A., and Bulte, E. (2018). Joint land certification programmes and women's empowerment: Evidence from Ethiopia. J. Dev. Stu. 54, 1756–1774. doi: 10.1080/00220388.2017.1327662
Moscovici, S., and Zavalloni, M. (1969). The group as a polarizer of attitudes. J. Pers. Soc. Psychol. 12, 125–135. doi: 10.1037/h0027568
Nieboer, J. (2015). Group member characteristics and risk-taking by consensus. J. Behav. Exp. Econ. 57, 81–88. doi: 10.1016/j.socec.2015.05.001
Sheremeta, R. M., and Zhang, J. (2010). Can groups solve the problem of over-bidding in contests? Soc. Choice Welfare 35, 175–197. doi: 10.1007/s00355-009-0434-0
Shupp, R. S., and Williams, A. W. (2008). Risk preference differentials of small groups and individuals. Econ. J. 118, 258–283. doi: 10.1111/j.1468-0297.2007.02112.x
Sutter, M. (2007). Are teams prone to myopic loss aversion? An experimental study on individual versus team investment behavior. Econ. Lett. 97, 128–132. doi: 10.1016/j.econlet.2007.02.031
Van Knippenberg, D., van Knippenberg, B., and Van Dijk, E. (2000). Who takes the lead in risky decision-making? Effects of group members' risk preferences and prototypicality. Org. Behav. Hum. Dec. Proc. 83, 213–234. doi: 10.1006/obhd.2000.2907
Vidmar, N. (1970). Group composition and the risky shift. J. Exp. Soc. Psychol. 6, 153–166. doi: 10.1016/0022-1031(70)90083-1
Wallach, M. A., Kogan, N., and Bem, D. J. (1964). Diffusion of responsibility and level of risk-taking in groups. J. Abnorm. Soc. Psychol. 68, 263–274. doi: 10.1037/h0042190
Keywords: group decision-making, choice under risk, risk games, decision aggregation, field experiment
Citation: Melesse MB (2023) From individual decisions to team decisions under risk: evidence from a field experiment. Front. Behav. Econ. 2:1236215. doi: 10.3389/frbhe.2023.1236215
Received: 07 June 2023; Accepted: 16 October 2023;
Published: 20 November 2023.
Edited by:
Emmanuel Dechenaux, Kent State University, United StatesReviewed by:
Jian Song, Chapman University, United StatesSteve Heinke, University of Basel, Switzerland
Copyright © 2023 Melesse. This is an open-access article distributed under the terms of the Creative Commons Attribution License (CC BY). The use, distribution or reproduction in other forums is permitted, provided the original author(s) and the copyright owner(s) are credited and that the original publication in this journal is cited, in accordance with accepted academic practice. No use, distribution or reproduction is permitted which does not comply with these terms.
*Correspondence: Mequanint B. Melesse, bWVxdWFuaW50Lm1lbGVzc2VAaWNyaXNhdC5vcmc=