 María Laura Ríos-Reyes
 Silvia Calvo-Corea1
 Oscar Brenes
- 1Department of Physiology, School of Medicine, University of Costa Rica, San José, Costa Rica
- 2Neuroscience Research Center, University of Costa Rica, San José, Costa Rica
Calcium not only contributes to changes in membrane potential but also acts as a central regulator of multiple cellular processes. Invertebrates have had a critical role throughout history as biological models for studying the nervous system at the cellular level due to the relative simplicity of their neural circuits and their high resistance to experimental manipulation. Among them, land snails of the genus Helix present the previously described characteristics while also being easy to maintain in the laboratory, and their neurons in culture reproduce in vitro their in vivo characteristics. However, the electrophysiological properties of their neurons remain incompletely characterized, and thoroughly understanding the biological model is essential to fully exploit its capabilities. To better characterize the ionic properties and distribution of the voltage-gated calcium channels (CaVs) in the serotonergic C1 neuron of Helix aspersa, we employed patch clamp recordings, calcium imaging and immunocytochemistry. Our results indicate that the C1 neuron exhibits exclusively high-voltage activated calcium currents and, according to the pharmacological dissection, these are mediated by CaV2.1 and CaV2.2-like channels. The CaV2.2-like channels were primarily localized in neurites, whereas functional varicosities, those expressing exocytic machinery, predominantly contain CaV2.1-like channels.
1 Introduction
Calcium (Ca2+) is a central regulator of multiple processes, such as phosphorylation-dependent intracellular signaling, genetic transcription, exocytosis, muscle contraction, changes in membrane potentials, and cell death (Brini et al., 2014). In neurons, Ca2+ currents through voltage-dependent calcium channels (CaVs) are particularly relevant in membrane depolarization, action potential regulation, neurotransmitter release, and synaptic plasticity (Südhof, 2012; Brini et al., 2014).
The functional diversity of Ca2+ effects correlates with CaV diversity in each cell type. These channels have been classified into three families (CaV1, CaV2, and CaV3), and in mammals, several subtypes have been described in each family, in agreement with their physiological and pharmacological characteristics (Mintz et al., 1992; Trimmer and Rhodes, 2004; Catterall, 2011; Simms and Zamponi, 2014).
Several pathologies develop when CaVs are mutated in different cells, such as epilepsy in neurons (Noebels, 2003), cardiac arrhythmias (Schwartz et al., 2020), skeletal muscle myotonic disorders (Cannon, 2015), and cancer (Cui et al., 2017). Consequently, several drugs have CaVs as their target (Cui et al., 2017; Yao et al., 2023). In addition, given its central role in cellular functioning, several animal toxins target these proteins and can be used as potential treatments (Chow et al., 2020). Because of this, CaV research is a mainstream area of study worldwide.
The pore-forming α subunit of CaV channels is highly conserved among vertebrates and invertebrates, especially in the transmembrane domains and pore regions (Jeziorski et al., 2000). Consequently, invertebrates are suitable models for studying CaVs. It has been generally accepted that invertebrates present the three distinct subfamilies (called CaV1-, CaV2-, and CaV3-like) with no further subdivisions (Tyson and Snutch, 2013; Senatore et al., 2016). However, several isoforms of each family have been described in different invertebrate models (White and Kaczmarek, 1997; Jeziorski et al., 2000; Spafford, 2003a; Senatore and Spafford, 2010; Brenes, 2022).
Land snail Helix aspersa (synonym Cornu aspersum) neurons have been extensively used in neuroscience to characterize neurotransmitter release mechanisms (Ghirardi et al., 1996; Fiumara et al., 2001), neurite outgrowth (Brenes, 2015a; Ghirardi et al., 1996), cell ionic currents, and voltages responses (Akaike et al., 1983; Brenes, 2015b; Fiumara et al., 2005; Kiss, 2003; Kiss et al., 2012; Massobrio et al., 2013) and to study pathologies derived from channel functioning, such as epilepsy (Redecker et al., 2000; Altrup and Wiemann, 2003; Altrup, 2004; Altrup et al., 2006; Giachello et al., 2013; Brenes et al., 2016; Hernández-Cáceres and Brenes, 2025).
These neurons offer several advantages for functional analysis, as specific identifiable neurons can be independently isolated and cultured, thereby avoiding the effects of surrounding tissues or synaptic inputs (Cibelli et al., 1996). Also, monosynaptic and polysynaptic connections can be reliably formed and cultured in vitro, resembling in vivo features and avoiding random connections (Fiumara et al., 2005; Massobrio et al., 2009; Giachello et al., 2010; Brenes, 2015a). In addition, these neurons enable performing complex experimental manipulations such as intra-nuclear plasmid microinjection (Brenes, 2015a), cytosolic microinjection of proteins or mRNA (Fiumara et al., 2007; Giachello et al., 2010), and intracellular recordings (Fiumara et al., 2005). Finally, it is worth remembering that the use of this type of model aligns with the Three Rs principle of Russell and Burch for ethical animal research (Tannenbaum and Bennett, 2015).
However, despite their extensive use, the electrophysiological properties of these neurons and the characterization of the ion channels they express remain incompletely understood. Thoroughly understanding a biological model, such as the serotonergic C1 neuron of the land snail Helix aspersa, is essential to fully exploit its capabilities and to obtain better results from the experiments developed.
The present study aims to describe the properties and localization of CaVs expressed in the C1 neuron of Helix, increasing our knowledge of the functioning of invertebrate calcium channels and expanding our understanding of this highly useful model for studying neuron functioning through simple organisms.
2 Materials and methods
2.1 Animals
Juvenile Helix aspersa land snails were provided by a local breeder. The animals were kept in ventilated plastic boxes, at a room temperature (RT) between 20 and 25 °C, and under a 12-h light-dark cycle. They were fed lettuce and chicken feed supplemented with calcium.
The experiments were conducted under the approval of the Institutional Animal Care and Use Committee of the University of Costa Rica (authorization CICUA-026-16).
2.2 Solutions and chemicals
A L15 solution modified for snails was used for the maintenance of the isolated C1 neurons and as the extracellular solution for the membrane potential recordings and contained (in mM): 6.974 CaCl2, 4.922 MgCl2, 0.348 MgSO4, 5.335 KCl, 0.189 KH2PO4, 66.520 NaCl, 0.574 Na2HPO4. The physiological intracellular solution used for the membrane potential recordings contained (in mM): 3 NaCl, 100 KCl, 1 MgCl2, 5 EGTA, 10 HEPES, pH 7.4 (with KOH).
The intracellular and extracellular recording solutions used to obtain calcium macrocurrents were designed to eliminate sodium and potassium currents. The extracellular recording solution was free of sodium and potassium, low in calcium, and contained (in mM): 105 tetraethylammonium (TEA), 2 CaCl2, 10 MgCl2, 10 HEPES, pH 7.4 (with CsOH). The intracellular solution was potassium-free and contained (in mM): 3 NaCl, 100 CsCl, 1 MgCl2, 10 HEPES, 5 EGTA, pH 7.4 (with CsOH).
The following final blocker concentrations were used to identify the CaVs: 10 nM ω-conotoxin CVIB (ω-CnTx CVIB), 1 µM cilnidipine (first diluted with DMSO and managed under dim light during experiments), 100 nM ω-conotoxin CVIE (ω-CnTx CVIE), and 4 µM ω-conotoxin GVIA (ω-CnTx GVIA). All the blockers were purchased from Alomone Labs (Jerusalem, Israel).
2.3 Cell culture
Cell cultures were performed as previously described by Ghirardi et al. (199) and modified by Brenes (201b). Briefly, the snails were anesthetized with a 0.1 M MgCl2 isotonic solution injected into the foot and euthanized by evisceration through shell removal. Cerebral ganglia were surgically isolated and incubated at 34 °C for 4 hours in protease type XIV (0.4 U/mL, Sigma Aldrich, United States) diluted with modified L15 solution. After enzymatic digestion, the ganglia were washed twice in modified L15 solution. C1 neurons were individually isolated based on their anatomical localization and morphology. Neurons were cultured in different settings according to experimental conditions.
2.4 Electrophysiological recordings
Neurons were transferred to dishes pretreated with 5% bovine serum albumin and filled with modified L15 solution at RT. After 24 h, the neurons acquired a soma-configuration by retracting their axons. Conventional patch clamp recordings were performed in the whole-cell configuration using a Multiclamp 700B amplifier (Molecular Devices, San Jose, CA, United States), digitally converted with the Digidata 1550B (Molecular Devices, San Jose, CA, United States), and recorded using the Clampex 11.1 software. Borosilicate pipettes with a resistance of 2–3 MΩ were pulled with a Flaming/Brown Micropipette Puller (Model P-1000, Sutter Instrument, Novato, CA, United States).
All recordings were performed at RT; only 1 cell was recorded per dish. The standard I-V protocol was performed by applying 200 ms long pulses at voltages ranging from −60 to +80 mV in 10 mV increments from a holding potential of −50 mV. Data were later analyzed using Clampfit 11.1.0.23 (Molecular Devices, San Jose, CA, United States). All currents were normalized to membrane capacitance to express them as current density.
Activation curves were constructed with conductance values calculated for each cell using Equation 1, where Vrev is the experimental reversal potential of each cell, Vm is the test membrane potential, and I is the maximal current in the analyzed potential. Later, the data were normalized to each cell’s maximal conductance (Gmax). The data were adjusted following a modified Boltzmann function (Equation 2), where Gmax is the maximum conductance, Vrev is the reversal potential, zact is the apparent gating valence, V1/2 is the voltage of half-maximal activation, F is the Faraday constant, R is the gas constant, and T the absolute temperature.
The steady-state inactivation was measured at a −10 mV and 200 ms test pulse after a pre-pulse holding potential ranging from −60 to +20 mV for 200 ms. First, the values were normalized to the maximal current of each cell. Then, the inactivation curves were constructed as a function of the pre-pulse voltage and fitted according to Equation 3, where V represents the prepulse potential,
A voltage ramp was employed to determine whether the C1 neurons express LVA and HVA CaVs. To do this, the cells were held at −50 mV, followed by the application of a depolarizing voltage ramp at a rate of 0.2 mV/ms, ranging from −80 mV to +50 mV. The number of peaks and the corresponding voltages at which these peaks occurred were recorded.
After recording the I-V curve, the inactivation protocol, and the voltage ramp in the control state, one type of calcium channel blocker was added to the extracellular medium. Twenty minutes after introducing the blocker, all the protocols were repeated to assess the blockade’s effect on calcium macrocurrents. Due to the overlapping blocking capabilities of CaV2.2 by ω-CnTx CVIE and cilnidipine, cilnidipine was added at the end of the recordings with ω-CnTx CVIE, and 20 min later, the recordings were repeated to determine the presence of CaV1 channels.
Different variables were measured to evaluate the neuronal excitability of the C1 neuron. First, the mean firing frequency (MFF) was determined as the number of action potentials (APs) fired by 500 ms depolarizing stimulations of 0.5, 1.0, and 1.5 nA of intensity. To determine the cell rheobase, 50 ms pulses of increasing amperage were applied, starting at 0.5 nA and making increments of 0.01 nA until at least three consecutive independent APs were generated at a frequency of 1 Hz. To analyze the shape of the depolarization phase, the first AP generated by a depolarizing current of 1.0 nA intensity was analyzed. The following variables were determined: AP amplitude, time elapsed from the beginning to the peak of the AP (time to peak), rise time 10–90%, rise time 0–63% (rise tau), and maximum rise slope. To analyze the shape of the repolarization phase, six APs generated by stimulating each cell with its respective rheobase value were averaged. The following variables were determined: after-hyperpolarization amplitude, decay time 100-37% (decay tau), decay slope 90-10%, and maximum decay slope. Once the Em, MFF, and rheobase were recorded in the control state, ω-CnTx CVIB was added, and all the protocols were repeated 20 minutes later to evaluate the effect of the blockade on each of these variables and the shape and behavior of the APs.
2.5 Measurement of intracellular calcium
Freshly dissociated single neurons with the initial segment of their axon were placed by well on a 96-well plate; each well was pre-coated with poly-L-lysine and Aplysia hemolymph and filled with 100 µL of modified L15 medium. Cells were grown for 72 h. The calcium imaging probe was prepared according to the manufacturer’s specifications; fluo-4 was mixed with the power load and diluted in L15 medium to a final concentration of 2 µM. 50µL of this mixture was added to each well to a final concentration of 1 µM. The plate was incubated for 30 min and measured.
Cells were analyzed using the Cytation 3 Hybrid Technology™ system, selecting the corresponding well. The magnification, LED intensity, integration time, and image gain were adjusted for each neuron and, once set, remained constant throughout the experiment. The excitation wavelength was 490 nm, and the emission wavelength was 520 nm.
For both control and treated cells, a baseline recording was performed for 1 min, followed by 1 min of vehicle recording after adding medium to rule out mechanical effects on Ca2+ influx. The control group was then exposed to KCl. The activity was induced by a sustained exposition to KCl at a final concentration of 65 mM, since this concentration has been reported to induce the activity of C1 neurons for more than 5 min (Massobrio et al., 2013). Meanwhile, the treated group was exposed to ω-CnTx GVIA (final concentration 4 µM) and incubated for 15 min before adding KCl (65 mM, as previously reported). The recording time during excitation was 5 min. Images were captured every 3–5 s for both groups.
To quantify calcium in varicosities, images were analyzed using CellProfiler Analyst™ (Broad Institute). First, all images were aligned to ensure proper overlap, templates were manually created to select recognizable varicosities, and fluorescence was measured throughout the recording in each structure. Results were presented as the change in relative fluorescence compared to baseline fluorescence (Equation 4), where F0 was the average fluorescence during the baseline recording.
The Ca2+ distribution along neurites was analyzed by calculating the targeting factor of the Ca2+ signal in the last picture of KCl treatment regarding the Ca2+ signal in the first picture of the baseline condition, following the protocol described by Brenes (2015b). Using the line profile tool in ImageJ (NIH, Bethesda, MD) in both pictures, a longitudinal line was traced along the neurites to measure fluorescence peaks and adjacent regions (valleys) along the neurite. An additional line was drawn in neighboring areas to subtract background fluorescence. Once background fluorescence was subtracted, the fluorescence intensity ratio of Ca2+ domains was calculated according to Equation 5.
2.6 Immunocytochemistry
Freshly dissociated neurons with the initial segment of their axon were cultured for 72 h in plates pre-coated with poly-L-lysine and Aplysia hemolymph. Plates were washed three times with 0.6% saline solution (10 min each) at RT. Subsequently, they were fixed with 4% paraformaldehyde in 0.1 M phosphate-buffered saline (PBS) for 45 min at RT. Following three washes with 0.01 M PBS, cells were treated with a blocking solution containing 5% bovine serum albumin (BSA) and 0.25% saponin in 0.01 M PBS for 1 hour. Cultured cells were then incubated overnight at 4 °C with rabbit polyclonal antibodies (Ab) against Ca2+ channels diluted in the blocking solution (CaV2.1: AB5152 Ab, CaV2.2: AB5154 Ab, Sigma-Aldrich, Germany) or with rabbit primary Ab against Helix synapsin (HelSyn) produced by InBios International.
Afterward, three washes were performed with 0.25% saponin in 0.01 M PBS, followed by incubation in a blocking solution with secondary goat anti-rabbit IgG TRICT T6778 (Sigma-Aldrich, Germany) or donkey anti-rabbit IgG Alexa A10040 (Life Technologies) for 45 min at RT. Three gentle washes with 0.01 M PBS were conducted for 10 min each, and samples were maintained in PBS at 4 °C until fluorescence microscopy visualization.
Cell images were captured using an inverted microscope (Olympus CKX53) equipped with optical epifluorescence. The varicosity fluorescence was quantified following the protocol described for Ca2+ fluorescence in neurites. However, autofluorescence was used to normalize volume in this case, applying the following Equation 6.
Due to their low volume, the fluorescence in neurites was not normalized; therefore, the peak-to-valley (domain) ratio was reported.
2.7 Statistical analysis
Data were expressed as mean values ±S.E.M. Statistical analysis was performed using GraphPad Prism 10 (GraphPad Software, Boston, MA, United States). The significance of the groups was assessed using parametric or non-parametric statistics, depending on the results obtained from the Shapiro-Wilk test for normality and the F-test for homogeneity of variances. When comparing only two groups, the Student's t-test, the Mann-Whitney U test or the Wilcoxon matched-pairs signed-rank test was used. When comparing more than two groups or groups with variations over time, two-way ANOVA was performed, followed by the Bonferroni post hoc test, repeated measures ANOVA or mixed-effects model where appropriate, or the Kruskal–Wallis test, followed by Dunn’s multiple comparisons test. Significance levels were set at p < 0.05.
3 Results
3.1 Analysis of Ca2+ macrocurrents
The current-voltage (I-V) relationship of the whole Ca2+ current is illustrated in Figure 1A. The Helix Ca2+ current was activated at −40 mV and peaked typically between −20 mV and 0 mV (n = 49). The activation curve showed a high voltage dependence (Figure 1B, black circles) with an absolute k value of 1.2 ± 0.3, and the activation V1/2 determined by the Boltzmann equation of individual activation curves was −27.2 ± 1.3 mV (n = 42). The analysis of the steady-state inactivation of the Ca2+ macrocurrents showed partial inactivation and a small voltage dependency (Figure 1B, white squares). Fitting each individual inactivation curve to the Boltzmann equation yielded a V1/2 value of −16.9 ± 1.5 mV and a k value of 7.4 ± 0.5 (n = 37).
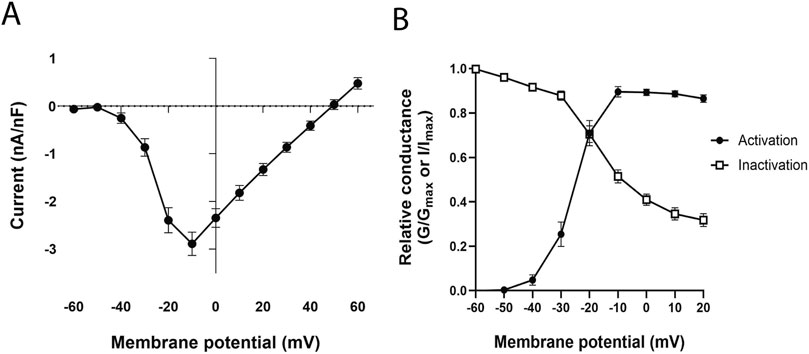
Figure 1. Ca2+ current analysis. (A) Current-voltage (I–V) relationship of Ca2+ macrocurrents. (B) Activation and steady-state inactivation curves of Ca2+ macrocurrents, G/Gmax for the activation curve and I/Imax for the inactivation curve. Each data was reported as mean ± SEM.
3.2 Identification of the Ca2+ channels involved in the macrocurrents
Using a voltage ramp from −80 mV to +50 mV (Figure 2, lower panel), it was determined that only HVA CaV channel populations were involved in the macrocurrents of the C1 neuron. All cells presented a single current peak at a membrane potential of −12.32 ± 0.89 mV (n = 43) (Figure 2, upper panel), suggesting the absence of LVA CaV3-like channels.
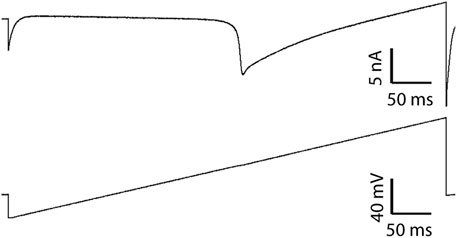
Figure 2. Ca2+ current recording elicited by a ramp stimulus. The upper panel shows a representative Ca2+ current evoked by the voltage ramp in the lower panel.
A pharmacological dissection was performed using channel blockers to identify the HVA CaV types contributing to the Ca2+ macrocurrents. Initially, the ω-CnTx CVIB was used to determine the presence of CaV2.1 and CaV2.2-like channels. Application of the ω-CnTx CVIB produced a strong reduction in the peak inward currents at most of the voltages tested (n = 7) (voltages F(12, 78) = 6.29, p < 0.0001, treatment F(1, 74) = 25.10, p < 0.0001, interaction F(12, 74) = 2.51, p = 0.008, mixed-effects model) (Figure 3A). There was not a significant change in the Vrev after CnTx treatment (control = 35.0 ± 9.8 mV vs. ω-CnTx CVIB = 21.8 ± 16.0 mV, n = 6; t (5) = 1.007, p = 0.36, paired t-test) In addition, the maximum Ca2+ current decreased by 63.2% compared to controls (control = −1.89 ± 0.53 nA/nF vs. ω-CnTx CVIB = −0.70 ± 0.21 nA/nF, n = 6; W = 21, p = 0.031, r = 0.34, Wilcoxon matched-pairs signed-rank test) (Figure 3B).
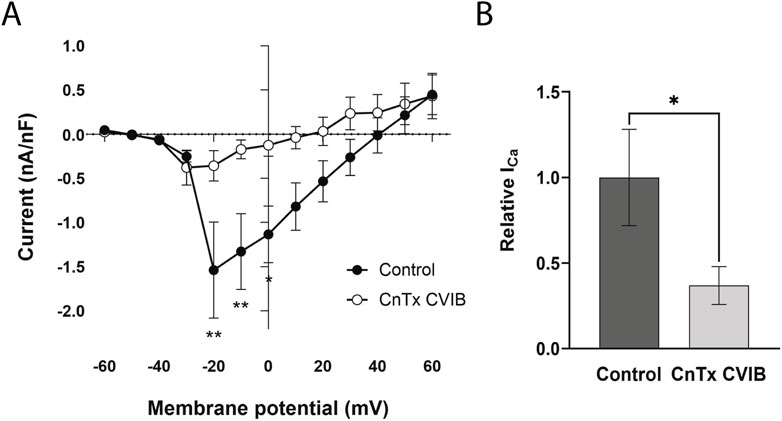
Figure 3. Effect of a CaV2.1 and CaV2.2 blocker on Ca2+ currents. (A) I-V curve in control state (●) and 20 min after adding ω-conotoxin CVIB (CnTx CVIB, ○). (B) Relative maximum Ca2+ current. Each data was reported as mean ± SEM. *p < 0.05, **p < 0.005.
The ω-CnTx CVIE was used to specifically identify the presence of currents mediated by Cav2.2-like channels. Application of this inhibitor significantly reduced the Ca2+ inward currents between −10 and 50 mV (n = 7) (Figure 4A, open circles). Following these recordings and assuming CaV2.2-like channels were blocked, cilnidipine was added to the bath to assess the contribution of Cav1-like channels to the remaining current. After 20 min of cilnidipine application, no further significant reduction in current was observed compared with that in the presence of ω-CnTx CVIE alone (n = 7) (voltage F(2.13, 12.77) = 26.82, p < 0.0001, treatment F(1.11, 6.66) = 20.95, p = 0.0026, interaction F(1.84, 11.04 = 3.90, p = 0.055, two-way ANOVA) (Figure 4A).
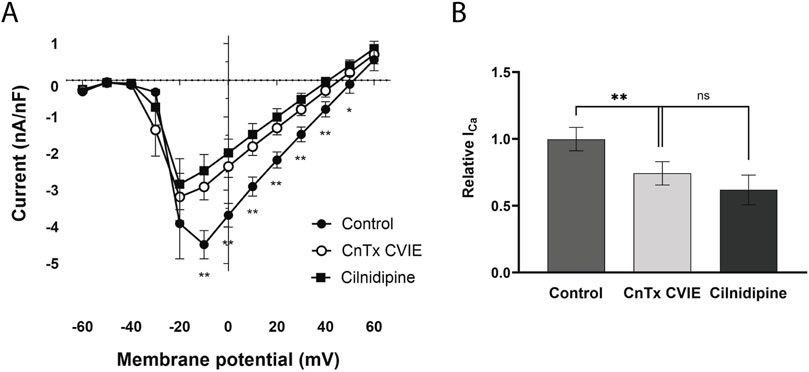
Figure 4. Effect of a CaV2.2 and a CaV1-CaV2.2 blocker on Ca2+ currents. (A) I-V curve in control state (●), 20 min after adding ω-conotoxin CVIE (CnTx CVIE, ○) and 20 min after adding cilnidipine (■) to the same cells. (B) Relative maximum Ca2+ current. Each data was reported as mean ± SEM. *p < 0.05, **p < 0.005 comparing the effect of the CnTx CVIE with control state.
Similarly, ω-CnTx CVIE reduced the maximum Ca2+ current by 25.6%, changing from −5.15 ± 0.5 nA/nF to −3.83 ± 0.45 nA/nF (p = 0.006, n = 7). Since the effect of ω-CnTx CVIB is stronger than the effect of ω-CnTx CVIE, these results suggest that both CaV2.1-like and CaV2.2-like channels are present in the C1 neuron and contribute substantially to the macroscopic Ca2+ current. Even though, 20 min after cilnidipine exposition, an additional 12.6% reduction in the maximum Ca2+ current was observed (−3.19 ± 0.6 nA/nF), this change was not statistically significant (p = 0.15, n = 7) (F(1.12, 6.70) = 16.86, p = 0.0044, one-way repeated measures ANOVA) (Figure 4B). These results suggest that CaV1-like channels, if present, do not play a significant role in the Ca2+ current of the C1 neuron in Helix.
3.3 Immunocytochemical confirmation of CaV2.1 and CaV2.2-like channels presence and differential localization
In order to confirm the existence of different CaV2 isoforms, we used antibodies against CaV2.1 and CaV2.2. Since Ca2+ is the main signal evoking neurotransmitter release, we started analyzing varicosities. To quantify the percentage of mature varicosities vs. silent varicosities, we marked Helix synapsin (HelSyn) with a custom-designed antibody (Figure 5A, upper panels and middle panel insert), obtaining that in control cells 65.5 ± 4.34% (n = 15) of the varicosities have the exocytic machinery (Figure 5B).
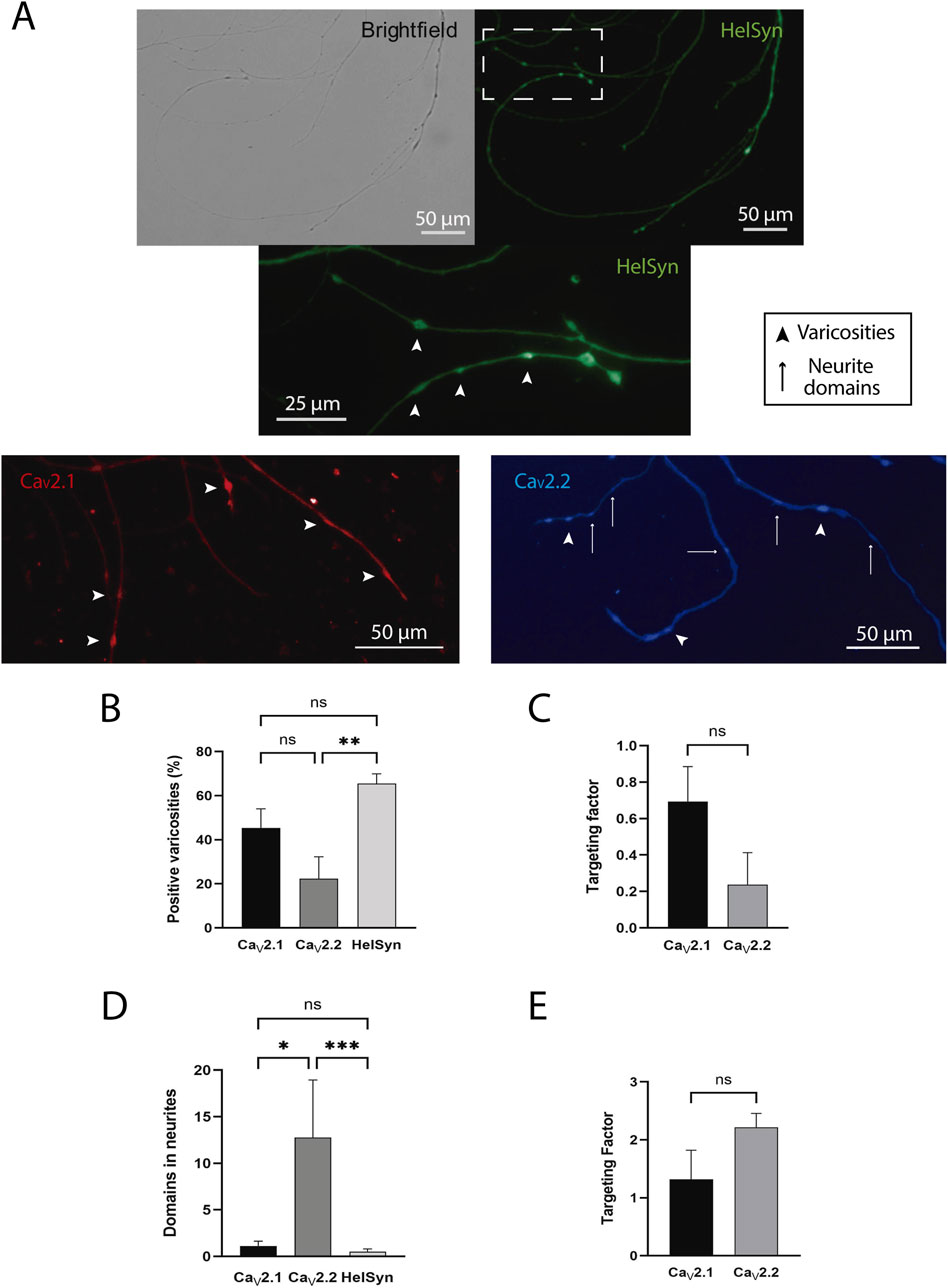
Figure 5. HelSyn, CaV2.1, and CaV2.2 localization. (A) Brightfield and representative staining of HelSyn is shown in the upper panels; the zone marked with dashed lines is shown as a zoomed insert in the middle panel. Representative staining of CaV2.1 and CaV2.2 is shown in the lower left and right panels, respectively. Arrowheads mark some varicosities, and arrows mark neurite domains. Scale bars representing 25 or 50 µm were present. (B) Varicosities positive for CaV2.1, CaV2.2, and Helix synapsin (HelSyn). (C) Targeting factors of CaVs in the varicosities. (D) Number of neurite domains per cell for CaV2.1, CaV2.2, and HelSyn. (E) Targeting factors of CaVs in the neurites. Data was reported as mean ± SEM. *p < 0.05, **p < 0.01, ***p < 0.001.
Different cells were used to test the presence of CaV2.1 and CaV2.2 channels (Figure 5A, lower panels). When varicosities were analyzed, the percentage of varicosities positive for CaV2.1 (45.38 ± 8.67%, n = 8) was statistically similar to those positive for HelSyn (p = 0.09). On the other hand, the percentage of varicosities positive for CaV2.2 (22.40 ± 9.90%, n = 4) were smaller than for HelSyn (p = 0.002) (Figure 5B). Although there was a trend towards a higher percentage of varicosities with CaV2.1, no significant differences were found (p = 0.211) (F(2, 24) = 8.34, p = 0.0018, one-way ANOVA).
Since both antibodies marked these structures, we analyzed the targeting factor of each channel in the positive varicosities, and no significant differences were found in varicosities regarding the presence of CaV2.1 and CaV2.2 channels. Nevertheless, a trend towards a higher localization of CaV2.1 can be observed with a targeting factor of 0.69 ± 0.19 (n = 8) for CaV2.1 and 0.24 ± 0.17 (n = 4) for CaV2.2 (U = 5, p = 0.07) (Figure 5C).
From these two measurements, we can derive that not all the varicosities have the exocytic machinery, and they predominantly contain CaV2.1, although some may also have CaV2.2.
The presence of domains for both CaV2.1 and CaV2.2 was also observed in neurites. Interestingly, the number of domains per cell was higher for CaV2.2 (12.75 ± 6.20) than for CaV2.1 (1.13 ± 0.52) (p = 0.033). Also, as expected, almost no domains for HelSyn were observed (0.53 ± 0.28) (Figure 5D). It is worth noting that the number of domains with HelSyn was similar to CaV2.1 domains (p = 0.8861) but differed from CaV2.2 domains (p = 0.0008) (H3,31 = 13.27, p = 0.0013, Kruskal–Wallis). In addition, when comparing the targeting factor of the channels in the neurites, it was found that the targeting factor of CaV2.2 was almost twice that of CaV2.1 (2.22 ± 0.29 vs. 1.32 ± 0.50, respectively); however, this difference was not statistically significant (U = 13.0, p = 0.64) (Figure 5E).
All together, these data suggest that varicosities predominantly contain CaV2.1, which would likely be functional varicosities. In addition, CaV2.2 is more localized in neurites, with no neurotransmitter release sites.
3.4 Role of CaV2.2-like channels in Ca2+ kinetics
The predominant expression of CaV2.2-like channels in neurites compared to varicosities could be related to different contributions of this channel to Ca2+ kinetics within these structures. To test this hypothesis, we performed Ca2+ imaging during KCl-induced neuronal activity in the absence and presence of ω-CnTx GVIA, a specific CaV2.2 blocker.
When analyzing the distribution of Ca2+ in varicosities during 5 min of neural activity, we observed different fluorescence patterns among varicosities over time. For this reason, the varicosities were grouped according to their behavior patterns, and the three most frequent patterns were analyzed.
In the constant behavior pattern (Figure 6A), an increase in intracellular Ca2+ was observed in the varicosities after adding KCl, which remained constant throughout the recording period (from minutes 2–7) (n = 5). The varicosities of the cells treated with ω-CnTx GVIA (n = 6) exhibited a behavior similar to that of the control group (time F(2.52, 22.1) = 28.2, p < 0.0001; treatment F(1, 9) = 0.11, p = 0.74; interaction F(85, 745) = 0.41, p > 0.99, two-way ANOVA).
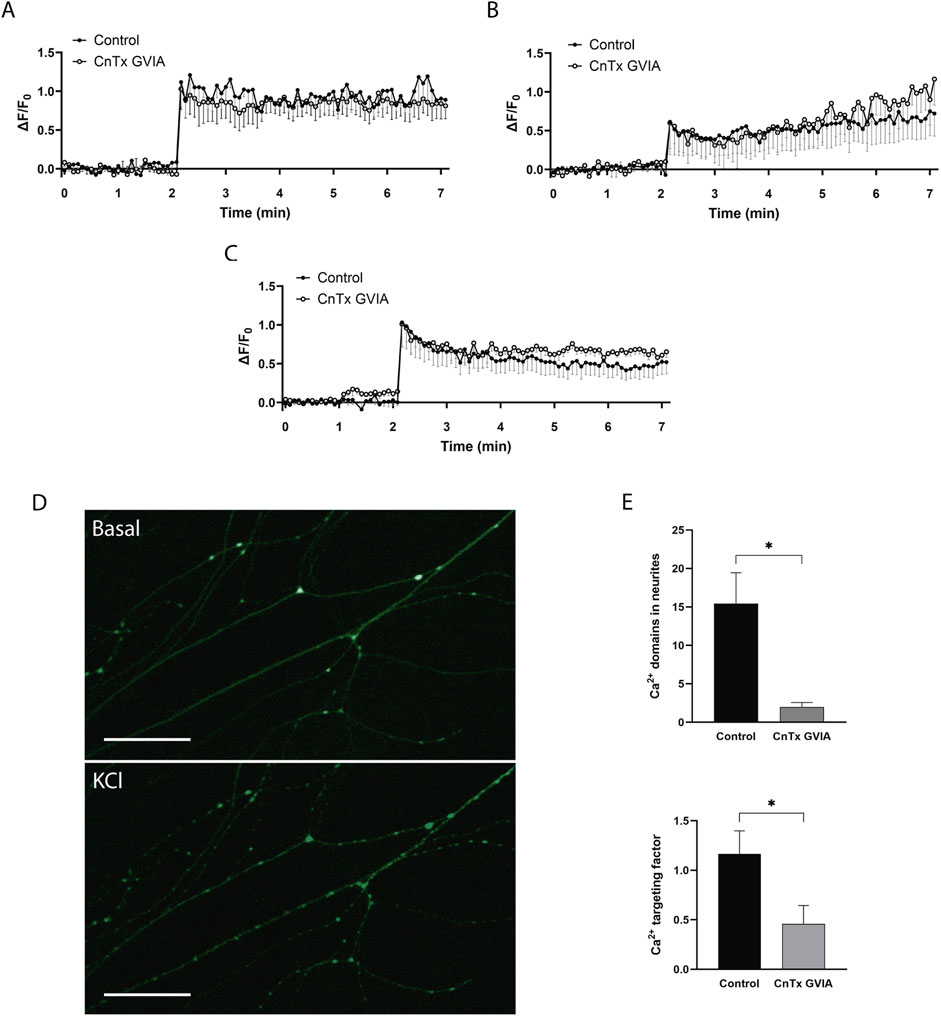
Figure 6. Ca2+ imaging under CaV2.2 blocker exposition. (A), (B), and (C) show three different behaviors observed in Ca2+ kinetics on varicosities in the absence (Control, ●) or presence of ω-conotoxin GVIA (CnTx GVIA, ○). (D) Representative picture of the Ca2+ domains along neurites during KCl-induced activity (lower panel) regarding basal condition (upper panel). Scale bar = 100 µm. (E) Effect of CaV2.2-like inhibition on the number of Ca2+ domains present in cellular neurites (upper panel) and the targeting factor of the ion in the present domains (lower panel). Data was reported as mean ± SEM. *p < 0.05.
Figure 6B shows the ascending linear behavior pattern in which, after adding KCl, Ca2+ increased continuously in a linear fashion throughout the 5 min of recording (n = 4). In the same way, varicosities treated with ω-CnTx GVIA (n = 4) showed a statistically similar behavior (time F(1.79, 10.2) = 17.9, p = 0.0053; treatment F(1, 6) = 0.125, p = 0.73; interaction (85, 483), p = 0.99; two-way ANOVA).
In addition, some varicosities showed a fast increase in the Ca2+ signal after KCl addition, followed by a decrease in fluorescence intensity (Figure 6C) (n = 6). Similar to the former two behaviors, ω-CnTx GVIA treatment did not affect signal behavior (n = 4) (time F(1.91, 15) = 19.4, p < 0.0001; treatment F(1, 8) = 0.443, p = 0.52; interaction F(85, 667) = 0.46, p > 0.99; two-way ANOVA).
These results suggest that even if some varicosities express CaV2.2-like channels, their contribution to the presence of Ca2+ in these structures is not significant.
On the other hand, when we analyzed the number of Ca2+ domains along neurites during neuronal activity (Figure 6D), a substantial decrease was evident after CaV2.2-like inhibition with ω-CnTx GVIA (t(17) = 2.84, p = 0.011) (Figure 6E, upper panel). In addition, in the observed domains, the targeting factor of the Ca2+ signal decreased after CaV2.2-like inhibition (t(17) = 2.24, p = 0.039; respectively) (Figure 6E, lower panel). This suggests that, contrary to what was observed in varicosities, CaV2.2-like channels play an important role in the Ca2+ influx in neurites, evoking Ca2+ microdomains.
3.5 Role of CaV2.1 and CaV2.2-like channels in action potentials
It is known that APs in C1 neurons are dependent on both Na+ and Ca2+, and CaV2.2-like channels were mostly observed in sites not related to neurotransmitter release. Therefore, CaV2.1 and CaV2.2-like channels may contribute to AP firing. The blocker that had the most significant effect on Ca2+ currents was the ω-CnTx CVIB, and for this reason, it was used to examine the role of these channels on neuronal excitability.
The MFF in response to increasing stimuli did not show significant changes after exposure to ω-CnTx CVIB (0.5 nA: 2.53 ± 0.79 Hz; 1.0 nA: 7.33 ± 1.03 Hz; 1.5 nA: 9.47 ± 1.23 Hz; n = 15 in controls; vs. 0.5 nA: 2.86 ± 1.50 Hz; 1.0 nA: 7.71 ± 1.87 Hz; 1.5 nA: 11.71 ± 2.11 Hz; n = 7 with ω-CnTx CVIB) (stimulus F(3, 80) = 31.41, p < 0.0001, treatment F(1, 80) = 0.76, p = 0.39, interaction F(3, 80) = 0.36, p = 0.78, two-way ANOVA). However, a small not significant trend to a decreased MFF can be observed (Figure 7A).
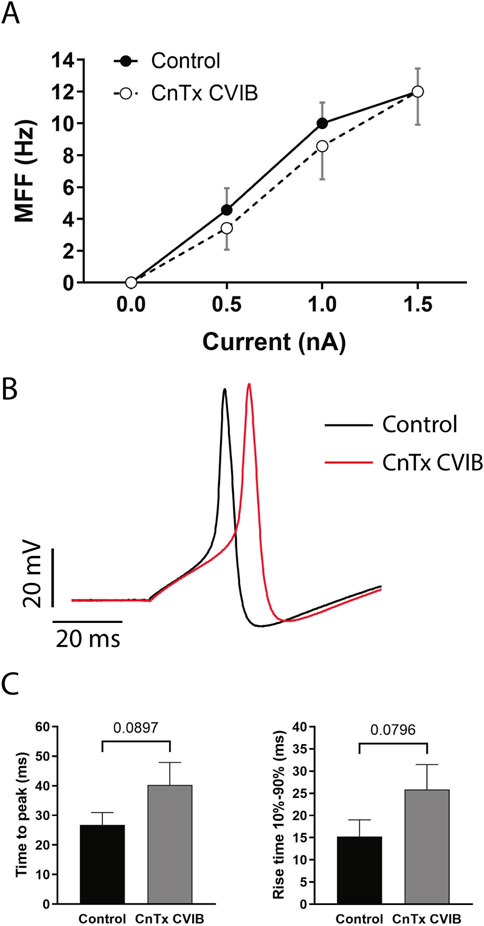
Figure 7. Action potential effects. (A) The mean firing frequency (MFF) was plotted as a function of stimulus intensities. (B) Representative recording of action potentials evoked by 1 nA current injection before (Control) and 30 min after ω-conotoxin CVIB (CnTx CVIB) exposition. (C) Time to the action potential peak (left panel) and rise time between 10% and 90% of total depolarization before (Control) and 30 min after ω-CnTx CVIB exposition. Each data was reported as mean ± SEM.
When the AP waveform was analyzed (Figure 7B), the exposure to ω-CnTx CVIB induced a small trend on the verge of statistical significance, increasing the time to peak from 26.75 ± 4.21 ms (n = 4) in controls to 40.25 ± 7.62 ms (n = 4) after ω-CnTx CVIB exposure (t(3) = 2.47, p = 0.0897, paired t-test) (Figure 7C, left panel). Similarly, a small increase in the rise time 10–90% was observed (15.24 ± 3.79 ms, n = 4 in controls; vs. 25.84 ± 5.64 ms, n = 4 with ω-CnTx CVIB) (t(3) = 2.61, p = 0.0796, paired t-test) (Figure 7C, right panel). This slowing of depolarization could be related to the slightly smaller MFF. No changes or trends were observed in resting membrane potential, rheobase, AP amplitude, rise tau, maximum rise slope, after-hyperpolarization amplitude, decay tau, decay slope 90-10%, or maximum decay slope (data not shown).
4 Discussion
4.1 Calcium macrocurrents in the C1 neuron
The calcium macrocurrents of the C1 neuron of Helix aspersa were activated at −40 mV, with the current peak between −20 mV and 0 mV and a reversal potential of +53.1 ± 3.54 mV. These values are comparable to those previously reported in Helix neurons (Brenes, 2015a) and in other species; for example, mature mouse motoneurons, when low or physiological calcium concentrations were used (1–3 mM), activated at −40 mV, with the current peak between −10 and 0 mV and with a reversal potential of +40 mV (Carlin et al., 2000). In motoneurons and sensory neurons of lampreys, the current activation started between −40 and −30 mV (El Manira and Bussie, 1997). In rat chromaffin cells, the current activation started at −40 mV, peaked at 0 mV, and reverted between +50 and +60 mV (Gandía et al., 1995).
In our study, the activation curve presented a pronounced slope between −50 and 0 mV, which indicates a high voltage dependence between those potentials. The calcium macrocurrents presented a half inactivation potential of −16.9 ± 1.5 mV. This value is similar to what has been reported for LCaV1a in Lymnaea stagnalis (V1/2 = −15 mV) (Spafford et al., 2006), but more positive than what has been reported for LCaV2 in the same species (V1/2 = −39.3 mV) and in rat CaV2.2 (V1/2 = −49.1 mV) (Senatore and Spafford, 2010). The inactivation slope (k = 7.4 ± 0.5) was comparable to the one observed in mouse motoneurons (k = 7.0) (Carlin et al., 2000) and in LCaV2a in L. stagnalis (k = 8.0) (Spafford, 2003b).
The calcium macrocurrents of the C1 neurons of Helix aspersa have incomplete inactivation. This finding matches what has been reported on neurons from the suboesophageal ganglia of the same species, where it was determined that the inactivation was voltage and calcium-dependent (Brown et al., 1981). We cannot exclude the possibility that in our study, the degree of inactivation could be affected by the presence of EGTA in the intracellular medium, as this calcium chelator could avoid the possibility of calcium-dependent inactivation to take place (Hille, 2001). However, since partial inactivation was evident from the first recordings at the beginning of the experiments, it is unlikely that it had significantly affected the observed currents. It is known that the C1 neuron APs are dependent on sodium, calcium, and potassium currents (Brenes, 2015a). So, functionally, an incomplete inactivation of the CaV could induce an increase in the duration of the calcium currents and affect the morphology of the AP and the excitability of the cell.
4.2 Calcium channels in the C1 neuron
A ramp protocol was used to identify the population of CaV according to their voltage of activation. All the cells in the study presented only one current peak at a membrane potential of −12.32 ± 0.89 mV (n = 43). This finding suggests that the C1 neuron of Helix aspersa in whole-cell configuration expresses only HVA channels in the plasma membrane. This finding differs from what has been reported in the giant cerebral neuron of L. stagnalis where, while using a similar protocol but with axotomized somata, two different peak currents were observed, suggesting the presence of LVA and HVA channels (Staras et al., 2002).
A pharmacological dissection was used to identify the types of HVA channels present in the C1 neuron. When the cells were exposed to ω-CnTx CVIB, a broad-spectrum blocker that inhibits CaV2.1 and CaV2.2 in mammals (Lewis et al., 2000), a 63.2% reduction of the calcium macrocurrents was observed. To determine if the C1 cell expresses one or both subtypes of channels, the cells were exposed to ω-CnTx CVIE, a highly selective CaV2.2 channel blocker. This blocker induced a 25.6% reduction of the calcium macrocurrents. Considering that the reduction of the currents with ω-CnTx CVIE was considerably less than the reduction induced by ω-CnTx CVIB, it could be suggested that the C1 neurons express both CaV2.1 and CaV2.2-like channels.
After blocking CaV2.2 channels, a subset of cells were exposed to cilnidipine, an organic compound that blocks CaV1 and CaV2.2 channels (Uneyama et al., 1997). No significant differences were observed in either the I–V curves or the peak currents, suggesting that CaV1-like channels are not functionally expressed in the plasma membrane of C1 neurons.
Unlike mammals, it has been argued that invertebrates only have one type of CaV1, CaV2, and CaV3, based mainly on studies made with Lymnaea stagnalis. However, our work and studies carried out by Azanza et al. (2008), Battonyai et al. (2014), and Kiss et al. (2012) proved the existence of different subtypes of voltage-gated channels. Specifically, Azanza et al. (2008) first reported the existence of CaV2.1 and CaV2.2 channels in Helix; subsequently, our differences in current inhibition between the CaV2.1 and 2.2 blocker ω-CnTx CVIB and the specific CaV2.2 blocker ω-CnTx CVIE supported the existence of two different isoforms of CaV2 in Helix neurons. This was confirmed by using antibodies against these two channels, where a slightly different distribution in the labeling was evident.
Despite no significant differences, CaV2.1 was the predominant channel in varicosities, doubling the number of CaV2.2 positive varicosities, and the number of positive varicosities for CaV2.1 better matches the positive varicosities containing presynaptic machinery (Figure 5B). In addition, this was supported by the targeting factor analysis, which tends toward a greater presence of CaV2.1 over CaV2.2 in these structures (Figure 5C).
Since some varicosities expressed CaV2.2, we measured the Ca2+ kinetics in these structures in the presence of a CaV2.2 inhibitor (ω-CnTx GVIA). Following KCl stimulation, we observed Ca2+ increased regardless of ω-CnTx GVIA treatment (Figures 6A–C), confirming the hypothesis that CaV2.1 are the dominant channels in varicosities, and CaV2.2 channels do not play a major role in Ca2+ functions in these structures. In consequence, CaV2.1 is likely involved in synaptic functions and neurotransmitter release (Hilfiker et al., 1999).
Interestingly, the Ca2+ curve trends displayed different behavioral patterns after the KCl application. In some varicosities, Ca2+ increased and remained constant (Figure 6A); in others, it continued to rise throughout the recording period (Figure 6B), and in some of them, it decreased over time (Figure 6C). It is known that Ca2+ behavior over time varies depending on the stimulus, and this behavior modulates different neuronal responses. However, most studies of this type are conducted in millisecond-scale recordings (Grienberger and Konnerth, 2012; Martens et al., 2014). In this study, due to equipment limitations preventing image capture at intervals shorter than 3 s, recordings ranged from 3 to 5 s, providing a broader temporal perspective.
Under physiological conditions, depolarization through APs leads to the opening of CaV channels, resulting in increased intracellular Ca2+. This suggests that the different behavior patterns are related to distinct firing patterns in neurites and their varicosities. In varicosities where Ca2+ increases and remains constant throughout the recording period, the AP firing frequency is likely stable, with Ca2+ influx through CaVs being balanced by its removal via pumps and transporters. In varicosities where intracellular Ca2+ increases throughout the recording, it may indicate a higher firing frequency and Ca2+ influx exceeding the removal capacity of pumps and transporters. Finally, in varicosities where Ca2+ initially increases but declines towards the end of the recording, this could be attributed to firing rate adaptation or, alternatively, to inactivation of Ca2+ channels facilitating intracellular accumulation, such as CaVs, or increased activity of pumps and transporters promoting Ca2+ clearance from the cytosol (Peterson et al., 1999).
Conversely, in neurites, although no significant differences in the targeting factor between CaV2.1 and CaV2.2 were observed (Figure 5E), results showed a trend toward greater CaV2.2 presence in these structures. Additionally, the number of CaV2.2 domains in neurites was greater than for CaV2.1 (Figure 5D). Aligned with this, intracellular Ca2+ analysis in neurites revealed aggregation sites alongside some neurites and the application the CaV2.2 inhibitor ω-CnTx GVIA resulted in a decrease in both the targeting factor and the number of Ca2+ domains per cell (Figure 6E). These results suggest that Ca2+ domain formation in neurites primarily involves CaV2.2-like channels.
CaV2 studies and their functions have been conducted mainly in vertebrate models, particularly mammals. In mollusks of the genera Lymnaea and Aplysia, CaV2-like channels have been reported, sharing high similarity with mammalian channels (Brenes, 2022). LCaV2 also exhibit functions similar to mammalian channels in mediating neurotransmitter release (Fossier et al., 1994; Kits and Mansvelder, 1996; Senatore and Spafford, 2010) and have been studied using neuromodulators commonly employed in mammalian research, yielding similar results (Fossier et al., 1994; Hong and Lnenicka, 1997). The role of CaV2.1 and CaV2.2 in initiating neurotransmitter release in rat and mouse cells is well-documented (Catterall, 2011). These channels interact with SNARE complex proteins at the intracellular loop connecting domains II and III, facilitating vesicular exocytosis (Catterall, 2011). However, postnatal development studies indicate that cooperative CaV2.1 and CaV2.2 coupling shifts to CaV2.1 nanodomains initiating synaptic vesicle exocytosis (Baur et al., 2015; Cingolani et al., 2023). Furthermore, the distance between CaV2.1 and the Ca2+ sensor responsible for synaptic vesicle release (synaptotagmin) determines synaptic strength (Dittman and Ryan, 2019; Cingolani et al., 2023), and their interaction promotes synaptic facilitation, a short-term plasticity process (Mochida et al., 2008). These reinforce the idea that although both channels participate in neurotransmitter release, CaV2.1 plays the primary role, as our results suggest.
On the other hand, CaV2.2 channels and their N-type currents have been characterized in various mammalian neurons, notably dorsal root ganglion neurons involved in pain transmission (Heinke et al., 2004; Adams and Berecki, 2013). These channels regulate neurotransmitter release and synaptic plasticity and, interestingly, have been observed in postsynaptic terminals, contributing to graded potentials (Heinke et al., 2004; Adams and Berecki, 2013). In addition, CaV2.2 presence in neurites has been reported in Xenopus laevis embryonic neurons (Sann et al., 2008), which may explain CaV2.2 predominance in Helix neurites, suggesting a role in Ca2+ domains and APs.
The role of CaV2.1 and CaV2.2 channels on cell excitability was evaluated by taking as markers the resting potential, rheobase, and firing frequency in response to stimuli of increasing intensity. No significant effect was observed in any of the variables, suggesting that, under normal conditions, basal calcium currents do not contribute significantly to the excitability of these neurons. However, it has been reported that, under pathological conditions, an increase in these currents significantly influences neuronal excitability (Brenes, 2015b; Brenes et al., 2016).
When blocking CaV2.1 and CaV2.2 channels with the ω-CnTx CVIB, a slight tendency toward an increased duration of the depolarization was observed in C1 neurons. These results could suggest that channel blockade has a greater effect on the final third of the depolarization phase, since there was no difference between the depolarization taus between cells in the control state and cells in the presence of ω-CnTx CVIB, but a tendency toward an increase in the time to peak was observed. The partial blockade of calcium channels by ω-CnTx CVIB, which appeared to modestly influence the depolarization phase of C1 neuron APs, aligns with previous reports indicating that depolarization in Helix C1 neurons depends on both sodium and calcium currents. Furthermore, in this same study, it was reported that an increase in calcium currents was related to an increase in potassium outward currents through BK channels (Brenes, 2015b). This factor could explain why a reduction in calcium inward currents could cause repolarization to start later, since the opening of BK channels would be delayed.
4.3 Conclusions
Combining all the results, a picture emerges where C1 serotonergic neurons expressed CaV2-like channels. Two CaV2 isoforms were observed, with more significant CaV2.1 presence in the neurotransmitter release structures (varicosities) and more significant CaV2.2 presence in neurites. Ca2+ increase was evident in varicosities and neurites during cellular activity; CaV2.1 can be related to Ca2+ dynamics in the varicosities, controlling neurotransmitter release; and CaV2.2 can be associated with AP firing in neurites and probably in varicosities.
Data availability statement
The raw data supporting the conclusions of this article will be made available by the authors, without undue reservation.
Ethics statement
The animal study was approved by Institutional Animal Care and Use Committee of the University of Costa Rica. The study was conducted in accordance with the local legislation and institutional requirements.
Author contributions
MR-R: Conceptualization, Data curation, Formal Analysis, Investigation, Methodology, Resources, Writing – original draft, Writing – review and editing. SC-C: Data curation, Formal Analysis, Methodology, Visualization, Writing – original draft, Writing – review and editing. OB: Conceptualization, Data curation, Formal Analysis, Funding acquisition, Investigation, Methodology, Project administration, Resources, Supervision, Writing – original draft, Writing – review and editing.
Funding
The author(s) declare that financial support was received for the research and/or publication of this article. This study was supported by grants from the Vicerrectoría de Investigación of the University of Costa Rica to OB, and from FEES-CONARE to Laura Monturiol and OB Sources were not involved in study design, analysis, manuscript writing, or publishing.
Acknowledgments
We thank Laura Monturiol for her valuable support on calcium imaging experiments, Evelyn Artavia for her technical support in data analysis, and Carlos Madrigal and the García family for Helix supply.
Conflict of interest
The authors declare that the research was conducted in the absence of any commercial or financial relationships that could be construed as a potential conflict of interest.
Generative AI statement
The author(s) declare that no Generative AI was used in the creation of this manuscript.
Any alternative text (alt text) provided alongside figures in this article has been generated by Frontiers with the support of artificial intelligence and reasonable efforts have been made to ensure accuracy, including review by the authors wherever possible. If you identify any issues, please contact us.
Publisher’s note
All claims expressed in this article are solely those of the authors and do not necessarily represent those of their affiliated organizations, or those of the publisher, the editors and the reviewers. Any product that may be evaluated in this article, or claim that may be made by its manufacturer, is not guaranteed or endorsed by the publisher.
References
Adams, D. J., and Berecki, G. (2013). Mechanisms of conotoxin inhibition of N-type (cav2.2) calcium channels. Biochimica Biophysica Acta - Biomembr. 1828 (7), 1619–1628. doi:10.1016/j.bbamem.2013.01.019
Akaike, N., Brown, A. M., Dahl, G., Higashi, H., Isenberg, G., Tsuda, Y., et al. (1983). Voltage-dependent activation of potassium current in Helix neurones by endogenous cellular calcium. J. Physiology 334, 309–324. doi:10.1113/jphysiol.1983.sp014496
Altrup, U. (2004). Epileptogenicity and epileptic activity: mechanisms in an invertebrate model nervous system. Curr. drug targets 5, 473–484. doi:10.2174/1389450043345344
Altrup, U., and Wiemann, M. (2003). Paroxysmal depolarization shifts (PDS) induce non-synaptic responses in neighboured neurons (buccal ganglia, helix pomatia). Brain Res. 972 (1–2), 186–196. doi:10.1016/S0006-8993(03)02532-0
Altrup, U., Häder, M., Cáceres, J. L. H., Malcharek, S., Meyer, M., and Galla, H. J. (2006). Epileptogenic drugs in a model nervous system: electrophysiological effects and incorporation into a phospholipid layer. Brain Res. 1122 (1), 65–77. doi:10.1016/j.brainres.2006.09.021
Azanza, M. J., Pérez-Castejón, C., Pes, N., Pérez-Bruzón, R. N., Aisa, J., Junquera, C., et al. (2008). Characterization by immunocytochemistry of ionic channels in helix aspersa suboesophageal brain ganglia neurons. Histology Histopathol. 23 (4), 397–406. doi:10.14670/HH-23.397
Battonyai, I., Krajcs, N., Serfőző, Z., Kiss, T., and Elekes, K. (2014). Potassium channels in the central nervous system of the snail, helix pomatia: localization and functional characterization. Neuroscience 268, 87–101. doi:10.1016/j.neuroscience.2014.03.006
Baur, D., Bornschein, G., Althof, D., Watanabe, M., Kulik, A., Eilers, J., et al. (2015). Developmental tightening of cerebellar cortical synaptic influx-release coupling. J. Neurosci. 35 (5), 1858–1871. doi:10.1523/JNEUROSCI.2900-14.2015
Brenes, O. (2022). “Invertebrate neurons as a simple model to study the hyperexcitable state of epileptic disorders in single cells, monosynaptic connections, and polysynaptic circuits,” in Biophysical reviews. Springer Science and Business Media Deutschland GmbH, 553–568.
Brenes, O., Vandael, D., Carbone, E., Montarolo, P., and Ghirardi, M. (2015a). Knock-down of synapsin alters cell excitability and action potential waveform by potentiating BK and voltage-gated Ca2+ currents in Helix serotonergic neurons. Neuroscience 311, 430–443. doi:10.1016/j.neuroscience.2015.10.046
Brenes, O., Giachello, C. N. G., Corradi, A. M., Ghirardi, M., and Montarolo, P. G. (2015b). Synapsin knockdown is associated with decreased neurite outgrowth, functional synaptogenesis impairment, and fast high-frequency neurotransmitter release. J. Neurosci. Res. 93 (10), 1492–1506. doi:10.1002/jnr.23624
Brenes, O., Carabelli, V., Gosso, S., Romero, A., Carbone, E., Montarolo, P. G., et al. (2016). Subconvulsant doses of pentylenetetrazol uncover the epileptic phenotype of cultured synapsin-deficient Helix serotonergic neurons in the absence of excitatory and inhibitory inputs. Epilepsy Res. 127, 241–251. doi:10.1016/j.eplepsyres.2016.09.008
Brini, M., Calì, T., Ottolini, D., and Carafoli, E. (2014). Neuronal calcium signaling: function and dysfunction. Cell. Mol. Life Sci. 71 (15), 2787–2814. doi:10.1007/s00018-013-1550-7
Brown, A. M., Morimoto, K., Tsuda, Y., and Wilson, D. L. (1981). Calcium current-dependent and voltage-dependent inactivation of calcium channels in helix aspersa. J. Physiology 320, 193–218. doi:10.1113/jphysiol.1981.sp013944
Cannon, S. C. (2015). Channelopathies of skeletal muscle excitability. Compr. Physiol. 5 (2), 761–790. doi:10.1002/cphy.c140062
Carlin, K. P., Jiang, Z., and Brownstone, R. M. (2000). Characterization of calcium currents in functionally mature mouse spinal motoneurons. Eur. J. Neurosci. 12, 1624–1634. doi:10.1046/j.1460-9568.2000.00050.x
Catterall, W. A. (2011). Voltage-gated calcium channels. Cold Spring Harb. Perspect. Biol. 3, a003947–23. doi:10.1101/cshperspect.a003947
Chow, C. Y., Absalom, N., Biggs, K., King, G. F., and Ma, L. (2020). Venom-derived modulators of epilepsy-related ion channels. Biochem. Pharmacol. 181 (May), 114043. doi:10.1016/j.bcp.2020.114043
Cibelli, G., Ghirardi, M., Onofri, F., Casadio, A., Benfenati, F., Montarolo, P. G., et al. (1996). Synapsin-like molecules in Aplysia punctata and helix Pomatia: identification and distribution in the nervous system and during the formation of synaptic contacts in vitro. Eur. J. Neurosci. 8, 2530–2543. doi:10.1111/j.1460-9568.1996.tb01547.x
Cingolani, L. A., Thalhammer, A., Jaudon, F., Muià, J., and Baj, G. (2023). Nanoscale organization of CaV2.1 splice isoforms at presynaptic terminals: implications for synaptic vesicle release and synaptic facilitation. Biol. Chem. 404 (10), 931–937. doi:10.1515/hsz-2023-0235
Cui, C., Merritt, R., Fu, L., and Pan, Z. (2017). Targeting calcium signaling in cancer therapy. Acta Pharm. Sin. B 7 (1), 3–17. doi:10.1016/j.apsb.2016.11.001
Dittman, J. S., and Ryan, T. A. (2019). The control of release probability at nerve terminals. Nat. Rev. Neurosci. 20 (3), 177–186. doi:10.1038/s41583-018-0111-3
Fiumara, F., Onofri, F., Benfenati, F., Montarolo, P., and Ghirardi, M. (2001). Intracellular injection of synapsin I induces neurotransmitter release in C1 neurons of helix pomatia contacting a wrong target. Neuroscience 104 (1), 271–280. doi:10.1016/s0306-4522(01)00063-x
Fiumara, F., Leitinger, G., Milanese, C., Montarolo, P., and Ghirardi, M. (2005). In vitro formation and activity-dependent plasticity of synapses between helix neurons involved in the neural control of feeding and withdrawal behaviors. Neuroscience 134 (4), 1133–1151. doi:10.1016/j.neuroscience.2005.05.021
Fiumara, F., Milanese, C., Corradi, A., Giovedì, S., Leitinger, G., Menegon, A., et al. (2007). Phosphorylation of synapsin domain A is required for post-tetanic potentiation. J. cell Sci. 120 (Pt 18), 3228–3237. doi:10.1242/jcs.012005
Fossier, P., Baux, G., and Tauc, L. (1994). N- and P-type Ca2+ channels are involved in acetylcholine release at a neuroneuronal synapse: only the N-type channel is the target of neuromodulators. Proc. Natl. Acad. Sci. 91 (11), 4771–4775. doi:10.1073/pnas.91.11.4771
Gandía, L., Borges, R., Albillos, A., and Garca, A. G. (1995). Multiple calcium channel subtypes in isolated rat chromaffin cells. Pfl gers Archiv Eur. J. Physiology 430 (1), 55–63. doi:10.1007/BF00373839
Ghirardi, M., Casadio, A., Santarelli, L., and Montarolo, P. G. (1996). Aplysia hemolymph promotes neurite outgrowth and synaptogenesis of identified helix neurons in cell culture. Invertebr. Neurosci. 2 (1), 41–49. doi:10.1007/BF02336659
Giachello, C. N. G., Fiumara, F., Giacomini, C., Corradi, A., Milanese, C., Ghirardi, M., et al. (2010). MAPK/Erk-dependent phosphorylation of synapsin mediates formation of functional synapses and short-term homosynaptic plasticity. J. cell Sci. 123, 881–893. doi:10.1242/jcs.056846
Giachello, C. N. G., Premoselli, F., Montarolo, P. G., and Ghirardi, M. (2013). Pentylenetetrazol-induced epileptiform activity affects basal synaptic transmission and short-term plasticity in monosynaptic connections. PloS one 8 (2), e56968. doi:10.1371/journal.pone.0056968
Grienberger, C., and Konnerth, A. (2012). Imaging calcium in neurons. Neuron 73 (5), 862–885. doi:10.1016/j.neuron.2012.02.011
Heinke, B., Balzer, E., and Sandkühler, J. (2004). Pre- and postsynaptic contributions of voltage-dependent Ca2+ channels to nociceptive transmission in rat spinal lamina I neurons. Eur. J. Neurosci. 19 (1), 103–111. doi:10.1046/j.1460-9568.2003.03083.x
Hernández-Cáceres, L. J., and Brenes, O. (2025). The membrane origin of epileptic - related paroxysms: numerical experiments to model the transition from a pacemaker potential to paroxysmal depolarization shifts in the absence of synaptic inputs. Biophys. Rev. doi:10.1007/s12551-025-01284-z
Hilfiker, S., Pieribone, V. A., Czernik, A. J., Kao, H. T., Augustine, G. J., and Greengard, P. (1999). Synapsins as regulators of neurotransmitter release. Philosophical Trans. R. Soc. Lond. Ser. B, Biol. Sci. 354, 269–279. doi:10.1098/rstb.1999.0378
Hong, S. J., and Lnenicka, G. A. (1997). Characterization of a P-type calcium current in a crayfish motoneuron and its selective modulation by impulse activity. J. Neurophysiology 77 (1), 76–85. doi:10.1152/jn.1997.77.1.76
Jeziorski, M. C., Greenberg, R. M., and Anderson, P. A. V. (2000). The molecular biology of invertebrate voltage-gated Ca2+ channels. J. Exp. Biol. 203 (5), 841–856. doi:10.1242/jeb.203.5.841
Kiss, T. (2003). Evidence for a persistent Na-conductance in identified command neurones of the snail, helix pomatia. Brain Res. 989 (1), 16–25. doi:10.1016/S0006-8993(03)03316-X
Kiss, T., László, Z., and Pirger, Z. (2012). Cellular localization and kinetic properties of Na V1.9-Na V1.8-and Na V1.7-like channel subtypes in helix pomatia. Neuroscience 203, 78–90. doi:10.1016/j.neuroscience.2011.11.045
Kits, K. S., and Mansvelder, H. D. (1996). Voltage gated calcium channels in molluscs: classification, Ca2+ dependent inactivation, modulation and functional roles. Invertebr. Neurosci. 2 (1), 9–34. doi:10.1007/BF02336657
Lewis, R. J., Nielsen, K. J., Craik, D. J., Loughnan, M. L., Adams, D. A., Sharpe, I. A., et al. (2000). Novel ω-Conotoxins from Conus catus discriminate among neuronal calcium channel subtypes. J. Biol. Chem. 275 (45), 35335–35344. doi:10.1074/jbc.M002252200
Manira, A. E., and Bussières, N. (1997). Calcium channel subtypes in lamprey sensory and motor neurons. J. Neurophysiology 78 (3), 1334–1340. doi:10.1152/jn.1997.78.3.1334
Martens, M. A., Boesmans, W., and Vanden Berghe, P. (2014). Calcium imaging at kHz frame rates resolves millisecond timing in neuronal circuits and varicosities. Biomed. Opt. Express 5 (8), 2648. doi:10.1364/boe.5.002648
Massobrio, P., Tedesco, M., Giachello, C., Ghirardi, M., Fiumara, F., and Martinoia, S. (2009). Helix neuronal ensembles with controlled cell type composition and placement develop functional polysynaptic circuits on micro-electrode arrays. Neurosci. Lett. 467 (2), 121–126. doi:10.1016/j.neulet.2009.10.019
Massobrio, P., Giachello, C. N., Ghirardi, M., and Martinoia, S. (2013). Selective modulation of chemical and electrical synapses of Helix neuronal networks during in vitro development. BMC Neurosci. 14 (1), 22. doi:10.1186/1471-2202-14-22
Mintz, I. M., Adams, M. E., and Bean, B. P. (1992). P-type calcium channels in rat central and peripheral neurons. Neuron 9 (1), 85–95. doi:10.1016/0896-6273(92)90223-Z
Mochida, S., Few, A. P., Scheuer, T., and Catterall, W. A. (2008). Regulation of presynaptic CaV2.1 channels by Ca2+ sensor proteins mediates short-term synaptic plasticity. Neuron 57 (2), 210–216. doi:10.1016/j.neuron.2007.11.036
Noebels, J. L. (2003). The biology of epilepsy genes. Annu. Rev. Neurosci. 26 (1), 599–625. doi:10.1146/annurev.neuro.26.010302.081210
Peterson, B. Z., DeMaria, C. D., and Yue, D. T. (1999). Calmodulin is the Ca2+ sensor for Ca2+-dependent inactivation of L-type calcium channels. Neuron 22 (3), 549–558. doi:10.1016/S0896-6273(00)80709-6
Redecker, C., Altrup, U., Hoppe, D., Düsing, R., and Speckmann, E. J. (2000). Effects of valproate derivatives I. Neuropharmacology 39 (2), 254–266. doi:10.1016/S0028-3908(99)00100-8
Sann, S. B., Xu, L., Nishimune, H., Sanes, J. R., and Spitzer, N. C. (2008). Neurite outgrowth and in vivo sensory innervation mediated by a Ca v2.2-laminin β2 stop signal. J. Neurosci. 28 (10), 2366–2374. doi:10.1523/JNEUROSCI.3828-07.2008
Schwartz, P. J., Ackerman, M. J., Antzelevitch, C., Bezzina, C. R., Borggrefe, M., Cuneo, B. F., et al. (2020). Inherited cardiac arrhythmias. Nat. Rev. Dis. Prim. 6 (1), 58–49. doi:10.1038/s41572-020-0188-7
Senatore, A., and Spafford, J. D. (2010). Transient and big are key features of an invertebrate T-type channel (LCa3) from the central nervous system of Lymnaea stagnalis. J. Biol. Chem. 285 (10), 7447–7458. doi:10.1074/jbc.M109.090753
Senatore, A., Raiss, H., and Le, P. (2016). Physiology and evolution of voltage-gated calcium channels in early diverging animal phyla: cnidaria, placozoa, porifera and ctenophora. Front. Physiology 7 (481), 481. doi:10.3389/fphys.2016.00481
Simms, B. A., and Zamponi, G. W. (2014). Neuronal voltage-gated calcium channels: structure, function, and dysfunction. Neuron 82 (1), 24–45. doi:10.1016/j.neuron.2014.03.016
Spafford, J. D., Munno, D. W., van Nierop, P., Feng, Z. P., Jarvis, S. E., Gallin, W. J., et al. (2003a). Calcium channel structural determinants of synaptic transmission between identified invertebrate neurons. J. Biol. Chem. 278 (6), 4258–4267. doi:10.1074/jbc.M211076200
Spafford, J. D., Chen, L., Feng, Z. P., Smit, A. B., and Zamponi, G. W. (2003b). Expression and modulation of an invertebrate presynaptic calcium channel α1 subunit homolog. J. Biol. Chem. 278 (23), 21178–21187. doi:10.1074/jbc.M302212200
Spafford, J. D., Dunn, T., Smit, A. B., Syed, N. I., and Zamponi, G. W. (2006). In vitro characterization of L-Type calcium channels and their contribution to firing behavior in invertebrate respiratory neurons. J. neurophysiology 95, 42–52. doi:10.1152/jn.00658.2005
Staras, K., Gyögy, J., and Kemenes, G. (2002). Voltage-gated ionic currents in an identified modulatory cell type controlling molluscan feeding. Eur. J. Neuroscience2 15 (1), 109–119. doi:10.1046/j.0953-816x.2001.01845.x
Sudhof, T. C. (2012). Calcium control of neurotransmitter release. Cold Spring Harb. Perspect. Biol. 4 (1), a011353. doi:10.1101/cshperspect.a011353
Tannenbaum, J., and Bennett, B. T. (2015). ‘Russell and Burch’s 3Rs then and now: the need for clarity in definition and purpose. J. Am. Assoc. Laboratory Animal Sci. JAALAS 54 (2), 120–132.
Trimmer, J. S., and Rhodes, K. J. (2004). Localization of voltage-gated ion channels in Mammalian brain. Annu. Rev. Physiology 66 (1), 477–519. doi:10.1146/annurev.physiol.66.032102.113328
Tyson, J. R., and Snutch, T. P. (2013). Molecular nature of voltage-gated calcium channels: structure and species comparison. WIREs Membr. Transp. Signal 2, 181–206. doi:10.1002/wmts.91
Uneyama, H., Takahara, A., Dohmoto, H., Yoshimoto, R., Inoue, K., and Akaike, N. (1997). Blockade of N-type Ca 2 + current by cilnidipine (FRC-8653) in acutely dissociated rat sympathetic neurones. Br. J. Pharmacol. 122, 37–42. doi:10.1038/sj.bjp.0701342
White, B. H., and Kaczmarek, L. K. (1997). Identification of a vesicular pool of calcium channels in the bag cell neurons of Aplysia californica. J. Neurosci. 17 (5), 1582–1595. doi:10.1523/jneurosci.17-05-01582.1997
Keywords: voltage-gated calcium channels, invertebrate neurons, Helix aspersa, Cornu aspersum, calcium imaging, patch clamp
Citation: Ríos-Reyes ML, Calvo-Corea S and Brenes O (2025) Identification of voltage-gated calcium currents in Helix (Cornu) serotonergic neurons, subcellular localization, and role in calcium dynamics and cellular firing of CaV2.1 and CaV2.2 subtypes. Front. Biophys. 3:1652466. doi: 10.3389/frbis.2025.1652466
Received: 23 June 2025; Accepted: 16 September 2025;
Published: 02 October 2025.
Edited by:
Andrew Frank, The University of Iowa, United StatesReviewed by:
Bruce Allen Bamber, University of Toledo, United StatesShrinivasan Raghuraman, University of Utah Health, United States
Copyright © 2025 Ríos-Reyes, Calvo-Corea and Brenes. This is an open-access article distributed under the terms of the Creative Commons Attribution License (CC BY). The use, distribution or reproduction in other forums is permitted, provided the original author(s) and the copyright owner(s) are credited and that the original publication in this journal is cited, in accordance with accepted academic practice. No use, distribution or reproduction is permitted which does not comply with these terms.
*Correspondence: María Laura Ríos-Reyes, bWFyaWEucmlvc3JleWVzQHVjci5hYy5jcg==; Oscar Brenes, b3NjYXIuYnJlbmVzX2dAdWNyLmFjLmNy
†Present address: María Laura Ríos-Reyes, Neurophysiology, Institute of Neurophysiology, Hannover Medical School, Hannover, Germany