 Leice Gonçalves Amurin1
 Poliane Neves De Oliveira1,2
 Ana Flávia Tavares S. Pereira1,2Nirvana Cecília Ribeiro1,3
 Daniel Bastos De Rezende1,2
 Glaura Goulart Silva1,2*
- 1Technology Center in Nanomaterials and Graphene (CTNano/UFMG), Belo Horizonte, Brazil
- 2Federal University of Minas Gerais (UFMG), Belo Horizonte, Brazil
- 3Federal Center for Technological Education of Minas Gerais (CEFET-MG), Belo Horizonte, Brazil
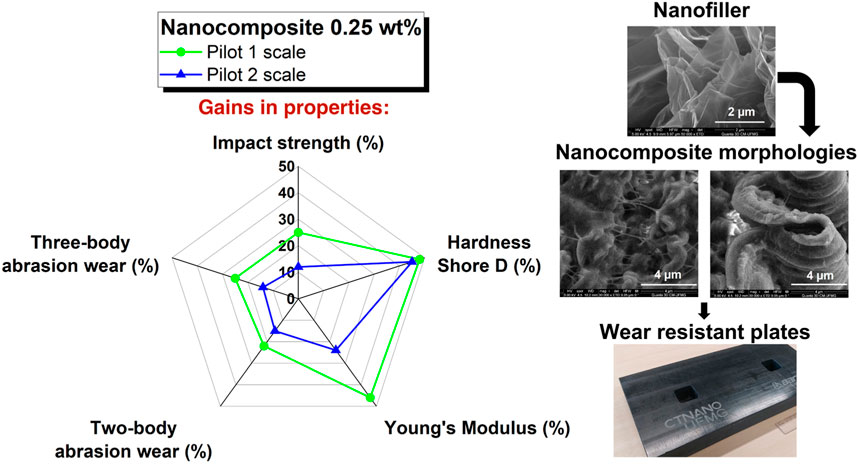
Maintaining the properties of nanocomposites obtained at the laboratory scale when evolving to pilot and industrial scales is a great challenge. In this work, the route for a 3000-fold increase in scale between the laboratory and production in an industrial environment was conducted in two stages–Pilot 1 and Pilot 2–to obtain polymeric nanocomposite plates for pilot testing. The nanocomposite was based on ultrahigh molecular weight polyethylene (UHMWPE) and reduced graphene oxide (rGO), and several different operations were optimized for complete scale-up, i.e., 1) production of reduced graphite oxide (rGrO); 2) exfoliation of rGrO; 3) milling of rGO with UHMWPE in a ball mill to produce masterbatch; and 4) RAM extrusion to produce the plates. All these steps were accompanied by characterizations that show the quality of the nanomaterial, masterbatch and nanocomposite plates. The gains in nanocomposite properties with 0.25 wt% rGO with respect to UHMWPE were ∼45% in elastic modulus, ∼50% in hardness, ∼25% in impact strength and 15% in abrasion wear (two-body test). The nanocomposite surfaces after wear tests are more hydrophobic than UHWWPE. The Pilot 1 results were generally superior to the Pilot 2 results, probably due to the very different thicknesses of the plates, i.e., 10 mm in Pilot 1 and 40 mm in Pilot 2. The improvement in different properties confirms the multifunctionality of the nanocomposite UHMWPE/rGO now produced on a pilot scale.
1 Introduction
The masterbatch process has broad application because of its ability to easily produce composites in the plastic industry with convenience and minimal air pollution (Li et al., 2007). Color, flame-retardant, reinforcing, conducting and so forth masterbatches have been widely applied with conventional and advanced additives (Herrera-Ramírez et al., 2017). Reis et al. (dos Reis et al., 2023) showed an efficient methodology for obtaining polymer nanocomposites containing carbon nanomaterials from the dilution of a masterbatch.
Polymeric nanocomposites have been proposed to solve the usual trade-off between stiffness and toughness occurring with the addition of conventional fillers (Zhang et al., 2022; Greenfeld and Wagner, 2015). Among the most explored nanofillers are carbon nanomaterials (Spitalsky et al., 2010; Potts et al., 2011), and graphene has been applied when wettability and tribological properties are the main goals (Friedrich, 2018; Gao et al., 2022).
Graphene oxide (GO) and reduced graphene oxide (rGO) have been proposed as important candidates in the large commercial interest in graphene products (Park et al., 2017). GO can be considered functionalized graphene with a distribution of epoxy, ether, aldehyde, ketone, alcohol, and carboxylic acid groups (Dreyer et al., 2010). rGO can have different degrees of oxygen functionalities removed, thus showing behavior similar to that of GO or pristine graphene in some cases. The quality of the dispersion of GO or rGO is one of the critical parameters to harness the exceptional properties of these nanofillers in polymeric composites (Johnson et al., 2015).
Ultrahigh molecular weight polyethylene (UHMWPE) is an engineering thermoplastic applied in bearings, valves and linings for mining, steel and food industries, and biomedical materials (Visco et al., 2016; Li et al., 2018). The mechanical and tribological properties of UHMWPE-rGO composites were investigated recently by our group (Amurin et al., 2022; Soares et al., 2022). Significant increases in wear resistance in the abrasion and sliding modes were observed with the addition of a maximum of 0.50 wt% rGO. Moreover, the hardness and stiffness also improved in these nanocomposites. These results were obtained on a laboratory scale involving the test of approximately 0.5 kg of nanocomposite. The challenge posed after the initial results was to demonstrate the scalability of the nanocomposite production with reproducibility of the properties obtained in the laboratory.
The work facing this challenge is reported herein, and it was designed in two steps: 1) Pilot 1 was proposed to increase the production of nanocomposite to 90 kg and involved the preparation of a masterbatch with 3 wt% of rGO and the process of RAM extrusion to produce composite plates with 10 mm thickness by dilution of the masterbatch. This process was quite different from the laboratory scale (Amurin et al., 2022), where the molded composite plates were obtained by compression molding in the final concentrations for the study (0.10, 0.25, and 0.50 wt%). Therefore, the complete characterization of the samples was repeated in Pilot 1 for nanocomposites at 0.10 and 0.25 wt% rGO obtained from the masterbatch with 3 wt% dilution. The 0.50 wt% nanocomposite did not advance for the Pilot 1 study because the laboratory characterization already ruled out this composition due to a decrease in properties, probably associated with an increase in the aggregation of rGO (Amurin et al., 2022). Thereafter, 2) Pilot 2 was pursued with the production of the masterbatch to allow the processing of 1,500 kg of the nanocomposite at 0.25 wt% of rGO. In this stage, an important difference was also applied: the plates had a larger thickness, 40 mm, four times the value of Pilot 1. Characterizations were also undertaken in the plates produced, and the results indicated that the main requirements of wear resistance and mechanical properties were achieved after the complete scale-up study that increased the amount of nanocomposite produced at the laboratory scale by 3.000x. Shirvanimoghaddam et al. (Shirvan et al., 2023) described the challenges in obtaining multifunctional polyethylene nanocomposites with a low content of nanofiller and how research seeks to develop scale-up processes to avoid cluster formation, which can promote negative effects on nanocomposite performance.
Therefore, this work reports a process that includes 1) production of reduced graphite oxide (rGrO); 2) exfoliation of rGrO in the liquid phase to obtain the nanofiller rGO and introduction of UHMWPE in the liquid phase; 3) milling of rGO with UHMWPE in a ball mill to produce masterbatch; and 4) RAM extrusion to produce the plates in two different stages, Pilot 1 and Pilot 2. All these steps were accompanied by characterizations that show the quality of the nanomaterial, masterbatch and nanocomposite plates.
2 Experimental part
2.1 Materials
Ultrahigh molecular weight polyethylene (UHMWPE - GUR 4152 - Celanese) has specific characteristics of a high-performance semicrystalline polymer, such as an average molar mass greater than 7.6 x 10⁶ g mol−1, a density of 0.930 g cm−3, an intrinsic viscosity of 28 dL g−1 and a particle size of the polymeric powder of approximately 180 µm (Celanese, 2022). The thermogravimetric analysis curve (Supplementary Figure S1A), differential scanning calorimetry (Supplementary Figure S1B) and FTIR spectra (Supplementary Figure S1C) of the UHMWPE are reported in the Supplementary Material.
Graphite powder (Gr) (Grafine 72,140–Nacional de Grafite) is a fine crystalline powder that has a carbon content ≥72%, moisture ≤0.3%, a guaranteed ash limit corresponding to ≤28%, an apparent density equal to 0.38 g cm−3 and a surface area corresponding to 5.3 m2 g−1 (de Grafite, 2023).
2.2 Synthesis and exfoliation of the filler
Graphite oxide (GrO) was synthesized from graphite according to the modified Hummers method (Hummers and Offeman, 1958) and then thermally reduced and expanded via a rotary furnace in a semicontinuous process, in which reduced and expanded graphite oxide (rGrO) was obtained (dos Reis et al., 2020). The rGrO had a granulometry limited to less than 600 µm to control reproducibility and quality of the filler, defined from the granulometric classification via dry sieving with mesh openings of 600 μm, 300 μm, 90 μm, 75 μm, and 45 μm (Pavitest–Contenco).
The filler rGrO was preexfoliated in a liquid medium (ethanol) via mechanical agitation in a high shear mixer for 30 min at a rotation speed of 4,500 rpm in a suspension with a concentration of 5 g L−1 and a volume of 1,200 mL for Pilot 1 and 2,400 mL for Pilot 2. Then, the preexfoliated filler was simultaneously subjected to exfoliation in an ultrasonic bath at 60 C and mechanical agitation (300 rpm) for 2 h, resulting in reduced graphene oxide (rGO).
2.3 Nanocomposite preparation
The production of the polymeric nanocomposite was divided into two stages: i) homogenization of solids and ii) conformation by RAM extrusion, as shown in Figure 1.
i. A mass of polymeric powder (388 g for Pilot 1 and 436.5 g for Pilot 2) was added to the suspension of the rGO in ethanol and was kept under agitation in an ultrasonic bath and mechanical mixing simultaneously at 60 °C for 1 h. The suspension was heated in an oven at 70 °C for 8 h to remove the solvent. The solid material was homogenized via a solid mixture in a ball mill (Servitech) with a rotation speed of 80 rpm for 8 h. Thus, a masterbatch of UHMWPE-rGO was obtained at a nanofiller concentration of 3 wt%. Ten kilograms and 150 kg of masterbatch were produced for the Pilot 1 and Pilot 2 stages, respectively.
ii. The production of the UHMWPE-rGO nanocomposites was conducted with the dilution of the masterbatch to concentrations of 0.10 wt% (Pilot 1) and 0.25 wt% (Pilot 1 and Pilot 2) in a paddle mixer (Baron) in 30 kg batches with a mixing time of 40 min. The plates were shaped via RAM extrusion (Baron) in an industrial environment on a pilot scale. For Pilot 1, 30 kg of nanocomposite containing 0.10 wt% rGO and 90 kg of nanocomposite containing 0.25 wt% nanofiller were produced. For Pilot 2, 1,500 kg of nanocomposite containing 0.25 wt% rGO was produced. The extrusion process consists of accommodating the nanoadditivated polymeric powder in silos (mixed with a specific lubricant for this extrusion process), which it directs to a cavity at the beginning of the extruder die for sintering. Then, the piston maintains a constant pressure until the polymer melts under a controlled temperature (150 °C). The piston hydraulic system keeps the mass under a constant working pressure close to 42 bar for 80 s. After this cycle, the piston returns to fill the initial cavity of the extruder die. The material remains in the extruder die for 150 min with controlled cooling, resulting in plates with a thickness of 10 mm and a width of 1.25 m being formed for Pilot 1. In the case of the plates produced in Pilot 2, the thickness was 40 mm, and the width was 1.25 m. The same extrusion process was performed for the neat UHMWPE to produce samples without the nanoadditive. The quantity of masterbatches and the rGO contents for Pilot 1 and Pilot 2 are summarized in Table 1.
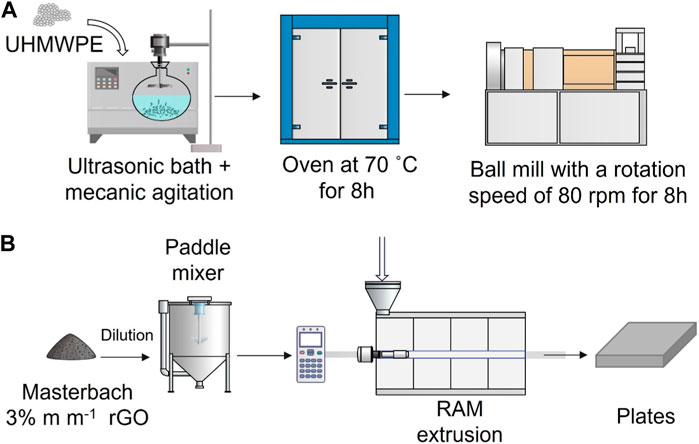
FIGURE 1. Scheme of the processing steps (A) Homogenization of solids; (B) Conformation by RAM extrusion.
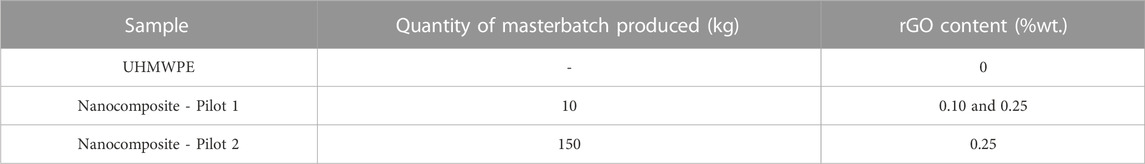
TABLE 1. Samples, quantities of masterbatch produced and rGO content.
2.4 Characterization techniques
Fourier transform infrared spectroscopy–FTIR was performed with a Frontier spectrophotometer (Perkin Elmer) in ATR (Total Attenuated Reflection) mode, scanned from 650 to 4,000 cm−1, resolution of 4 cm−1, with 64 total scans and force of 115 N. Raman spectroscopy was carried out in a spectrometer with a confocal microscope (Witec Alpha 300R), and a 457 nm (1 mV) laser energy was used. Raman spectroscopy measurements were carried out for 23 aliquots collected during the carbon nanomaterial dispersion process. For each sample collected, analyses were carried out at 5 different points. Some Raman spectra are shown in Supplementary Figure S1.
Thermogravimetric analysis (TG) was carried out in TA Instruments equipment with a heating rate of 10 °C min−1 and a temperature range of 25°C–700 °C in a platinum crucible and synthetic air environment. Differential scanning calorimetry (DSC) was performed using TA instrument equipment under a helium atmosphere at a flow rate of 100 mL min−1, a mass of approximately 6 mg, and a temperature range of 0°C–200 C at 10 C.min-1. The crystallinity of the samples was calculated according to Eq. (1), where ΔHm is the total heat energy per unit mass and ΔHc is the fusion enthalpy for the 100% crystalline sample (ΔHc = 293 J g−1) (Kanaga Karuppiah et al., 2008)
The filler and morphological structures of the polymeric nanocomposites and pure UHMWPE polymer were investigated by scanning electron microscopy (SEM) in an FEG scanning electron microscope with an FIB nanofabrication system (Quanta FEG 3D FEI) with an acceleration voltage of 5 kV. The surfaces of the polymeric materials were metallized with a Au/Pd film with a thickness of 15 nm. Transmission electron microscopy (TEM) was conducted with a Tecnai G2-20–FEI SuperTwin 200 kV microscope. Atomic force microscopy (AFM) was performed with an Asylum Research MFP-3D-AS in contact mode; aliquots from the 5 g L−1 suspension of rGO were previously prepared with a 2.5x dilution and subsequently deposited on a mica substrate.
The tensile tests were conducted according to the ASTM D638 standard (ASTM D638-14, 2022) in universal EMIC equipment with a load cell of 5 kN and test speed of 10 mm min−1. Twenty specimens were prepared for analysis of the mechanical behavior of the pure polymer (UHMWPE) and the nanocomposites at concentrations of 0.10 wt% and 0.25 wt% rGO. The impact resistance test was performed with the samples subjected to a 50 J pendulum in the impact hammer of the XJ series impact equipment in Charpy mode, and the results refer to an average of 90 measurements across multiple regions. Two-body abrasive wear resistance (rotating pin-on-drum) was conducted according to ISO 4649, in which twenty specimens were tested (ISO 4649:2017, 2017). The equipment consists of a rotating drum coated with specific sandpaper for abrasion with 60# grain, certified by VSM, supplied by the company Abrasfran. The abrasive wear resistance of the UHMWPE and nanocomposite samples was evaluated by covering 40 m of sliding distance with rotation of 40 rpm in the drum with a normal applied force of 10 N. The results were calculated according to Eq. (2), which determines the relative volume loss (ΔVrel) due to the average mass loss of the tested material (Δmt) and the average mass loss of the reference material (Δmconst.), due to the density of the tested material (ρt) and constant mass loss of the reference material (Δmr).
The three-body abrasive wear test is based on the ASTM G65 standard (ASTM G65-162021, 2021) and makes use of the rubber wheel type tribometer. Method B of Standard ASTM G65 was used with high abrasion severity, using a normal force of 130 N on the specimen surface and a rubber wheel speed of 200 rpm for 10 min. The abrasive agent used was a typical Brazilian sand with a granulometry of 50# (ABNT NBR 7214:2015) (ABNT NBR 7214:2015, 2015). The data obtained allow the calculation of the volume lost in wear (Eq. (3)), which considered Vp as the volume lost in wear, Δm as the loss of mass in wear, and ρ as the density of the material worn.
The surface topographies were investigated with two- and three-body wear tests using a Hommelwerke LV-100 profilometer with a 90° angle probe and a 5 μm radius. Five hundred one-dimensional scans of 5 mm length, 1 μm distance and 0.5 mm s−1 speed were performed. The results were collected through Turbo Wave software and treated by HommelMap Expert software, resulting in topographic maps.
The surface wettability was characterized through contact angle measurements. The sessile drop method was used in which a drop of deionized water was deposited on the surface before and after the abrasive wear tests. The test was carried out in a goniometer (Data Physics OCA 15EC) operated at 20°C, and the profile of the drop obtained was collected by SCA20 software. The reported values were the average of thirty measurements for each sample, as described in Supplementary Table S1.
3 Results and discussion
The main challenges faced in this work were to design a feasible process on a large scale that guarantees the quality of the results obtained for the nanocomposite on a laboratory scale, as described in our previous work (Amurin et al., 2022). The main differences in the overall scale-up routes with respect to the laboratory-scale methodologies were the use of a rotary furnace to reduce the graphite oxide; the increase of one order of magnitude in the concentration of the rGO suspension for exfoliation from 0.5 g L−1 in the laboratory scale to 5 g L−1 in pilot scales; the RAM extrusion rather than the compression molding conducted to produce the nanocomposite plates in the pilot scales; and a difference between the thickness of the plates produced in the stages of scale-up, 10 mm for Pilot 1 plates and 40 mm for Pilot 2 plates. Therefore, it was necessary to monitor in Pilot 1 and Pilot 2 how all these important changes in the overall process would impact the properties of the nanocomposites to guarantee the final production of the 1,500 kg that were used to make available 500 plates of UHMWPE-rGO to be applied in a prototype with strict property control in a Brazilian mining company.
The first stage was to produce well exfoliated rGO to be dispersed in the masterbatch of UHMWPE. Starting from graphite oxide (GrO) produced with approximately 40% oxygenated groups, as can be observed in Figure 2B,C in the FTIR spectra and TG plots of rGrO. To obtain reduced graphite oxide, reduction was conducted in a rotary furnace. The use of the rotary furnace rather than microwave reduction (Amurin et al., 2022) was necessary to obtain the 5 kg necessary for the targeted scale-up with a reproducible quality. The FTIR and TG results (Figures 2B,C) indicate that the process of reduction and simultaneous thermal expansion via a rotary furnace result in fillers with characteristics similar to those produced by the reduction process via microwave irradiation (Amurin et al., 2022), leading to a filler with approximately 3% oxygenated functions. One of the main desirable characteristics of the material is the expansion of the graphitic layers, as it facilitates the subsequent exfoliation of the carbon material in a solvent medium and under ultrasonic and mechanical agitation. It can be seen in the SEM images of Figures 2D,E that in both cases (Pilot 1 and Pilot 2), there are fillers with expanded multilayers, a morphology that can facilitate nanofiller exfoliation in liquid medium. Furthermore, it can be seen that the thin layers of graphene tend to form a stable expanded three-dimensional network, as observed in Figures 2F,G. Therefore, the process route adopted is highly effective for the production of rGrO on a large scale, with quality and reproducibility.
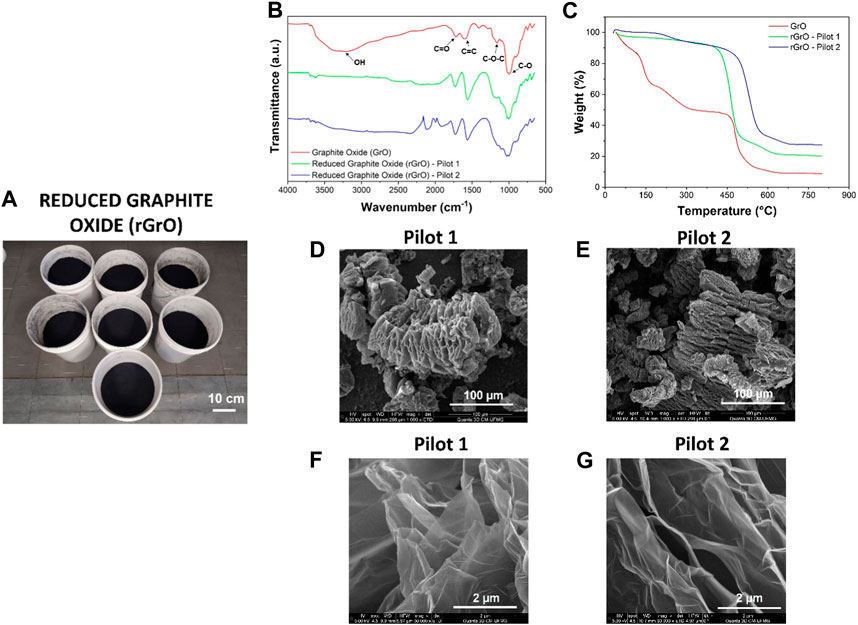
FIGURE 2. (A) 5.0 kg of reduced graphite oxide. Characterization of the reduced graphite oxide (rGrO) (B) FTIR spectra; (C) TG curves; (D) (F) SEM image–Pilot 1; (E) (G) SEM image–Pilot 2.
The results presented in Figure 3 refer to the characteristics of the nanofiller after the exfoliation process of the starting filler rGrO (exfoliation in solvent medium by mechanical mixing in high shear, followed by ultrasonic bath and mechanical agitation) producing rGO. It must be considered that the concentration of the suspension is approximately 5 g L−1 (1 order of magnitude higher compared to laboratory-scale production (Amurin et al., 2022)). The Raman spectra in Figure 3C are the average of an ensemble of measurements, as explained in the Supplementary Material. The ratio of intensities of the D band and G band of carbonaceous materials allows the evaluation of the degree of defects present in their structures (Ferrari et al., 2006). The ID/IG results indicate that graphene oxide has a more defective structure than the reduced graphite oxide and graphene oxide in our work, as expected.
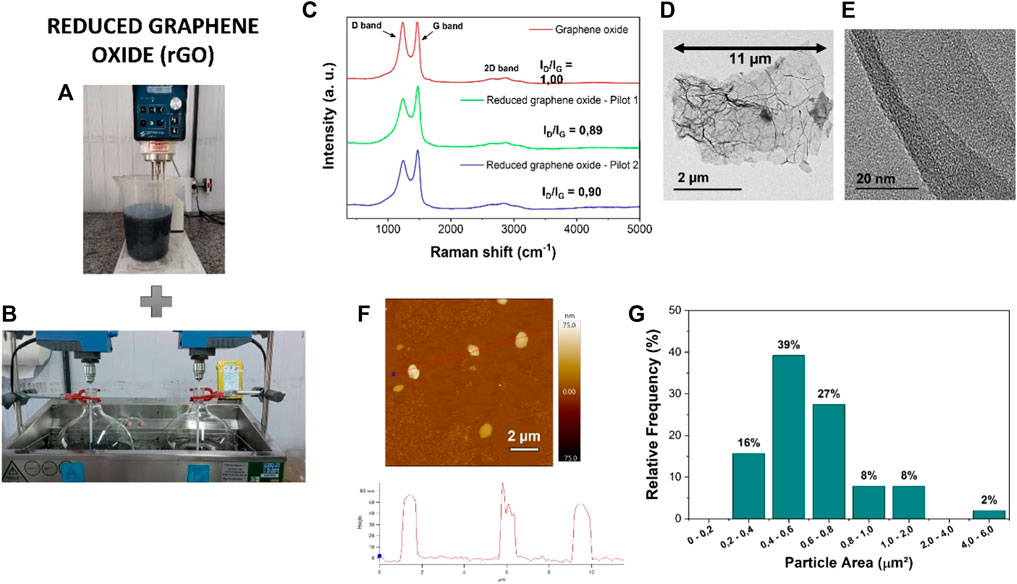
FIGURE 3. Production process of the nanofiller (rGO): (A) high shear exfoliation process; (B) ultrasonic bath and mechanical agitation exfoliation. Characterization of reduced graphene oxide: (C) Average Raman spectra with 457 nm laser energy; (D) TEM image; (E) High-resolution TEM image; (F) AFM image; (G) Nanofiller relative area distribution from AFM images.
The exfoliated rGO nanofillers consist of a nanomaterial with few layers and some folded regions, as seen in Figures 3D,E. In addition, it has a lateral size of approximately 11 μm (Figure 3D). The high-resolution TEM images clearly show the layers of graphene, indicating the acquisition of two-dimensional carbon nanomaterials, as the Raman spectrum confirms (Figure 3A). The AFM results (Figure 3F) indicate that the nanofiller has a thickness of less than 60 nm after drying the samples for the measurement. In addition, the average areas of the side of the two-dimensional nanomaterials are on the micrometric order (Figure 3G), which is an important parameter to promote physical interaction with the polymeric chain of UHMWPE. It is important to consider that the process of exfoliation continues in the presence of the polymer in the solid-state mixing in the ball mill and further in the extrusion stage. Therefore, we propose that the final nanocomposites will have rGO dispersed in the polymeric matrix.
Three compositions were tested during the study performed on a laboratory scale, i.e., 0.10 wt%, 0.25 wt% and 0.50 wt% of rGO. The nanocomposite containing 0.50 wt% rGO was not produced in this scale-up investigation due to inferior performance at the laboratory scale with respect to the other compositions (Amurin et al., 2022). The agglomeration of the nanofiller at this concentration is considered to start to influence negatively.
The masterbatch containing 3 wt% of nanofiller was diluted in the pure polymer to obtain nanocomposites with final concentrations of 0.10 wt% and 0.25 wt% of rGO in the Pilot 1 step, making it possible to evaluate the material with the best performance after all changes applied to the process to allow scale up. The set of results in Figure 4 shows that the nanocomposite containing 0.10 wt% rGO presented inferior performance with respect to the neat polymer in terms of impact resistance, Figure 4B, and abrasive wear, Figure 4D. In the case of tensile strength, Figure 4A shows that the curves of the nanocomposite with 0.10 wt% rGO and UHMWPE are similar. The nanocomposite containing 0.25 wt% rGO showed gains in properties with respect to UHMWPE for all evaluated properties. Therefore, the production of the nanocomposite containing 0.25 wt% rGO in pilot scale 2 was defined.
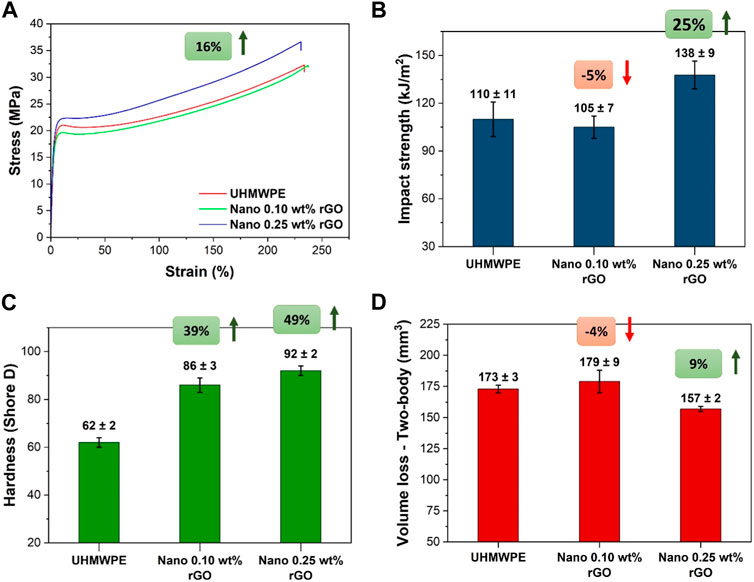
FIGURE 4. Characterization of the UHMWPE and nanocomposite plates at 0.10 wt% and 0.25 wt% of rGO content produced in the Pilot 1 step: (A) Average curve of stress as a function of strain; (B) impact strength; (C) hardness and (D) volume loss (two-body mode).
Figure 5 shows the comparison between the nanocomposites produced with 0.25 wt% rGO in the two steps of scale-up. These nanocomposites were obtained from the dilution of the masterbatch 3 wt%, and an important difference characterized the final plates that were produced. In the Pilot 1 test, the thickness of the plates was 10 mm, and in the Pilot 2 step, they were 40 mm. Thicker plates were produced in the Pilot 2 stage because of the need for specific dimensions for application as a prototype. However, the specimen for characterization obtained from the thicker plates was extracted from the bulk, whereas the specimen in the Pilot 1 plates came from the surface.
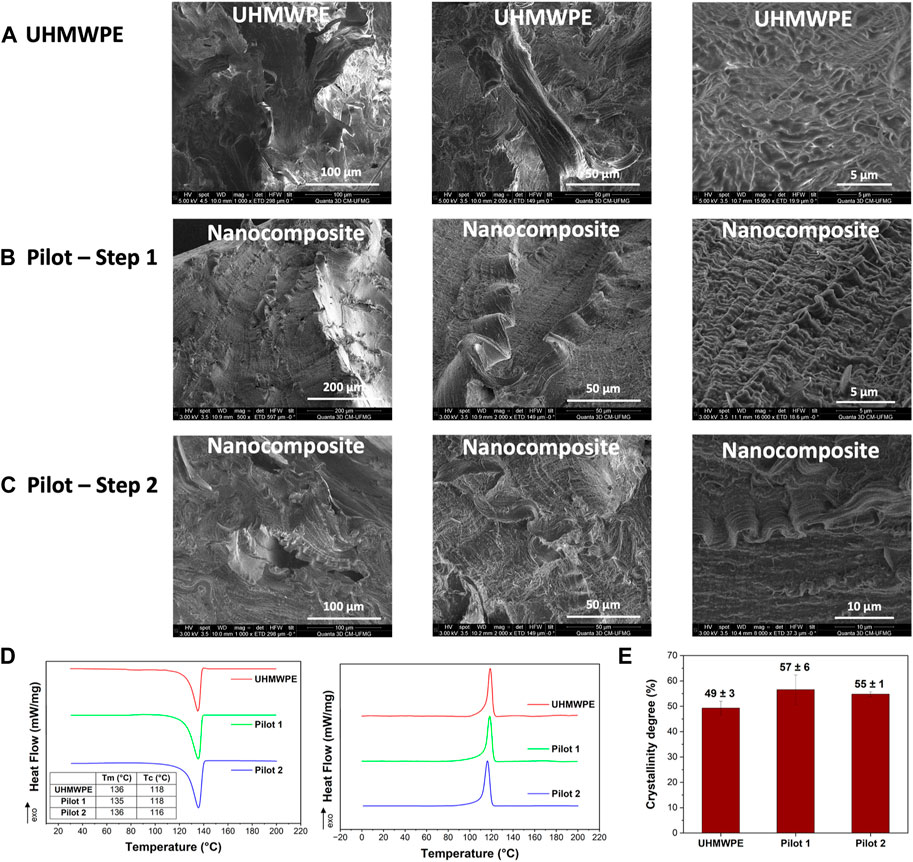
FIGURE 5. Morphological comparison between the nanocomposite plates at 0.25 wt% rGO content in the two stages of scale-up. SEM images of (A) UHMWPE (B) Pilot 1; (C) Pilot 2; (D) DSC curves in heating and cooling scan; (E) Crystallinity degree.
Figure 5A displays the SEM images of the plates produced from UHMWPE in an industrial environment. Note that the lamellar morphology tends to be less ordered than expected for this kind of polyolefin (Barron and Birkinshaw, 2008); however, microfibers are present in specific regions. Figure 5B shows the images for the nanocomposite plate produced in Pilot 1, where the lamellar crystalline region is long-range and well-ordered, which may be due to the influence of the rGO. In the case of the nanocomposite produced on the Pilot 2 scale (Figure 5C), typical UHMWPE morphologies (lamellae, microfibers and nodulus) with superior characteristics compared to UHMWPE can be identified. Large thicknesses and aligned lamellae are formed with a high degree of ordering in both stages of scaling up, probably due to the nanofiller presence. The increase in the degree of crystallinity (Figure 5E) presents a response that corroborates the SEM images.
Table 2 summarizes the mechanical results obtained for the neat polymer and nanocomposite plates with 0.25 wt% rGO produced in this work. The UHMWPE was processed under similar conditions as the nanocomposites to allow comparison. The tensile strength and rupture strain did not show significant changes for the nanocomposites with respect to UHMWPE. Otherwise, rigidity, hardness and impact strength exhibited important gains by the addition of the nanofiller. Figure 6 shows the results of the properties that were improved by the addition of the nanofiller. Scanning electron microscopy images of the tensile and impact strength fracture surfaces are shown in Supplementary Figure S3, S4, respectively. These images support the conclusion that the microfibers present between the amorphous/crystalline phases naturally reinforce the nanocomposite. Furthermore, the two-dimensional carbon nanofiller network tends to prevent crack propagation due to a high level of nanofiller dispersion and the absence of clusters.
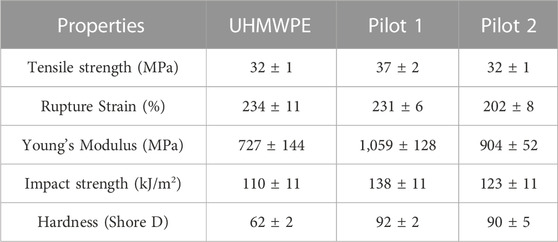
TABLE 2. Results of mechanical characterization for the plates of neat polymer and nanocomposites with 0.25 wt% rGO in the two stages of scale-up.
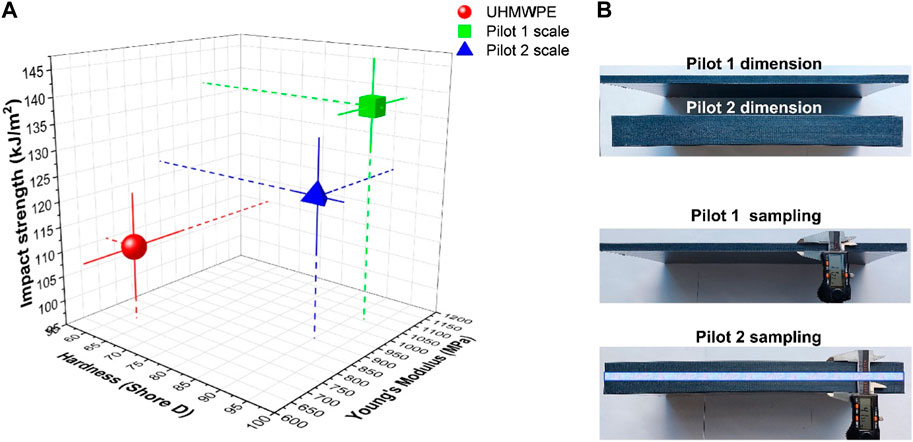
FIGURE 6. (A) Comparison of impact strength, hardness and Young’s modulus among the plates of UHMWPE and nanocomposites of Pilot 1 and Pilot 2 with 0.25 wt% of rGO; (B) Dimensions of the plates from Pilot 1 and Pilot 2 scale up. In the case of pilot 2, the analysis was performed on the plate bulk.
The nanocomposite plates resulting from the dilution of the masterbatch containing 3 wt% rGO exhibit positive results and corroborate the analyses of the nanocomposite produced at the laboratory scale (Amurin et al., 2022), even considering all the changes made to the process to allow scale up. The Pilot 1 nanocomposite stood out in terms of impact resistance and rigidity, as seen in Figure 6, in which considerable gains are observed with respect to the neat polymer plate. Pilot 2 is a scale-up of 3,000 times with respect to the laboratory, and the resulting nanocomposite plate still shows superior performance compared to the neat polymer. However, Table 2 and Figure 6 show that the properties of impact resistance and rigidity are lower compared to the Pilot 1 nanocomposite. As mentioned above for the discussion of the structural and morphological characterization, we hypothesized that the lower performance of the specimen produced in Pilot 2 is because they were obtained from thicker plates that demand longer processing times and show a lower degree of crystallinity than the Pilot 1 samples.
The comparison of our results with the literature is possible by considering other authors’ production on a small scale. Suñer et al. (Suñer et al., 2015) presented an increase of approximately 15% in the modulus of elasticity for UHMWPE containing between 0.1 and 2.0 wt% graphene oxide compared to pure UHMWPE. A 5% increase in Shore D hardness was reported by Aliyu et al. (Aliyu et al., 2019) with the addition of 0.5 wt% graphene nanoplatelets (GnPs). Other works reported an increase in the microhardness of UHMWPE for nanocomposites with 0.1–2.0 wt% GO (Suñer et al., 2015; Pang et al., 2015) and 0.7 and 3.0 wt% rGO (Çolak et al., 2020) added to the polymer. Pang et al. (Pang et al., 2015) showed significant increases in impact Izod, more than 3 times for the addition of 1.0 wt% GO to UHMWPE. Our data indicate an increase for the best cases of 35% in elastic modulus, 50% for hardness and 25% in impact strength in Charpy mode with the addition of 0.25 wt% of rGO, all associated with nanocomposite plates produced in pilot scales. Therefore, one can affirm that this work reports superior performance related to the literature with respect to rigidity and hardness.
Two- and three-body abrasive wear resistances were evaluated using pin-drum and rubber wheel tests, respectively. For both nanocomposite plates–Pilot 1 and Pilot 2–the volume losses are lower than the neat UHMWPE, as can be observed in Figure 7, indicating that there was a significant increase in resistance to abrasive wear with the addition of rGO. Tribological behavior is extremely influenced by the severity of the test, granulometry, shape and hardness of the abrasive agents, but both types of tests show the same tendency of gains with rGO. However, we must consider that the hardness is vital to enable low wear when subjected to abrasive wear. When comparing neat polymer to nanocomposites (Pilot 1 and Pilot 2), abrasion wear performance follows a clear trend with hardness (Somberg et al., 2023).
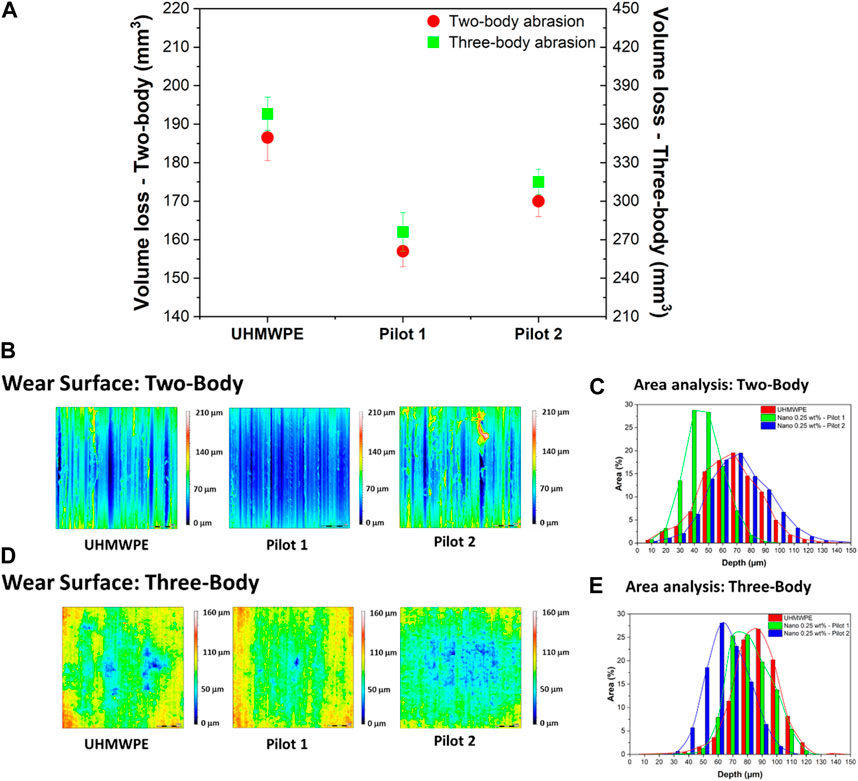
FIGURE 7. Wear results for the UHMWPE and nanocomposite plates at 0.25 wt% rGO from Pilot 1 and Pilot 2 scale up. (A) Volume loss–two- and three-body abrasion; (B) 2D–image of wear surface in two-body abrasion mode; (C) Analysis of area x depth obtained from the profilometry of wear surface in two-body abrasion mode; (D) 2D–image of wear surface in three-body abrasion mode; (E) Analysis of area x depth obtained from the profilometry of wear surface in three-body abrasion mode.
The two-body abrasive wear mode works with fixed abrasive agents and provides high severity to the softer phase body wear. The volume loss decreases for the nanocomposite plates, showing an improvement of 15% and 9% for the Pilot 1 and Pilot 2 nanocomposites, respectively, with respect to the neat UHMWPE. In the abrasive wear tests on three bodies (rubber wheel), in which the abrasive agents are free to roll on the surface that will be worn, the parameters used for the tests followed the standard for testing metallic materials (steel), which is quite a challenge for a polymeric plate. The three-body abrasive wear resistance shows an improvement of 24% and 16% for the Pilot 1 and Pilot 2 nanocomposites, respectively, when compared to the neat UHMWPE, as shown in Figure 7.
Worn surface topographies for nanocomposite plates (Pilot 1 and Pilot 2) were analyzed by profilometry, as shown in Figures 7B,C, to identify the pattern created during abrasive wear. Uniform wear marks, deep grooves and total material removal occur in the case of the two-body wear test for the surface of the neat UHMWPE. In the case of the nanocomposite plate of Pilot 1, the wear grooves became less deep. Moreover, the polymeric material is not completely removed by the passage of the abrasive agent, which is more evident for the nanocomposite plate of Pilot 2.
The rubber wheel results show deeper marks, as can be observed in Figure 7C, mainly for the neat polymer plate. In the case of the nanocomposite plates, the wear of the surface is less pronounced. In general, the roughness profiles for the different wear test configurations are very different from each other. However, the comparison between the damage caused to the surface of the nanocomposite and neat polymer plates indicates that the incorporation of rGO contributes to the increase in resistance to abrasive wear, regardless of the severity and mode of wear.
Tribological tests and topography analyses of UHMWPE nanocomposites, or even of the pure polymer, after being subjected to pin-on-drum and rubber wheel abrasive tests are not reported in the literature to the best of our knowledge. However, some authors present results of a decrease in the polymer wear rate through pin-on-disk sliding tests with the addition of carbon nanomaterials such as graphene nanoplatelets and GO (Aliyu et al., 2019; Bahrami et al., 2016). Our group also reported in a recent work for laboratory-scale UHMWPE nanocomposites containing 0.1, 0.25 and 0.50 wt% rGO gains in tribological results with pin-on-disk sliding tests (Soares et al., 2022).
The contact angle results are shown in Figure 8 and Supplementary Table S1. These measurements were performed on the surfaces before wear tests and after the two types of wear tests conducted in this work. Two important features influence the contact angle: the hydrophobicity and the roughness of the surfaces (Law and Zhao, 2015). The original surface results before wear tests, Figure 8B, show an increase in the contact angle for the nanocomposite plate produced in Pilot 1, whereas in Pilot 2, the wettability seems similar to that of the neat polymer.
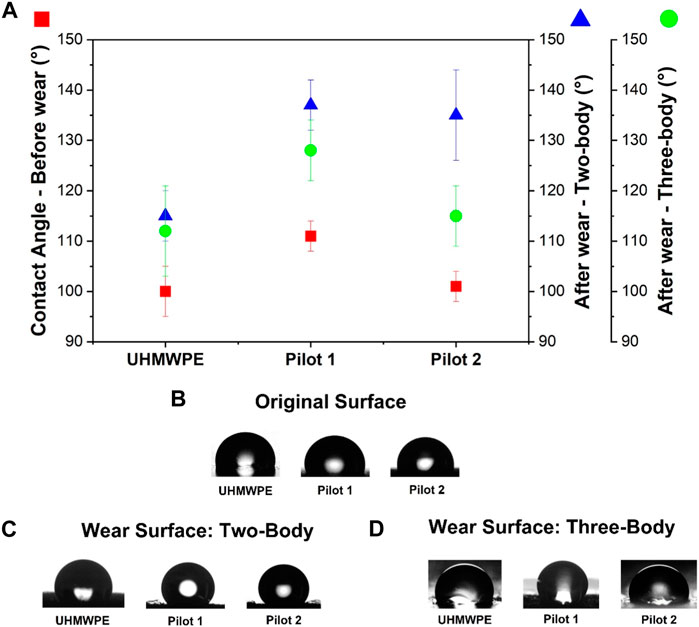
FIGURE 8. Wettability results for the UHMWPE and nanocomposite plates with 0.25 wt% of rGO from Pilot 1 and Pilot 2 scale up. (A) Contact angle; (B) Drop–original surface; (C) Drop on wear surface from two-body test; (D) Drop on wear surface from three-body test.
The contact angle data for the wear surfaces show, in both types of wear tests, significant increases from close to 115° (neat polymer) to close to 130° or more for the Pilot 1 plates. The Pilot 2 plates show a different behavior from the two-body test, producing wear surfaces that show a decrease in wettability and a contact angle of 135°, whereas the wear surfaces originating from the three-body test show a contact angle similar to that of the neat polymer plate. This result can be interpreted as being associated with the different degrees of severity of the two wear tests and the different thicknesses of the plates from Pilot 1 and Pilot 2. The thicker plate of Pilot 2 is probably being tested on a surface where the concentration of rGO is not the same as the surface of Pilot 1.
4 Conclusion
Significant changes in the processing to advance from the laboratory scale to the pilot scale were necessary in all operations, i.e., graphite oxidation, rGrO exfoliation, masterbatch production, and RAM extrusion to conform plates. The Pilot 1 stage was carried out with a scale approximately 200x higher than the laboratory study, and Pilot 2 concerned a scale approximately 3,000x higher with respect to the laboratory study. The systematic characterization of the structure, morphology, and properties of the filler, nanofiller and nanocomposite at all stages guarantees the best choices for the production of nanocomposite plates with multifunctionality, which means simultaneous gains in mechanical and tribological properties. The content of 0.25 wt% rGO was validated as the one showing the best performance. The plates produced in Pilot 2 were 4x thicker than the plates originating from Pilot 1 processing. The effect of the thickness of the plates on the mechanical and tribological properties was noticeable. Herein, the successful scale-up of the nanocomposite UHMWPE/rGO was demonstrated, which indicates the possibility of advancing industrial production, considering the specific characteristics of both the polymer and nanofiller tested in this work.
Data availability statement
The original contributions presented in the study are included in the article/Supplementary Material, further inquiries can be directed to the corresponding author.
Author contributions
LA: Conceptualization, Investigation, Methodology, Project administration, Supervision, Validation, Writing–original draft, Writing–review and editing, Data curation, Formal Analysis. PO: Formal Analysis, Investigation, Methodology, Writing–original draft. AS: Investigation, Methodology, Writing–original draft, Data curation. NR: Data curation, Investigation, Methodology, Writing–original draft. DR: Investigation, Methodology, Writing–original draft, Conceptualization, Formal Analysis, Project administration, Supervision, Validation, Writing–review and editing. GS: Conceptualization, Investigation, Methodology, Project administration, Supervision, Validation, Writing–original draft, Funding acquisition, Resources, Visualization, Writing–review and editing
Funding
The author(s) declare financial support was received for the research, authorship, and/or publication of this article. University support.
Acknowledgments
The authors thank the companies Vale S.A. and Baron S.A. CNPq and Microscopy Center of UFMG are also acknowledged. This manuscript is available at the preprint server SSRN at https://papers.ssrn.com/sol3/papers.cfm?abstract_id=4511644 (Amurin et al., 2018).
Conflict of interest
The author(s) declare financial support was received for the research, authorship, and/or publication of this article.
The authors declare that the research was conducted in the absence of any commercial or financial relationships that could be construed as a potential conflict of interest.
Publisher’s note
All claims expressed in this article are solely those of the authors and do not necessarily represent those of their affiliated organizations, or those of the publisher, the editors and the reviewers. Any product that may be evaluated in this article, or claim that may be made by its manufacturer, is not guaranteed or endorsed by the publisher.
Supplementary material
The Supplementary Material for this article can be found online at: https://www.frontiersin.org/articles/10.3389/frcrb.2023.1291283/full#supplementary-material
References
Aliyu, I. K., Mohammed, A. S., and Al-Qutub, A. (2019). Tribological performance of ultra high molecular weight polyethylene nanocomposites reinforced with graphene nanoplatelets. Polym. Compos. 40 (S2), E1301–E1311. doi:10.1002/pc.24975
Amurin, L., Oliveira, P. N., Pereira Ana Flávia, T. S., Ribeiro, N. C., Rezende, D. B., and Silva, G. G. 2018 Ultrahigh molecular weight polyethylene-reduced graphene oxide scaling up to produce wear resistant plates. Available at: https://ssrn.com/abstract=4511644.
Amurin, L. G., Felisberto, M. D., Ferreira, F. L., Soraes, P. H., Oliveira, P. N., Santos, B. F., et al. (2022). Multifunctionality in ultra high molecular weight polyethylene nanocomposites with reduced graphene oxide: hardness, impact and tribological properties. Polym. Guildf. 240, 124475. doi:10.1016/j.polymer.2021.124475
ASTM G65-16(2021) (2021). Standard test method for measuring abrasion using the dry sand/rubber wheel apparatus. doi:10.1520/G0065-16R21
Bahrami, H., Ramazani S A, A., Shafiee, M., and Kheradmand, A. (2016). Preparation and investigation of tribological properties of ultra-high molecular weight polyethylene (UHMWPE)/graphene oxide. Polym. Adv. Technol. 27 (9), 1172–1178. doi:10.1002/pat.3779
Barron, D., and Birkinshaw, C. (2008). Ultra-high molecular weight polyethylene - evidence for a three-phase morphology. Polym. Guildf. 49 (13–14), 3111–3115. doi:10.1016/J.POLYMER.2008.05.004
Çolak, A., Göktaş, M., and Mindivan, F. (2020). Effect of reduced graphene oxide amount on the tribological properties of UHMWPE biocomposites under water-lubricated conditions. SN Appl. Sci. 2 (3), 375–377. doi:10.1007/s42452-020-2179-4
de Grafite, N. (2023) Grafine 72140. Available at: https://www.grafite.com/grafine (Accessed March 21, 2023).
dos Reis, T. M. C., Assis, A. L. S., de Castro, V. G., and Silva, G. G. (2020). Processo de obtenção de óxido de grafeno e produto.
dos Reis, T. M. C., de Castro, V. G., Amurin, L. G., and Silva, G. G. (2023). Graphene oxide dispersion in epoxy resin prepared by direct phase transfer from ethanol: rheology and aging. Compos. Part C. Open Access 10, 100340. doi:10.1016/j.jcomc.2022.100340
Dreyer, D. R., Park, S., Bielawski, C. W., and Ruoff, R. S. (2010). The chemistry of graphene oxide. Chem. Soc. Rev. 39 (1), 228–240. doi:10.1039/B917103G
Ferrari, A. C., Meyer, J. C., Scardaci, V., Casiraghi, C., Lazzeri, M., Mauri, F., et al. (2006). Raman spectrum of graphene and graphene layers. Phys. Rev. Lett. 97 (18), 187401–187404. doi:10.1103/PhysRevLett.97.187401
Friedrich, K. (2018). Polymer composites for tribological applications. Adv. Industrial Eng. Polym. Res. 1 (1), 3–39. doi:10.1016/j.aiepr.2018.05.001
Gao, Q., Liu, S., Hou, K., Li, Z., and Wang, J. (2022). Graphene-based nanomaterials as lubricant additives: a review. Lubricants 10, 273–310. doi:10.3390/lubricants10100273
Greenfeld, I., and Wagner, H. D. (2015). Nanocomposite toughness, strength and stiffness: role of filler geometry. Nanocomposites 1 (1), 3–17. doi:10.1179/2055033214Y.0000000002
Herrera-Ramírez, L. C., Castell, P., Castillo-Rodríguez, M., Fernández, Á., and Guzman de Villoria, R. (2017). The effect of a semi-industrial masterbatch process on the carbon nanotube agglomerates and its influence in the properties of thermoplastic carbon nanotube composites. J. Polym. Sci. B Polym. Phys. 55 (2), 189–197. doi:10.1002/polb.24258
Hummers, W. S., and Offeman, R. E. (1958). Preparation of graphitic oxide. J. Am. Chem. Soc. 80 (6), 1339. doi:10.1021/ja01539a017
ISO 4649:2017 (2017). Rubber, vulcanized or thermoplastic — determination of abrasion resistance using a rotating cylindrical drum device.
Johnson, D. W., Dobson, B. P., and Coleman, K. S. (2015). A manufacturing perspective on graphene dispersions. Curr. Opin. Colloid & Interface Sci. 20 (5–6), 367–382. doi:10.1016/j.cocis.2015.11.004
Kanaga Karuppiah, K. S., Bruck, A. L., Sundararajan, S., Wang, J., Lin, Z., Xu, Z. H., et al. (2008). Friction and wear behavior of ultra-high molecular weight polyethylene as a function of polymer crystallinity. Acta Biomater. 4 (5), 1401–1410. doi:10.1016/j.actbio.2008.02.022
Law, K. Y., and Zhao, H. (2015). Surface wetting: characterization, contact angle, and fundamentals. Surf. Wetting Charact. Contact Angle, Fundam., 1–162. doi:10.1007/978-3-319-25214-8
Li, Y., He, H., Huang, B., Zhou, L., Yu, P., and Lv, Z. (2018). In situ fabrication of cellulose nanocrystal-silica hybrids and its application in UHMWPE: rheological, thermal, and wear resistance properties. Polym. Compos. 39 (S3), E1701–E1713. doi:10.1002/PC.24690
Li, Y., Wu, D., and Chen, G. (2007). Preparation and characterization of high-density polyethylene/expanded graphite conducting masterbatch. J. Appl. Polym. Sci. 106 (5), 3119–3124. doi:10.1002/APP.25842
Pang, W., Ni, Z., Chen, G., Huang, G., Huang, H., and Zhao, Y. (2015). Mechanical and thermal properties of graphene oxide/ultrahigh molecular weight polyethylene nanocomposites. RSC Adv. 5 (77), 63063–63072. doi:10.1039/c5ra11826c
Park, M. V. D. Z., Bleeker, E. A., Brand, W., Cassee, F. R., van Elk, M., Gosens, I., et al. (2017). Considerations for safe innovation: the case of graphene. ACS Nano 11 (10), 9574–9593. doi:10.1021/acsnano.7b04120
Potts, J. R., Dreyer, D. R., Bielawski, C. W., and Ruoff, R. S. (2011). Graphene-based polymer nanocomposites. Polym. Guildf. 52 (1), 5–25. doi:10.1016/j.polymer.2010.11.042
Shirvanimoghaddam, K., Balaji, K., Ahmadi, M., Ajdari Nazarloo, H., Yadav, R., Zabihi, O., et al. (2023). Strategies to resolve intrinsic conflicts between strength and toughness in polyethylene composites. Adv. Industrial Eng. Polym. Res. doi:10.1016/j.aiepr.2023.03.004
Soares, P. H. V., de Oliveira, P. N., Viáfara, C. C., Silva, G. G., Amurin, L. G., and da Silva, A. B. (2022). Effect of the reduced graphene oxide on the tribological behavior of UHMWPE/rGO nanocomposites under sliding contact conditions. Polym. Eng. Sci. 62 (8), 2641–2656. doi:10.1002/pen.26047
Somberg, J., Gonçalves, G., and Emami, N. (2023). Graphene oxide versus graphite and chemically expanded graphite as solid lubricant in ultrahigh molecular weight polyethylene composites. Tribol. Int. 187, 108643. doi:10.1016/j.triboint.2023.108643
Spitalsky, Z., Tasis, D., Papagelis, K., and Galiotis, C. (2010). Carbon nanotube–polymer composites: chemistry, processing, mechanical and electrical properties. Prog. Polym. Sci. 35 (3), 357–401. doi:10.1016/j.progpolymsci.2009.09.003
Suñer, S., Joffe, R., Tipper, J. L. L., and Emami, N. (2015). Ultra high molecular weight polyethylene/graphene oxide nanocomposites: thermal, mechanical and wettability characterisation. Compos. Part B Eng. 78, 185–191. doi:10.1016/j.compositesb.2015.03.075
Visco, A., Yousef, S., Galtieri, G., Nocita, D., Pistone, A., and Njuguna, J. (2016). Thermal, mechanical and rheological behaviors of nanocomposites based on UHMWPE/paraffin oil/carbon nanofiller obtained by using different dispersion techniques. JOM 68 (4), 1078–1089. doi:10.1007/s11837-016-1845-x
Keywords: nanocomposite, reduced graphene oxide, ultrahigh molecular weight polyethylene, wear resistance, scale up
Citation: Amurin LG, Oliveira PND, Pereira AFTS, Ribeiro NC, Rezende DBD and Silva GG (2023) Ultrahigh molecular weight polyethylene-reduced graphene oxide composite scaling up to produce wear resistant plates. Front. Carbon 2:1291283. doi: 10.3389/frcrb.2023.1291283
Received: 08 September 2023; Accepted: 17 October 2023;
Published: 02 November 2023.
Edited by:
Duncan John Mowbray, Yachay Tech University, EcuadorReviewed by:
Julio Cesar Chacón Torres, Yachay Tech University, EcuadorCamilo Zamora-Ledezma, Catholic University San Antonio of Murcia, Spain
Copyright © 2023 Amurin, Oliveira, Pereira, Ribeiro, Rezende and Silva. This is an open-access article distributed under the terms of the Creative Commons Attribution License (CC BY). The use, distribution or reproduction in other forums is permitted, provided the original author(s) and the copyright owner(s) are credited and that the original publication in this journal is cited, in accordance with accepted academic practice. No use, distribution or reproduction is permitted which does not comply with these terms.
*Correspondence: Glaura Goulart Silva, Z2xhdXJhZ0B1Zm1nLmJy