 Lea Decker
 Christian P. Marx1
 Matthias Weiβ
- 1Faculty of Management and Economics, Ruhr-Universität Bochum, Bochum, Germany
- 2Centre for Innovation Studies, Radboud University, Nijmegen, Netherlands
Previous research on preferences of potential Mobility-as-a-Service (MaaS) users often included public transport (PT) in bundled mobility options. Due to the often reported enormous importance of PT availability, including PT in the bundles may have led to distortions in the identification of other vehicle preferences in MaaS offerings. Our analysis counteracts this distortion and investigates how other means of transport are evaluated in mobility packages when PT is not part of the bundle. We included electric-powered mobility alternatives, which have rarely been considered in previous research, to find out which alternatives to PT users would prefer that might increase their approval of MaaS. Furthermore, the results of the existing literature are inconsistent in emphasizing whether sustainability and environmental protection are actually relevant in the valuation of different mobility options. Our analysis thus aims at identifying which electric vehicles are preferred in a mobility package, when PT is not included. We further investigate whether sustainability components of a mobility package influence the preference, structure of individuals. We based the empirical evaluation on a rank-ordered conjoint analysis, in which mobility packages were evaluated according to individual user preferences, including emissions savings. We therefore conducted a study to identify vehicle preferences other than PT and the valuation of sustainability aspects in mobility patterns. We surveyed 995 students to identify preferences and willingness to pay (WTP) for MaaS among this specific user group. Results of the empirical analysis show that preferences for an e-car and an e-scooter exist. Furthermore, we found that sustainability plays a role in the evaluation of mobility packages. Accordingly, we found, that a potential reduction in emissions leads to a higher approval of MaaS. Thus, the study extends the theoretical and empirical understanding of preference-ordering of MaaS packages and clarifies the importance of sustainability in transport choices.
1. Introduction
The global population is currently experiencing a worldwide climate crisis, and the window to counteract is rapidly closing (United Nations Report, 2022). Within a broad spectrum of environmental problems, greenhouse gases that are emitted by the extensive use of fossil energy are among the biggest, contributing significantly to global climate change. Despite the Paris Agreement that 195 countries adopted in 2015 to limit global warming to 1.5 degrees, the latest UN report predicts a 2.5-degree increase in global climate if things continue as they are (United Nations Report, 2022). In this context, the European Union (EU) has set a target of climate neutrality by 2050. The mobility sector is the second largest contributor of carbon emissions and, therefore, plays a key role in achieving this target (Banister, 2011). In the EU, the mobility sector is responsible for 26% of total carbon emissions, an increase of 29% since 1990 (Federal Statistical Office Germany, 2022a). Therefore, a shift in transportation that enables more sustainable travel is highly important for reaching the EU target of climate neutrality by 2050.
However, a sustainable transition in the mobility sector not only requires more sustainable propulsion configurations (e.g., vehicles) but also a reduction in the total number of cars and a shift to vehicle-sharing and public transport (PT). However, the appeal to sustainable development alone is not enough to encourage consumers to move their behavior toward more environmentally friendly mobility (Agora, 2019). Rather, innovative approaches to shared mobility must generate the greatest possible benefit for potential customers, to overcome the so-called intention-behavior gap concerning sustainable factors (Nguyen et al., 2019). Practical examples illustrate this problem. Various car-sharing providers (e.g., Share Now) have tried to offer profitable car-sharing services in recent years and, so far, have failed. Customer acceptance will be central to the success of a mobility transition (Bongaerts et al., 2017).
Considering these problems entails a changeover to means of mobility that engage alternative innovative concepts, with maximum customer benefit and sustainability at the same time coming into focus. Only a high level of user acceptance can lead to a functioning business model. Therefore, mobility companies must transform their individual business models into a common value-creating one (Polydoropoulou et al., 2020a). One example of such an approach is Mobility-as-a-Service (MaaS), an innovative concept that involves redesigning existing mobility infrastructure to create a service based on mobility needs rather than vehicle ownership (Kamargianni and Matyas, 2017; Agbe and Shiomi, 2021). MaaS customers can use various mobility options from different providers via one platform, an app with which the customer can plan, book, and pay for the trip and receive continuous travel information (Heikkilä, 2014). Thus, MaaS has the potential to play an important role in addressing environmental problems and promoting carbon reduction in the mobility sector (Kamargianni and Matyas, 2017; Agbe and Shiomi, 2021). It fosters the shared use of mobility by focusing on pure mobility satisfaction, leading to less private ownership and a decrease in the number of vehicles on the roads (Becker et al., 2017).
In recent literature, many studies focusing on MaaS preferences found that public transport (PT) was the most important component of a mobility package, strongly affecting whether potential customers would take up an offer or not (Matyas and Kamargianni 2018; Maas, 2021). In particular, the integration of PT into MaaS offers has made it difficult to precisely analyze preferences for other mobility options. Hence, we currently know little about preferences for mobility alternatives to PT (Becker et al., 2017; Ho et al., 2018; Ben-Akiva et al., 2019; Matyas and Kamargianni, 2019a; Alonso-González et al., 2020; Caiati et al., 2020; Maas, 2021). Furthermore, while studies have already identified core characteristics of MaaS offerings regarding preferred mobility options or payment modes (Kamargianni et al., 2016; Kamargianni and Matyas, 2017; Polydoropoulou et al., 2020a,b; Brezovec and Hampl, 2021), there is only limited detailed knowledge about preferences of specific user groups (Esztergár-Kiss and Kerényi, 2020). Therefore, implementing MaaS in addition to PT as part of the offer becomes more important, and knowledge about additional mobility alternatives becomes central. Hence, this study aims to identify preferences of potential users of MaaS, aside from PT, the factor most often rated as relevant by answering the following research questions:
1. Which vehicles are preferred in a mobility package, when PT is not included.
2. Does the degree of sustainability of a mobility package influence the preference structure of individuals?
The analysis focuses on a specific target group. The sample encompassed students only because student status gave them unlimited access to PT, with their regular study fees including a PT ticket. We established a rank-ordered conjoint analysis to examine preferences for different MaaS packages. On the one hand, this allowed a detailed look at individual preferences and structures for transportation modes besides PT, among all mobility offers. On the other hand, we can directly examine the influence of such factors as access to transport and potential carbon reduction by each offer, by including both in the MaaS packages.
The study thus contributes to recent literature in two ways. First, we respond to calls for more detailed knowledge about potential user groups (Esztergár-Kiss and Kerényi, 2020). This study focused on students, a population group previous research had not yet considered, but which could contribute substantially to a successful mobility transition. Therefore, this study offers new insights via these new frameworks. Identifying relevant mobility alternatives for this important population group and classifying user groups by taking account of current transport behavior can establish a basis for future research and more efficiently address MaaS offers, especially for students. In addition, we differentiate within this large user group, students in further clusters that we identified based on their current mobility behavior.
Second, we provide more detailed insights about the design of MaaS packages and the elements provided within them (Mulley et al., 2018; Esztergár-Kiss and Kerényi, 2020; Polydoropoulou et al., 2020b). While the vast majority of previous research focused on preferences in combination with PT (Becker et al., 2017; Ho et al., 2018; Ben-Akiva et al., 2019; Matyas and Kamargianni, 2019a; Alonso-González et al., 2020; Caiati et al., 2020; Maas, 2021), we offer new insights into potential preferences for different service characteristics through the particular subject group and study design. Inter alia, this study identifies mobility alternatives previously ignored or only weakly significant due to public transit biases. Furthermore, previous studies came to partially contradictory findings on the extent to which potential MaaS users actually consider sustainable motivations in their purchase decision (Matyas and Kamargianni, 2019b; Caiati et al., 2020; Schikofsky et al., 2020; Brezovec and Hampl, 2021; Maas, 2021). Accordingly, we provide a more holistic investigation of preferences for a MaaS offering and complement previous research. For practitioners, we provide a better basis for deciding whether to actually consider the sustainability aspect of a MaaS offering. Due to the selected method, the special structure of the mobility packages offered to respondents, and the special group of participants, this study makes an important contribution to the development of theory and expands practitioners' understanding of MaaS.
2. Consumer preferences for MaaS
The concept of MaaS has been around since 2014 (Heikkilä, 2014) and has enjoyed increasing interest in research and practice in recent years. At the beginning, studies conceptualized the concept (Jittrapirom et al., 2017) and tried to identify the core properties as well as the ecosystem (Hensher, 2017; Kamargianni and Matyas, 2017). MaaS can serve as an innovative as well as sustainable service that creates a completely new offering by redesigning existing mobility infrastructure (Hensher, 2017; Kamargianni and Matyas, 2017; Agbe and Shiomi, 2021). According to Jittrapirom et al. (2017), defining the basic concept can encompass nine core characteristics (Figure 1). MaaS focuses on satisfying transportation needs. An interface or platform should enable customers to use a wide range of mobility options from individual providers (Heikkilä, 2014). Thus, MaaS can serve as both an innovative and sustainable service creating a completely new understanding of mobility by redesigning the existing infrastructure (Hensher, 2017; Kamargianni and Matyas, 2017; Agbe and Shiomi, 2021; Marx and Weiss, 2023). Some researchers speak of an expected paradigm shift in the extent to which people understand mobility, from thinking in terms of ownership to purely satisfying mobility needs (Kamargianni et al., 2016; Caiati et al., 2020).
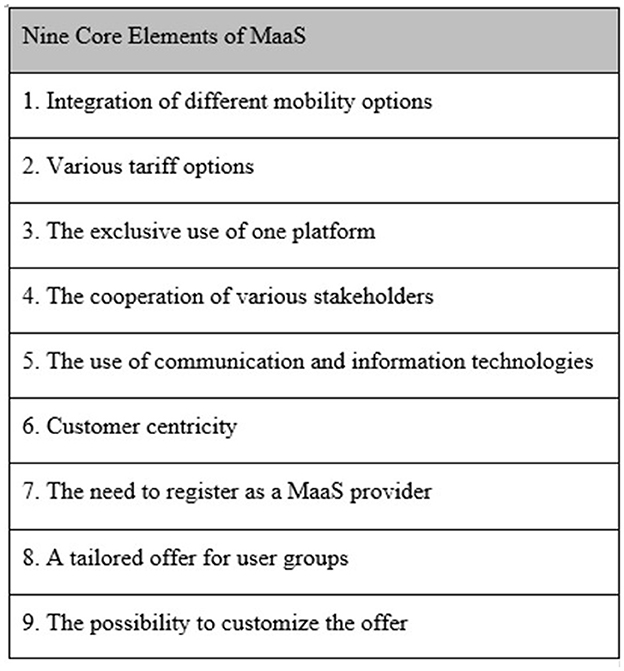
Figure 1. Nine core elements of MaaS.Own illustration based on Jittrapirom et al. (2017).
The MaaS concept is part of the platform economy, and in addition to reorganizing, it intends to efficiently combine mobility supply and demand (Caiati et al., 2020). After defining the basic characteristics, the research increasingly focused on the specific requirements of a MaaS organization and the associated business model. The MaaS concept requires close cooperation between different players in the mobility market. Providers and other stakeholders, each with a different business model, must work together to develop a common value-creating business model all can endorse (Kamargianni and Matyas, 2017; Polydoropoulou et al., 2020a).
During the last six years, the focus has increasingly shifted from identifying the characteristics of various aspects of a MaaS offering to its potential users and their preferences (Becker et al., 2017; Ho et al., 2018; Alonso-González et al., 2020; Caiati et al., 2020; Esztergár-Kiss and Kerényi, 2020; Brezovec and Hampl, 2021). Various studies show that people are currently not willing to pay for a MaaS offer (Caiati et al., 2020; Agbe and Shiomi, 2021). The reasons are diverse, and various research approaches attempt to explain why consumers favor a MaaS offering or not. The approaches identify preferences for different offer characteristics (Becker et al., 2017; Ho et al., 2018; Alonso-González et al., 2020; Caiati et al., 2020; Brezovec and Hampl, 2021; Maas, 2021) as well as sociodemographic traits (Becker et al., 2017; Durand et al., 2018; Ho et al., 2018; Alonso-González et al., 2020), previous mobility behavior (Becker et al., 2017; Ho et al., 2018; Alonso-González et al., 2020; Agbe and Shiomi, 2021), and social factors (Caiati et al., 2020; Schikofsky et al., 2020). Some studies argue that the current transport system is not yet overloaded enough, i.e., the benefits of individual mobility and vehicle ownership are still too great for individuals to change their transport behavior (Esztergár-Kiss and Kerényi, 2020). Or people may not yet be familiar with the concept of MaaS and, hence, cannot properly assess the possible benefits (Ho et al., 2018).
Therefore, the identification of preferences and the determination of customer groups have become the focus of recent research. These studies usually give subjects the choice of different mobility packages, from which they had to select one, or the opportunity to assemble their own mobility package from different components (Becker et al., 2017; Ho et al., 2018; Alonso-González et al., 2020; Caiati et al., 2020; Esztergár-Kiss and Kerényi, 2020; Brezovec and Hampl, 2021). Various studies show that the implementation of PT is particularly important to potential MaaS users (Matyas and Kamargianni, 2019a,b; Caiati et al., 2020; Esztergár-Kiss and Kerényi, 2020; Agbe and Shiomi, 2021; Brezovec and Hampl, 2021). In this regard, users are willing to pay more if a MaaS offering includes PT (Guidon et al., 2020). Price generally seems to be the most important decision criterion for potential MaaS users (Brezovec and Hampl, 2021). Nevertheless, the WTP for MaaS currently appears at a low level. One study shows that people's average WTP mark for MaaS is less than their current total travel expenditure (Agbe and Shiomi, 2021). Another relevant mobility option that some studies identify is car-sharing (Esztergár-Kiss and Kerényi, 2020; Brezovec and Hampl, 2021). In part, bike-sharing has been identified as important to potential users in a MaaS package (Ambrosino et al., 2016; Kamargianni et al., 2016), cab services not so important (Caiati et al., 2020). Generally, the WTP as well as payment methods for mobility options differed. For example, potential users could well imagine a subscription model for PT but preferred pay-as-you-go for bike-sharing (Caiati et al., 2020; Esztergár-Kiss and Kerényi, 2020; Brezovec and Hampl, 2021). Users are often most satisfied when the MaaS offer is a good fit with their actual usage profile. Existing MaaS solutions show that the choice of an individual mobility offer is important for users who want to be able to put together an offer tailored to their personal needs. In this regard, potential users place high demands on a mobility service for autonomy, flexibility, and reliability (Durand et al., 2018).
In addition to mobility alternatives, various studies have included different aspects in the investigation. In some cases, they have identified a significant influence of sociodemographic factors. In studies that show the influence of socioeconomic characteristics, users of shared mobility are usually young, highly educated, and living in urban regions (Becker et al., 2017; Durand et al., 2018; Ho et al., 2018; Alonso-González et al., 2020). A car-sharing study suggests that it makes a difference whether the service is station-based or free-floating. The users of free-floating services are younger and mostly male. Students were overrepresented users in some population comparisons (e.g., Becker et al., 2017). On the other hand, some studies found no significant effect of sociodemographic factors, such as age, and sustainability-related variables were also not statistically significant. The attitude-behavior gap is cited here as an explanatory approach (Guidon et al., 2020; Brezovec and Hampl, 2021).
Previous mobility behavior seems to have an influence on willingness to use MaaS. Agbe and Shiomi (2021) found that an application for trip planning, in practice providing information about the ride as well as a digital payment solution, is positive related to the likelihood of a successfully implemented MaaS offer. In this regard, another study found that people with a multimodal mindset are using more complex strategies for travel choices and rely on travel information for transport alternatives (Alonso-González et al., 2020). Furthermore, consumer behavior influences the evaluation with regard to the attractiveness of a MaaS offer. For example, frequent car users show less interest than users of a PT ticket (Ho et al., 2018; Alonso-González et al., 2020). In particular, previous research found that car ownership determines a negative attitude toward MaaS (Ho et al., 2018; Alonso-González et al., 2020), and individuals with a season ticket were more positive about shared mobility (Becker et al., 2017). Social factors also seem to have an influence. Potential users are more willing to use a MaaS service if people from their own social environment are already using the service or, vice versa, more unwilling (Caiati et al., 2020; Schikofsky et al., 2020).
In addition to supply preferences, research has increasingly focused on the identification of user groups. Thus, various studies have identified user groups on the basis of preferences, sociodemographic factors, or mobility behavior. The studies try to classify user groups in connection with the willingness to buy a MaaS, or studies group them on the basis of mobility behavior. Basically, user groups that are willing to buy have a high income, a high level of education, a car at their disposal, and already use PT. The non-buying groups are older people and do not have a car (Zijlstra et al., 2020; Brezovec and Hampl, 2021). The results on car ownership seem partially contradictory; one study even showed that the more vehicles someone owns, the more likely he or she will be an early adopter of MaaS. However, researchers believe that the number of vehicles is also a sign of prosperity and a particularly active and mobile lifestyle (Zijlstra et al., 2020).
Due to the lack of a concrete basis for the analysis of mobility packages with electric means of transport in our specific context, we have proceeded in an exploratory way. The exploratory methodology chosen to identify preferred components in mobility packages is explained in more detail in the following section.
3. Research methodology
Conjoint analysis (CA) is one of the most widely used stated-preference methods for determining preferences as well as WTP in non-market scenarios. It aims to identify competitive offers for services, products, or packages of these. For this purpose, comparing compositions of different attribute characteristics with each other enables identifying the strength of individual characteristics' influence and importance on the overall attractiveness of offers and to quantify them by means of various decompositional methods (Alriksson and Oberg, 2008). A clear advantage of CA is that it places respondents in a scenario that corresponds to a real purchase decision. They must choose between offers with different characteristics (Backhaus et al., 2018). As the construct of bundled mobility offers is quite new and offered only little in practice CA helps determine MaaS preferences and WTP in a hypothetical scenario.
We can distinguish between evaluation- and choice-based CA. Evaluation-based CA rates different offers either individually or in relation to each other. Participants receive various packages consisting of different characteristics to be sorted ordinally, or characteristics to rate independently of each other, in terms of importance. This method is especially useful in early phases of creating offers, when the exploration of possible package variations is in the analytical foreground, to determine which characteristics are relevant for potential customers (Baier and Brusch, 2021). In choice-based conjoint analyses, respondents repeatedly encounter decision situations in which they select one or more packages as the most attractive, according to their preferences (Baier and Brusch, 2021). The literature often describes the evaluation-based CA as less realistic, since the comparison involves a larger number of characteristics than typical of real decision-making situations. However, ranked individual data enables estimating separate coefficients for each characteristic and each individual, providing information about individual preference structures across all bundles (Beggs et al., 1981).
3.1. Survey design
We used an online survey of nearly 995 students to investigate individual preferences for different mobility packages. Since we conducted the survey online, we instructed the participants to complete the entire questionnaire autonomously.
As the aim of this study was to learn which electric transport modes potential users preferred in a MaaS offer, under the assumption that quasi-free access to PT already exists, we investigated an early phase of the offer creation, to identify relevant characteristics for potential MaaS users. We included an e-car, an e-bike, and a motorized e-scooter or e-cargobike, respectively. Previous research had already found hints that access to micromodal transportation, such as e-bikes, e-scooters, or e-cargobikes, may support regular usage of PT (Caiati et al., 2020; Brezovec and Hampl, 2021; Maas, 2021). Furthermore, access to car-sharing was found to increase approval for MaaS (Brezovec and Hampl, 2021). Therefore, these vehicles appeared in the offer creation. However, we included a motorized e-scooter in the analysis to expand the state of research on the influence of different means of transport. In addition to the electric-powered vehicles, we included access time required to use the offer. Access time reflects the frequency, speed, and accessibility of the respective stop or rental station. We included two values for access time, associating offers with either an access time of zero minutes, implying a direct possibility of using a vehicle (as with one's own car), or 30 minutes. Furthermore, we included information on potential carbon dioxide (CO2) saving, describing different amounts of CO2 that choosing an offer would save. Through mobility, a person in Germany annually causes the release of an average of 2.5 tons of CO2. For this reason, we defined two values for the characteristic carbon reduction, such that it varies within the packages between a saving of 0.5 tons or 2 tons of CO2.
By considering access time and carbon reduction as part of a package, we could directly include the two characteristics in analyzing the respondent preference structure. The features are fixed components of the packages that respondents evaluated. Thus, we could assess the extent to which both access time and carbon reduction play a role in mobility patterns, in relation to preferences regarding transport modes as well as price. Due to this explorative investigation, a rank-ordered conjoint analysis (ROCA) was part of the online survey to analyze the preference structure of individuals deciding between different mobility packages that included electric-powered vehicles. As part of the ROCA, we created a hypothetical scenario in which we asked respondents to rank the mobility offers according to their personal preferences, with the best offer at the top and the offer they rated worst at the bottom.
Many MaaS studies looked at which price options user prefer for bundled mobility offers (Ho et al., 2018; Polydoropoulou et al., 2020b; Vij et al., 2020). Since the study focused on finding out which electric-powered transport modes in a package user particularly valued, independent of PT, we assigned fixed prices they would incur for monthly use of the packages. We randomly assigned two different package versions. As too many different characteristics can overstrain respondents, leading to biased data collection (Baier and Brusch, 2021), one group received an e-cargobike as an additional mode of transportation; the other group was presented with an e-scooter. All other characteristics but these were held constant. Figure 2 shows the same mobility package for the “E-Scooter” group and for the “E-Cargo” group, respectively.
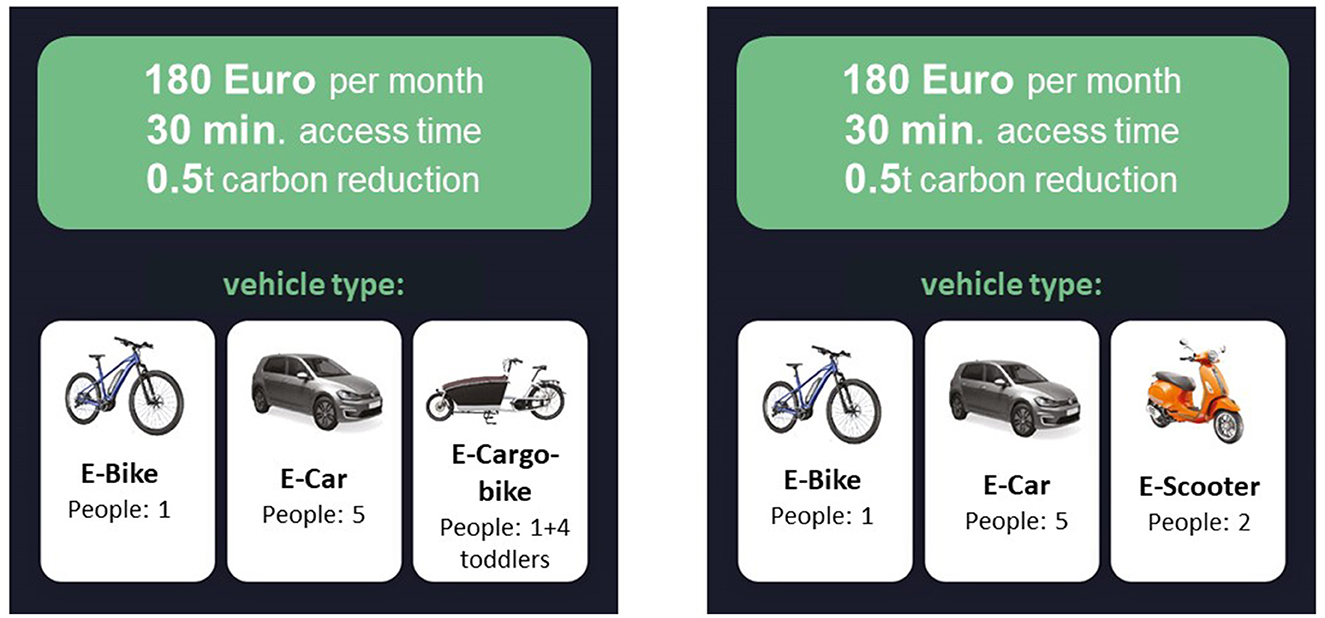
Figure 2. Mobility packages.
As our analysis aims at identifying relevant characteristics, aside from the factor most often rated as relevant (PT), we considered a unique target group. The study sample exclusively encompassed students of a university who had unrestricted access to PT via their student status. A PT ticket for the entire surrounding region was included in the regular semester fees. All enrolled students could automatically use a PT ticket without additional costs.
To compute realistic price components for the mobility package, we conducted a data-based study of all providers of the included mobility options in the region. We compiled the data and calculated average values to realistically assign four different price levels of 30, 90, 110, and 180 euros. All values were input to SPSS, to compile an orthogonal design for the package creation. Table 1 summarizes all packages the respondents saw, with an e-scooter or an e-cargobike, respectively. Offer 9, with a price of 30 euros and only an e-bike included presented the baseline scenario.
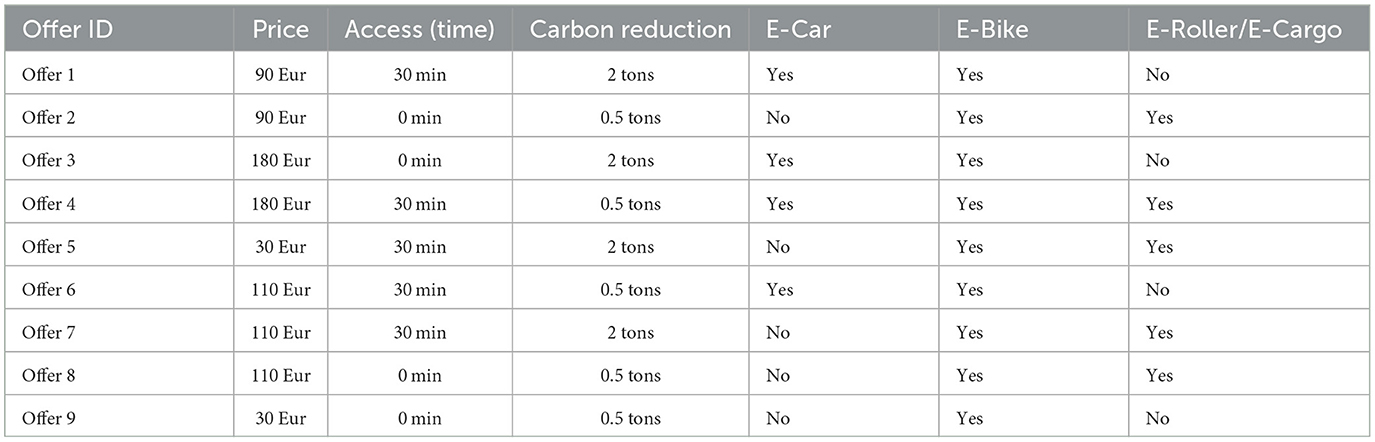
Table 1. Mobility packages.
In this context, ROCA is a helpful tool for analyzing individual rankings. The ranking of mobility packages by respondents is used to determine the weighting of the benefits of the individual components, since the goal of the analysis is not to examine the popularity of the packages as a whole, but rather identifying the importance of the individual components of a package.
3.2. Data description
Our study included carbon reduction as a factor in the offers to rate. Therefore, we could measure utility not only deriving from different modes of transportation and the price but also from the environmental impact of each package, expressed as carbon reduction. Many studies control for attitudinal factors, such as valuation of sustainability and environmental protection or recent mobility behavior, that can impact MaaS preferences (Guidon et al., 2020; Agbe and Shiomi, 2021; Brezovec and Hampl, 2021; Maas, 2021). Thus, we surveyed socioeconomic as well as psychological and behavioral factors, to measure the distribution of the sample in terms of the respondents' relation to environmental protection, their attitudes toward different modes of transport, and their previous mobility behavior. Table 2 displays all variables of particular interest for a descriptive analysis of the sample, its means, and standard deviations. A five-point Likert scale measured the attitudinal variables. We converted these into dummy variables, to show the distribution within the sample and simplify interpretation of the values. As the sample consisted of students only, it is not surprising that an average age of about 22.8 years emerged, similar to the mean age of 23.5 of students in Germany (Federal Statistical Office Germany, 2022b). In line with the allocation of students in Germany, with 50% being male (Federal Statistical Office Germany, 2022c), the share of females in the sample at 54% was slightly higher than the share of male respondents at 46%.
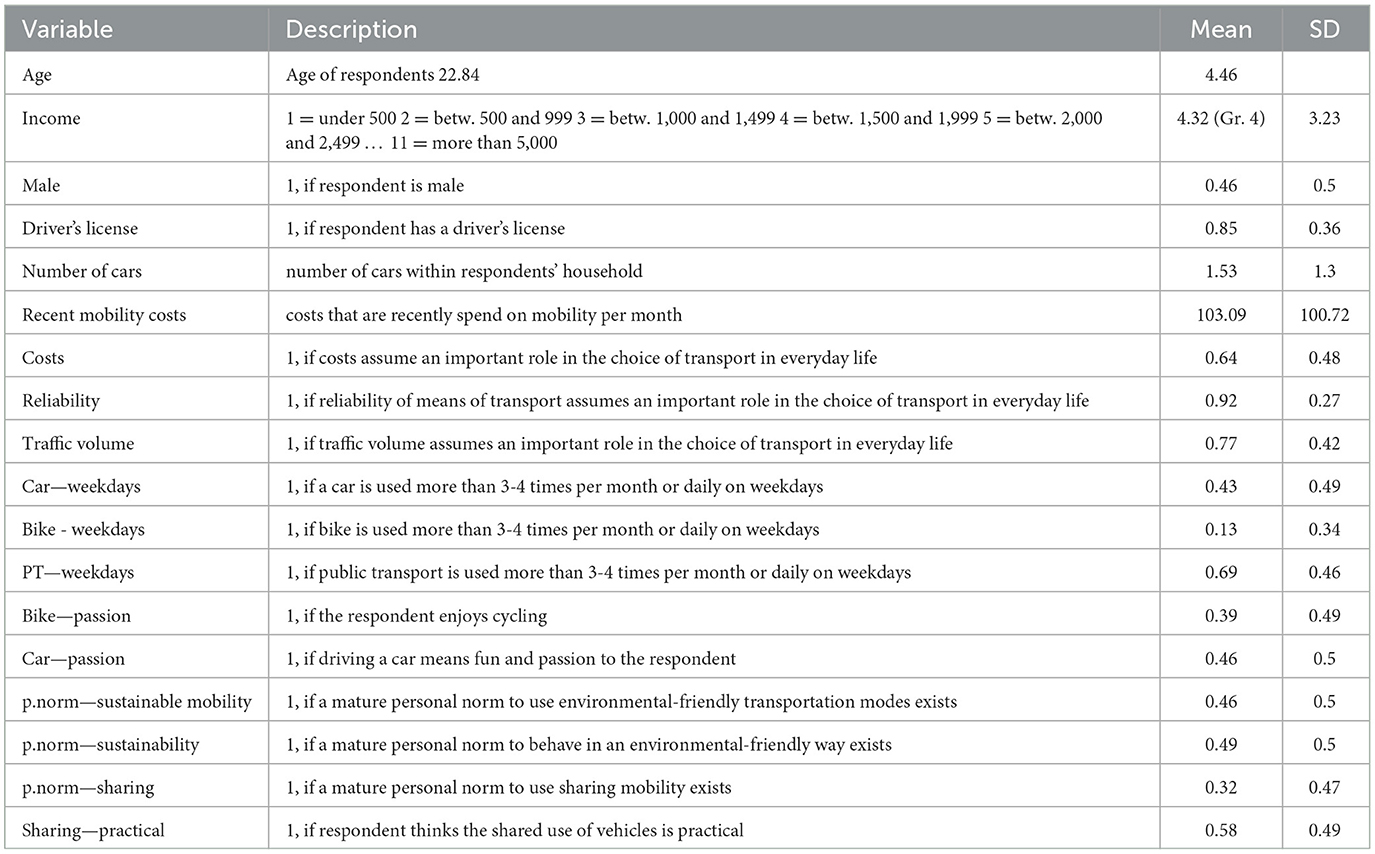
Table 2. Description of socioeconomic and psychological explanatory variables.
However, respondents to the study reported a high mean income, with 1,500–1,999 euros monthly income per household, compared to a mean income of 930 euros among students in Germany (Middendorff et al., 2017). This may be due to the fact that the university of interest is often considered a commuter university, implying that some of the students still live with their parents during studies. Eighty-five percent had a driver's license and about 1.5 cars were available on average in respondent's households. Furthermore, they spent 103.09 euros per month on average on mobility. This reflects not even half the mobility costs the population in Germany incurred (on average, 233 euros) (Federal Statistical Office Germany, 2022d). Andor et al. (2020) found that many people significantly underestimated their monthly costs for mobility, particularly costs of car usage, which would explain the reported average value in our sample. In addition, the sample comprised a very specific target group. Students in the sample had a ticket for PT, with which they incurred no extra mobility costs, as the semester fees included them. Sixty-four percent of the respondents stated that costs played a significant role in deciding which mode of transportation they would use, and about 90% to 95% recorded that the reliability of the respective mode of transportation was important. Regarding the sample's recent mobility behavior, 43% were regularly using a car for everyday mobility during the week, while only about 13% went by bike, despite 39% recording that they enjoyed bike-riding. About 71% were regularly walking while 69% used PT. This large amount of PT usage seems unusual in the first place, but the special sample of students with automatic access via their student status puts it in perspective. Almost 50% of the sample indicated that they felt either personally motivated or responsible for using environmentally friendly transportation modes and/or to behave generally in an ecological way. Further, more than half of the sample recorded that sharing mobility was actually quite practical for everyday mobility.
We used the explanatory variables to perform a t-test to show that we assigned e-cargo/e-scooter packages randomly across the sample and that no significant differences occurred between the groups. However, we found that two slightly significant differences existed regarding the importance of reliability of everyday mobility in the choice of transportation modes and considering as a mature personal norm the use of environmentally friendly transportation. Ninety-four percent valued reliability as an important factor in the choice of transportation in the “E-Scooter” group, compared to 90% in the “E-Cargo” group, while about 49% in the same group described as a mature personal norm using environmentally friendly modes of transportation, compared to 42% in the “E-scooter” group. The full results appear in Table 3.
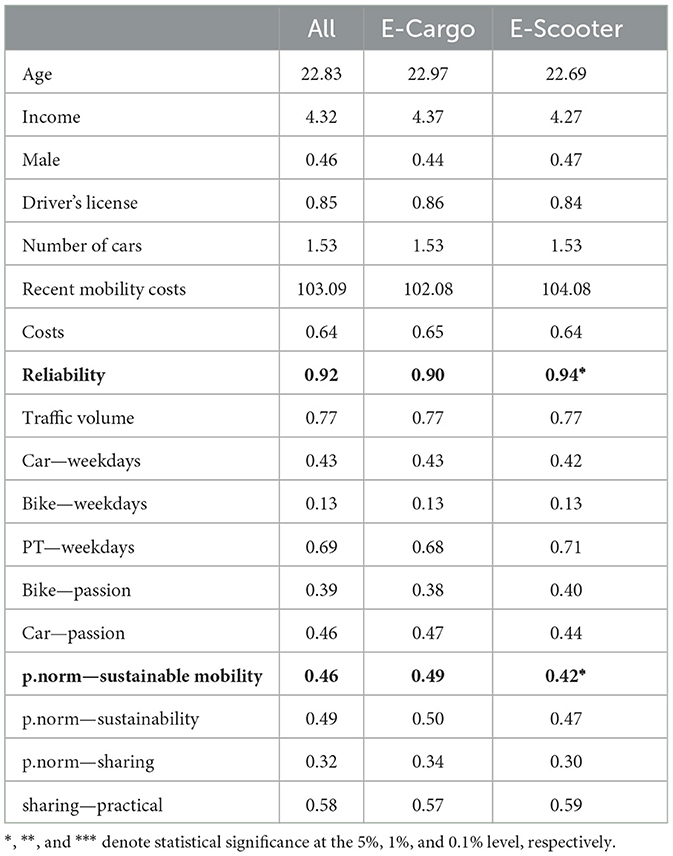
Table 3. Comparison of means of explanatory variables.
3.3. Cluster analysis
The analysis of rank-ordered conjoint data, emphasizes the effects of the different package characteristics on ranking, but not respondents' individual characteristics regarding mobility behavior. Accordingly, an additive effect of these characteristics on the evaluation of the alternatives cannot be determined directly. Thus, we further perform a cluster analysis to build on previous MaaS studies and control for differences in all-day mobility patterns of respondents, which can lead to different results in package ranking (Ho et al., 2018; Alonso-González et al., 2020; Brezovec and Hampl, 2021; Maas, 2021). Following Maas (2021), the sample was clustered using the k-means method. However, unlike Maas (2021), we used mobility behavior only to classify the sample, regardless of further attitudinal factors. This aligns with Ho et al. (2018), who found that approval for MaaS offers depends explicitly on current travel behavior. In their study, they clustered respondents into four groups according to the frequency of car usage during a typical week. As this sample comprised a PT-oriented target group, it included not only car usage as a determinant in the process of clustering according to travel patterns. Frequency of PT usage during weekdays, as well as bike usage were also included, each measured on a five-point Likert scale ranging from “(almost) never” to “every day”. In line with Hinkeldein et al. (2015), the study sample was clustered in several steps. A hierarchical cluster analysis was first established using single-linkage clustering. Examining the sample using the Ward's method previously used in transportation research (Eszergár-Kiss and Caesar, 2017) as well as complete-linkage clustering, we identified three clusters as an efficient number of classifications after analyzing resulting dendograms. We then used the partition k-means method to group the sample into three clusters, according to recent mobility behavior. Figure 3 shows the resulting classification of the sample for both groups, “E-Scooter” and “E-Cargo.” “Multimodals” in the sample seldom used the car but drove by bike or used PT (more than) 3 or 4 times per month. However, car users almost never used the bike and seldom used PT. PT users in the sample travel that way almost exclusively.

Figure 3. Frequency of vehicle usage among clusters.
Table 4 shows the total distribution of the sample among clusters. PT and car users are distributed similarly, with 457 respondents often using PT, and 373 respondents using the car. A total of 165 respondents indicated that they frequently used all three means of transport in everyday life, PT and the bike in particular.
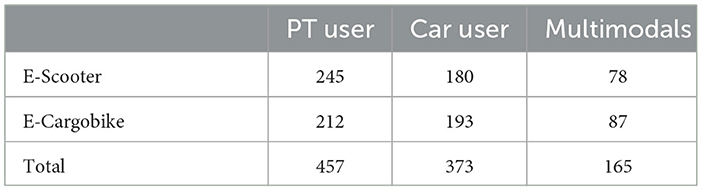
Table 4. Distribution of respondents among clusters.
Table 5 presents a descriptive analysis, using a t-test to examine how much the clusters differed considering socioeconomic, psychological, and attitudinal factors. We tested the clusters “Multimodals” and “Car User” for significant differences from the “PT User” Cluster. According to the data, mean values in the cluster “Car User” differed significantly not only in the frequency of PT and bike usage during the week, to be expected due to classification; they differed significantly for almost every variable. Of particular interest are the differences in the variable costs, p.norm - sustainable mobility, and p.norm– sustainability, as well as sharing—practical. Car users exhibited significantly lower mean values, suggesting that fewer people on average consider sustainability and costs in the choice of transportation and feel personally indebted to behaving in an environmentally friendly way.
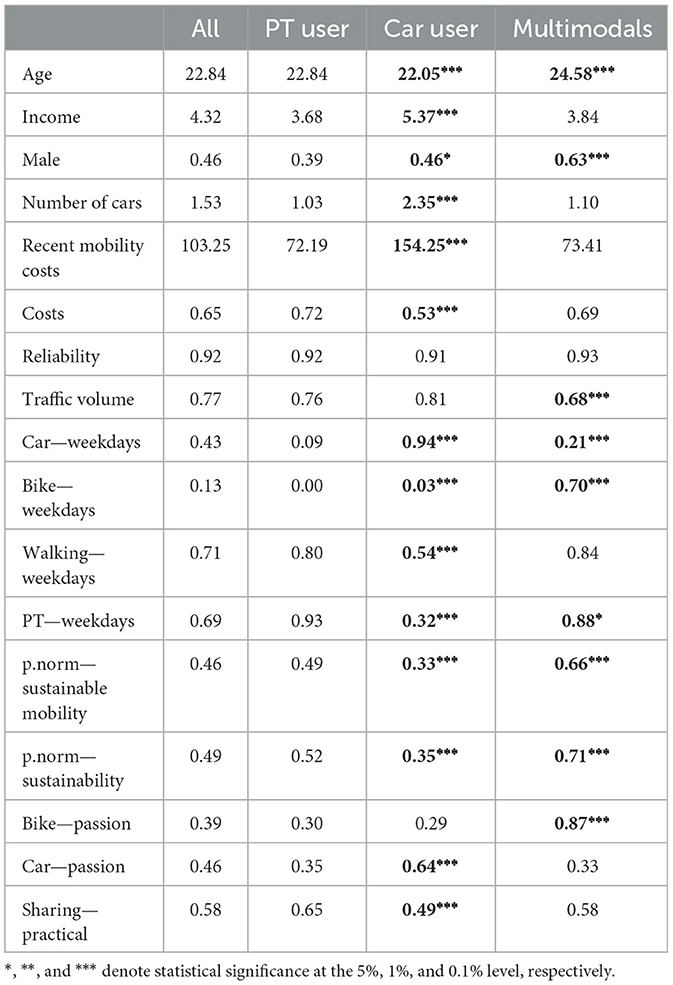
Table 5. Comparison of means of explanatory variables among clusters.
Additionally, significantly fewer people in the car-user cluster valued sharing mobility as a practical type of mobility. However, income as well as number of cars per household and recent mobility costs were higher on average in the cluster “Car User” than in “PT User” and “Multimodals” clusters. The latter stated a significantly higher value in p.norm - sustainable mobility and p.norm—sustainability. Sixty-six percent included aspects of sustainability in their mobility decision, and about 71% stated that they considered sustainability in their everyday life. Moreover, about 70% in this cluster drive by bike more than 3–4 times per month during the week. Hence, we can also consider “Multimodals” a more bike-oriented cluster since the mean value of bike—passion reveals that 87% enjoy riding a bike. Eighty-eight percent of “Multimodals” regularly used PT, only 5 percentage points less than “PT Users” who do. These results confirmed previous findings, indicating that mobility patterns correlate with attitudinal as well as socioeconomic characteristics (Prillwitz and Barr, 2011; Hinkeldein et al., 2015; Andor et al., 2020) and, therefore, influence the choice of such transport alternatives as MaaS (Ho et al., 2018; Alonso-González et al., 2020; Maas, 2021).
3.4. Empirical model
3.4.1. Rank-ordered logit model
We based the empirical analysis on work by Allison and Christakis (1994), who recommended a rank-ordered logistic regression model (ROL) to examine rank-ordered data, first established by McFadden (1973) as a conditional logistic regression model. Beggs et al. (1981) later generalized McFadden's conditional model and demonstrated that the generalized model can be used further to analyze ranked data on an individual level. Since then, the model has become well-known in the economic literature as a reliable tool to analyze rank-ordered choice data (Allison and Christakis, 1994). A clear advantage of the ROL model is that it allows a ranking of all alternatives, considering them in the analysis on an individual level, rather than selecting the most preferred option only (Fok et al., 2012), as measured in well-known variants of CA, e.g., choice-based CA. Collecting data in ranked order enables deriving a clear preference ordering. The impact of all values of the different package characteristics is observable as each package is rated individually and assigned to a direct rank. Systematic differences in the preferences of response options, as well as the influence of different characteristics on the popularity of a choice option, can be identified (Allison and Christakis, 1994).
The ROL was based on a random utility model (Beggs et al., 1981; Allison and Christakis, 1994; Fok et al., 2012). Therefore, the following utility model is assumed on the basis of previous theoretical findings (Manski, 1977; Allison and Christakis, 1994).
Uij presents utility U for individual i for each package j, running from 1 to 9 as nine offers were presented to the respondents. Assuming that respondent i ranks package or offer j higher than a further offer k, then Uij > Uik holds, in line with traditional economic consumer theory. In the model, utility Uij is composed of μij reflecting the extent to which respondent i prefers offer j over other offers presented and a random component ϵij together. Thus, μij can further be described as a vector of explanatory variables influencing the utility deriving from the respective offer and, thus, also affects the preference order of the ranking.
xi represents attributes of the respondents, and zj reflects attributes of the packages. In line with traditional economic consumer theory, Uik > Uij applies if a package k is ranked higher than package j. With rank rij given by individual I for each alternative j, the following preference ordering can be assumed (Ranasingha et al., 2019):
Since a logistic model was applied for the empirical analysis, probabilities were calculated indicating the influence of a characteristic on the ranking of the offers. Therefore, based on the mathematical formulations derived, the following formulation applies for the probability of a high ranking (Ranasingha et al., 2019).
The empirical analysis of the ROL was made in STATA 16 using the CMROLOGIT command for rank-ordered choice models. The dependent variable Prob (rij) is the probability of an offer observing a particular rank, which takes a value between 1 to 9 for the nine different offers respondents received. The model assigns a unique rank to each mobility package the survey presents, so no ties occurred in the data.
β represents the respective regression coefficient of CMROLOGIT, meaning the value that indicates the extent to which a characteristic does or does not influence the probability of a higher ranking. The variable pricei illustrates the price of a package and can take the value 30, 90, 110, or 180. All other variables were transformed into dummy variables taking a value of either 1 or 0. Accordingly, if no access time occurs, the variable accesstimei takes the value 0 and 1 otherwise, when an access time of 30 minutes must be considered for the usage of the mobility mode offered. For carbon reduction of 0.5 tons that results from using an offer, carbonreductioni equals 0 and takes the value 1 if a high carbon reduction of 2 tons would be obtained. The same holds for the different modes of transportation being either included in an offer (=1) or not (=0). γij represents the error term.
3.4.2. Willingness to pay
To further analyze the influence of different prices and, hence, provide insights into students' WTP for mobility packages that have the potential to complement access to PT with other means of transport, real WTP values were calculated. From the random utility model (Manski, 1977; Allison and Christakis, 1994), we know that utility U consists of a systematic component μij and a random component ϵij
Furthermore, the following additive linear relationship of the random component can be assumed (Ranasingha et al., 2019; p. 106).
with zipresenting the attributes of the package and pj its respective price. Differentiation of this formula leads to the marginal utility the attribute provides and the marginal utility of price. WTP can then be stated as the marginal rate of substitution between attribute zi and price pj, expressed by the ratio between estimated coefficients, showing the influence of each characteristic on the respective ranking (Ranasingha et al., 2019; p. 106).
4. Results
4.1. Results of the rank-ordered logit model
Table 6 presents estimation results of the ROL, calculated using the CMROLOGIT command. Coefficients in this model can be interpreted as the probability of a higher/lower ranking that increases/decreases when a particular value of a characteristic is included. In both groups, the price had a highly significant negative influence on the ranking. Estimation results showed that a higher price affected the ranking negatively.
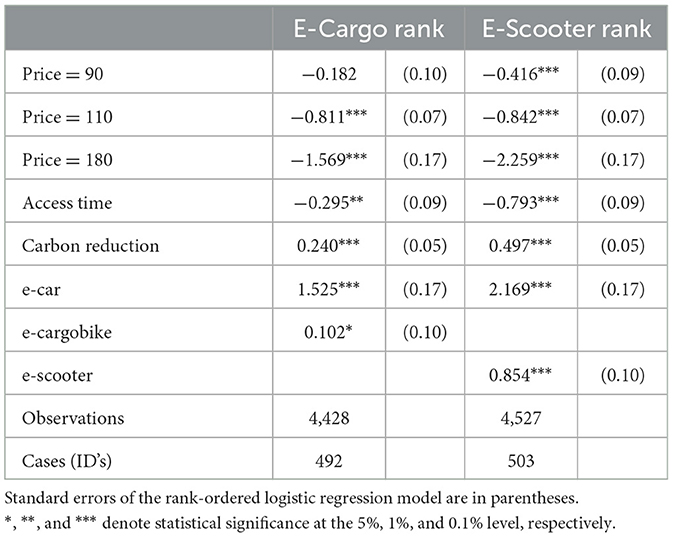
Table 6. Rank-ordered logistic regression model.
However, all coefficients in the group “E-Scooter” were more distinct than in the group “E-Cargo.” A price of 90 euros had a negative effect on the ranking with respect to the baseline price of 30 euros in this group, while no significant effect occurred in the “E-Cargo” group at this price level. Regarding the effects of transportation modes, of particular interest for the analysis, including an e-car in packages positively affected the ranking to a remarkable extent, although, a greater influence on the ranking appeared in the e-scooter group, with a value of 2.17 compared to 1.53. According to these results, an e-car can be the most important determinant in the valuation of different mobility packages, despite PT. Introduction of an e-cargo-bike affected the valuation little, as probability of a higher ranking increased by 10% only at a 5% significance level, while including an e-scooter had a strong and highly significant positive effect, with a value of 0.854 at a 0.1% significance level. Considering the factor carbon reduction, representing the environmental impact that could be decreased by choosing the respective package, and access time, meaning time accrued until departure, the former actually had a positive influence on the ranking, while the latter influenced the ranking negatively. An access time of about 30 min in the “E-Cargo” group decreased the probability of a package's higher ranking by 30%. In the “E-Scooter” group, the coefficient was even higher, with almost a 79% reduction in the probability of a high ranking when 30 minutes of access time occurs. A 2-ton carbon reduction, however, increased the probability of a high ranking by 24% (E-Cargo) and 50% (E-Scooter). These coefficients confirm that both factors affected preferences and are important determinants in transportation choice.
Furthermore, results reveal that in a mobility package, students clearly preferred an e-scooter over an e-cargobike. The coefficient of an e-cargobike was significant and positive, so the introduction slightly increased the probability of a better ranking. However, the coefficient of an e-scooter indicated a probability of an 85% better ranking when including an e-scooter.
4.2. Results of the willingness to pay analysis
To offer further insights into potential WTP and examine the impact of each characteristic on utility, we calculated WTP values (see section 3.2). We ran the ROL again, but this time without including the individual price indicators separately in the regression, so that one coefficient only reflected the impact of the price variable on the package with all four price levels. This slightly relativized the stronger effects resulting from the baseline model in the “E-Scooter” group as can be depicted from Table 7.
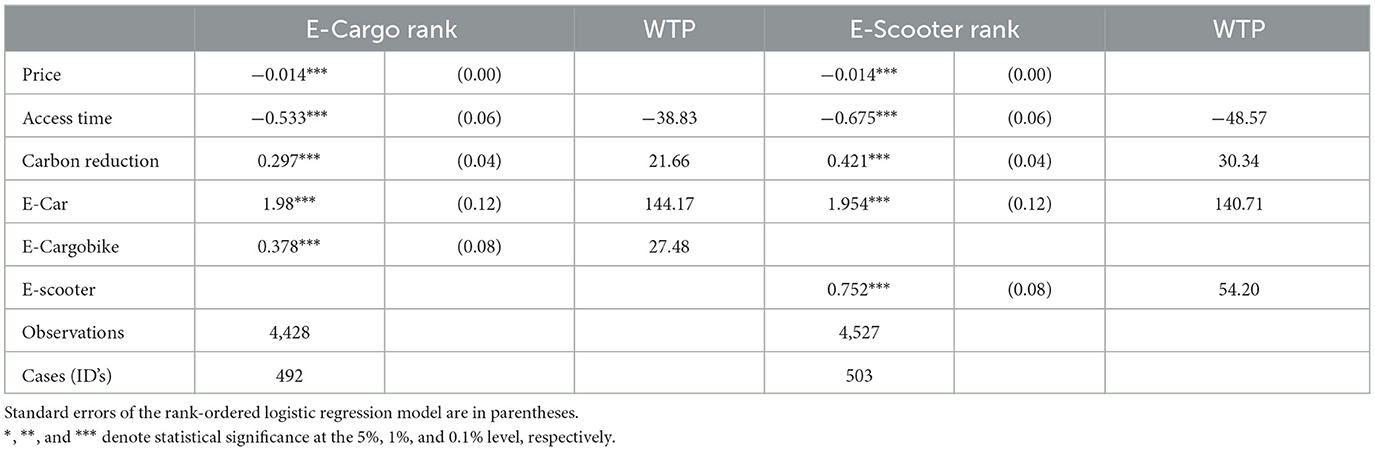
Table 7. WTP values.
However, the tendency of the individual attribute influence did not change but underlined the findings of the baseline model. As all characteristics influenced the ranking of the offers, we could calculate WTP values for each attribute. The variables access time, carbon reduction, and e-car revealed similar WTP values in both groups. Access time reduced WTP for a mobility package by 38.83 euros when access time of 30 minutes occurred in the “E-Cargo” group and decreased WTP by about 48.6 euros in the group “E.-Scooter.” However, carbon reduction was worth 21.7 euros (E-Cargo) and 30.3 euros (E-Scooter) more, paid when utilizing a respective offer could obtain a higher carbon reduction of about 2 tons. Referring to WTP values that we calculated for the availability of an e-car in an offer, results are in line with ROL estimates, implying that an e-car is the most important predictor in the valuation of a mobility offer. Accordingly, 144.2 euros (E-Cargo) and 140.7 euros (E-Scooter) more would be paid for an offer including an e-car. In line with regression estimates, WTP values reveal further that an e-cargobike in a monthly mobility package is valued at about 27 euros while for an e-scooter, respondents would pay about 54.2 euros.
Furthermore, we asked respondents whether they would buy the offer they ranked best in a real consumption scenario. We found that 588 respondents (59%) would buy the offer they ranked best. 407 respondents (41%) however would not buy the best-ranked offer.
4.3. Results by clusters
To test recent findings from the literature regarding the influence of mobility behavior (Brezovec and Hampl, 2021), preferences for electric powered vehicles in MaaS and its potential to complement PT on this very specific sample, we conducted a cluster analysis based on recent mobility behavior. Table 8 presents estimation results of the group “E-Cargo” after clustering the sample into three, according to subjects' recent usage of cars, PT, or multimodal mobility.
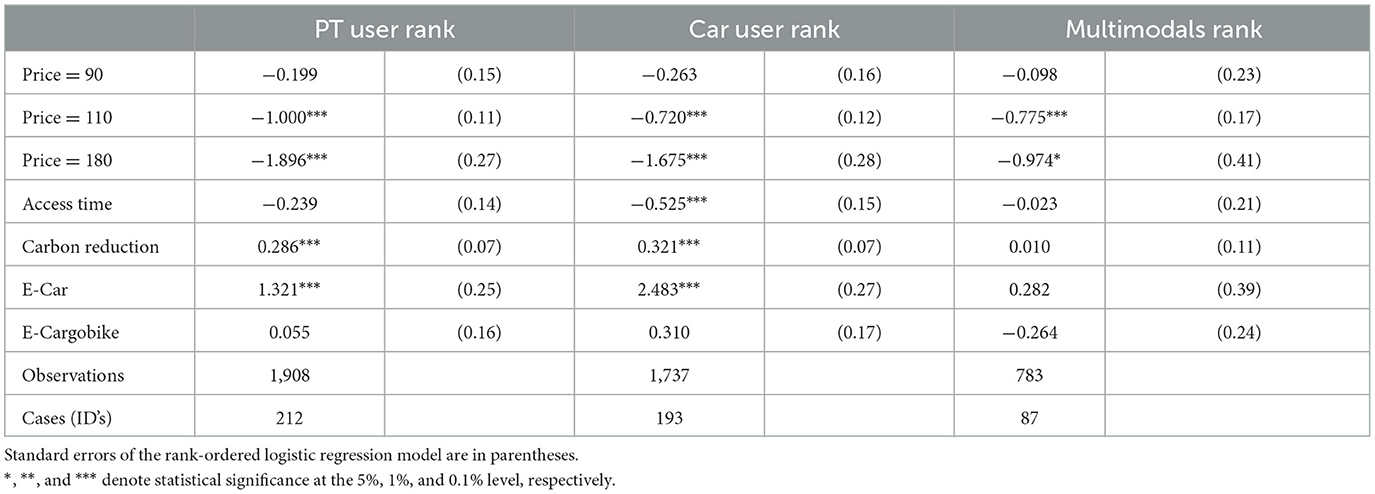
Table 8. ROL within cluster “E-Cargo”.
Price values had similar effects on ranking among all three clusters. However, the effect slightly differed across groups. Noteworthy is the large difference in the coefficient for the price being equal to 180 Euro in the cluster “Multimodals.” While “PT User” reveals a negative effect of −1.90 and “Car User” −1.68, the influence of a price of 180 euros among “Multimodals” is meaningfully lower at −0.97. Also striking is that apart from price, no other characteristics had a significant effect on the ranking in this cluster. Furthermore, results showed that “PT User” is not susceptible at all to an access time of 30 min, while “PT User” and “Car User” considered carbon reduction equally when evaluating the offers. As expected, the valuation of a car in the ranking is by far highest among car users, with a coefficient of 2.48 compared to 1.32 in the cluster “PT User.” There was no significant effect in the multimodal group. Including an e-cargobike does not affect the ranking in any cluster underpinning the baseline model results, showing only small effects of an e-cargobike on the package rankings.
Table 9 shows estimation results after clustering respondents who received an e-scooter instead of an e-cargobike. Almost all price levels negatively affected the ranking in the clusters. However, slight differences occurred regarding the negative effect of prices at 90 and 110 euros.
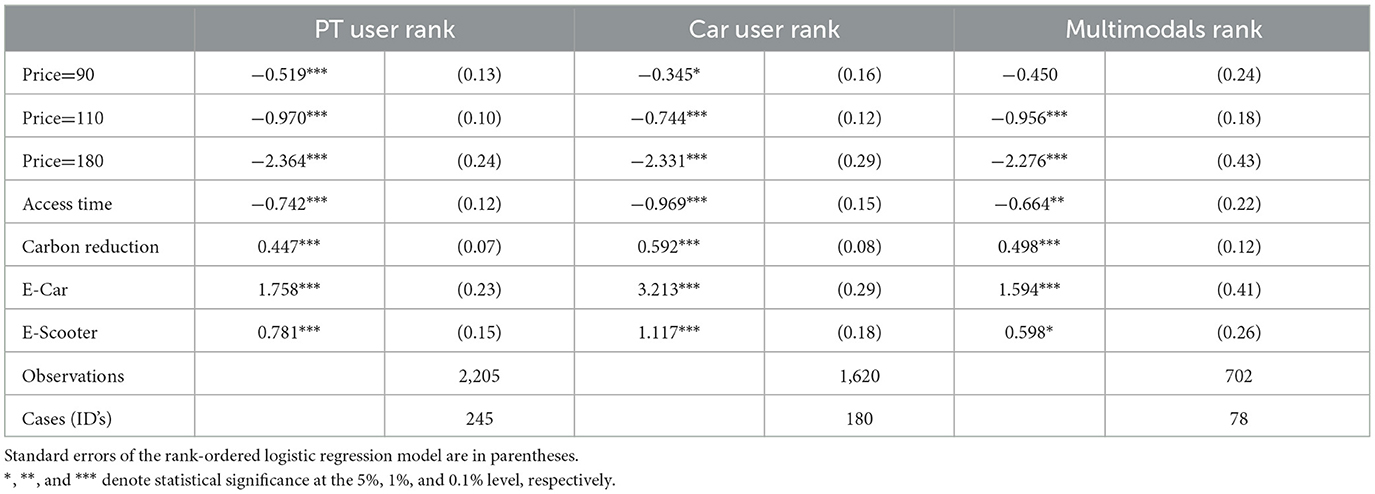
Table 9. ROL within cluster “E-Scooter”.
“Multimodals” showed no significant effect at a price level of 90 Euro. But, at the price levels of 110 and 180 euros, a similarly high and significant effect appeared among clusters. Access time and carbon reduction also showed significant values in all clusters. While coefficients in the “PT User” and “Multimodals” cluster, with −0.74 and −0.66 (access time) and 0.45 and 0.50 (carbon reduction), showed a similarly strong influence on the respective ranking, a stronger influence of both characteristics appeared in “Car User.” With −0.97, the negative influence of access time in particular was significantly higher than in the other two groups. An e-car affected the ranking by 3.21 in the “Car User” cluster. Thus, car users valued car is valued much more highly than the other two clusters. Unlike an e-cargobike, an e-scooter positively affected the ranking in all clusters when included in a mobility package. However, values differed among clusters again. “Car User” evinced the highest effect, with a coefficient of 1.12 on the ranking, whereas “Multimodals” at 0.6 showed the smallest effect but still a clear influence. In the cluster “PT User,” the inclusion of an e-scooter increased the probability of a higher ranking by 78%. Considering the willingness to buy the best-ranked offer among the three clusters, results revealed that about 60% of respondents in each cluster would buy the best-ranked offer. The share of respondents willing to buy the best-ranked offer appears in Table 10.
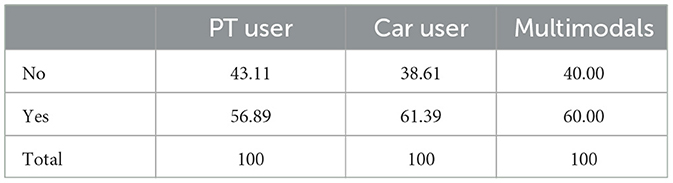
Table 10. Willingness to buy among cluster (in %).
5. Discussion
Results of the study reveal that all characteristics affected the ranking of mobility packages among the specific population group of students. To build on previous research (Caiati et al., 2020; Brezovec and Hampl, 2021; Maas, 2021), micromodal electric-powered transport modes, meaning an e-bike, an e-cargobike, or an e-scooter, respectively, and an e-car were integrated into the analysis of the ranking of mobility packages. However, we are not yet aware of any study that included motorized e-scooters in the analysis of MaaS. This study thus extended past research by integrating motorized e-scooters in the offers. We found that in the baseline model, all vehicles included positively affected the ranking, meaning that respondents' utility increased with vehicle introduction. However, the effect of an e-cargobike on the ranking is only weak and actually disappears, considering preferences among clusters. Furthermore, we included carbon reduction as well as access time as package characteristics, to analyze the influence of both factors regarding respondent preferences in weighing various characteristics in a mobility decision. As expected, an access time of 30 min had a negative impact on the ranking for a mobility package, as it suggested a deterioration of offer flexibility and availability. In terms of carbon reduction, we found that the amount of C02, that could be saved during the travel, influenced the preference for or against a package. Thus, respondents in the specific target group take account of the environmental impact of their decision when choosing among mobility options.
Respondents whose offer included an e-scooter rather than an e-cargobike, reveal slightly stronger effects on the ranking appeared in almost all variables. Especially coefficients of price, access time, and e-car showed larger impacts on the ranking than coefficients among the other group. Larger negative effects in access time on the ranking, in comparison to the positive effect of carbon reduction, can be explained by small significant differences among both groups in the variables reliability and p. norm sustainable mobility. As t-statistics showed, respondents in “E-Scooter” were slightly more sensitive to reliability in the choice of transportation. An access time of 30 min can imply greater uncertainty as mobility is not necessarily available immediately when needed and requires more planning beforehand.
5.1. Theoretical implications
To contribute to the field of research on MaaS preferences, the study aimed to identify relevant mobility alternatives for the specific target group of students in a specific stage of life between education and work. Second, the study responds to calls for more detailed knowledge about which characteristics are valued in MaaS offerings, despite the most frequently preferred mobility option, PT. Unlike previous studies, our analysis included such factors as the environmental impact and the time needed to access the service in the packages, as part of respondents' assessment.
Considering transportation modes, our study confirms previous findings, showing that micromodal electric-powered vehicles can influence approval for mobility packages (Brezovec and Hampl, 2021). However, unlike Guidon et al. (2020) and Brezovec and Hampl (2021), who found only small effects when including e-scooters in an offer, results of this study show strong positive effects of e-scooter on ranking among all clusters, suggesting that the introduction of a motorized e-scooter in a mobility package could increase acceptance and use of MaaS among respondents in this sample. In line with Brezovec and Hampl (2021), however, introduction of an e-car dominates the positive effect of an e-scooter. Results revealed that next to the price, an e-car is the most important determinant of the respondent's ranking of a mobility package. The effect is largest in the cluster “Car User” in both groups, “E-Scooter” and “E-Cargo,” supporting implications from the literature that mobility behavior influences MaaS preferences (Hinkeldein et al., 2015; Ho et al., 2018; Maas, 2021). E-cargobikes are attracting some interest as well, but since the effects are rather small compared to coefficients of e-scooters and e-cars, we cannot expect an e-cargobike to contribute significantly to the usage of bundled mobility offers in this target group, as a supplement to PT access. Negative coefficients in price rose with the price level among both groups, indicating that the higher the price of an offer, the lower the probability of a higher ranking. Hence, a price level of 180 euros had the largest negative effect. These findings also confirm previous findings in MaaS research (Ho et al., 2018; Caiati et al., 2020; Brezovec and Hampl, 2021).
The empirical analysis of the ROL among clusters foster findings from the baseline model, as the same tendency of coefficients occurred among clusters in both groups. However, in the group “E-Cargo,” “Multimodals” are only slightly affected by package characteristics. Only price influenced the ranking negatively. Access time among “PT User” and “Multimodals” (in the group “E-Scooter”) reflect lower negative effects on ranking, confirming that car users are more sensitive to access time, in line with differences in t-statistics among clusters. Hence, drivers were prepared to accept a higher price for maximum flexibility, implying that these respondents rely on a certain “mobility insurance” often associated with car ownership. Furthermore, the largest positive effects of the availability of an e-scooter occurred in the “Car User” cluster. As carbon reduction also has a highly significant influence in this cluster, access to an e-scooter via a monthly mobility package may help foster car users changing mobility patterns and considering smaller and also more environmentally friendly means of transport. Despite results of Ho et al. (2018) and Alonso-González et al. (2020), who found that car ownership determines a negative attitude toward a MaaS offer, the results of this study do not confirm that car owners are less interested in buying MaaS. Accordingly, we found that the willingness to buy an offer among “Car User” in our sample lies at 61%, even higher than the willingness to buy in the cluster “PT User” and “Multimodals.” Nevertheless, as the study aimed to identify preferences of potential users of MaaS outside of PT, the empirical analysis focused on package characteristics and their influence on the respective ranking, so a concrete statement on the relationship between car ownership and the WTP for MaaS offers is not directly measured. Nevertheless, our results indicate that in the context of this study, there is no direct causal relation between a frequent car user and the willingness to take advantage of a MaaS offer. Furthermore, the results of our study are not directly comparable with others, due to the very specific sample of only students.
We calculated the WTP values to monetize the influence that the individual attributes have on the ranking, to derive economic utility. These values indicate how much more or less money it would be worth to the respondents to include a certain attribute in a monthly package or not. The results of the WTP analysis confirm the findings of the baseline model. In monetary value, in both groups, access time is more important in a monthly mobility package for students than carbon reduction. Furthermore, respondents were willing to pay about 54.20 euros for including an e-scooter in a package, and only half that (27.48 Euro) for an e-cargobike. Interestingly, WTP if an offer includes an e-car corresponds to stated recent mobility costs of the “Car User” cluster, further fostering previous research that revealed recent mobility costs influencing WTP for MaaS offers (Liljamo et al., 2020).
5.2. Practical implications
Respondents in the sample, comprising students only, are young and still at the beginning of their mobility life. The underlying sample meets a target group right in the middle of the transition to professional life. A change of attitude at this point can have an effect on the student's whole mobility life (Bamberg and Schmidt, 2003). Understanding their preferences helps to address specific needs of this user group within MaaS offers, and can pave the way for switching from private vehicle usage toward more sustainable mobility-sharing. This point seems particularly relevant because mobility behavior is difficult to change later on, without a specific trigger (Durand et al., 2018). Due to this special sample, the share of PT users is quite large, not surprising since quasi-free access to PT exists. Results among this cluster are particularly interesting. So far, PT users in the sample have predominantly used PT only and other means of transport rather infrequently. These results are in line with Maas (2021), showing that PT users in Dresden rarely used other means of transport and travel unimodally. However, results indicate that students are still interested in other mobility alternatives. Therefore, practitioners could start by targeting this group with a complementary offer of PT, as respondents showed an interest in other modes of transport, but do not yet travel intermodally. Special offers, e.g., a discounted car- and bike-sharing offer, as well as access to a system of shared e-scooter usage, could change transport behavior in the long term. “Multimodals” predominantly use PT and bikes and only seldom drive a car. MaaS that combines both means of transport, especially with regard to chain mobility, could create a completely new mobility alternative that would not have been possible with a purely private bicycle and a PT card. People in the “Car User” cluster are more difficult to address on switching vehicle usage, as e-car dominates almost all other characteristics but price, which again clearly highlights the car as the preferred means of transport among this cluster. Nevertheless, results indicate that respondents are actually very interested in e-scooters as part of a mobility package. Furthermore, people in this cluster tend to have more income, are less price-sensitive and want to act sustainably, valuing the significance of carbon reduction.
Hence, a MaaS offer should try to provide the greatest possible additional benefit by combining sustainable mobility options with accessibility. This can improve meeting mobility needs, particularly for those who already use PT, to achieve a change, and the acquisition of one's own car at the beginning of working life does not seem necessary to be able to make use of flexible mobility. This can provide the path for a change in behavior. In addition, an offer—possibly free of charge for a trial period of several months—could make a switch from the private car to MaaS that proves more profitable. In general, the results indicate that potential MaaS users are willing to pay for carbon reduction. This could offer practitioners the opportunity for business models in line with the European climate-protection goals.
5.3. Limitations and future research
This research also has some limitations worth noting. First, participants of this study were German students who had integrated a mandatory PT ticket with their study fees. Therefore, the group would suit research identifying further mobility options in MaaS without the distorting effect of integrated PT. However, as our sample comprises students only, a conclusive transfer to other contexts and target groups could be difficult. Still, we do not expect systematic differences between student groups. As mentioned, students are at the beginning of their mobility history, and early behavioral changes can have a strong effect on later life behaviors and attitudes (Clark et al., 2014). However, to generalize the results of the study requires further research, considering additional target groups and different social contexts. This may contribute to the understanding of preferences of the broad population for mobility packages, especially concerning the direct influence of such components as access time and carbon reduction that have not yet been sufficiently considered.
Furthermore, our study includes a specific group of people who are mostly moving in urban areas, as the local conditions of the target group's university location are clearly urban in nature. Various studies already show that MaaS solutions are currently predominantly a topic for urban regions (Ambrosino et al., 2016; Esztergár-Kiss and Kerényi, 2020; Brezovec and Hampl, 2021). Thus, conducting further research with a sample that tends to move in more rural areas would be interesting, to determine differences (or similarities) in transport preferences, access time, carbon reduction, and their influence on buying mobility packages. Nonetheless, our results offer interesting implications regarding potential supplements for PT. In Germany, recent discussions about pricing options of PT are in the media. The so-called 9-Euro-Ticket, launched in Germany in June 2022 on a trial basis for three months, has been well received, and a successor system that will provide cheap access to PT throughout Germany is on the brink of its launch. A future approach could analyze similar mobility packages in other population groups, to test whether study implications of vehicles supplementing PT can translate to different contexts.
Finally, previous studies revealed that individuals had a higher WTP for product bundling in a MaaS offer than they would have had for buying the individual mobility option (Caiati et al., 2020; Brezovec and Hampl, 2021). According to the theory of mental accounting, people mentally own different accounts and treat money differently, depending on the origin and purpose of the money, rather than considering it on the bottom line as in formal accounting (Thaler, 1985, 1999). This can lead to subjective biases through which people underestimate their recent mobility costs (Andor et al., 2020). In the case of a private car, costs such as the loan rate, the insurance rate, or repair costs could be paid from different mental accounts. In contrast, PT bundles all costs into one price for the end consumer. This could reduce the WTP for PT, due to distortions. A further investigation could start by testing the mental accounting theory in the context of MaaS. Furthermore, the results of the analysis were not controlled for safety concerns, which might influence the choice of transportation mode and thus also affects preferences and utility deriving from a certain mobility package. Further investigations including safety as a control in the empirical model can shed light on the extent to which safety concerns also influence the use or non-use of alternative mobility concepts like MaaS. In addition, MaaS could provide the basis for a general increase in WTP, on the basis of different mobility options, as well as, for example, sustainability options. Thus, in addition to bundling, a clever formulation of different MaaS offer components could appeal to different mental accounts among users. The results of this study provide first indications that these factors may play a role in analyzing mobility behavior and preferences for alternative mobility offers for shared vehicle usage. Further research is necessary, however, to prove these implications.
Data availability statement
The datasets presented in this article are not readily available because personal data are included. The raw data were collected as part of the research project GenoMobil containing personal data for the protection of which the authors have signed an agreement with the researcher associated to GenoMobil on joint responsibility in the handling of personal data. Requests to access the dataset should be directed to the corresponding author. Requests to access the datasets should be directed to LD, bGVhLmRlY2tlckBydWIuZGU=.
Author contributions
LD and CM designed the proposal, collected the data, and wrote the paper. LD was responsible for the methodological derivation and the empirical analysis, while CM described the theoretical context. MW and NW contributed to design the research proposal and read the paper. MW further supported the theoretical derivation and the empirical analysis. All authors contributed to the article and approved the paper.
Funding
The research of this article was supported by funds from the Federal Ministry of Education and Research (BMBF) within the framework of the Research Project GenoMobil. For further information on the project please refer to: https://www.zukunft-nachhaltige-mobilitaet.de/genomobil-genossenschaften-als-organisationsform-fuer-eine-sozial-oekologische-transformation-integrierter-mobilitaet/.
Conflict of interest
The authors declare that the research was conducted in the absence of any commercial or financial relationships that could be construed as a potential conflict of interest.
Publisher's note
All claims expressed in this article are solely those of the authors and do not necessarily represent those of their affiliated organizations, or those of the publisher, the editors and the reviewers. Any product that may be evaluated in this article, or claim that may be made by its manufacturer, is not guaranteed or endorsed by the publisher.
References
Agbe, O. S., and Shiomi, Y. (2021). A feasibility study for mobility as a service in suburban areas. Transport. Plann. Technol. 44, 695–713. doi: 10.1080/030820211956807
Agora, V. (2019). Klimabilanz von Elektroautos: Einflussfaktoren und Verbesserungspotenzial. Berlin.
Allison, P. D., and Christakis, N. (1994). Logit models for sets of ranked items. Sociol. Methodol. 24, 123–126. doi: 10.2307/270983
Alonso-González, M. J., Hoogendoorn-Lanser, S., van Oort, N., Cats, O., and Hoogendoorn, S. (2020). Drivers and barriers in adopting Mobility as a Service (MaaS)—A latent class cluster analysis of attitudes. Transport. Res. Part A Policy Pract. 132, 378–401. doi: 10.1016/j.tra.11022
Alriksson, S., and Oberg, T. (2008). Conjoint analysis for environmental evaluation—A review of methods and applications. Environ. Sci. Pollut. Res. Int. 15, 244–257. doi: 10.1065/espr02479
Ambrosino, G., Nelson, J. D., Boero, M., and Pettinelli, I. (2016). Enabling intermodal urban transport through complementary services: from Flexible Mobility Services to the Shared Use Mobility Agency. Res. Transport Econ. 59, 179–184. doi: 10.1016/j.retrec.0015
Andor, M. A., Gerster, A., Gillingham, K. T., and Horvath, M. (2020). Running a car costs much more than people think—Stalling the uptake of green travel. Nature 580, 453–455. doi: 10.1038/d41586-020-01118-w
Backhaus, K., Erichson, B., Plinke, W., and Weiber, R. (2018). Multivariate Analysemethoden. Berlin; Heidelberg: Springer. doi: 10.1007./978-3-658-32425-4
Bamberg, S., and Schmidt, P. (2003). Incentives, morality, or habit? Predicting students' car use for university routes with the models of Ajzen, Schwartz, and Triandis. Environ. Beha. 35, 264–285. doi: 10.1177/0013916502250134
Banister, D. (2011). Cities, mobility and climate change. Jo. Transport Geograp. 19, 1538–1546. doi: 10.1016/j.jtrangeo.03009
Becker, H., Ciari, F., and Axhausen, K. W. (2017). Comparing car-sharing schemes in Switzerland: user groups and usage patterns. Transport. Res. Part A Policy Pract. 97, 17–29. doi: 10.1016/j.tra.01004
Beggs, S., Cardell, S., and Hausman, J. A. (1981). Assessing the potential demand for electric cars. J. Econ. 17, 1–19. doi: 10.1016/0304-4076(81)90056-7
Ben-Akiva, M., McFadden, D., and Train, K. (2019). Foundations of stated preference elicitation: consumer behavior and choice-based conjoint analysis. Found. Trends® Econo. 10, 1–144. doi: 10.1561/0800000036
Bongaerts, R., Kwiatkowski, M., and König, T. (2017). “Disruption technology in mobility: customer acceptance and examples,” in Phantom Ex Machina, eds A.Khare, B.Stewart and R.Schatz. (Springer) (pp. 119–135). doi: 10.1007./978-3-319-44468-0_8
Brezovec, P., and Hampl, N. (2021). Electric vehicles ready for breakthrough in MaaS? Consumer adoption of e-car sharing and e-scooter sharing as a part of mobility-as-a-service (MaaS). Energies 14, 1088. doi: 10.3390/en14041088
Caiati, V., Rasouli, S., and Timmermans, H. (2020). Bundling, pricing schemes and extra features preferences for mobility as a service: Sequential portfolio choice experiment. Transport. Res. Part A Policy Pract. 131, 123–148. doi: 10.1016/j.tra.09029
Clark, B., Chatterjee, K., Melia, S., Knies, G., and Laurie, H. (2014). Life events and travel behavior: exploring the interrelationship using UK household longitudinal study data. Transport. Res. Rec. 2413, 54–64. doi: 10.3141/2413-06
Durand, A., Harms, L., Hoogendoorn-Lanser, S., and Zijlstra, T. (2018). Mobility-as-a-Service and changes in travel preferences and travel behaviour: a literature review. Researchgate 3, 3760. doi: 10.13140./RG.2.2.32813.33760
Eszergár-Kiss, D., and Caesar, B. (2017). Definition of user groups applying Ward's method. Transport. Res. Procedia 22, 25–34. doi: 10.1016/j.trpro.03004
Esztergár-Kiss, D., and Kerényi, T. (2020). Creation of mobility packages based on the MaaS concept. Travel Behav. Soc. 21, 307–317. doi: 10.1016/j.tbs.05007
Federal Statistical Office Germany (2022a). Road transport: EU-wide CO2 carbon dioxide emissions. Destatis. Available online at: https://www.destatis.de/Europa/DE/Thema/Umwelt-Energie/CO2_Strassenverkehr.html(accessed December 13, 2022).
Federal Statistical Office Germany (2022b). Studierende nach Bundesländern [Data set]. Destatis. Available online at: https://www.destatis.de/DE/Themen/Gesellschaft-Umwelt/Bildung-Forschung-Kultur/Hochschulen/Tabellen/studierende-insgesamt-bundeslaender.html (accessed December 13, 2022).
Federal Statistical Office Germany (2022c). Studierende insgesamt und Studierende Deutsche nach Geschlecht. Destatis. Available online at: https://www.destatis.de/DE/Themen/Gesellschaft-Umwelt/Bildung-Forschung-Kultur/Hochschulen/Tabellen/lrbil01.html#242472 (accessed December 13, 2022).
Federal Statistical Office Germany (2022d). Kosten von Mobilität: Haushalte geben im Schnitt 233 Euro monatlich fürs Auto aus, 33 Euro für Bus, Bahn und Co. Destatis. Available online at: https://www.destatis.de/DE/Presse/Pressemitteilungen/2021/07/PD21_N045_639.html (accessed December 13, 2022).
Fok, D., Paap, R., and van Dijk, B. (2012). A rank-ordered logit model with unobserved heterogeneity in ranking capabilities. J. Appl. Econ. 27, 831–846. doi: 10.1002/jae.1223
Guidon, S., Wicki, M., Bernauer, T., and Axhausen, K. (2020). Transportation service bundling—For whose benefit? Consumer valuation of pure bundling in the passenger transportation market. Transport. Res. Part A Policy Pract. 131, 91–106. doi: 10.1016/j.tra.09023
Heikkilä, S. (2014). Mobility as a service—A proposal for action for the public administration, Case Helsinki [Master's thesis, Aalto University]. Aalto University Learning Center. Available online at: https://aaltodoc.aalto.fi/handle/123456789/13133 (accessed June 27, 2023).
Hensher, D. A. (2017). Future bus transport contracts under a mobility as a service (MaaS) regime in the digital age: are they likely to change? Transport. Res. Part A Policy Pract. 98, 86–96. doi: 10.1016/j.tra.02006
Hinkeldein, D., Schoenduwe, R., Graff, A., and Hoffmann, C. (2015). Who would use integrated sustainable mobility services—And why? Transport Sustain. 7, 177–203. doi: 10.1108/S2044-994120150000007019
Ho, C. Q., Hensher, D. A., Mulley, C., and Wong, Y. Z. (2018). Potential uptake willingness-to-pay for mobility as a service (MaaS): a stated choice study. Transport. Res. Part A Policy Pract. 117, 302–318. doi: 10.1016/j.tra.08025
Jittrapirom, P., Caiati, V., Feneri, A., Ebrahimigharehbaghi, S., González, M., Narayan, J., et al. (2017). Mobility as a service: a critical review of definitions, assessments of schemes, and key challenges. UP 2, 13–25. doi: 10.17645/up.v2i2.931
Kamargianni, M., Li, W., Matyas, M., and Schäfer, A. (2016). A critical review of new mobility services for urban transport. Transport. Res. Proced. 14, 3294–3303. doi: 10.1016/j.trpro.05277
Kamargianni, M., and Matyas, M., (Eds.) (2017). The business ecosystem of Mobility-as-a-Service. 96th Transportation Research Board. Available online at: https://discovery.ucl.ac.uk/id/eprint/10037890/ (accessed July 1, 2023.)
Liljamo, T., Liimatainen, H., Pöllänen, M., and Utriainen, R. (2020). People's current mobility costs and willingness to pay for Mobility as a Service offerings. Transport. Res. Part A Policy Pract. 136, 99–119. doi: 10.1016/j.tra.03034
Maas, B. (2021). Conjoint analysis of mobility plans in the city of Dresden. Eur. Transport. Res. Rev. 13(1). doi: 10.1186./s12544-021-00478-2
Marx, C.-P., and Weiss, M. (2023). “Die genossenschaftliche Organisationsform – Chancen und Erfolgsfaktoren für die Implementierung innovativer Dienstleistungen,” in Gestaltung des Wandels im Dienstleistungsmanagement: Band 2, eds M. Bruhn and K. Hadwich (Springer Fachmedien Wiesbaden). doi: 10.1007/978-3-658-41815-1_18
Matyas, M., and Kamargianni, M. (2019a). The potential of Mobility as a Service bundles as a mobility management tool. Transportation 46, 1951–1968. doi: 10.1007/s11116-018-9913-4
Matyas, M., and Kamargianni, M. (2019b). Survey design for exploring demand for Mobility as a Service plans. Transportation 46, 1525–1558. doi: 10.1007/s11116-018-9938-8
McFadden, D. (1973). Conditional logit analysis of qualitative choice behavior (P. Zarembka, Ed.). Berkely, CA: Frontiers in econometrics, Academic Press.
Middendorff, E., Apolinarski, B., Becker, K., Bornkessel, P., Brandt, T., Heißenberg, S., et al. (2017). Die wirtschaftliche und soziale Lage der Studierenden in Deutschland 2016. Zusammenfassung zur 21. Sozialerhebung des Deutschen Studentenwerks – durchgeführt vom Deutschen Zentrum für Hochschul- und Wissenschaftsforschung. Berlin: Bundesministerium für Bildung und Forschung.
Mulley, C., Nelson, J. D., and Wright, S. (2018). Community transport meets mobility as a service: On the road to a new a flexible future. Research in Transportation Economics, 69, 583–591. doi: 10.1016/j.retrec.02004
Nguyen, H. V., Nguyen, C. H., and Hoang, T. T. B. (2019). Green consumption: closing the intention-behavior gap. Sustain. Develop. 27, 118–129. doi: 10.1002/sd.1875
Polydoropoulou, A., Pagoni, I., and Tsirimpa, A. (2020a). Ready for Mobility as a Service? Insights from stakeholders and end-users. Travel Behav. Soc. 21, 295–306. doi: 10.1016/j.tbs.11003
Polydoropoulou, A., Tsouros, I., Pagoni, I., and Tsirimpa, A. (2020b). exploring individual preferences and willingness to pay for mobility as a service. Transport. Res. Part C: Emerg. Technol. 2674, 152–164. doi: 10.1177/03611981209380
Prillwitz, J., and Barr, S. (2011). Moving toward sustainability? Mobility styles, attitudes and individual travel behaviour. J. Transport Geography 19, 1590–1600. doi: 10.1016/j.jtrangeo.06011
Ranasingha, R. G. S. M., Edirisinghe, J. C., and Ratnayake, R. H. M. K. (2019). Willingness to pay for fruit attributes: a conjoint analysis. Journal of Agricultural Sciences—Sri Lanka 14, 102–110. doi: 10.4038/jas.v14i2.8512
Schikofsky, J., Dannewald, T., and Kowald, M. (2020). Exploring motivational mechanisms behind the intention to adopt mobility as a service (MaaS): insights from Germany. Transport. Res. Part C: Emerg. Technol. 131, 296–312. doi: 10.1016/j.tra.09022
Thaler, R. (1985). Mental accounting and consumer choice. Mark. Sci. 4, 199–214. doi: 10.1287/mksc.4.3.199
Thaler, R. H. (1999). Mental accounting matters. Journal of Behavioral Decision Making, 12, 183–206. doi: 10.1002/(SICI)1099-0771(199909)12:3<183::AID-BDM318>3.0.CO;2-F
United Nations Report (2022). WMO | Provisional state of the global climate 2022 [Data set]. Available online at: https://storymaps.arcgis.com/stories/5417cd9148c248c0985a5b6d028b0277 (accessed December 13, 2022).
Vij, A., Ryan, S., Sampson, S., and Harris, S. (2020). Consumer preferences for Mobility-as-a-Service (MaaS) in Australia. Transport. Res. Part C: Emerg. Technol. 117, 102699. doi: 10.1016/j.trc.2020.102699
Keywords: mobility-as-a-service, rank-ordered conjoint analysis, electric-powered vehicles, mobility behavior, students, Germany
Citation: Decker L, Marx CP, Weiβ M and Werbeck N (2023) Preferences for the shared use of electric-powered vehicles in mobility packages: an empirical analysis of MaaS in a university context. Front. Environ. Econ. 2:1220333. doi: 10.3389/frevc.2023.1220333
Received: 10 May 2023; Accepted: 31 July 2023;
Published: 28 August 2023.
Edited by:
Paola D'Orazio, Chemnitz University of Technology, GermanyReviewed by:
Edmund Zolnik, George Mason University Arlington Campus, United StatesNora Yusma, Universiti Tenaga Nasional, Malaysia
Senthil Kumar, Asia Pacific University of Technology and Innovation, Malaysia
Copyright © 2023 Decker, Marx, Weiβ and Werbeck. This is an open-access article distributed under the terms of the Creative Commons Attribution License (CC BY). The use, distribution or reproduction in other forums is permitted, provided the original author(s) and the copyright owner(s) are credited and that the original publication in this journal is cited, in accordance with accepted academic practice. No use, distribution or reproduction is permitted which does not comply with these terms.
*Correspondence: Lea Decker, bGVhLmRlY2tlckBydWhyLXVuaS1ib2NodW0uZGU=
†Present address: Matthias Weiβ, Department of Business and Economics, Zeppelin University, Friedrichshafen, Germany