 Aikaterini Katirtzoglou1,2*†
 Dimitris Tsaparis1*†
 Evangelos Kolios1,2
 Antonios Magoulas1
 Constantinos C. Mylonas1
 Ioannis Fakriadis1
 Tereza Manousaki1
 Costas S. Tsigenopoulos1*
- 1Institute of Marine Biology, Biotechnology, and Aquaculture (IMBBC), Hellenic Centre for Marine Research (HCMR), Heraklion, Greece
- 2Department of Biology, University of Crete, Heraklion, Greece
The greater amberjack (Seriola dumerili) has attracted considerable economic interest since the 1990s because it possesses traits that distinguish it as a promising candidate in aquaculture. However, the challenges of its successful rearing, combined with the need to develop proper management practices, underline the importance of research into the genetic diversity of both wild and farmed stocks. We aimed to decipher the genetic structure of S. dumerili in the Eastern Mediterranean and the Northeast Atlantic using three types of genetic markers (mitochondrial control region sequences, microsatellites, and single nucleotide polymorphisms, or SNPs) to evaluate the population genetic structure of the species. The results were compared to those of previous studies of the species focusing on the Central Mediterranean and confirmed the presence of two divergent mtDNA haplogroups distributed without any detectable geographical structuring within the Mediterranean and the Atlantic. However, population analyses of the genetic structure of the species using either 10 microsatellites or a set of 1,051 SNP markers suggest that the species forms three genetically distinct groups, one in the Mediterranean and two in the Atlantic. The latter has so far not been reported in the Northeast Atlantic, and that this differentiation refers to samples from the Canary Islands is surprising. Fifteen candidate outlier SNP loci were identified in the data set, one located within the tead1a/TEF-1A gene, which has been associated with temperature acclimation of the medaka. This work enriches our knowledge of the genetic diversity of wild populations of the greater amberjack in the Mediterranean and the Northeast Atlantic and attempts to investigate signs of local adaptation toward a better understanding of the species distribution patterns. Future studies should be conducted to investigate the genomic regions associated with temperature acclimation in marine organisms that have to adapt to the ongoing climate change pressures, such as sea temperature rise, in order to survive.
Introduction
The greater amberjack (Seriola dumerili; Risso, 1810) is an oceanodromous fish of the Carangidae family and has a circumglobal distribution in subtropical and temperate waters (1). It is common in the Mediterranean Sea (2) in which S. rivoliana, another economically important carangid, widely distributed in the Eastern and Western Pacific, and the lesser amberjack, S. fasciata, have also been recently reported [see in Šegvić-Bubić et al. (3)].
The greater amberjack has attracted strong interest in Europe and Japan since the 1990s because it possesses many qualities that classify it as an aquaculture candidate, such as a rapid growth rate, excellent flesh quality, large size, and high worldwide demand (4). Nevertheless, the challenging reproduction of the species in captivity (even if the fish were taken from the sea at a very early stage in their development) has prevented its rapid and extensive commercial production. The need to diversify the aquaculture worldwide led to a rekindled interest in the greater amberjack, especially in developing methods to control egg production in captivity and studying the reproductive biology of the species, which still poses problems for its commercial production (5–7). Reproduction has been successfully induced hormonally in wild-caught greater amberjack reared in captivity (8), demonstrating the potential of the species in aquaculture [see references in Corriero et al. (9)]. However, it has been noted that the reproduction of greater amberjack from the Mediterranean Sea in captivity is more difficult than in individuals from the Atlantic Ocean (9). The differences may be related to the significant differences in environmental conditions between the two regions (i.e., annual temperature and photoperiod profiles); however, the existence of population genetic differences between the two stocks may also contribute to this reproduction discrepancy (3). Additionally, bottlenecks in further expanding Seriola spp. farming appear to be disease control, a lack of genetic selection programs, and incomplete knowledge of nutrient requirements for these species (10). These difficulties for the successful rearing of a new organism in aquaculture highlight the importance of exploring the genetic background of new marine candidates. Genetic diversity is the raw material for natural selection that allows species to adapt to new environmental conditions; thus, its loss will decrease species adaptive potentials (11). In addition, genetic studies constitute the baseline for breeding programs to trace the origin of breeders and can be utilized to assess the potential genetic risk of intra-specific breeding among wild and farmed fish (12–14).
Concerning the greater amberjack, numerous gaps concerning the population structure and the ecology of the species remain. Based on mark-recapture studies and analysis of mitochondrial DNA, two genetic stocks have been recognized in the Northwest Atlantic, one in the northern Gulf of Mexico, and one in the U.S. southeast Atlantic coast (15). Although genetic data based on microsatellite loci provided evidence of limited population structure, the differentiation among samples from the Gulf of Mexico was statistically significant and in favor of non-panmixia among fish collected from the Gulf of Mexico and the Florida Keys (16). There is also evidence for two groups of populations of greater amberjack in Asia, one in the East China Sea and one in the South China Sea (17–19). The genetic structure of Eastern Atlantic and Mediterranean populations indicates the existence of a strong breakpoint between the two basins (3); moreover, there is low divergence between the populations sampled in the Central and Western Mediterranean. The lack of population subdivision of the greater amberjack in the Western and Central Mediterranean was confirmed again in a later study that combined microsatellite markers and geometric morphometrics in wild and farmed fish (20), showing that wild-origin individuals formed one cluster in the Mediterranean basin.
As mass aquaculture production of the greater amberjack is still in its infancy, genomic research on the species has been limited. Two attempts of whole genome sequencing (WGS) exist at present for the species, both at the scaffold level (17, 21). Generally, the cost of WGS techniques is continuously dropping; however, obtaining complete genomic sequence data is not always necessary for addressing specific research questions (22, 23). The development of reduced-representation sequencing (RRS) methods, such as restriction-site associated DNA sequencing (RAD sequencing or RAD-Seq), combines the use of genome complexity reduction with restriction enzymes (REs), and the high sequencing output of modern sequencing platforms. The applications of RAD sequencing in aquaculture (24) are numerous and have expanded in many directions, such as the construction of genetic maps (25), comparative genomics in non-model organisms (26), genome assemblies for valuable aquaculture species (27), and mapping QTL associated with traits of economic importance in various species (28). RAD-seq techniques have been extensively applied to generate population-level SNP genotype data and infer population structure and evolutionary patterns in many marine organisms, such as the blind cavefish (29), the three-spine stickleback, Gasterosteus aculeatus (30); the Atlantic mackerel, Scomber scombrus (31); the Nassau grouper, Epinephelus striatus (32); the redlip croaker, Larimichthys polyactis (33); the red drum, Sciaenops ocellatus (34); the American lobster, Homarus americanus (35); and the Chilean blue mussels, Mytilus chilensis (36), among many others.
The fine-scale genetic structure and stock delineation of fish species have been greatly moved forward thanks to recent advances in genomics assisted by technological and methodological breakthroughs like high-throughput sequencing and genotyping by sequencing. The objective of the current study was to infer the population genetic structure of the greater amberjack in the Mediterranean and Northeast Atlantic based on SNP markers generated from double digest Restriction Associated DNA (ddRAD) sequencing data as well as from mitochondrial DNA sequences and microsatellites. From the former data set, neutral and outlier SNP loci were identified and used to explore the potential signatures of local adaptation between the two basins. Current results are expected to set the ground for the development of future management strategies and genetic improvement programs in wild greater amberjack stocks. Finally, we investigated markers involved in evolutionary mechanisms that can lead to an in-depth inspection of the genetic diversity of a species. They can potentially provide fine-scale patterns of the population structure not detected with neutral markers and a better insight into the species' future geographical distribution as a consequence of the ongoing fluctuation of environmental variables due to constant climate changes.
Materials and methods
Sampling and DNA extraction
The genetic structure of greater amberjack in the Mediterranean and Eastern Atlantic was investigated using 254 samples from different aquaculture companies. The information provided by the companies indicated clearly that the individuals were wild and were captured in nine different locations across the Mediterranean Sea and the Northeast Atlantic Ocean. The data set consisted of three populations originating from the Canary Islands (1–3) and six populations from the Central and Eastern parts of the Mediterranean (4–9), as shown in Figure 1.
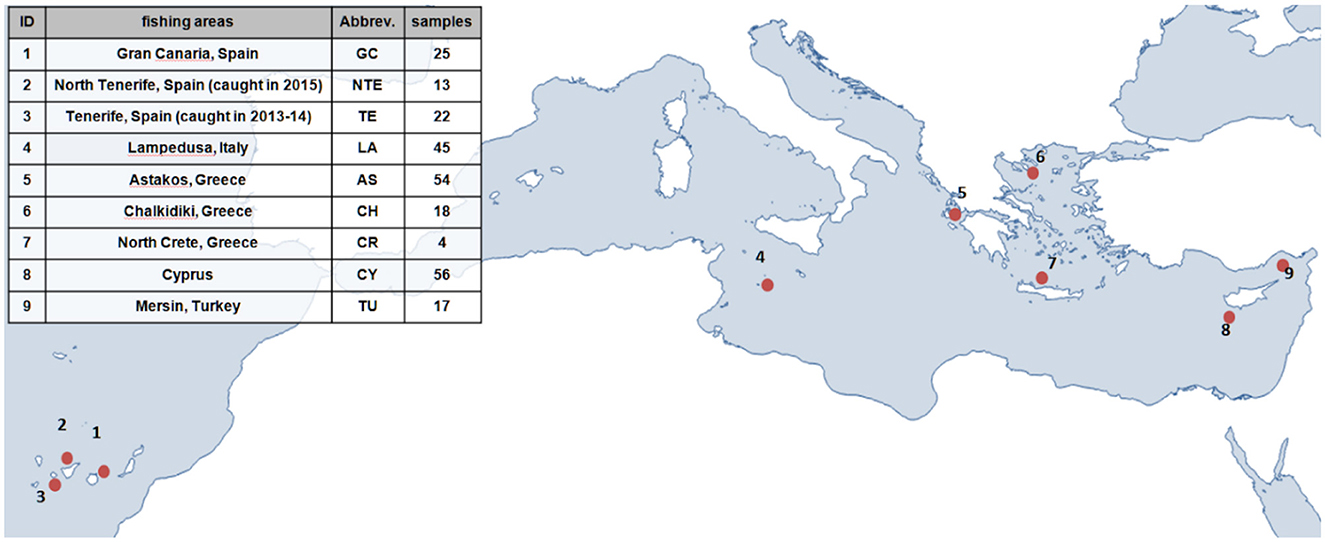
Figure 1. Greater amberjack sampling details: population ID (1–9), fishing area, and number of captured individuals.
DNA extraction from the fin-clip tissues preserved in absolute ethanol was performed following a simple salting out procedure (37), and DNA quantification was done by measuring its concentration with a Nanodrop 1000 spectrophotometer (Thermo Fisher Scientific).
Mitochondrial DNA gene sequencing
A part of greater amberjack's mitochondrial DNA (mtDNA) control region [418 base pairs (bp)] was amplified through PCR using the primer pair SerCR_H (CGATTTCTGTCCCTGACCAT) and SerCR_L (CCTACCCCTAGCTCCCAAAG) (3). The final PCR volume was 12 μL, and all reactions were carried out in an automatic cycler (T100™ Biorad Thermal Cycler), with an initial denaturation step at 95°C for 1 min, 35 cycles of 50 s at 95 °C, 50 s at 48°C, and 60 s at 72°C and a final extension for 10 min at 72°C. PCR products were purified using an ethanol/sodium acetate precipitation protocol, quantified using the Nanodrop spectrophotometer, and a sequencing reaction followed using the BigDye terminator v3.1 kit (Applied Biosystems). Finally, PCR products were run on an ABI 3730 sequencer (Applied Biosystems).
Microsatellite amplification
For the amplification of microsatellite markers, 11 dinucleotide loci were used [(38); see Supplementary Table 1] in a PCR multiplex reaction using the QIAGEN® Multiplex PCR Plus Kit (39). PCR amplifications were performed in 9 μL reactions consisting of 1 μL DNA (20–40ng), 4.5 μL Qiagen PCR Master Mix, 0.5 μL Q solution, and 3 μL of the primer mix that contained 0.45 μM of all primers. Forward primers were labeled with fluorescent dyes (as shown in Supplementary Table 1). PCR products were then analyzed on an ABI 3730 automated sequencer (Applied Biosystems), with the Genescan 500-LIZ size standard (Applied Biosystems). Alleles sizing and scoring were performed with the software STRand 2.4.110 (http://www.vgl.ucdavis.edu/STRand) (40).
Double digestion RAD library preparation and sequencing
Total DNA from the 254 greater amberjack samples was extracted following a modified salt-based extraction protocol described by Manousaki et al. (26). For the ddRAD library preparation (41), DNA samples were separately digested by two REs: Sbf I (CCTGCA|GG recognition site), and SphI (GCATG|C recognition site). Barcoded adapters were designed to meet specific criteria. The first was that restriction sites should not be reconstructed by adapter-genomic DNA ligations. Second, the adapter mix consisted of P1 (Sbf I compatible) and P2 (SphI compatible) adapters that include a five- to seven-base inline barcode each. The number of different short sequences used as barcodes for sample identification was such that the unique combination of two is individual-specific. Third, P1 and P2 were added with a ratio of 1:12, as this was expected to more accurately reflect the abundance of Sbf I and SphI cutting sites. The ligated samples were then denatured and mixed into a single DNA pool. Size selection of the DNA fragments was performed by agarose gel separation, with a range of 300–600 bp, followed by PCR amplification of the DNA template. The last step of the ddRAD library preparation included some further cleanup and size selection using magnetic beads. Finally, paired-end sequencing with a read length of 150 bases was performed in the Novaseq Illumina platform.
Bioinformatic data analysis
mtDNA analysis
Processing and assessing the quality of the chromatograms, as well as the sequence alignment, were performed with the MEGA v.6 software (42). In addition, 88 control region sequences from S. dumerili and 14 from S. rivoliana already published (3) were included in the analysis to integrate previous knowledge on the diversity of this locus. The identification of unique haplotypes for the S. dumerili and the S. rivoliana sequences was done with the DAMBE5 software (43). Then, to infer geographically meaningful groupings, a median-joining haplotype network was constructed with the NETWORK V5.0.0.1 software (44) following the default settings, that is, with an equal-distance ratio for all mutations, a 1:1 transition/transition ratio, and a parameter of ε = 0 to result in the minimum spanning network. Population differentiation among the nine populations was inferred with the estimation of pairwise Φst values based on the number of pairwise differences between sequences with the Arlequin v.3.5.2. software (45). The same software was used for the analysis of molecular variance (AMOVA) for mtDNA to examine the distribution of genetic variation among various hypothetical groups of populations. Different scenarios of population clustering were tested based on geographical criteria (e.g., Atlantic–Mediterranean) and differentiation between populations (e.g., high pairwise Φst values).
Microsatellite analysis
The results were checked for the presence of null alleles, stuttering, and allele dropout using the Microchecker v.2.2 program (46). Testing was done for each microsatellite marker within each defined population.
The basic statistics for investigating genetic diversity and genetic structure (the frequency of each allele at each locus, the average number of alleles per population, the heterozygosity indices, the number of private alleles, and the genotypic linkage disequilibrium at the significance level of p = 0.05) were calculated using GenAlEx v.6.5 (47) and Fstat v.9.3.2 (48) software. The inbreeding coefficient FIS was calculated for each locus separately and for all loci in each population to verify statistically significant deviation from heterozygosity due to non-random interbreeding of individuals within each subpopulation. Significance testing was performed with permutations and significance levels at p < 0.05. Pairwise FST as a measure of gene flow and genetic differentiation between populations was calculated using Arlequin v.3.5.2 software (45).
To check for the presence of patterns of a wider geographical structure in the populations of S. dumerili relative to the wild populations investigated in this study, several scenarios of clustering (as in mtDNA analysis) were tested using the AMOVA approach in the Arlequin v.3.5.2 software (45). Then, to expand individual groupings of the Mediterranean and Atlantic amberjack populations, which are likely to be independent of the geographical origin of the samples, a data analysis was carried out using the Structure v.2.3.4 software (49–52). To study the existence of a genetic structure independent of the geographic origin of the samples, the analysis was done using a combination of the admixture model and the correlated allele frequencies model. The use of the first model includes the assumption that an individual comes from a mixture of two or more groups and does not belong exclusively to only one group. The probability was calculated for each number of K groups (from K = 1 to K = 8), and each K analysis was performed for 2 million iterations [Markov chain Monte Carlo (MCMC) iterations], with the first 500,000 ignored as a burn-in period and the previously described procedure repeated 20 times to see if the results were consistent. The most likely number of groups was selected with the statistical procedure of the ΔK index according to Evanno et al. (53) with the STRUCTURE HARVESTER v0.6.94 software (54). Each individual was assigned to one of the groups proposed each time, after the value of the participation coefficient q was calculated and the percentage of its genotype corresponding to this specific group was greater than the objective percentage of 75%.
ddRAD-seq data analysis
Quality check and demultiplexing for ddRAD-seq data
Raw paired-end reads were analyzed in Stacks v2.59 (55) after a quality control check in fastQC 0.11.9 (56). Stacks assembles large numbers of short-read sequences from a set of individuals and then identifies genotypes loci within them in search of SNPs. First, the Stacks component process_radtags was used to recover, clean, and demultiplex the raw data into the individual samples. The parameters set were - c, - q, - r. The - c parameter is used to clean the data and remove reads with uncalled base, - q for discarding reads with low-quality scores (Phred score < 10), and - r corrects sequence errors in the RAD cut site and barcodes that would otherwise make them undetectable for the analysis.
Data alignment against greater amberjack reference genome
To align our samples against the available reference genome for the species (RefSeq assembly accession: GCF_002260705.1) (17), the Burrows–Wheeler Alignment (BWA) software package was employed (57). We used the BWA MEM algorithm to align the preprocessed paired-end reads with the default settings plus the –M parameter, which flags additional hits of a read on the reference genome as secondary. Finally, to assess the mapping rate of the reads, we used –samtools flagstat from SAMtools 1.9 (58), which generates a report on alignment statistics for each individual.
Genotyping RAD loci
The alignment output files were passed again to Stacks. In this step, the software component gstacks examines an RAD data set one locus at a time, looking at all individuals for that locus, and then proceeds to identify SNPs within it. All the genotyped loci across the total of individuals are stored in the catalog file. Then, the use of populations, the last step of the Stacks pipeline, led to specifying the number of polymorphic loci (SNPs), with the following settings: -R = −0.75, which indicates that a locus needs to be genotyped in at least 75% of individuals across all populations, and –min-maf = 0.05 and –max-obs-het = 0.7, which are the minimum minor allele frequency and the maximum heterozygosity required to process a nucleotide site at a locus, respectively. In addition, the –write-random-snp option restricts the output to one random SNP per locus. A final filtering step was implemented by excluding individuals with >20% of missing data (non-genotyped loci) using a custom script.
As the number of RAD loci identified was relatively low compared to some other ddRAD studies in teleosts (59, 60), where the libraries were constructed with the same restriction enzymes and reads were analyzed in Stacks (55), we wanted to confirm if the expected number of sites is similar to the observed one. SimRAD R package (61) simulates the construction of a restriction-site associated DNA sequencing (RAD) library, by performing in silico restriction enzyme digests and fragment size selection on a given DNA sequence. In order to run the SimRAD program, the reference genome of greater amberjack (17) was provided along with recognition sites of the enzymes Sbf I and SphI. The digestion method was determined (double digest), and finally, the type of DNA fragments (AB) along with the size selection window (300–600 bp).
Measures of genetic differentiation
Pairwise FST values were calculated using the population comparison test in Arlequin v 3.5 (45), with 10,000 permutations at the 0.05 significance level. The inbreeding coefficient FIS for each of the nine populations was estimated using the R package genepop v. 4.7.5 (62) with Hardy–Weinberg exact tests (Probability test, Fisher's method) to investigate whether each population is in equilibrium. The significance of the FIS estimate of each population was determined based on the p-values of population-specific Hardy-Weinberg equilibrium (HWE) tests.
Cluster analysis
A locus-by-locus AMOVA was implemented on SNP data using Arlequin (45), with the number of permutations set to 99,999 and the level of missing data/SNP to 1. Four different clustering scenarios were tested, based mainly on geographical criteria. In the first scenario, populations were divided into two groups, Northeast Atlantic [Gran Canaria (GC), North Tenerife (NTE), and Tenerife (TE)] and Mediterranean [Lampedusa (LA), Astakos (AS), Chalkidiki (CH), North Crete (CR), Cyprus (CY), and Mersin Turkey (TU)]; the second into three groups (GC, NTE and TE, and Mediterranean, which included LA, AS, CH, CR, CY, TU); the third case into four (GC; NTE and TE; LA, AS, CH, and CR; and CY and TU); and in the fourth scenario, the possible groups tested were GC, NTE and TE, LA and AS and CH, CR, CY, and TU.
Then, we ran STRUCTURE (49) again to infer the population's structure. This time we used Structure_threader (63) to implement the analysis with the following settings: -K = 10, -R = 10, and a burning length of 100,000 for 500,000 MCMC iterations. The admixture model was used again and the best K was chosen according to Evanno et al.'s (53) method. STRUCTURE HARVESTER v0.6.94 (54) and CLUMPAK (64) were used to summarize the STRUCTURE results and graphical representation of Q-plots. ADMIXTURE (65) was also implemented to estimate ancestry of a given set of unrelated individuals from autosomal SNP genotype data sets and determine the best value of K using a cross-validation (CV) procedure.
The last method used to infer the genetic structure of our data was discriminant analysis of principal components [DAPC; (66)]. In DAPC, the variance in the sample is partitioned into between-group and within-group components in an effort to maximize discrimination between groups (67). It was implemented using adegenet 2.0.0 (68) and ade4 (69).
Search for outlier loci
To detect potential outlier loci in a reliable way, two methods were used. The first one is an FST-based method proposed by Excoffier et al. (70) and was applied via the Arlequin software (45) at 100,000 simulations for 100 simulated demes in 10 groups, with an allowed level of missing data/SNP set of 1. The genetic structure was defined a priori for K = 3, and loci with a p ≤ 0.001 were considered outliers. We also employed Pcadapt (71), a principal component analysis (PCA) based approach to identify candidate outliers. The outliers were selected with an adjusted p-value = 0.01 using the Benjamini–Hochberg correction. Finally, we selected the overlapping loci from the two approaches and annotated them on the reference genome (FTP directory of the NCBI GCF_002260705.1_Sdu_1.0 genome assembly). We then explored the biological identity of genes adjacent to the outliers that are potentially under selection using the function closestBed under the BEDTools (72) software.
Results
mtDNA analysis
A 395-bp-long fragment of the control region was successfully sequenced in 250 S. dumerili specimens collected in this study. Newly derived sequences were aligned with 88 S. dumerili and 13 S. rivoliana sequences from the study of Šegvić-Bubić et al. (3). In total, 52 unique haplotypes (H01-H52) of S. dumerili and 6 haplotypes (H53-H58) of S. rivoliana were identified from 351 sequences after analysis with the DAMBE 5 software (Supplementary Table 2).
Of the 52 haplotypes, 19 (36.5%) occurred in more than one region while 33 (63.5%) were private ones since they were found in only one (Supplementary Table 2). In TE, the dominant haplotype was H18, as in NTE and GC. In contrast, in the Tenerife samples (TEB) from Šegvić-Bubić et al. (3), the dominant haplotype was H45. The dominant haplotype in the Mediterranean Sea was H51 in the regions of Tunisia (TUN), Southern Sicily (SSI), Northern Sicily (NSI), Eastern Sicily (ESI), LA, AS, CH, TU, and CY. A lack of observations of this haplotype in the CR population is probably due to only four specimens from this region having been sequenced. Despite many private haplotypes being present, common haplotypes were observed between the Atlantic and the Mediterranean (H09, H32, H42, H51, H52) samples and in a large percentage of the total samples (60.36%).
The haplotype network construction with the NETWORK V5.0.0.1 software led to the revelation of two distinct haplogroups in S. dumerili and a haplogroup for S. rivoliana, as shown in Figure 2. Haplogroup A comprises 286 of the 338 S. dumerili samples, that is, ~84.6%, while haplogroup B comprises 52 samples (15.4% of the samples). The origin of haplotypes that make up each haplogroup is presented in detail in Supplementary Table 2. To investigate meaningful phylogeographical patterns we assigned the samples of S. dumerili to broader geographical regions as follows: GC, Tenerife (NTE + TE + TEB), West Mediterranean (TUN + SSI + NSI), Central Mediterranean/Ionian Sea (ESI + LA + AS), Eastern Mediterranean/Aegean Sea (CR + CH), and Eastern Mediterranean/Levantine Sea (TU + CY). Both haplogroups are present in all these regions.
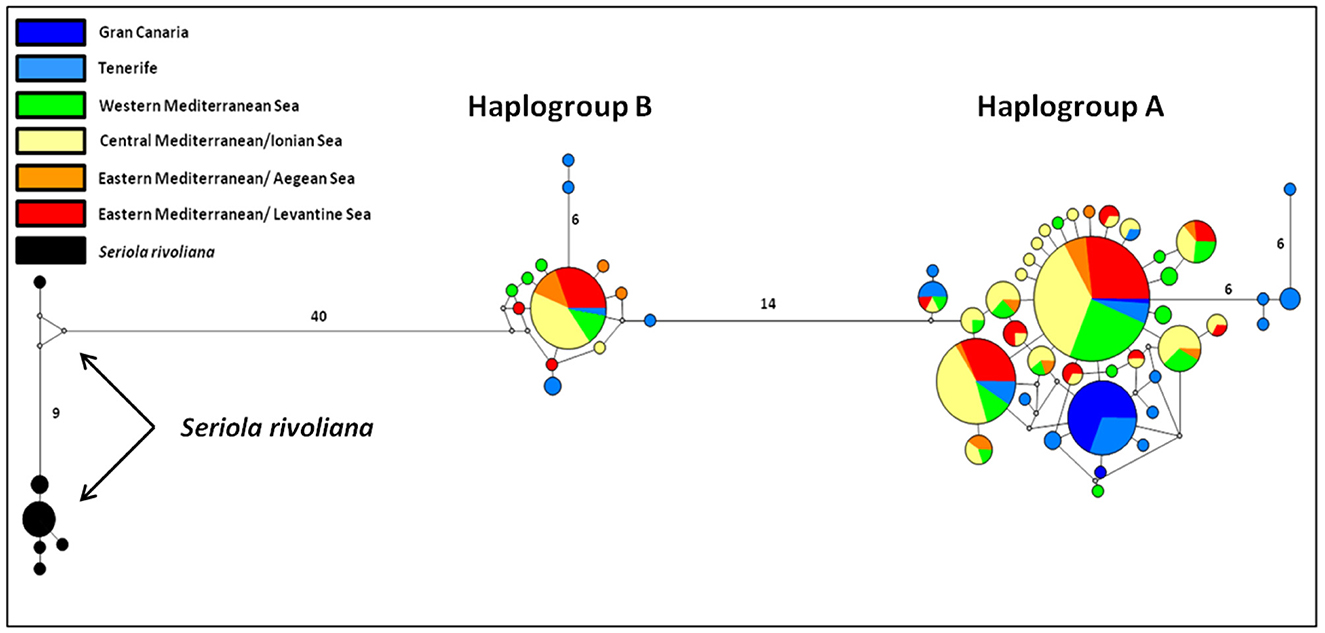
Figure 2. Median-joining network of mtDNA control region haplotypes of the greater amberjack (S. dumerili) and of S. rivoliana. Each haplotype is depicted by a circle. The size of the circle is proportional to the haplotype frequency and colors identify the geographical origin of the samples. Lines with no number correspond to a difference in a point mutation, while the presence of the number in a line indicates the amount of point mutations.
Considering only the nine populations analyzed in the current study, the estimated pairwise Φst values (Supplementary Figure 1) revealed a remarkable and statistically significant differentiation between the GC population and all the rest (high values ranging from 17.43% between GC and TE to 59.90% between GC and CR). On the contrary, Tenerife populations (TE and NTE) do not differentiate significantly (p > 0.05) from the Mediterranean populations (highest values: 11.42% between NTE and CH and 6.69% between TE and CH). Among the Mediterranean populations, no differentiation is observed (very low and statistically non-significant values) except for the AS and CH pair (Φst = 12.64%, p < 0.05).
To examine the existence of wider patterns of genetic structure based on the mtDNA control region diversity, AMOVA was performed with various combinations of population groupings (99,999 permutations for p < 0.05). The results of AMOVA are presented in Supplementary Table 3. Among different scenarios, the one that separates the GC population from the Tenerife populations (TE and NTE) and all the Mediterranean populations (LA, AS, CH, CR, CY, and TU) maximizes the genetic differentiation among groups (11.01% of the observed variation). At the same time, the values of diversity variation due to differences among populations within groups (0.49%) and within populations (88.50%) are among the lowest.
Microsatellite analysis
Locus Sdu 43 was the only monomorphic one in the data set and was therefore excluded from the downstream analysis. We did not detect the presence of stuttering and allele dropout at any of the remaining ten loci in any population. However, we observed the possible presence of null alleles at a few microsatellite loci in some populations due to the presence of a larger number of homozygous individuals compared to their expected number; none of these loci was reported to show a high frequency of null alleles in previous studies (3, 20). No significant linkage disequilibrium between any of the 10 loci was detected across all populations. Following the preceding results, we decided not to omit any microsatellite locus from the analysis.
From the analysis of the whole data set (254 samples) for 10 microsatellite loci, a high rate of polymorphism was found within the population of S. dumerili in the Mediterranean Sea and the Eastern Atlantic. Specifically, the number of alleles varied from 8 to 25; the mean number of alleles per locus was 12.7 (±0.357), while the mean number of alleles for all loci and across populations was 7.078 (±0.352). A total of 128 alleles were found, while only 18 (14.06%) of them were private; that is, they were identified only in one population (Supplementary Table 4).
According to the pairwise FST, statistically significant genetic distance values were found between the Gran Canaria and all other populations. Values between Gran Canaria and the Mediterranean populations ranged from 14.4% to 17.9% while the values between Gran Canaria and the other two Atlantic samples were 9.1% (for TE) and 12.7% (for NTE). Statistically significant but lower FST values were found between the population of Tenerife and the Mediterranean populations; for TE, it ranged from 4.0% to 5.7%, and for NTE, it varied between 2.0% and 4.4%. Last, the two populations from Tenerife show low (FST = 0.87%) and statistically non-significant interpopulation differentiation while small genetic distances and statistically non-significant were also observed among the Mediterranean populations (see Supplementary Table 5 and Supplementary Figure 2).
Different groupings were examined with AMOVA analysis; similarly to the mtDNA marker, the main source of diversity variation was proposed for the GC/TE/Mediterranean scenario with 8.36%. At the same time, this grouping also gave the lowest percentages as sources of variation among populations within groups (0.06%) as well as within populations (91.58%; Supplementary Table 6).
The results of the STRUCTURE software indicated the existence of three genetic groups (K = 3 clusters) according to the maximum mean likelihood values [LnP (K)] that were calculated (Supplementary Figure 3). In this case, the individuals from GC are assigned exclusively (with q values higher than 98%) to one genetic group (yellow in Figure 3), the individuals from Tenerife are mainly assigned to a second group (orange) while individuals from the Mediterranean Sea are assigned to either the second or third (blue) group, or they exhibit high admixture (between the second and the third group). However, when the selection of the best K was done following the ΔK criterion of the Evanno et al. (53) method, the value for K = 2 was higher followed by that for K = 3 (Supplementary Figure 3). For K = 2, the values of the participation coefficients (q) for each of the 254 individuals permitted to assign 234 out of 254 specimens to one of the two genetic groups, that is, a rate of 92.1% (q > 0.75). Conversely, 20 specimens could not be exclusively assigned to only one cluster because they presented a composite genotype with qmax < 0.75. In cluster I, some 26 fish (i.e., 10.3% of the total specimens) were assigned, and 25 of them belonged to the GC population, with an average coefficient value of q = 0.98. The last fish for cluster I came from the TE population. The remaining 208 fish (i.e., 81.8% of the total individuals) were assigned to group II and originated from TE and the East Mediterranean. However, the TE samples presented, in general, a special and significant mixing of the two genetic clusters, and this was also seen from the FST values they showed in comparisons with the GC and the East Mediterranean populations.
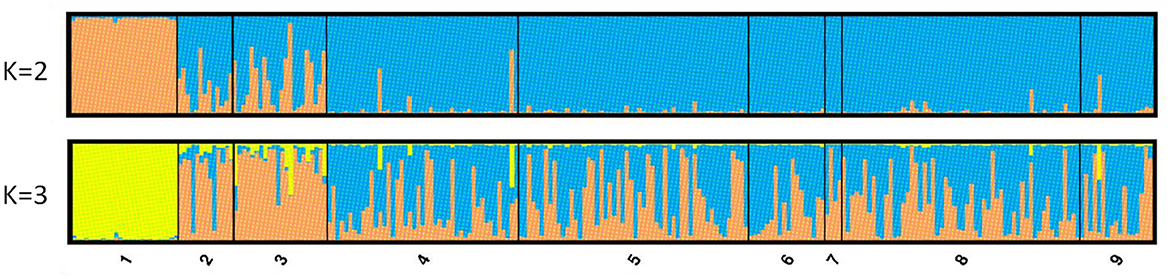
Figure 3. STRUCTURE Q-plots for 254 individuals analyzed with 10 microsatellite loci and for K = 2 and 3 (1, Gran Canaria; 2, North Tenerife; 3, Tenerife; 4, Lampedusa; 5, Astakos; 6, Chalkidiki; 7, North Crete; 8, Cyprus; 9, Mersin Turkey).
ddRAD-seq analysis
SNP calling
Sequencing yielded 665,877,326 raw reads (332,938,663 read pairs). After process_radtags, ~4% of the reads were discarded; 550,230 due to low quality (Phred score < 10), 24,855,776 and 2,049,539 for barcode or RAD cut site not found, respectively. The rest of the reads were demultiplexed successfully and assigned to the 254 individuals of the data set (Supplementary Table 7). After alignment against the genome, the percentage of properly paired reads was very high for 251 Individuals in the analysis (86% or higher) whereas only 3 samples (2 from LA and 1 from GC presented a low alignment rate and were therefore removed. Our analysis resulted in a catalog of 11,706 loci with a mean insert length of 402.4 bp. The majority of the individuals (~98%) projected 20 × or higher coverage (Supplementary Table 7). After the final filtering step, the data set consisted of 197 individuals genotyped for 1,051 SNPs. The number of polymorphic sites produced using Stacks is close to the number of loci/fragments (2,531) produced by the in silico digestion method. The difference can be attributed to the lack of loci filtering in the in silico method, as fragments are chosen based on the cutting sites and fragment length.
Measures of genetic differentiation
From the matrix of the genetic distances (pairwise FST), the population from GC was the most distant from the Mediterranean populations, especially from CR (0.179), as well as from both Northeast Atlantic populations from Tenerife (0.127 and 0.091, respectively) despite them being geographically close. The Tenerife populations (NTE and TE) were divergent from all the Mediterranean populations but less than the GC one. Also, the genetic distances between the Mediterranean populations were smaller and close (0.0006 to 0.0116; Supplementary Figure 4 and Supplementary Table 8).
Measures of inbreeding showed an excess of homozygotes in every population because the analysis yielded positive values, from 0.1531 to 0.3067. These results indicate that all populations apart from North Crete (CR) significantly deviate from the Hardy–Weinberg equilibrium and suggest non-random mating among individuals especially in the NTE, TE, and LA populations, with the higher FIS values (Supplementary Table 9). The SNP-based FIS values were much higher than the ones observed from microsatellite markers [from −0.006 to 0.079 in this study and in Supplementary Table 4, and from −0.210 to 0.041 in Šegvić-Bubić et al. (3)].
Cluster analysis
A locus-by-locus AMOVA was implemented in four clustering scenarios (presented in Supplementary Table 10). The tested scenarios were based on the geographical barrier between the two seas (Mediterranean–Atlantic division) and the previous pairwise FST analysis that showed that the Gran Canaria population may be separate from the Tenerife ones despite their limited distance. The source of variation (groups, populations, or individuals) from each AMOVA analysis shows that the genetic variation among groups (FCT) is maximum in the second scenario, which means that among the tested cases, the structure “Gran Canaria (GC) - Tenerife (both NTE and TE) - all Mediterranean” explains best the existing variation in our data.
STRUCTURE was implemented on three different data sets: the total number of loci, the candidate outlier loci, and neutral loci (total loci minus outliers, see next section). The number of clusters (K) for the studied populations was determined using Evanno et al.'s (53) method for the highest value of delta K. For the total number of 1,051 loci, STRUCTURE revealed evidence for two clusters (K = 2; Figure 4). The GC population was the only one in the first genetic cluster, and all the Mediterranean populations belonged to a second homogeneous group. Both Tenerife populations showed a high level of admixture of the two clusters independent of the data set used but seem more closely related to the Mediterranean group. The same pattern was shown by the neutral loci (Figure 4C), as well as only with the outlier loci (Figure 4A), with many individuals in populations from Tenerife and, to a lesser extent, from LA having a highly admixed profile of the two clusters. If we considered three clusters (K = 3) based on the STRUCTURE results for microsatellite loci, the distinctiveness of the two Tenerife groups was more apparent when using the full SNP data set and, to a lesser extent, with the neutral and outlier data sets (Supplementary Figure 5). However, for the three groups of loci tested by the program (total number of loci, neutral and outlier loci), K = 3 was not defined as the second most likely population structure after K = 2 according to the Evanno method (Supplementary Figure 6). Specifically, STRUCTURE denoted K = 4 as the second-most probable number of clusters for the total number and neutral loci. For outlier loci, the higher delta K values were K = 6 and then K = 8 aside from K = 2 (Supplementary Figure 7). The presence of a fourth cluster lacks support from the different types of analyses—in both the microsatellite and the SNP data—employed in this study. Furthermore, as the outliers consist only of 15 loci, relying solely on them for the interpretation of population structure, especially based on the second- or third-highest delta K values is not prudent.
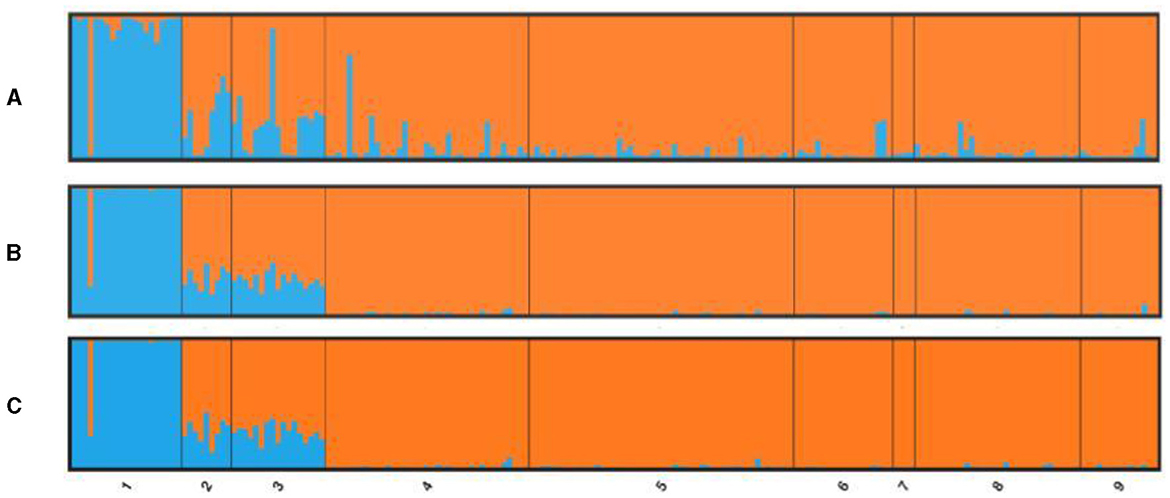
Figure 4. Bayesian individual assignment implemented in STRUCTURE for K = 2 without using geographical area as a priori. The y-axis represents the proportions of membership of greater amberjack individual genotypes for (A) outlier loci, (B) total loci, and (C) neutral loci, along with the origin locations of the specimens.
The ADMIXTURE analysis for all loci (65) provided an almost identical output with Structure, suggesting the same clustering model (Supplementary Figure 8). The most fit number of clusters is 2, as the CV error is the least for K = 2 (Supplementary Figure 9). Finally, in the multivariate analysis (DAPC), the data were optimally explained by three clusters for 20 PCA and 2 DA eigenvalues, respectively. Both Tenerife populations (NTE and TE) formed a single group, which was closer to the Mediterranean group than to the GC population (Figure 5).
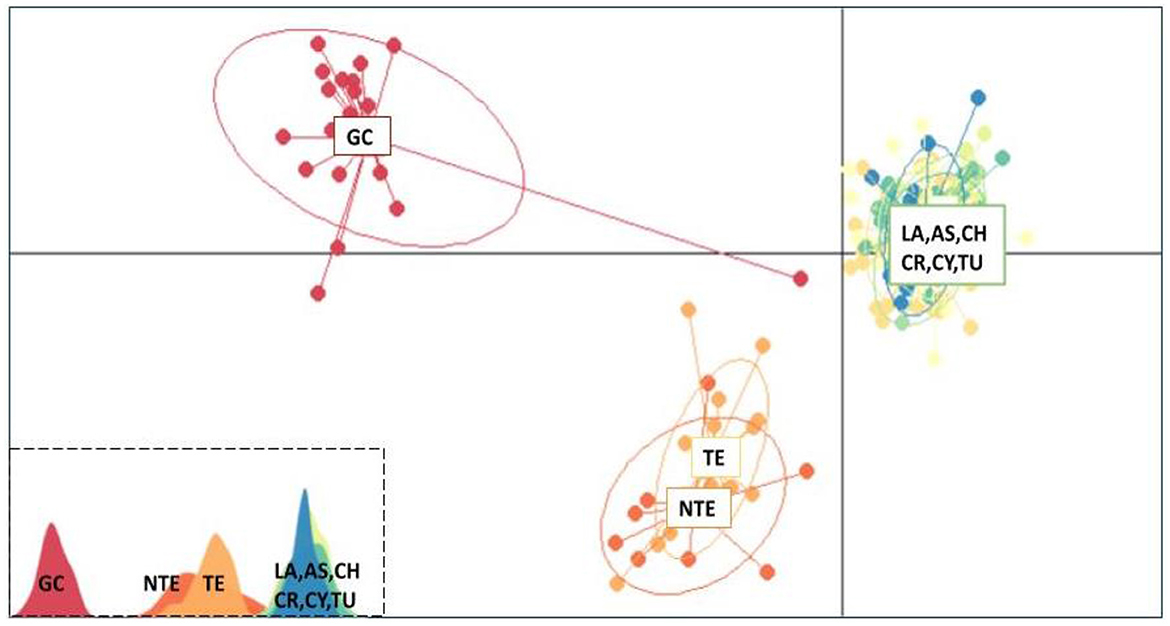
Figure 5. Discriminant analysis of principal components scatterplot. Dots represent individuals of greater amberjack (Seriola dumerili), with colors denoting sampling populations. In the lower left, the three clusters are shown as peaks in one dimension (GC, Gran Canaria; NTE, North Tenerife; TE, Tenerife; LA, Lampedusa; AS, Astakos; CH, Chalkidiki; CR, North Crete; CY, Cyprus; TU, Mersin Turkey).
Outlier loci
The number of potential outlier loci identified from Arlequin (45) and pcadapt (71) were 30 and 32, respectively. Fifteen were shared by both methods and were used in the downstream analysis, such as Bayesian cluster analysis, and the exploration of the biological identity of their closest genes (Supplementary Figure 10).
Searching genomic regions adjacent to the outlier loci, may lead to identification of candidate markers involved in environmental adaptation. The results of Bedtools (72) are presented in Table 1. Ten out of fifteen outliers were mapped on genes, while the remaining were located at the intergenic region. Upon exploring their function in the NCBI database, it appears that they play a role in various important biological pathways. Exploring the functions of these genes can be challenging as the functional annotation of non-model organisms, like the greater amberjack, is constantly improving, and thus, only a fraction of genes possess well-documented functions. Subsequently, here we focused on the genes with better established documentation. Most of them were involved in aspects of embryonic development, fin morphogenesis, notochord development in fish (pdgfa, frem2b, col27a1) (73–75), normal brain function and behavioral phenotypes in fish (grm8, nrxn2) (76, 77), and potential role in immune response in human tissues (78). Finally, we identified tead1a/TEF-1A, which is associated with a cold-acclimation mechanism in medaka [Oryzias latipes; (79)], and sec23ip, which plays a role in spermiogenesis in mice (80).
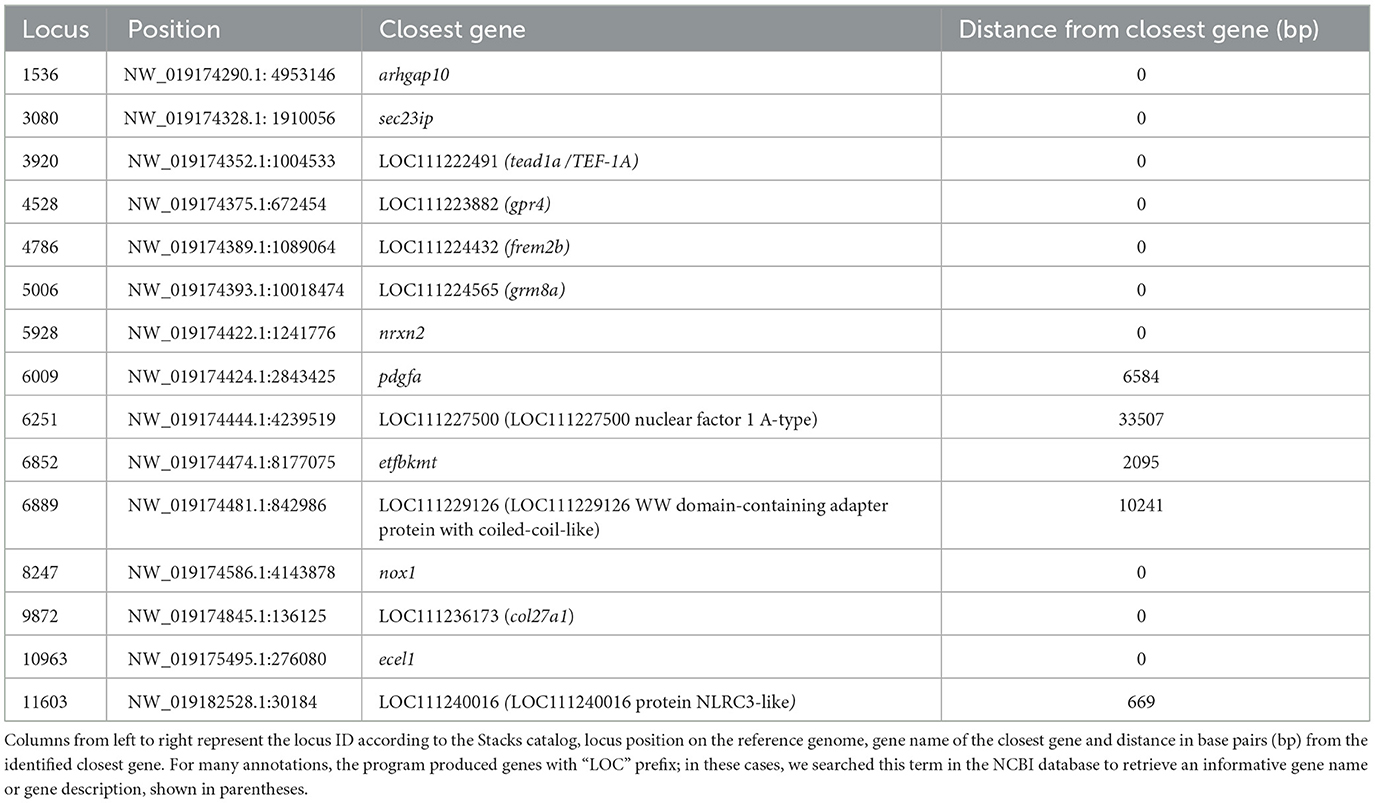
Table 1. Closest genes to putative outlier loci after functional annotation.
Discussion
In this study, mitochondrial, microsatellite and SNP markers were used to reveal the genetic structure of the greater amberjack (S. dumerili) in the Mediterranean Sea and the Northeast Atlantic Ocean. The mitochondrial marker revealed the existence of two distinct and coexisting genetic groups in both geographic regions. A more subtle differentiation was revealed by both microsatellite and SNP markers, which advocated the genetic differentiation of GC in relation to all other populations. However, the two populations from Tenerife had an intermediate genetic status between GC and Mediterranean populations. Little genetic differentiation was observed in the Mediterranean basin.
The specific pattern of control region haplotype distribution in the Mediterranean Sea and the Northeast Atlantic had already been reported in a previous study of greater amberjack (3). This two haplogroup allocation was also detected in many other large-sized and highly migratory pelagic fish like the Atlantic bonito [Sarda sarda; (81)], and the swordfish [Xiphias gladius; (82)] as well as smaller pelagic like the anchovy [Engraulis encrasicolus; (83)], or the coastal flathead gray mullet [Mugil cephalus; (84)]. When haplotypes were analyzed jointly with those from Šegvić-Bubić et al. (3), we consequently identified shared haplotypes between the Mediterranean and the Northeast Atlantic populations; four haplotypes of both groups A and B occur in both basins (H32, H42, H51, and H52; Figure 2 and Supplementary Table 2). Once again, haplogroup A is more frequent than haplogroup B, and there is no apparent geographical distinctiveness or clinal allocation of the two haplogroup frequencies. The scenario that has been put forward from similar phylogeographic results and with the two haplogroup also encountered in the Atlantic is that this arose from paleogeographical and paleoclimatic events that occurred outside the Mediterranean Sea.
Concerning the Mediterranean population of greater amberjack, herein sampled at the basin's central and eastern parts, our results did not show any geographic subdivision using any type of markers. This fact, taken together with the strong diversification of wild and farmed fish, allows us to conclude, on one hand, that the population differentiation of the species in the entire Mediterranean distribution is low and, on the other hand, that the assignment of escapees in its central and western part can be done confidently (20). This also puts emphasis on the need to be cautious with the likely translocation of stocks from the Atlantic to the Mediterranean due to the rapid expansion of the greater amberjack aquaculture industry; there is a serious obligation for the inclusion of genetic diversity as a major component for aquaculture practices and translocation policies of the species in the region.
Finally, there is a high Atlantic–Mediterranean discrepancy in our samples that follows the Almeria–Oran front. This has so far been put forward as a major biogeographic barrier instead of the Strait of Gibraltar for a number of marine fish (85–90). It has recently been suggested that the interaction of the Atlantic water with the denser and more saline Mediterranean water in the Alboran Sea, results in the formation of the hydrographic front of Almería–Oran, which is the transition point for many species (91). In recent population genetics analyses, a more holistic approach is applied with the use of spatial, oceanographic, and genomic data that allow the gene flow between groups to be studied. Studies are numerous for the Mediterranean rainbow wrasse (Coris julis), in which two genetically distinct populations (Mediterranean–Atlantic) are identified with an intermediate group located in the Alboran Sea that encompasses both the Atlantic and the Mediterranean genetic background (92). A clear genetic break between the two basins was also reported for European hake (Merluccius merluccius), with a weak differentiation within them as well as for the rabbitfish (Chimera monstrosa) for which there were no shared haplotypes between the two basins (93), suggesting that the shallow depth of the Strait of Gibraltar may act as a barrier limiting the species dispersal capabilities. Recent studies support that the integration of information from neutral and potentially-under-selection SNPs provides useful insights to adaptation mechanisms and might reveal cryptic divergence. For example, in European hake (Merluccius merluccius), significant heterogeneity among Mediterranean samples and a clear break between the Atlantic and the Mediterranean ones have been revealed (94). The diversity between the two basins was also clearly shown in a genome-wide analysis in European sea bass (Dicentrarchus labrax), and genes associated with adaptation to salinity were identified (27). In European anchovy (E. encrasicolus), another study utilized SNP markers to reveal two coexisting ecotypes in the Central Mediterranean and suggested that population structure may be due to different behavioral patterns (95). The notion that population structure is mostly influenced by a small number of highly differentiated loci, potentially under selection, was also suggested for the Atlantic horse mackerel [Trachurus trachurus; (96)]. Overall, investigating signatures of local adaptation could play a decisive role in safeguarding Mediterranean biodiversity amid climate change and heavy anthropogenic influences and lead to the development of effective management strategies (97).
This lack of population differentiation in the Mediterranean (and low FST values identified) is today increasingly documented for marine species with elevated gene flow potentials mainly due to raised dispersal capacities and high pelagic larval duration (PLD). For the latter, however, there are studies that disprove the conventional use of PLD as a good predictor for the extent of gene flow, reporting the absence of genetic structure for species with relatively long PLD [see (98)]. The greater amberjack is a species with high dispersal abilities and an extended pelagic larval stage, which may be at least 30 days in the wild; the survival of the juveniles that congregate in schools is closely connected with algae mats or other flowing objects, and it has been reported that they can be passively transported at long distances by oceanic currents (18, 99). Even slight changes in survival rates of juveniles could generate order-of-magnitude differences in the supply of new recruits (100). In addition, its reproductive traits (multiple spawnings) that take place from May to July in the Mediterranean and from April to September in the Northeast Atlantic (39, 101) could play a central role in the species' seasonal movements.
Spawning areas can be determined by various criteria, such as abundance of predators, water temperature, or seawater circulations, and can seriously affect levels of gene flow between individuals (102). The greater amberjack is a cosmopolitan species with a circumglobal distribution, found in temperate to tropical waters and spawns naturally in slightly different seasons in the Gulf of Mexico, the Canary Islands, the Mediterranean Sea, and Japan [see (9)]. We probably have to deal with different stocks distributed around the globe and for which little information is available. Most probably, genetic differentiation patterns of greater amberjack in the Northeastern Atlantic are better explained either by individuals sourced from discrete breeding grounds that are mixed in the feeding grounds in which sampling occurred or due to potential glacial refugia in which the species might have survived during the Pleistocene glaciations and from these areas the recolonization process might have occurred. The Canary Islands may have conserved much of the ancestral species diversity, but to our knowledge, no fish stocks have been reported to be genetically different between Tenerife and Gran Canaria distanced < 100 km. In the Northeast Atlantic, there are areas that have already been proposed as distinct refugia during glacial maxima like the western and southern Iberian coasts, Macaronesia (the Canary Islands and Madeira), and farther west to the Azores [see (98)]. The marine littoral fauna in the Macaronesia archipelago shares affinities with the Mediterranean, the western European, and African coasts despite the dominant average circulation reaching the Azores current (103). Therefore, new data should come from extensive sampling in the Western and Central Atlantic in which at least two stocks have been proposed to exist close to the Gulf of Mexico (16). Furthermore, Nugroho et al. (19) and Araki et al. (17) have revealed that at least two genetically different subpopulations exist in Asia, one in the East China Sea and one in the South China Sea. Similarly, in the congener yellowtail amberjack (S. lalandi), Martinez-Takeshita et al. (104), using combined mitochondrial and nuclear gene data, supported the existence of regionally restricted clades that correspond to three cryptic species.
The contrasting patterns between the mitochondrial and nuclear markers are frequent in phylogenetic and phylogeographic studies, and fish seem to have a higher frequency of reported discordance compared with other groups [see (105)]; these patterns are attributed to adaptive introgression of mtDNA, demographic disparities, and sex-biased asymmetries, with some studies also implicating hybrid zone movement, and human introductions. Microsatellite markers exhibit a complex mutational pattern and when compared to SNPs, which show a simpler mutation mechanism, they may imply higher gene flow than the latter (106). Nevertheless, in cases in which differences in the biogeographic patterns between microsatellites and mtDNA are encountered, the future use of additional multi-locus nuclear markers is proposed to confirm this discrepancy.
Recent advances in genomics now allow the use of many SNPs to assess fine-scale population structure and species boundaries in the sea. In the current study, the employment of the ddRAD sequencing approach and the use of 1,051 SNP follow this trend to resolve this pattern from Mediterranean and Northeaster Atlantic populations. In the latter region, Cunha et al. (107) used a genotyping-by-sequencing approach in blackspot seabream (Pagellus bogaraveo) to reveal the existence of an additional genetic cluster in the Eastern Atlantic (Gulf of Cádiz) that was not identified in previous studies based on mitochondrial DNA or microsatellite data. Therefore, in the new era of population genomics we anticipate that future studies making use of genome-wide polymorphic markers are expected to unfold and propose novel stock delimitations not only for the greater amberjack but also for many fish species around the world.
In the current study, we encounter high concordance between the microsatellite and SNP markers used; Bayesian results show clearly the Atlantic–Mediterranean divide with an intermediate position of the Tenerife samples (Figures 3, 4 and Supplementary Figure 5). Whether the latter might be considered as a third distinct or an intermediate stock is not supported by the Evanno criterion although its position is clearly differentiated in the DAPC analysis (Figure 5). Microsatellites are considered to have a fast mutation rate and high degree of polymorphism in contrast to the slower evolving and biallelic SNPs, and these two types of markers have been jointly used to draw diversity and divergence estimates in many studies [see (108)], with SNPs showing more precise estimates of population-level diversity, higher power to identify groups in clustering methods, and the ability to consider local adaptation (109).
It is becoming increasingly important to enhance our understanding of local adaptation mechanisms, through which different populations of a species develop distinct characteristics in response to the unique environmental challenges they encounter in their respective habitats (110). Understanding local adaptation, provides insight into the genetic basis of traits that respond to these diverse environmental pressures. Outlier loci in population genetic analyses could potentially constitute markers for selection (111). In this study, we identified genes linked to outlier SNPs involved in various biological processes. We detected two genes of great interest, tead1a/TEF-1A (TEA domain family member 1a) and sec23ip (SEC23 interacting protein). In medaka (O. latipes) muscle tissue, the first gene produces two splicing variants, TEF-1A and TEF-1B mRNAs. During cold acclimation, the mRNA level of TEF-1A decreased, whereas that of TEF-1B increased (79). This temperature-sensitive marker should be incorporated into future research, as it holds significant potential for exploring the adaptation mechanisms of organisms in the ever-changing environmental landscape, especially because of rapid climate change. The Mediterranean Sea specifically, was one of the first of the world seas where changes related to temperature were attributed to climate change (112). The identification of tead1a/TEF-1A could provide insights into management strategies of the greater amberjack in the Mediterranean and Atlantic stocks. Finally, sec23ip has been mostly studied in mammals (80, 113). However, if the gene retains this function in fish and is thus involved in pathways affiliated with reproduction like spermiogenesis, it might be a marker undergoing adaptive changes to optimize reproductive success in response to specific ecological conditions. In conclusion, despite the seemingly less intricate population structure of the greater amberjack in the Mediterranean and Northeast Atlantic, an unreported variation seems to exist that might lead to different adaptation strategies among populations, potentially impacting their comparative survival rates and reproductive success.
Data availability statement
Raw demultiplexed reads used in this study are available in ENA project accession PRJEB72804. Control region mitochondrial sequences were submitted in GenBank (accession numbers PP329347–PP329370).
Ethics statement
Ethical approval was not required for the studies involving animals in accordance with the local legislation and institutional requirements because sampling was conducted back in 2015 before an Ethics Committee exists in IMBBC, HCMR, and followed guidelines of the DIVERSIFY project. Non-invasive sampling of fin-clips was done when fish were pit-tagged. Written informed consent was obtained from the owners for the participation of their animals in this study.
Author contributions
AK: Data curation, Formal analysis, Investigation, Methodology, Software, Validation, Visualization, Writing—original draft, Writing—review & editing. DT: Conceptualization, Data curation, Formal analysis, Investigation, Methodology, Software, Supervision, Validation, Visualization, Writing—original draft, Writing—review & editing. EK: Data curation, Formal analysis, Investigation, Methodology, Software, Writing—original draft. AM: Conceptualization, Funding acquisition, Investigation, Project administration, Resources, Supervision, Writing—original draft. CM: Conceptualization, Funding acquisition, Project administration, Resources, Supervision, Writing—original draft. IF: Conceptualization, Formal analysis, Funding acquisition, Methodology, Project administration, Resources, Writing—original draft. TM: Conceptualization, Data curation, Formal analysis, Investigation, Methodology, Software, Supervision, Validation, Visualization, Writing—original draft, Writing—review & editing. CT: Conceptualization, Data curation, Formal analysis, Funding acquisition, Investigation, Methodology, Project administration, Resources, Software, Supervision, Validation, Visualization, Writing—original draft, Writing—review & editing.
Funding
The author(s) declare that financial support was received for the research, authorship, and/or publication of this article. This study has received funding from the European Union's Seventh Framework Programme for research, technological development, and demonstration (KBBE-2013-07 single stage, GA 603121, DIVERSIFY) as well as from the EPAnEK (“Competitiveness, Entrepreneurship, and Innovation”) operational programme for the project “Modern Unifying Trends in Marine Biology (MOUNT; MIS 5002470)”.
Acknowledgments
The authors would like to thank Tasos Raftopoulos (Argosaronikos Fishfarming S. A., Greece), Michalis Marinos (FORKYS S. A., Greece), Vasilis Papadopoulos (Department of Fisheries and Marine Research, Republic of Cyprus), Serkan Ilgaz (KILIC Aquaculture, Turkey), Salvador Jerez (Spanish Institute of Oceanography, Spain), Aldo Corriero (University of Bari Aldo Moro, Italy) and Juan Manuel Afonso Lopez (ULPGC, Spain) for sample collections. We also thank Aik. Oikonomaki and S. Darivianakis for laboratory assistance.
Conflict of interest
The authors declare that the research was conducted in the absence of any commercial or financial relationships that could be construed as a potential conflict of interest.
The author(s) declared that they were an editorial board member of Frontiers, at the time of submission. This had no impact on the peer review process and the final decision.
Publisher's note
All claims expressed in this article are solely those of the authors and do not necessarily represent those of their affiliated organizations, or those of the publisher, the editors and the reviewers. Any product that may be evaluated in this article, or claim that may be made by its manufacturer, is not guaranteed or endorsed by the publisher.
Supplementary material
The Supplementary Material for this article can be found online at: https://www.frontiersin.org/articles/10.3389/frish.2024.1356313/full#supplementary-material
References
1. Wells RJD, Rooker JR. Distribution, age, and growth of young-of-the-year greater amberjack (Seriola dumerili) associated with pelagic Sargassum. Fishery Bullet. (2004) 102:545–54.
2. Thompson BA, Beasley M, Wilson CA. Age distribution and growth of greater amberjack, Seriola dumerili, from the north-central Gulf of Mexico. Fishery Bullet. (1999) 97:362–71.
3. Šegvić-Bubić T, Marrone F, Grubišić L, Izquierdo-Gomez D, Katavić I, Arculeo M, et al. Two seas, two lineages: how genetic diversity is structured in Atlantic and Mediterranean greater amberjack Seriola dumerili Risso, 1810 (Perciformes, Carangidae). Fish Res. (2016) 179:271–9. doi: 10.1016/j.fishres.2016.03.018
4. Papandroulakis N, Mylonas CC, Maingot E, Divanach P. First results of greater amberjack (Seriola dumerili) larval rearing in mesocosm. Aquaculture. (2005) 250:155–61. doi: 10.1016/j.aquaculture.2005.02.036
5. Ottolenghi F, Silvestri C, Giordano P, Lovatelli A, New MB. Capture-Based Aquaculture. The Fattening of Eels, Groupers, Tunas and Yellowtails. Rome: Food and Agriculture Organization of the United Nations, 308 (2004).
6. Pousis C, Mylonas CC, De Virgilio C, Gadaleta G, Santamaria N, Passantino L, et al. The observed oogenesis impairment in greater amberjack Seriola dumerili (Risso, 1810) reared in captivity is not related to an insufficient liver transcription or oocyte uptake of vitellogenin. Aquacult Res. (2018) 49:243–52. doi: 10.1111/are.13453
7. Zupa R, Fauvel C, Mylonas CC, Pousis C, Santamaria N, Papadaki, M, et al. Rearing in captivity affects spermatogenesis and sperm quality in greater amberjack, Seriola dumerili (Risso, 1810). J Anim Sci. (2017) 95:4085. doi: 10.2527/jas.2017.1708
8. Mylonas CC, Papandroulakis N, Smboukis A, Papadaki M, Divanach P. Induction of spawning of cultured greater amberjack (Seriola dumerili) using GnRHa implants. Aquaculture. (2004) 237:141–54. doi: 10.1016/j.aquaculture.2004.04.015
9. Corriero A, Wylie MJ, Nyuji M, Zupa R, Mylonas CC. Reproduction of greater amberjack (Seriola dumerili) and other members of the family Carangidae. Rev Aquacult. (2021) 13:1781–815. doi: 10.1111/raq.12544
10. Sicuro B, Luzzana U. The state of seriola spp. other than yellowtail (S. quinqueradiata) Farming in the World. Rev Fisheries Sci Aquaculture. (2016) 24:314–25. doi: 10.1080/23308249.2016.1187583
11. Conover DO, Clarke LM, Munch SB, Wagner GN. Spatial and temporal scales of adaptive divergence in marine fishes and the implications for conservation. J Fish Biol. (2006) 69:21–47. doi: 10.1111/j.1095-8649.2006.01274.x
12. Araki H, Schmid C. Is hatchery stocking a help or harm? Evidence, limitations and future directions in ecological and genetic surveys. Aquaculture. (2010) 308:S2–S11. doi: 10.1016/j.aquaculture.2010.05.036
13. Prado FD, Vera M, Hermida M, Blanco A, Bouza C, Maes GE, et al. Tracing the genetic impact of farmed turbot Scophthalmus maximus on wild populations. Aquaculture Environ Int. (2018) 10:447–63. doi: 10.3354/aei00282
14. Tsaparis D, Lecocq T, Kyriakis D, Oikonomaki K, Fontaine P. Assessing genetic variation in wild and domesticated pikeperch populations: implications for conservation and fish farming. Animals. (2022) 12:1178. doi: 10.3390/ani12091178
15. Gold JR, Richardson LR. Population structure in greater amberjack, Seriola dumerili, from the Gulf of Mexico and the western Atlantic Ocean. Fishery Bulletin. (1998) 96:767–78.
16. Hargrove JS, Murie DJ, Parkyn DC, Saarinen EV, Austin JD. Mixing rates in weakly differentiated stocks of greater amberjack (Seriola dumerili) in the Gulf of Mexico. Genetica. (2018) 146:393–402. doi: 10.1007/s10709-018-0031-1
17. Araki K, Aokic JY, Kawase J, Hamada K, Ozaki A, Fujimoto H, et al. Whole genome sequencing of greater amberjack (Seriola dumerili) for SNP identification on aligned scaffolds and genome structural variation analysis using parallel resequencing. Int J Genom. (2018) 21:292. doi: 10.1155/2018/7984292
18. Hasegawa T, Lu CP, Hsiao ST, Uchino T, Yeh HM, Chiang WC, et al. Distribution and genetic variability of young-of-the-year greater amberjack (Seriola dumerili) in the East China Sea. Environ Biol Fishes. (2020) 103:833–46. doi: 10.1007/s10641-020-00985-6
19. Nugroho E, Taniguchi N, Kato K, Miyashita S. Genetic difference among seed ppulations of greater amberjack used in aquaculture farm of Japan. Aquacult Sci. (2000) 48:665–74. doi: 10.11233/aquaculturesci1953.48.665
20. Šegvić-Bubić T, Talijančić I, ŽuŽul I, Žuvić L, Grubišić L, Izquierdo-Gomez D, et al. Culture of Seriola dumerili in a marine ecosystem: Insights from genetic and morphometric fish traits and implications of escape events. Estuar Coast Shelf Sci. (2022) 278:108115. doi: 10.1016/j.ecss.2022.108115
21. Sarropoulou E, Sundaram AYM, Kaitetzidou E, Kotoulas G, Gilfillan GD, Papandroulakis N, et al. Full genome survey and dynamics of gene expression in the greater amberjack Seriola dumerili. Gigascience. (2017) 6:1–13. doi: 10.1093/gigascience/gix108
22. Etter PD, Bassham S, Hohenlohe PA, Johnson EA. SNP discovery and genotyping for evolutionary genetics using RAD sequencing. Mol Methods Evol Genet Mol Biol. (2011) 772:157–78. doi: 10.1007/978-1-61779-228-1_9
23. Hohenlohe PA, Hand BK, Andrews KR, Luikart G. Population Genomics Provides Key Insights in Ecology and Evolution. In:O. Rajora, , editors Population Genomics. Cham; Springer (2018).
24. Robledo D, Palaiokostas C, Bargelloni L, Martínez P, Houston R. Applications of genotyping by sequencing in aquaculture breeding and genetics. Rev Aquacult. (2018) 10:670–82. doi: 10.1111/raq.12193
25. Recknagel H, Elmer KR, Meyer A. A hybrid genetic linkage map of two ecologically and morphologically divergent midas cichlid fishes (Amphilophus spp.) obtained by massively parallel DNA sequencing (ddRADSeq). G3. (2013) 3:65–74. doi: 10.1534/g3.112.003897
26. Manousaki T, Tsakogiannis A, Taggart JB, Palaiokostas C, Tsaparis D, Lagnel J, et al. Exploring a nonmodel teleost genome through rad sequencing-linkage mapping in common pandora, Pagellus erythrinus. and comparative genomic analysis. G3. (2016) 6:509–19. doi: 10.1534/g3.115.023432
27. Tine M, Kuhl H, Gagnaire PA, Louro B, Desmarais E, Martins RST, et al. European sea bass genome and its variation provide insights into adaptation to euryhalinity and speciation. Nat Commun. (2014) 5:5770–5770. doi: 10.1038/ncomms6770
28. Houston RD, Davey JW, Bishop SC, Lowe NR, Mota-Velasco JC, et al. Characterisation of QTL-linked and genome-wide restriction site-associated DNA (RAD) markers in farmed Atlantic salmon. BMC Genomics. (2012) 13:244. doi: 10.1186/1471-2164-13-244
29. Bradic M, Teotónio H, Borowsky RL. The population genomics of repeated evolution in the blind cavefish Astyanax mexicanus. Mol Biol Evol. (2013) 30:2383–400. doi: 10.1093/molbev/mst136
30. Hohenlohe PA, Bassham S, Etter PD, Stiffler N, Johnson EA, et al. Population genomics of parallel adaptation in threespine stickleback using sequenced RAD tags. PLoS Genet. (2010) 6:1000862. doi: 10.1371/journal.pgen.1000862
31. Rodríguez-Ezpeleta N, Bradbury IR, Mendibil I, Álvarez P, Cotano U, Irigoien X, et al. Population structure of Atlantic mackerel inferred from RAD-seq-derived SNP markers: effects of sequence clustering parameters and hierarchical SNP selection. Mol Ecol Resour. (2016) 16:991–1001. doi: 10.1111/1755-0998.12518
32. Sherman KD, Paris JR, King RA, Moore KA, Dahlgren CP, Knowles LC, et al. RAD-Seq analysis and in situ monitoring of nassau grouper reveal fine-scale population structure and origins of aggregating fish. Front Mar Sci. (2020) 7:157. doi: 10.3389/fmars.2020.00157
33. Zhang BD, Xue DX, Li YL, Liu JX. RAD genotyping reveals fine-scale population structure and provides evidence for adaptive divergence in a commercially important fish from the northwestern Pacific Ocean. PeerJ. (2019) 2019:e7242. doi: 10.7717/peerj.7242
34. Hollenbeck CM, Portnoy DS, Gold JR. Evolution of population structure in an estuarine-dependent marine fish. Ecol Evol. (2019) 9:3141–52. doi: 10.1002/ece3.4936
35. Benestan L, Gosselin T, Perrier C, Sainte-Marie B, Rochette R, Bernatchez L, et al. RAD genotyping reveals fine-scale genetic structuring and provides powerful population assignment in a widely distributed marine species, the American lobster (Homarus americanus). Mol Ecol. (2015) 24:3299–315. doi: 10.1111/mec.13245
36. Araneda C, Larraín MA, Hecht B, Narum S. Adaptive genetic variation distinguishes Chilean blue mussels (Mytilus chilensis) from different marine environments. Ecol Evol. (2016) 6:3632–44. doi: 10.1002/ece3.2110
37. Miller SA, Dykes DD, Polesky HF. A simple salting out procedure for extracting DNA from human nucleated cells. Nucleic Acids Res. (1988) 16:1215. doi: 10.1093/nar/16.3.1215
38. Renshaw MA, Patton JC, Rexroad Iii CE, Gold JR. Isolation and characterization of dinucleotide microsatellites in greater amberjack, Seriola dumerili. Conserv Genet. (2007) 8:1009–11. doi: 10.1007/s10592-006-9221-y
39. Harris PJ, Wyanski DM, White DB, Mikell PP, Eyo PB. Age growth, and reproduction of greater amberjack off the southeastern US Atlantic coast. Trans Am Fisheries Soc. (2007) 136:1534–45. doi: 10.1577/T06-113.1
40. Toonen RJ, Hughes S. Increased throughput for fragment analysis on an ABI PRISM 377 automated sequencer using a membrane comb and STRand software. Biotechniques. (2001) 31:1320–4.
41. Peterson BK, Weber JN, Kay EH, Fisher HS, Hoekstra HE. Double digest RADseq: An inexpensive method for de novo SNP discovery and genotyping in model and non-model species. PLoS ONE. (2012) 7: 37135. doi: 10.1371/journal.pone.0037135
42. Tamura K, Stecher G, Peterson D, Filipski A, Kumar S. MEGA6: molecular evolutionary genetics analysis version 6.0. Mol Biol E. (2013) 30:2725–9. doi: 10.1093/molbev/mst197
43. Xia X. DAMBE5: a comprehensive software package for data analysis in molecular biology and evolution. Mol Biol Evol. (2013) 30:1720–8. doi: 10.1093/molbev/mst064
44. Bandelt HJ, Forster P, Röhl A. Median-joining networks for inferring intraspecific phylogenies. Mol Biol Evol. (1999) 16:37–48. doi: 10.1093/oxfordjournals.molbev.a026036
45. Excoffier L, Lischer HEL. Arlequin suite ver 3.5: a new series of programs to perform population genetics analyses under Linux and Windows. Mol Ecol Res. (2010) 10:564–67. doi: 10.1111/j.1755-0998.2010.02847.x
46. Van Oosterhout C, Hutchinson WF, Wills DPM, Shipley P. MICRO-CHECKER: Software for identifying and correcting genotyping errors in microsatellite data. Mol Ecol Notes. (2004) 4:535–8. doi: 10.1111/j.1471-8286.2004.00684.x
47. Peakall R, Smouse PE. GenAlEx 6.5: genetic analysis in Excel. Population genetic software for teaching and research–an update. Bioinformatics. (2012) 28:2537–9. doi: 10.1093/bioinformatics/bts460
48. Goudet J. FSTAT (Version 1.2): a computer program to calculate F-statistics. J Hered. (1995) 86:485–6. doi: 10.1093/oxfordjournals.jhered.a111627
49. Pritchard JK, Stephens M, Donnelly P. Inference of population structure using multilocus genotype data. Genetics. (2000) 155:945–59. doi: 10.1093/genetics/155.2.945
50. Falush D, Stephens M, Pritchard JK. Inference of population structure using multilocus genotype data: Linked loci and correlated allele frequencies. Genetics. (2003) 164:1567–87. doi: 10.1093/genetics/164.4.1567
51. Falush D, Stephens M, Pritchard JK. Inference of population structure using multilocus genotype data: dominant markers and null alleles. Mol Ecol Notes. (2007) 7:574–8. doi: 10.1111/j.1471-8286.2007.01758.x
52. Hubisz MJ, Falush D, Stephens M, Pritchard JK. Inferring weak population structure with the assistance of sample group information. Mol Ecol Resour. (2009) 9:1322–32. doi: 10.1111/j.1755-0998.2009.02591.x
53. Evanno G, Regnaut S, Goudet J. Detecting the number of clusters of individuals using the software structure: a simulation study. Mol Ecol. (2005) 14:2611–20. doi: 10.1111/j.1365-294X.2005.02553.x
54. Earl DA, von Holdt BM. STRUCTURE HARVESTER: a website and program for visualizing STRUCTURE output and implementing the Evanno method. Conserv Genet Resour. (2011) 4:359–61. doi: 10.1007/s12686-011-9548-7
55. Rochette NC, Rivera-Colón AG, Catchen JM. Stacks 2: Analytical methods for paired-end sequencing improve RADseq-based population genomics. Mol Ecol. (2019) 28:4737–54. doi: 10.1111/mec.15253
56. Andrews S. FastQC: A Quality Control Tool For High Throughput Sequence Data. (2010). Available online at: http://www.bioinformatics.babraham.ac.uk/projects/fastqc/ (accessed February 21, 2023).
57. Li H, Durbin R. Fast and accurate short read alignment with Burrows-Wheeler transform. Bioinformatics. (2009) 25:1754–60. doi: 10.1093/bioinformatics/btp324
58. Li H, Handsaker B, Wysoker A, Fennell T, Ruan J, Homer N, et al. The Sequence Alignment/Map format and SAMtools. Bioinf Appl Notes. (2009) 25:2078–9. doi: 10.1093/bioinformatics/btp352
59. Maroso F, Gkagkavouzis K, de Innocentiis D, Hillen SJ, do Prado F, Karaiskou N, et al. Genome-wide analysis clarifies the population genetic structure of wild gilthead sea bream (Sparus aurata). PLoS ONE. (2021) 16:1–16. doi: 10.1371/journal.pone.0236230
60. Nousias O, Oikonomou S, Manousaki T, Papadogiannis V, Angelova N, Tsaparis D, et al. Linkage mapping, comparative genome analysis, and QTL detection for growth in a non-model teleost, the meagre Argyrosomus regius, using ddRAD sequencing. Sci Rep. (2022) 12:1–11. doi: 10.1038/s41598-022-09289-4
61. Lepais O, Weir JT. SimRAD: An R package for simulation-based prediction of the number of loci expected in RADseq and similar genotyping by sequencing approaches. Mol Ecol Resour. (2014) 14:1314–21. doi: 10.1111/1755-0998.12273
62. Rousset F. Genepop'007: a complete reimplementation of the Genepop software for Windows and Linux. Mol Ecol Resources. (2008) 8:103–6. doi: 10.1111/j.1471-8286.2007.01931.x
63. Pina-Martins F, Silva DN, Fino J, Paulo OS. Structure_threader: an improved method for automation and parallelization of programs structure, fastStructure and MavericK on multicore CPU systems. Mol Ecol Resour. (2017) 17:e268–74. doi: 10.1111/1755-0998.12702
64. Kopelman NM, Mayzel J, Jakobsson M, Rosenberg NA, Mayrose I. Clumpak: a program for identifying clustering modes and packaging population structure inferences across K. Mol Ecol Resour. (2015) 15:1179–91. doi: 10.1111/1755-0998.12387
65. Alexander DH, Novembre J, Lange K. Fast model-based estimation of ancestry in unrelated individuals. Genome Res. (2009) 19:1655–64. doi: 10.1101/gr.094052.109
66. Jombart T, Devillard S, Balloux F. Discriminant analysis of principal components: A new method for the analysis of genetically structured populations. BMC Genet. (2010) 11:1–15. doi: 10.1186/1471-2156-11-94
67. Thia JA. Guidelines for standardizing the application of discriminant analysis of principal components to genotype data. Mol Ecol Resour. (2023) 23:523–38. doi: 10.1111/1755-0998.13706
68. Jombart T, Collins C. A Tutorial for Discriminant Analysis of Principal Components (DAPC) Using Adegenet 2, 0.0 (2015). Available online at: https://adegenet.r-forge.r-project.org/files/tutorial-dapc.pdf
69. Dray S, Dufour AB. The ade4 package: implementing the duality diagram for ecologists. J Stat Softw. (2007) 22:1–20. doi: 10.18637/jss.v022.i04
70. Excoffier L, Hofer T, Foll M. Detecting loci under selection in a hierarchically structured population. Heredity. (2009) 103:285–98. doi: 10.1038/hdy.2009.74
71. Luu K, Bazin E, Blum MGB. pcadapt: an R package to perform genome scans for selection based on principal component analysis. Mol Ecol Resour. (2017) 17:67–77. doi: 10.1111/1755-0998.12592
72. Quinlan AR, Hall IM. BEDTools: a flexible suite of utilities for comparing genomic features. Bioinformatics. (2010) 26:841–2. doi: 10.1093/bioinformatics/btq033
73. Christiansen HE, Lang MR, Pace JM, Parichy DM. Critical early roles for col27a1a and col27a1b in zebrafish notochord morphogenesis, vertebral mineralization and post-embryonic axial growth. PLoS ONE. (2009) 4:e8481. doi: 10.1371/journal.pone.0008481
74. Gautier P, Naranjo-Golborne C, Taylor MS, Jackson IJ, Smyth I. Expression of the fras1/frem gene family during zebrafish development and fin morphogenesis. Dev Dynamics. (2008) 237:3295–304. doi: 10.1002/dvdy.21729
75. Liu L, Korzh V, Balasubramaniyan NV, Ekker M, Ge R. Platelet-derived growth factor A (pdgf-a) expression during zebrafish embryonic development. Dev Genes Evol. (2002) 212:298–301. doi: 10.1007/s00427-002-0234-3
76. Koh A, Tao S, Jing Goh Y, Chaganty V, See K. A Neurexin2aa deficiency results in axon pathfinding defects and increased anxiety in zebrafish. Hum Mol Genet. (2020) 29:3765–80. doi: 10.1093/hmg/ddaa260
77. Lüffe TM, Bauer M, Gioga Z, Özbay D, Romanos M, Lillesaar C, et al. Loss-of-function models of the metabotropic glutamate receptor genes Grm8a and Grm8b display distinct behavioral phenotypes in zebrafish larvae (Danio rerio). Front Mol Neurosci. (2022) 15:901309. doi: 10.3389/fnmol.2022.901309
78. Taylor JP, Tse HM. The role of NADPH oxidases in infectious and inflammatory diseases. Redox Biol. (2021) 48:102159. doi: 10.1016/j.redox.2021.102159
79. Yamasaki Y, Komoike Y, Higashinakagawa T. Adaptive changes in TEF-1 gene expression during cold acclimation in the medaka. Zoolog Sci. (2006) 23:903–8. doi: 10.2108/zsj.23.903
80. Xiong W, Shen C, Wang Z. The molecular mechanisms underlying acrosome biogenesis elucidated by gene-manipulated mice. Biol Reprod. (2021) 105:789–807. doi: 10.1093/biolre/ioab117
81. Viñas J, Alvarado Bremer J, Pla C. Phylogeography of the Atlantic bonito (Sarda sarda) in the northern Mediterranean: the combined effects of historical vicariance, population expansion, secondary invasion, and isolation by distance. Mol Phylogenet Evol. (2004) 33:32–42. doi: 10.1016/j.ympev.2004.04.009
82. Vinas J, Perez-Serra A, Vidal O, Alvarado Bremer JR, Pla C. Genetic differentiation between eastern and western Mediterranean swordfish revealed by phylogeographic analysis of the mitochondrial DNA control region. ICES J Mar Sci. (2010) 67:1222–9. doi: 10.1093/icesjms/fsq031
83. Magoulas A, Castilho R, Caetano S, Marcato S, Patarnello T. Mitochondrial DNA reveals a mosaic pattern of phylogeographical structure in Atlantic and Mediterranean populations of anchovy (Engraulis encrasicolus). Mol Phylogenet Evol. (2006) 39:734–46. doi: 10.1016/j.ympev.2006.01.016
84. Durand JD, Blel H, Shen KN, Koutrakis ET, Guinand B. Population genetic structure of Mugil cephalus in the Mediterranean and Black Seas: a single mitochondrial clade and many nuclear barriers. Mar Ecol Prog Ser. (2013) 474:243–61. doi: 10.3354/meps10080
85. Bargelloni L, Alarcon JA, Alvarez MC, Penzo E, Magoulas A, Reis C, et al. Discord in the family Sparidae (Teleostei): divergent phylogeographical patterns across the Atlantic-Mediterranean divide. J Evol Biol. (2003) 16:1149–58. doi: 10.1046/j.1420-9101.2003.00620.x
86. Cimmaruta R, Bondanelli P, Nascetti G. Genetic structure and environmental heterogeneity in the European hake (Merluccius merluccius). Mol Ecol. (2005) 14:2577–91. doi: 10.1111/j.1365-294X.2005.02595.x
87. Lemaire C, Versini JJ, Bonhomme F. Maintenance of genetic differentiation across a transition zone in the sea: discordance between nuclear and cytoplasmic markers. J Evol Biol. (2005) 18:70–80. doi: 10.1111/j.1420-9101.2004.00828.x
88. Charrier G, Chenel T, Durand JD, Girard M, Quiniou L, Laroche J, et al. Discrepancies in phylogeographical patterns of two European anglerfishes (Lophius budegassa and Lophius piscatorius). Mol Phylogenet Evol. (2006) 38:742–54. doi: 10.1016/j.ympev.2005.08.002
89. Viñas J, Alvarado Bremer JR, Pla C. Inter-oceanic genetic differentiation among albacore (Thunnus alalunga) populations. Mar Biol. (2004) 145:225–32. doi: 10.1007/s00227-004-1319-5
90. Patarnello T, Volckaert FAMJ, Castilho R. Pillars of Hercules: Is the Atlantic-Mediterranean transition a phylogeographical break? Mol Ecol. (2007) 16:4426–44. doi: 10.1111/j.1365-294X.2007.03477.x
91. Reuschel S, Cuesta JA, Schubart CD. Marine biogeographic boundaries and human introduction along the European coast revealed by phylogeography of the prawn Palaemon elegans. Mol Phylogenet Evol. (2010) 55:765–75. doi: 10.1016/j.ympev.2010.03.021
92. Fruciano C, Hanel R, Debes PV, Tigano C, Ferrito V. Atlantic-Mediterranean and within-Mediterranean molecular variation in Coris julis (L. 1758) (Teleostei. Labridae). Marine Biology. (2011) 158:1271–86. doi: 10.1007/s00227-011-1647-1
93. Catarino D, Stanković D, Menezes G, Stefanni S. Insights into the genetic structure of the rabbitfish Chimaera monstrosa (Holocephali) across the Atlantic-Mediterranean transition zone. J Fish Biol. (2017) 91:1109–22. doi: 10.1111/jfb.13404
94. Milano I, Babbucci M, Cariani A, Atanassova M, Bekkevold D, Carvalho GR, et al. Outlier SNP markers reveal fine-scale genetic structuring across European hake populations (Merluccius merluccius). Mol Ecol. (2014) 23:118–35. doi: 10.1111/mec.12568
95. Catanese G, Watteaux R, Montes I, et al. Insights on the drivers of genetic divergence in the European anchovy. Sci Rep. (2017) 7:4180. doi: 10.1038/s41598-017-03926-z
96. Fuentes-Pardo AP, Farrell ED, Pettersson ME, Sprehn CG. The genomic basis and environmental correlates of local adaptation in the Atlantic horse mackerel (Trachurus trachurus). Evol Appl. (2023) 16:1201–19. doi: 10.1111/eva.13559
97. Aurelle D, Thomas S, Albert C, Bally M, Bondeau A, Boudouresque CF, et al. Biodiversity, climate change, and adaptation in the Mediterranean. Ecosphere. (2022) 13:e3915. doi: 10.1002/ecs2.3915
98. Almada F, Francisco SM, Lima CS, Fitzgerald R, Mirimin L, Villegas-Ríos D, et al. Historical gene flow constraints in a northeastern Atlantic fish: phylogeography of the ballan wrasse Labrus bergylta across its distribution range. R Soc Open Sci. (2017) 4:2. doi: 10.1098/rsos.160773
99. Hasegawa T, Takatsuki N, Kawabata Y, Kawabe R, Nishihara GN, Ishimatsu A, et al. Continuous behavioral observation reveals the function of drifting seaweeds for Seriola spp. Juveniles Marine Ecol Prog Series. (2017) 573:101–15. doi: 10.3354/meps12154
100. Houde ED. Emerging from Hjort's shadow. J Northwest Atlantic Fisher Sci. (2008) 41:53–70. doi: 10.2960/J.v41.m634
101. Sley A, Hadj Taeib A, Jarboui O, Ghorbel M, Bouain A. Reproductive biology of greater amberjack Seriola dumerili (Risso, 1810) from the Eastern Mediterranean Sea (Tunisia, Gulf of Gabes). Cah Biol Mar. (2014) 55:421–30. doi: 10.21411/CBM.A.21508B77
102. Ottmann D, Fiksen Ø, Martín M, Alemany F, Prieto L, Álvarez-Berastegui F, et al. Spawning site distribution of a bluefin tuna reduces jellyfish predation on early life stages. Limnol Oceanograph. (2021) 66:3669–81. doi: 10.1002/lno.11908
104. Martinez-Takeshita N, Purcell CM, Chabot CL, Craig MT, Paterson CN, Hyde JR, et al. A tale of three tails: cryptic speciation in a globally distributed marine fish of the genus Seriola. Copeia. (2015) 103:357–68. doi: 10.1643/CI-124-224
105. Toews DPL, Brelsford A. The biogeography of mitochondrial and nuclear discordance in animals. Mol Ecol. (2012) 21:3907–30. doi: 10.1111/j.1365-294X.2012.05664.x
106. Brito PH, Edwards SV. Multilocus phylogeography and phylogenetics using sequence-based markers. Genetica. (2009) 135:439–55. doi: 10.1007/s10709-008-9293-3
107. Cunha RL, Robalo JI, Francisco SM, Farias I, Castilho R, Figueiredo I, et al. Genomics goes deeper in fisheries science: the case of the blackspot seabream (Pagellus bogaraveo) in the northeast Atlantic. Fish Res. (2024) 270:1–14. doi: 10.1016/j.fishres.2023.106891
108. DeFaveri J, Viitaniemi H, Leder E, Merilä J. Characterizing genic and nongenic molecular markers: comparison of microsatellites and SNPs. Mol Ecol Resour. (2013) 13:377–92. doi: 10.1111/1755-0998.12071
109. Zimmerman SJ, Aldridge CL, Oyler-Mccance SJ. An empirical comparison of population genetic analyses using microsatellite and SNP data for a species of conservation concern. BMC Genomics. (2020) 21:1–16. doi: 10.1186/s12864-020-06783-9
110. Savolainen O, Lascoux M, Merilä J. Ecological genomics of local adaptation. Nat Rev Genetics. (2013) 14:11. doi: 10.1038/nrg3522
111. Feng XJ, Jiang GF, Fan Z. Identification of outliers in a genomic scan for selection along environmental gradients in the bamboo locust, Ceracris kiangsu. Sci Rep. (2015) 5:758. doi: 10.1038/srep13758
112. Bethoux JP, Gentili B, Raunet J, Tailliez D. Warming trend in the western Mediterranean deep water. Nature. (1990) 347:660–2. doi: 10.1038/347660a0
Keywords: Population genomics, pelagic fish, ddRAD sequencing, genetic structure, outliers
Citation: Katirtzoglou A, Tsaparis D, Kolios E, Magoulas A, Mylonas CC, Fakriadis I, Manousaki T and Tsigenopoulos CS (2024) Population genomic analysis of the greater amberjack (Seriola dumerili) in the Mediterranean and the Northeast Atlantic, based on SNPs, microsatellites, and mitochondrial DNA sequences. Front. Fish Sci. 2:1356313. doi: 10.3389/frish.2024.1356313
Received: 15 December 2023; Accepted: 15 February 2024;
Published: 07 March 2024.
Edited by:
Athanasios Exadactylos, University of Thessaly, GreeceReviewed by:
Gaetano Catanese, Government of the Balearic Islands, SpainChristos Palaiokostas, Swedish University of Agricultural Sciences, Sweden
Ioannis A. Giantsis, Aristotle University of Thessaloniki, Greece
Copyright © 2024 Katirtzoglou, Tsaparis, Kolios, Magoulas, Mylonas, Fakriadis, Manousaki and Tsigenopoulos. This is an open-access article distributed under the terms of the Creative Commons Attribution License (CC BY). The use, distribution or reproduction in other forums is permitted, provided the original author(s) and the copyright owner(s) are credited and that the original publication in this journal is cited, in accordance with accepted academic practice. No use, distribution or reproduction is permitted which does not comply with these terms.
*Correspondence: Aikaterini Katirtzoglou, YWthdGlydHpvZ2xveUBnbWFpbC5jb20=; Dimitris Tsaparis, dHNhcGFyaXNAaGNtci5ncg==; Costas S. Tsigenopoulos, dHNpZ2Vub0BoY21yLmdy
†These authors have contributed equally to this work and share first authorship