 Meaghan L. Rourke1,2*
 Matt K. Broadhurst3,4
 Ashley M. Fowler5
 Julian M. Hughes5
 Joseph D. DiBattista6,7
 Elise M. Furlan8
- 1Department of Primary Industries, Narrandera Fisheries Centre, Narrandera, NSW, Australia
- 2Gulbali Institute for Agriculture, Water, and Environment, Charles Sturt University, Albury, NSW, Australia
- 3Fisheries Conservation Technology Unit, NSW Department of Primary Industries, National Marine Science Centre, Southern Cross University, Coffs Harbour, NSW, Australia
- 4School of the Environment, The University of Queensland, Brisbane, QLD, Australia
- 5New South Wales Department of Primary Industries, Sydney Institute of Marine Science, Mosman, NSW, Australia
- 6School of Environment and Science, Griffith University, Southport, QLD, Australia
- 7Australian Museum Research Institute, Australian Museum, Sydney, NSW, Australia
- 8Centre for Conservation Ecology and Genomics, Institute for Applied Ecology, University of Canberra, University Drive, Bruce, ACT, Australia
In response to the need to augment electrofishing surveys of golden perch, Macquaria ambigua (an important endemic freshwater fish in southeastern Australia), with other non-lethal survey methods, the utility of environmental DNA (eDNA) as an index of relative fish abundance/biomass was investigated. From three adjacent rivers, five sites in each were sampled for eDNA immediately before electrofishing during sequential years. Up to six individuals or 10 kg of electrofished golden perch (200–548 mm total length) were caught or observed site−1. Analyses of concurrent eDNA concentrations revealed no significant relationship with the relative abundance of golden perch, but there was with relative biomass—manifesting as increasing eDNA concentrations between 1.1 and approximately 5.5 kg biomass site−1, after which concentrations stabilized at greater biomasses. Future research warrants assessing the viability of sampling eDNA for spatio-temporally monitoring rivers where low biomasses of golden perch (1–5 kg site−1) are likely to occur.
Introduction
Globally, river regulation frequently impedes some teleosts from completing vital life-history movements and so it poses challenges for managing freshwater ecosystems (1, 2). Disrupted river flows fragment populations and/or increase vulnerability to genetic repercussions of diminished population size and can ultimately lead to local extinctions (3). Quantifying population sizes within rivers is therefore essential for prioritizing management strategies but requires careful consideration of methods to minimize impacts while remaining cost-effective, robust, and reliable (4).
Traditional, non-lethal fishery-independent freshwater monitoring often incorporates electrofishing, which involves administering a regulated electrical charge to the water and stunning fish before censusing and releasing them (5). Although useful, electrofishing is expensive and labor-intensive and requires highly trained staff. The method is also
relatively invasive with sub-lethal effects on some species (6). A newer, more benign survey method involves monitoring concentrations of DNA shed into the environment by aquatic organisms (termed ‘eDNA') as an index of their relative abundance/biomass (7). Many recent studies have identified useful correlations between abundance/biomass and eDNA concentrations (but not always; e.g., (8, 9)). However, relationships are often stronger in controlled, rather than natural environments—owing to the influence of confounding biotic and abiotic variables among the latter and difficulties with estimating absolute population sizes using conventional methods (10). Such variability supports ongoing species-specific field-based studies to determine if eDNA concentrations may be useful for monitoring spatio-temporal changes in population sizes (11).
One large system of regulated rivers in Australia where native fish populations are censused by electrofishing is the Murray–Darling Basin (MDB). Modified river flows, along with other anthropogenic impacts, have resulted in population declines among various endemic species, including golden perch, Maquaria ambigua, a large-bodied (up to 23 kg and 76 cm total length (TL)) (12) recreationally important freshwater species. Golden perch have a complex life history that encompasses large spatial scales (often >1000 km) and is closely linked to river hydrology (13, 14).
As a result, golden perch are highly susceptible to river regulation (12). Nevertheless, owing to both natural recruitment and management, including restocking, the abundance of golden perch in the MDB has increased over recent decades (15). Ongoing population monitoring is required to assess future stocks and prioritize management.
In the absence of commercial fishing or regular angler surveys, assessing golden perch stock status in the MBD has relied on annual electrofishing. There is growing interest from scientists and managers to determine if eDNA could be an alternative or complementary tool for monitoring spatio-temporal changes in populations. Considering the above, the aim of this study was to investigate the extent to which the relative abundance and/or biomass of golden perch estimated using electrofishing in three river systems over two years was correlated with eDNA concentrations in concurrent water samples. This information was then used to propose future sampling strategies.
Methods
A genetic assay was developed to amplify a fragment of the mitochondrial 12S ribosomal RNA (hereafter 12S rRNA) of golden perch (see Supplementary material). Water-sample collection for eDNA was done between 1 March and 14 May 2021 and between 28 February and 11 May 2022 and was followed by boat-based electrofishing at 15 pre-determined sites in the southern MDB. The sites were distributed throughout the Lachlan (n = 5), Murrumbidgee (n = 5), and Wakool rivers (n = 5) and have formed the basis of annual government electrofishing surveys since 2016 (Figures 1A–E). Each site was a 200-m-long stretch of river transect, comprising eight 50-m-long ‘cells,' numbered with the first site farthest downstream (Figure 1F). Ninety seconds of electrofishing was carried out in each cell using a 7.5 GPP Smith-Root electrofishing unit. The electrofishing units were adjusted depending on conductivity at each site with a direct current (DC) of 500 or 1,000 V, 120 Hz, a duty cycle of 10−40%, and 4.5–9.8 A applied (see Supplementary material). Key water quality parameters were recorded at each site using an Aqua TROLL 500 sonde.
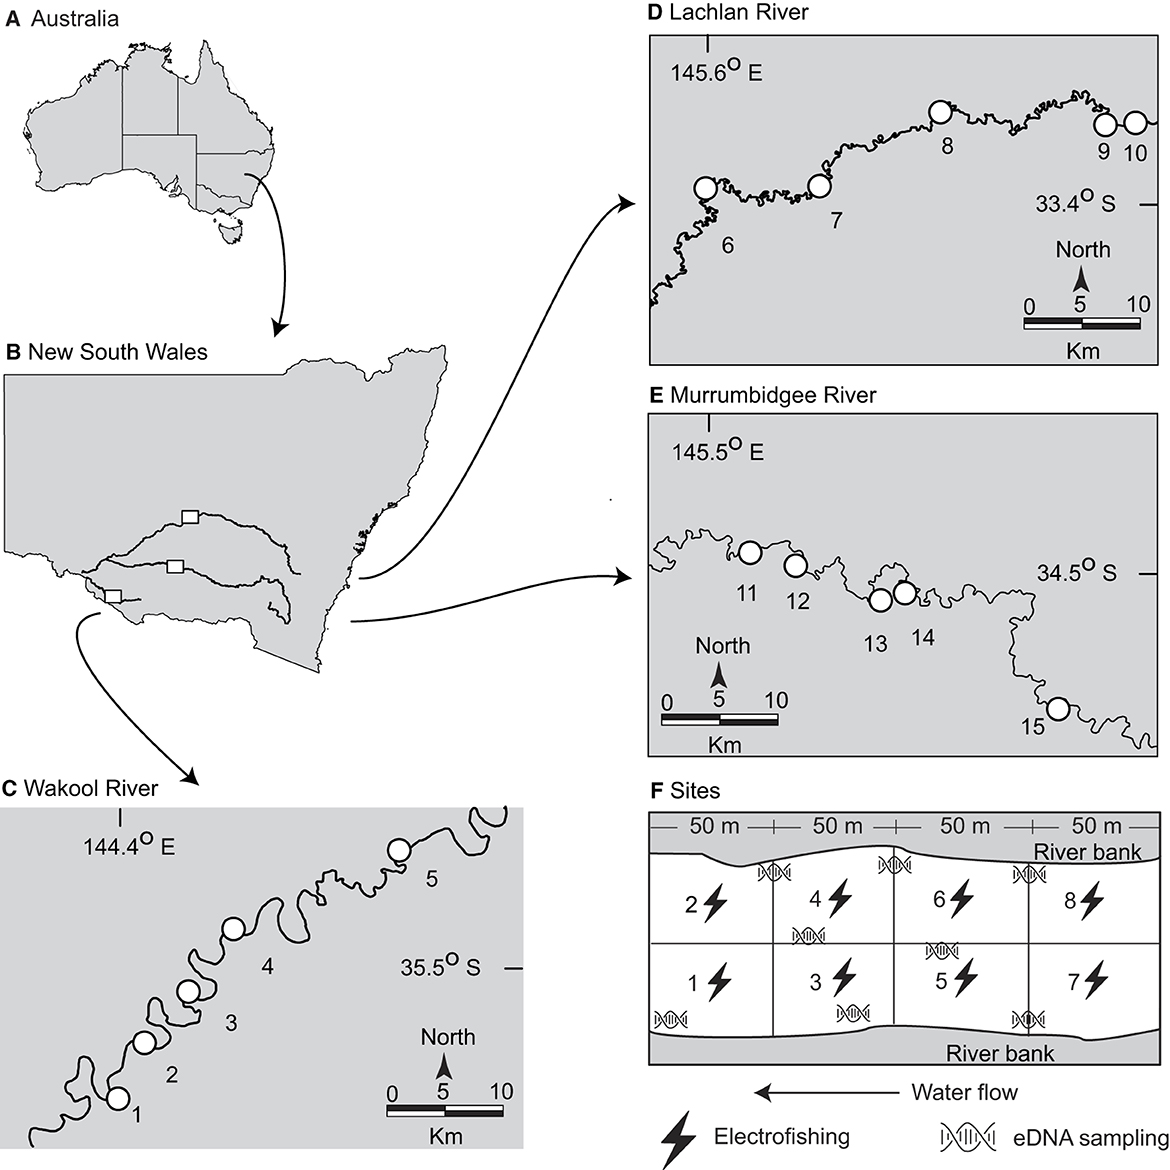
Figure 1. Maps of (A) Australia and (B) New South Wales showing the electrofishing and environmental DNA sampling sites for golden perch (Macquaria ambigua) in the (C) Wakool, (D) Lachlan and (E) Murrumbidgee Rivers, and (F) diagrammatic representation of the sampled cells at each site (which were all sampled twice: once in autumn 2021 and once in autumn 2022).
At each site, the boat was typically launched adjacent to the first cell or allowed to drift downstream to the first cell to avoid liberating DNA that may have accumulated in the sediment. Eight replicate surface-water samples (three from each bank and two moving in a transect upstream from the center of the river (i.e., evenly distributed throughout the 200-m transect; Figure 1F)) were collected with a target volume of 2.0 l using a Smith Root eDNA Sampler (Smith-Root). The filter rate was set at 1.0 l min−1 with a maximum pressure of 69 kpa using 5-μm polyethersulfone self-preserving filters (Smith-Root; (16)). An equipment control (EC) comprising 1.0 L of sterile water was filtered at each site before field sampling.
Immediately following water sample collection, electrofishing was conducted across the entire 200-m reach, positioned within each 50-m cell and beginning at cell 1 (Figure 1F). At each cell, any inert fish displaced to the surface were removed (defined as ‘caught') and held in an aerated live well for up to 10 min before being measured (to the nearest 1 mm TL), weighed (to the nearest 1 g), and released well downstream of the next upstream cell. Any golden perch displaced to the surface but not retrieved were recorded as ‘observed'. The weights of these latter fish were estimated as the averages caught at the site. The total caught and observed weights from cells 1–8 were used as the biomass estimate for each site. The abundance included the observed number of fish.
The DNA was extracted from water samples following conventional procedures, which are described in the Supplementary material. To remove potential inhibitors, all samples were cleaned using a Zymo OneStep PCR Inhibitor Removal Kit (Integrated Sciences) following the manufacturer's instructions. The samples were evaluated for residual polymerase chain reaction (PCR) inhibition (see Supplementary material) and, if present, DNA concentrations were evaluated using 1:10 diluted DNA or (if no apparent inhibition) using neat DNA. Six replicate multiplex quantitative PCR (qPCR) reactions were performed sample−1 using a standard curve generated from a dilution series of gBlock™ standards with seven concentrations between 10−2 and 10−8 ng μl−1, as well as low copy number standards (10, 5, 2, and 1 copies μl−1; see the Supplementary material). The concentrations were then multiplied by 50 (for neat DNA) or 500 (for 1:10 DNA) to calculate the quantity (ng) of DNA filter−1. The amount of DNA l−1 of water was determined by dividing the quantity of DNA filter−1 by the volume of water filtered. The concentration of DNA in copies reaction−1 was calculated from the concentration in ng l−1 (see Supplementary material).
Data analyses
The analyzed data comprised the concentration of golden perch DNA for each of the eight filters at each site (ng filter l−1) and their observed abundance (no. site−1) and total biomass (kg site−1) at the site level. Any null data for eDNA and fish abundance or biomass were removed but noted. All remaining data were log-transformed to act multiplicatively, and the relationships between eDNA concentrations (ng 1−1 as the response variable) and abundance and biomass (fixed effects) were initially plotted. Biomasses <1 kg were subsequently removed from analyses because these data (which were very few; see the ‘Results’ section) created an artificial change in the slope compared to those values ≥1 when log-transformed. The remaining log-transformed data were explored using linear mixed models (LMM). Random effects included ‘years,' ‘rivers,' and ‘sites' with sites nested within rivers. Models were fitted within glmmTMB (v. 1.1.7) in R using penalized quasi-likelihood and with model checking (i.e., over-dispersion) and diagnostics (residual plots; (17, 18)). Because both regressions appeared curvilinear, a quadratic term was included to improve model fit and compared against the linear model via the Akaike information criterion (AIC). Marginal and conditional r2s were estimated using the function r.squaredGLMM in the MuMIn package (v. 1.47.5) (19).
Results
The water-quality parameters varied considerably between and within rivers, with variability broadly increasing with water flow, which was always greatest in the Murrumbidgee River (Table 1). Furthermore, owing to excessive regional rainfall, the flow was greater across all rivers in 2022 than in 2021 (an average of 4,304 vs. 986 Ml d−1). Water sampling (0.44–1.90 l of filtering) and electrofishing were successfully completed for all sites during both years, with a total of 30 golden perch (200–504 mm TL) caught and weighed (12–2588 g) and 7 observed (Table 1). At least one golden perch was captured or observed at each site, except for sites 1 and 2 (in the Wakool River), and all but five were >1 kg (Table 1, Figure 2).
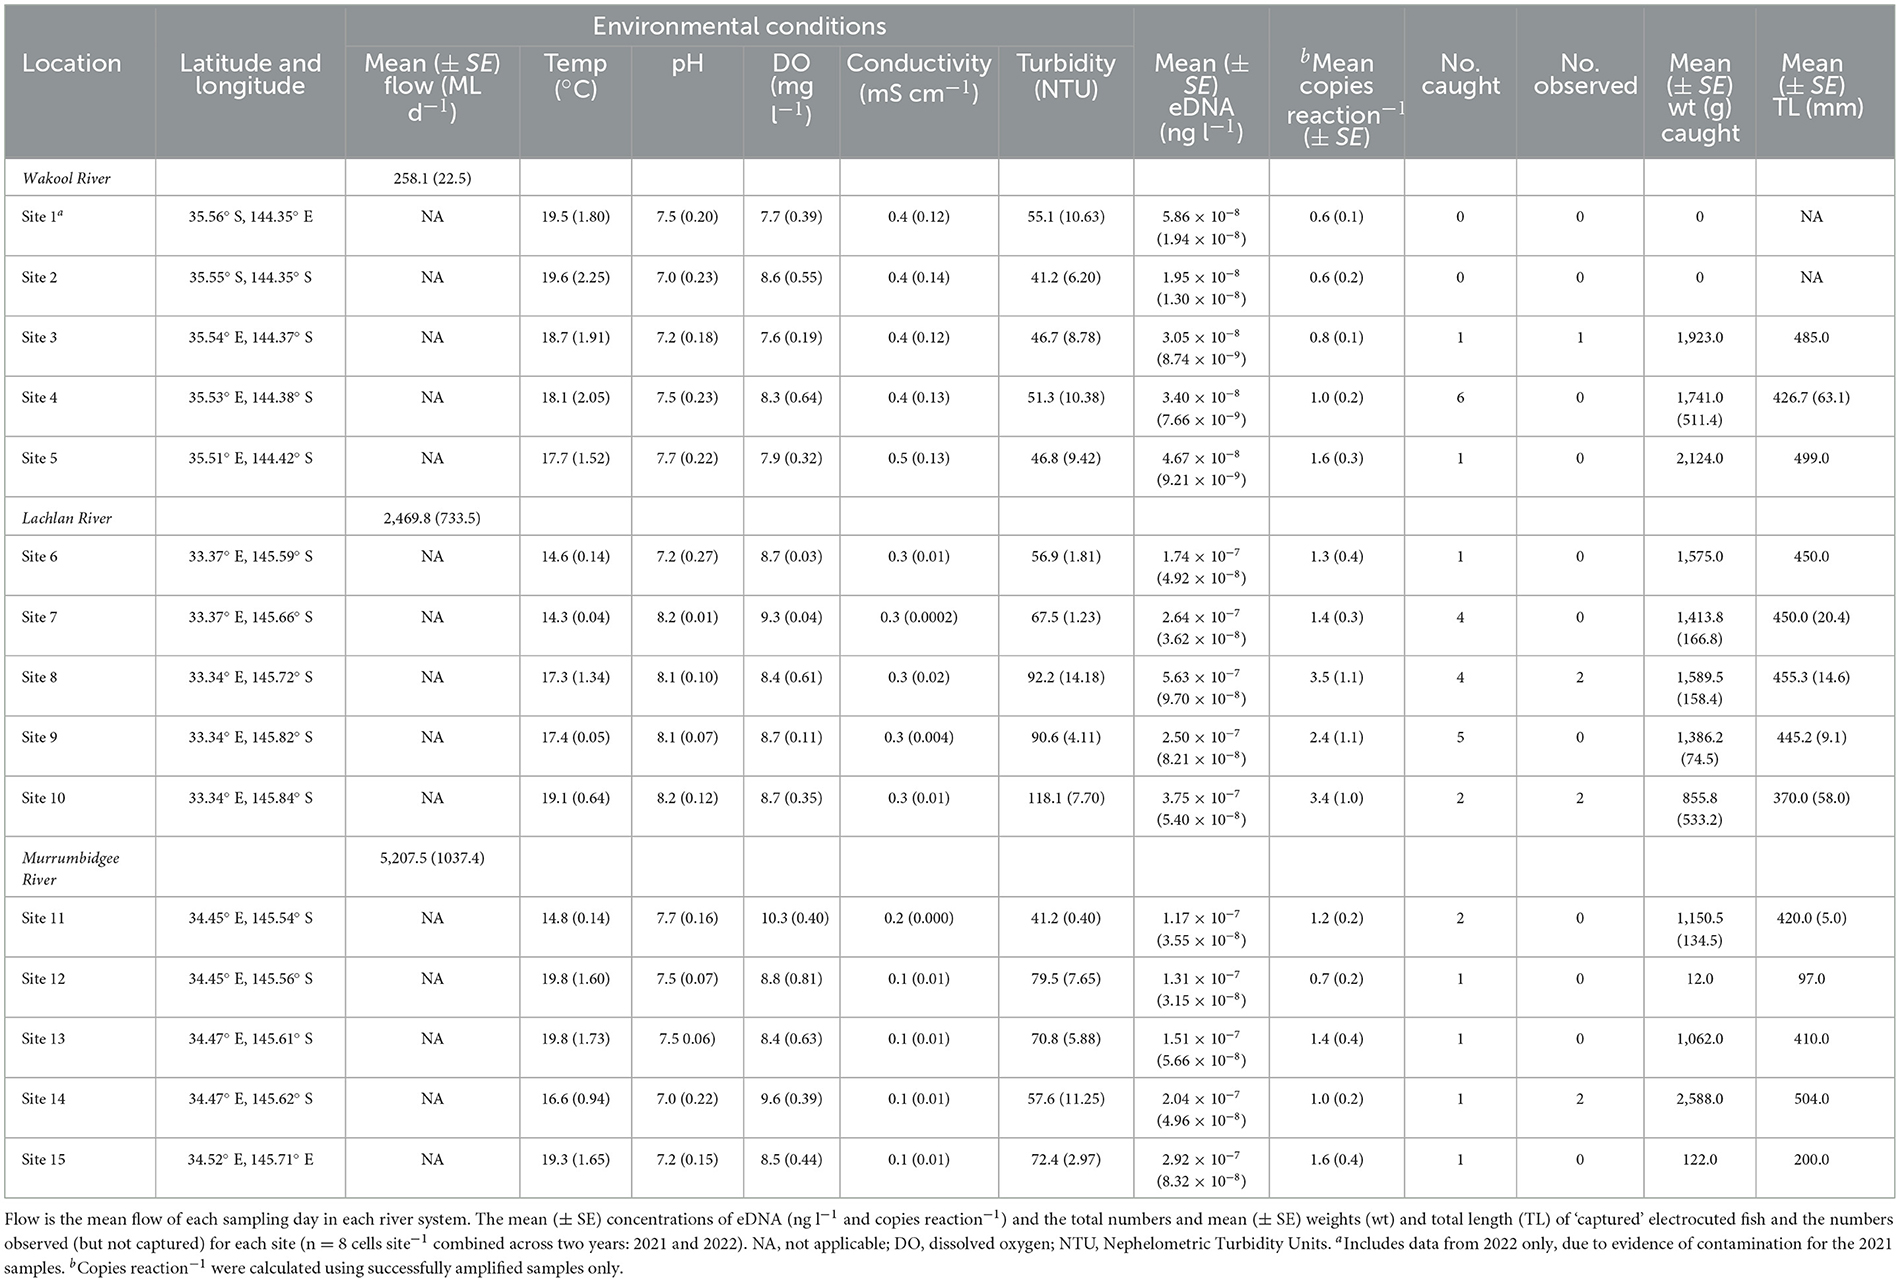
Table 1. The rivers and sites and their environmental conditions (mean ± SE where indicated) were sampled for golden perch, Macquaria ambigua, eDNA prior to electrofishing.
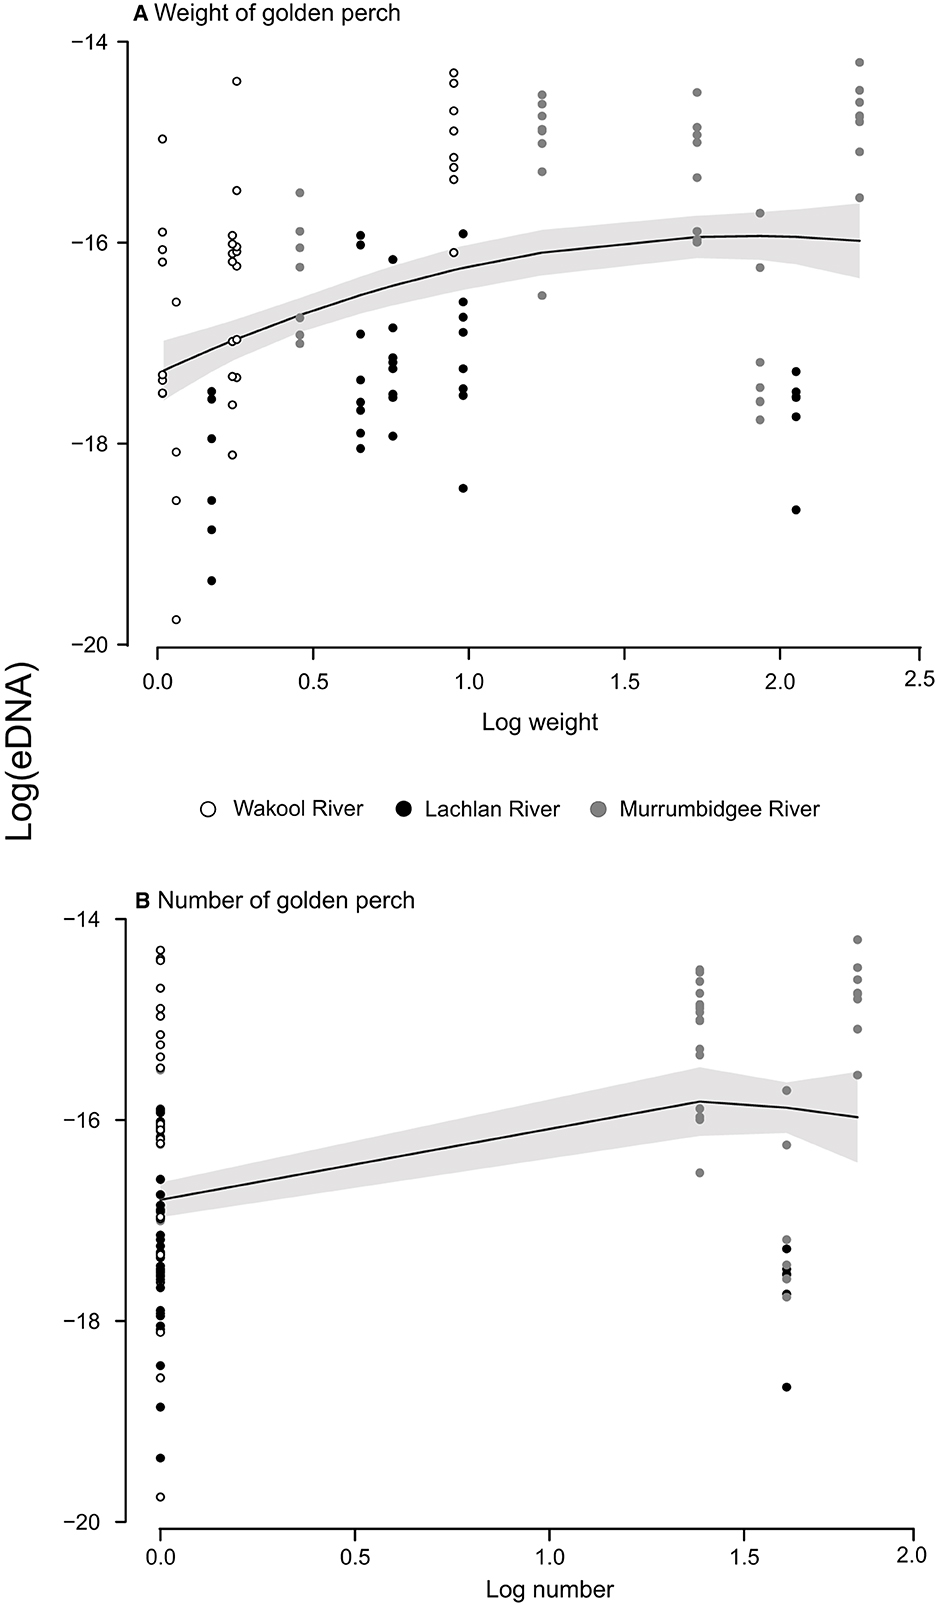
Figure 2. Relationships between the log eDNA concentrations (ng l−1) and log (A) biomass (kg) and (B) numbers of golden perch (Macquaria ambigua) at 15 sites across three river systems, during two years in the southern Murray–Darling Basin, Australia. Some weights were estimated (for fish observed but not caught), and abundances included fish caught and observed. Both axes are on the log scale.
Species-specific primers and a hydrolysis probe (TaqMan®) were successfully designed to amplify 200 base pairs (bp) of the 12S rRNA gene (see Supplementary material). A synthetic oligonucleotide (gBlock™) based on the golden perch 12S rRNA gene was designed with an 8-bp reverse complement sequence for use as the positive control on every qPCR plate (see Supplementary material). The 8-bp reverse complement sequence facilitated detecting of false positives due to contaminating gBlock™. Testing of the assay on genomic DNA from co-distributed species in the same family failed to amplify, indicating the assay was specific to golden perch (see Supplementary material). The assay efficiency was 96.7% (R2 = 0.99, the limit of detection (LoD) (lowest standard with at least 95% positive detection) was 4 copies reaction−1 and the limit of quantification (LoQ) (with coefficient of variation (CV) threshold set at 35%) was modeled at 5 copies reaction−1 (see Supplementary material).
Of 240 samples (DNA extracts), 171 were partially inhibited following purification (71%). These samples were diluted to 1:10 for subsequent qPCR. A further four samples (all from different sites) exhibited complete inhibition and were not included in subsequent qPCRs (1.7%). Of the remaining 236 samples, golden perch DNA was detected in 220 samples (i.e., in at least 1 of 6 qPCR replicates sample−1) and at every site during both years (Table 1). The eDNA data from site 1 in 2021 were discarded due to endogenous DNA and golden perch DNA in the EC, indicating contamination had occurred during sampling. All other positive and negative controls exhibited strong or null amplification, respectively, indicating no issues with the laboratory methods. There was an average of 0.6–3.5 copies reaction−1 across the 15 sites (Table 1). These concentrations were below the LoQ and resulted from diluting the DNA extracts to overcome inhibition, which may affect the precision of concentration estimates. Despite this uncertainty, we are confident that the number of technical replicates increased the accuracy of the concentration estimates.
Overall, the agreement between eDNA and electrofishing, with respect to mutual detections across sites, was 42%. However, the agreement in 2021 was considerably higher (56%) than the agreement in 2022 (28%). Given that golden perch eDNA was detected at all sites in all years, mismatches were driven by zero values obtained from electrofishing, with more non-detections during 2022, particularly in the Lachlan River.
The LMMs investigating the relationships between DNA concentrations and the abundance and biomass of electrofished golden perch across the three rivers were improved when a quadratic term was fitted (AIC abundance: linear = 293.97, quadratic: = 288.03; AIC biomass: linear = 143.30, quadratic: = 134.34). There was a significant relationship between eDNA and estimated biomass, which was positive between approximately 1.1 and 5.5 kg, after which there were consistent eDNA concentrations to 10.3 kg (LMM p < 0.01; Figure 2A). Model comparison using AIC supported all random effects in the model, which explained 77% of the variance (Table 2). The fixed effect of biomass in this model explained 23% of the variance in the eDNA concentration. A comparison of marginal and conditional r2s within and between models indicated that for random effects, rivers explained the greatest variance, followed by sites and then years (Table 2). The relationship between eDNA and abundance was not significant (LMM p > 0.05; Figure 2B).
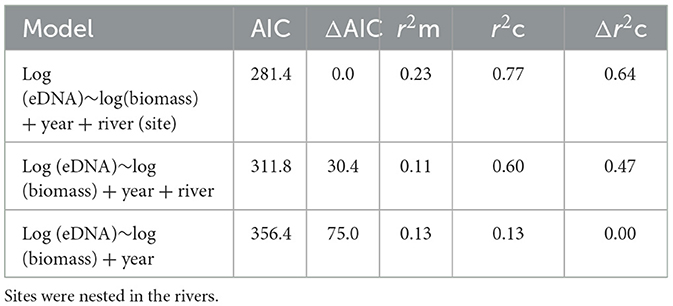
Table 2. Akaike's information criterion (AIC), marginal r-squared (r2m), and conditional r-squared (r2c) values for models with differing random structures (years, rivers, and sites).
Discussion
The significant relationship detected between the eDNA concentration of golden perch in water samples and their electrofished biomass supports a trend in the literature describing the utility of eDNA for non-lethal aquatic monitoring—although the lack of significance for abundance also reiterates the need for species-specific verification of the approach—which might be best done under controlled conditions, quantifying individual variability in DNA shedding followed by degradation (7, 20). Nevertheless, the data support using eDNA to assess golden perch biomass, albeit with some caveats that warrant consideration.
It is important to reiterate that in this study neither eDNA nor electrofishing provided estimates of absolute abundance. Rather, our focus was a comparative analysis of these two approaches for providing indices of relative quantities and was similar in theme to studies comparing traditional active (trawls and seines) or passive (hooks, traps, and gillnets) fishing gears (e.g., (21, 22)). Ultimately, such comparisons can help ascertain whether alternative methods offer statistically equivalent abundance/biomass indices and might be preferred because of not only lower operational costs but also logistical benefits. Implicit within the latter is an adequate understanding of the limitations of each method.
Both eDNA and electrofishing are affected by various biotic and abiotic factors, including river flow and temperature, which have been discussed in detail elsewhere (e.g., (7, 23, 24)). Here, river flow was not only variable among the three rivers but was also much greater across all rivers in 2022 than in 2021. Golden perch have lower electrofishing capture probabilities when daily flow increases and among individuals approximately <400 mm TL (23). Possibly, electrofishing capture probability was reduced during 2022, especially in the Murrumbidgee River, due to higher flow, deeper water, and increased turbidity following flooding and/or was affected by the relatively large proportion of small fish. Certainly, there was a lower rate of detecting golden perch by electrofishing than via eDNA in 2022. Nevertheless, water flow can also reduce eDNA concentrations and thus detectability (25), which could impact defining relationships with abundance and/or biomass.
Environmental DNA sampling and laboratory processing also have inherent limitations. For example, the number of samples site−1 required to accurately estimate mean concentrations in this system was unknown a priori. Based on findings from other eDNA studies focused on the species-specific detection of fish in the MDB and to maximize precision, we collected eight samples site−1 (26, 27). Given golden perch DNA was noted in approximately 93% of our filters, it is likely our sampling strategy was adequate to collect sufficient DNA. Furthermore, we assessed every sample for partial inhibition following inhibitor removal and subsequently used either neat or diluted DNA to compensate for the remaining partial inhibition, providing confidence the eDNA concentration estimates were accurate.
Notably, the partial inhibition did not preclude amplification of the endogenous control and its presence would have gone undetected without a comprehensive assessment of all samples. The potential ramifications of partial inhibition on the outcomes of future studies are considerable, potentially leading to a delay in the amplification of the target DNA and uncertain quantification (28). Therefore, it remains crucial for studies assessing eDNA concentrations to address inhibition concerns to ensure the accuracy of results. Additionally, other extraction methods or inhibitor-resistant PCR reagents could be trialed (29, 30), but these are not a panacea. Nonetheless, we suggest checking for low levels of inhibition before commencing qPCR analysis, particularly in embedded riverine ecosystems.
Regardless of the specific influences of any intrinsic and extrinsic factors, collectively, these were encompassed within the observed quadratic relationship between eDNA and electrofishing. This asymptotic relationship deviates from patterns observed in many similar studies comparing eDNA concentration to biomass, where simple linear relationships have been reported, although competing model fits are often not described. Nevertheless, the quadratic relationship reported here is similar to that reported for silver carp, Hypophthalmichthys molitrix, in a large river, assessed using eDNA and an acoustic survey (31), and may be influenced by various factors, including, but not limited to, water temperature or flow (discussed earlier), eDNA production, or degradation (7). Deciphering the importance of potentially influencing abiotic or biotic factors warrants future investigation.
Despite the challenges posed by variability within biotic and abiotic factors and processing considerations, and although the data are few, we nevertheless identified a statistically useful relationship between eDNA concentration and biomasses ranging between 1.1 and approximately 5.5 kg per site−1. This result justifies ongoing research to better describe the observed relationship and any important factors affecting variability. Such work might involve additional eDNA sampling concurrent to ongoing electrofishing assessments and would ultimately help inform appropriate future monitoring strategies for golden perch.
Data availability statement
The raw data supporting the conclusions of this article will be made available by the authors, without undue reservation.
Ethics statement
The animal study was approved by the Fisheries Animal Care and Ethics Committee, Department of Regional New South Wales. The study was conducted in accordance with the local legislation and institutional requirements.
Author contributions
MR: Writing – original draft, Writing – review & editing. MB: Writing – original draft, Writing – review & editing. AF: Writing – original draft, Writing – review & editing. JH: Writing – review & editing. JD: Writing – review & editing. EF: Writing – review & editing.
Funding
The author(s) declare that financial support was received for the research, authorship, and/or publication of this article. This research was funded by the New South Department of Primary Industries (DPI) and the Fisheries Research and Development Corporation (project no. 2019-016) on behalf of the Australian Government.
Acknowledgments
We thank the Commonwealth Environmental Water Office for access to electrofishing data for the three river systems collected under their “long-term intervention monitoring” project. We also thank Jason Thiem for accommodating eDNA sampling alongside his electrofishing sampling and for providing valuable comments on the manuscript, and Jackson Wilkes Walburn, Rohan Rehwinkel, Duncan McLay, Tim McGarry, Ben Edwards, Golam Sarwer, and Bec Dennis for field and laboratory work. We are grateful to three reviewers for their insightful comments, which substantially improved the quality of the manuscript.
Conflict of interest
This study received funding from the Fisheries Research and Development Corporation. The funder was not involved in the study design, collection, analyses, interpretation of data, the writing of this article or the decision to submit it for publication. All authors declare no other competing interests.
Publisher's note
All claims expressed in this article are solely those of the authors and do not necessarily represent those of their affiliated organizations, or those of the publisher, the editors and the reviewers. Any product that may be evaluated in this article, or claim that may be made by its manufacturer, is not guaranteed or endorsed by the publisher.
Supplementary material
The Supplementary Material for this article can be found online at: https://www.frontiersin.org/articles/10.3389/frish.2024.1358572/full#supplementary-material
References
1. Humphries P, Serafini LG, King AJ. River regulation and fish larvae: variation through space and time. Freshw Biol. (2002) 47:1307–31. doi: 10.1046/j.1365-2427.2002.00871.x
2. Murchie KJ, Hair KPE, Pullen CE, Redpath TD, Stephens HR, Cooke SJ. Fish response to modified flow regimes in regulated rivers: research methods, effects and opportunities. Riv Res App. (2008) 24:197–217. doi: 10.1002/rra.1058
3. Brauer CJ, Beheregaray LB. Recent and rapid anthropogenic habitat fragmentation increases extinction risk for freshwater biodiversity. Evol Appl. (2020) 13:2857–69. doi: 10.1111/eva.13128
4. Cooke SJ, Martins EG, Struthers DP, Gutowsky LFG, Power M, Doka SE, et al. A moving target—incorporating knowledge of the spatial ecology of fish into the assessment and management of freshwater fish populations. Env Mon Assess. (2016) 188:239. doi: 10.1007/s10661-016-5228-0
5. Reynolds J. Electrofishing. In:B Murphy, D Willis, , editors. Fisheries Techniques, 2nd Edn. New York, NY: American Fisheries Society.
6. Snyder DE. Invited overview: conclusions from a review of electrofishing and its harmful effects on fish. Rev Fish Biol Fish. (2003) 13:445–53. doi: 10.1007/s11160-004-1095-9
7. Rourke ML, Fowler AM, Hughes JM, Broadhurst MK, DiBattista JD, Fielder S, et al. Environmental DNA (eDNA) as a tool for assessing fish biomass: A review of approaches and future considerations for resource surveys. Env DNA. (2022) 4:9–33. doi: 10.1002/edn3.185
8. Hinlo R, Lintermans M, Gleeson D, Broadhurst B, Furlan E. Performance of eDNA assays to detect and quantify an elusive benthic fish in upland streams. Biol Invasions. (2018) 20:3079–93. doi: 10.1007/s10530-018-1760-x
9. Rourke ML, Wilkes Walburn J, Broadhurst MK, Fowler AM, Hughes JM, Furlan EM, DiBattista JD. Poor utility of environmental DNA for estimating the biomass of a threatened freshwater teleost; but clear direction for future candidate assessments. Fish Res. (2023) 258:106545. doi: 10.1016/j.fishres.2022.106545
10. Yates MC, Fraser DJ, Derry AM. Meta-analysis supports further refinement of eDNA for monitoring aquatic species-specific abundance in nature. Env DNA. (2019) 1:5–13. doi: 10.1002/edn3.7
11. Beng KC, Corlett RT. Applications of environmental DNA (eDNA) in ecology and conservation: opportunities, challenges and prospects. Biodivers Conserv. (2020) 29:2089–121. doi: 10.1007/s10531-020-01980-0
12. Koehn JD, Raymond SM, Stuart I, Todd CR, Balcombe SR, Zampatti BP, et al. A compendium of ecological knowledge for restoration of freshwater fishes in Australia's Murray–Darling Basin. Mar Freshw Res. (2020) 71:1391–463. doi: 10.1071/MF20127
13. Reynolds LF. Migration patterns of five fish species in the Murray-Darling River System. Aust J Mar Freshw Res. (1983) 34:857–71. doi: 10.1071/MF9830857
14. Stuart IG, Sharpe CP. Riverine spawning, long distance larval drift, and floodplain recruitment of a pelagophilic fish: a case study of golden perch (Macquaria ambigua) in the arid Darling River, Australia. Aquat Conserv: Mar Freshwat Ecosyst. (2020) 30:675–90. doi: 10.1002/aqc.3311
15. Crook DA, Schilling HT, Gilligan DM, Asmus M, Boys CA, Butler GL, et al. Multi-decadal trends in large-bodied fish populations in the New South Wales Murray–Darling Basin, Australia. Mar Freshw Res. (2023) 74:899–916. doi: 10.1071/MF23046
16. Thomas AC, Nguyen PL, Howard J, Goldberg CS. A self-preserving, partially biodegradable eDNA filter. MethEcol E. (2019) 10:1136–41. doi: 10.1111/2041-210X.13212
17. Brooks ME, Kristensen K, van Benthem KJ, Magnusson A, Berg CW, Nielsen A, et al. “glmmTMB balances speed and flexibility among packages for zero-inflated generalized linear mixed modeling.” The R J. (2017) 9:378–400. doi: 10.32614/RJ-2017-066
18. R Core Team. R: A Language and Environment for Statistical Computing. Vienna: R Foundation for Statistical Computing (2022).
20. Benoit NP, Robinson KM, Kellogg CTE, Lemay MA, Hunt BPV. Using qPCR of environmental DNA (eDNA) to estimate the biomass of juvenile Pacific salmon (Oncorhynchus spp.). Environ DNA. (2023) 5:683–96. doi: 10.1002/edn3.422
21. Gray CA, Jones MV, Rotherham D, Broadhurst MK, Johnson DD, Barnes LM, et al. Utility and efficiency of multi-mesh gill nets and trammel nets for sampling assemblages and populations of estuarine fish. Mar Freshw Res. (2005) 56:1077–88. doi: 10.1071/MF05056
22. Bies JM, Fox CN, Neal JW. Comparison of electrofishing and gill nets for sampling cichlid species. N Am J Fish Man. (2016) 36:975–81. doi: 10.1080/02755947.2016.1184203
23. Lyon JP, Bird T, Nicol S, Kearns J, O'Mahony J, Todd CR, et al. Efficiency of electrofishing in turbid lowland rivers: implications for measuring temporal change in fish populations. Can J Fish Aquat Sci. (2014) 71:878–886. doi: 10.1139/cjfas-2013-0287
24. Fernandez S, Gutiérrez Á, Deconinck D, Martinez JL, Alvarez A, Marquez I, et al. Biomass quantification of the critically endangered European eel from running waters using environmental DNA. Fishes. (2023) 8:279. doi: 10.3390/fishes8060279
25. Curtis AN, Tiemann JS, Douglass SA, Davis MA, Larson ER. High stream flows dilute environmental DNA (eDNA) concentrations and reduce detectability. Div Dist. (2021) 27:1918–31. doi: 10.1111/ddi.13196
26. Bylemans J, Furlan EM, Pearce L, Daly T, Gleeson DM. Improving the containment of a freshwater invader using environmental DNA (eDNA) based monitoring. Bio. Inv. (2016) 18:3081–9. doi: 10.1007/s10530-016-1203-5
27. Furlan EM, Gleeson D. Improving reliability in environmental DNA detection surveys through enhanced quality control. Mar Freshw Res. (2016) 68:388–95. doi: 10.1071/MF15349
28. Pruvost M, Geigl EM. Real-time quantitative PCR to assess the authenticity of ancient DNA amplification. J Arch Sci. (2004) 31:1191–7. doi: 10.1016/j.jas.2002.05.002
29. Uchii K, Doi H, Okahashi T, Katano I, Yamanaka H, Sakata MK, et al. Comparison of inhibition resistance among PCR reagents for detection and quantification of environmental DNA. Env DNA. (2019) 1:359–67. doi: 10.1002/edn3.37
30. Pearman JK, Keeley NB, Wood SA, Laroche O, Zaiko A, Thomson-Laing G, et al. Comparing sediment DNA extraction methods for assessing organic enrichment associated with marine aquaculture. PeerJ. (2020) 8:e10231. doi: 10.7717/peerj.10231
Keywords: aquatic, biomonitoring, fishery-independent survey, freshwater, Murray–Darling Basin, Percichthyidae
Citation: Rourke ML, Broadhurst MK, Fowler AM, Hughes JM, DiBattista JD and Furlan EM (2024) Correlated environmental DNA and electrofished estimates of relative biomass for golden perch, Macquaria ambigua. Front. Fish Sci. 2:1358572. doi: 10.3389/frish.2024.1358572
Received: 20 December 2023; Accepted: 19 February 2024;
Published: 12 March 2024.
Edited by:
Géraldine Lassalle, Institut National de recherche pour l'agriculture, l'alimentation et l'environnement (INRAE), FranceReviewed by:
Eric Larson, University of Illinois at Urbana-Champaign, United StatesNicolas Iacaruso, University of Illinois at Urbana-Champaign, United States in collaboration with reviewer EL
Göran Sundblad, Swedish University of Agricultural Sciences, Sweden
Steven Weiss Joseph Weiss, University of Graz, Austria
Copyright © 2024 Rourke, Broadhurst, Fowler, Hughes, DiBattista and Furlan. This is an open-access article distributed under the terms of the Creative Commons Attribution License (CC BY). The use, distribution or reproduction in other forums is permitted, provided the original author(s) and the copyright owner(s) are credited and that the original publication in this journal is cited, in accordance with accepted academic practice. No use, distribution or reproduction is permitted which does not comply with these terms.
*Correspondence: Meaghan L. Rourke, bWVhZ2hhbi5kdW5jYW5AZHBpLm5zdy5nb3YuYXU=