 Simon Roques1†‡Lisanne Koning1‡
 Alex Bossers2,3
 Sanne van Gastelen1
 Dirkjan Schokker2
 Edoardo Zaccaria1Léon Šebek1
 Soumya K. Kar1*
- 1Department of Animal Nutrition, Wageningen Livestock Research, Wageningen, Netherlands
- 2Department of Epidemiology, Bioinformatics, Animal Models & Vaccine Development, Wageningen Bioveterinary Research, Lelystad, Netherlands
- 3Institute for Risk Assessment Sciences (IRAS), Utrecht University, Utrecht, Netherlands
Rumen microbial communities are known to drive methane (CH4) production, but their dynamics in variable “real-world” farming environments are less understood. This research aims to identify specific microbial taxa linked to CH4 emission in commercial dairy farms by employing 16S rRNA gene sequencing, thereby providing a more ecologically relevant understanding of CH4 production in real-world settings.Rumen fluid samples were collected from 212 cows across seventeen Dutch dairy farms. Methane production was measured from these dairy cows using the GreenFeed system and expressed as CH4 intensity (g fat- and protein-corrected milk yield−1). Rumen microbiota was analyzed using 16S rRNA gene amplicon sequencing. Analysis was performed to assess association between microbial taxa and CH4 intensity, using data from individual cattle across the dairy farm. We observed that diet and lactation stage influenced CH4 intensity, consistent with previous studies. Results showed higher CH4 intensity in cows during late lactation, and feeding type, particularly fresh grass intake, strongly influenced rumen microbiota. However, after classifying low and high CH4 emitting cows, only limited differences in microbiota composition could be measured. Few taxa, like Lachnospiraceae, were common across both groups, while Ruminoccocaceae and Rikenellaceae were more abundant in low emitters, and Oscillospiraceae in high emitters. Methanobrevibacter differentiated CH4 emission groups, but archaeal methanogen abundance may not accurately reflect CH4 variation due to methodological limitations, including reliance on relative abundance, limited taxonomic resolution, and primer bias. Using a bacterial-biased 16S rRNA approach, we observed a limited number of consistent bacterial taxa associated with CH4 intensity highlights the challenges of studying dairy farms under practical conditions, where variability in diet, genetics, and management practices complicates the identification of specific rumen microbes associated with CH4 emission. Even with control over key variables, the inherent variability of on-farm conditions impeded the detection of stable microbial patterns. In conclusion, our study clearly indicates that understanding CH4 emissions from dairy cattle in real-world settings fundamentally requires a broader ecological perspective where rumen microbes are recognized as key determinants influencing microbiota signals within multi-factorial farm settings.
1 Introduction
The rumen microbiome, a complex consortium of microorganisms, is integral to CH4 production. Enteric CH4 is produced during the fermentation of feed carbohydrates by microbiota in the rumen. Archaea play a major role in the production of enteric CH4 as they are the only microorganism capable of producing CH4 in the rumen (Morgavi et al., 2010). Within archaea, CH4 is produced through the reduction of CO2 and methanol, as well as a few minor substrates, with hydrogen (H2) serving as the primary electron donor (Kurth et al., 2020; Tapio et al., 2017). However, CH4 production also depends on other microbes, as the necessary substrates are produced by other microbes within the rumen (Mizrahi and Jami, 2018). Bacteria, for instance, produce H2 (e.g. Ruminococcaceae, Eubacterium spp and numerous Firmicutes) (Tapio et al., 2017) or even methanol during pectin fermentation (some Lachnospiraceae) (Li, 2021). On the opposite, some microbes consume H2 (e.g., Fibrobacter succinogenes) and compete with methanogenic archaea for H2; but to date, the uptake of H2 by methanogen is still thermodynamically more favorable (Ungerfeld, 2020).
Overall, the association between the rumen microbiome and CH4 emission is a key area of research to identify the microorganisms associated with enteric CH4 emission. The rumen microbiota is a dynamic community shaped by ecological interactions within the rumen and influenced by a range of host-related and external factors. For instance, the rumen microbiota and its association with CH4 production is shaped by factors like diet (Huws et al., 2018), genotype (Difford et al., 2018) and lactation stage of the animals (Bainbridge et al., 2016). Traditionally, controlled experimental setups are used to minimize the variation induced by factors of less interests (e.g., cows fed the same diet to identify microbial biomarkers related to CH4 emission in specific breeds; Ramayo-Caldas et al., 2020). However, these controlled environments do not fully reflect the complexity of “real-world-” or “commercial-” or “practical-” farming conditions.
In real-world conditions, ruminants are exposed to highly variable environments. For instance, diets can vary significantly between farms, even within the same region, with differences in quality and the proportions of roughages (such as fresh grass, grass silage, and corn silage), concentrates, and by-products. Some farms allow their cows to graze, with grasslands varying not only between farms but also throughout the year due to differences in botanical composition (Totty et al., 2013), weather conditions, and fertilization practices (Rinne et al., 1997). Furthermore, animal characteristics on commercial farms are not standardized, unlike in controlled experimental settings where these factors are carefully managed to minimize variability.
Cows on commercial (practical) farms display a much broader range of variation in genetics, parity, and lactation stage, which could potentially lead to different outcomes than those observed in controlled experiments. Large-scale studies analyzing rumen microbiota across different farms rarely focus on the association with CH4 emission (Xue et al., 2018). However, studies that do examine both microbiota and CH4 emission, provide valuable insights into the relation between rumen microbes and CH4 emission under real-world-farming conditions (Difford et al., 2018). The lessons and insights gained from such studies are increasingly important for the future, especially with the emergence and adoption of research concepts like the “living labs” approach for dairy cattle (Karlsson et al., 2024; Pasinato et al., 2023). Therefore, this study aimed to identify specific microbial taxa associated to CH4 emission in dairy cows raised under real-world farming conditions.
2 Materials and methods
2.1 Animals, housing, and diet
The study was conducted from September 2018 to March 2020 on 17 dairy farms in the Netherlands. In this time frame, farms were visited one to three times (Supplementary Table 1), each time for a period of at least four weeks; a minimum of two weeks of adaptation followed by two weeks of measurement period. The farms were selected from the project “Koeien & Kansen”, a multi-annual research and demonstration project in the Netherlands that aims to be representative of the Dutch dairy sector. The study was conducted in accordance with the Dutch Animal Experiments Act in compliance with European Union Directive 2010/63 and approved by the Central Committee for Animal Experiments (The Hague, The Netherlands, 2016.D-0066.001).
In total 212 dairy cows were sampled in this study, of which 15 cows were measured multiple times over the study period with a maximum of three times. Because there was considerable time between each measurement period, including changes in diet, lactation stage and parity, observations of the same cows were considered to be independent. All cows were housed in free-stall barns with deep-litter sand or rubber matrass with sawdust or in a (composted) bedded pack barn. All barns had open sides for natural ventilation and free access to clean drinking water. All cows were fed ad libitum and received a commercial dairy diet that differed per farm and season. The diets were formulated according to commercial practices complied in collaboration with a dairy feed advisor. Practices and diets per farm were maintained unchanged during the adaptation period and measurement period as the objective was to have a representative overview of Dutch farming on CH4 emission and rumen microbiota. On average (mean ± SD) the diets consisted of 32 ± 13.6% grass silage, 25 ± 11.8% maize silage, 12 ± 13.8% fresh grass, 25 ± 7.9% concentrates, and 6 ± 10.7% by-products, on a DM basis. Supplementary Table 1 presents the diet composition provided on each farm during each measurement period. Fifteen farms applied grazing during part of the year (spring, summer and/or autumn) and thus also during some of the measurement periods. Grazing time was not controlled and differed per farm, ranging from a few hours a day to unrestricted grazing with free choice to stay outside the barn. Farmers were advised to keep the grazing management as homogenous as possible during the measurement period.
2.2 Milk measurements
Depending on farm, cows were milked either twice daily in a milking parlor or two to three times daily by a milking robot. Milk composition was determined at the individual cow level using milk samples collected on a single day in the second measurement week. Milk samples were analyzed by Fourier transform mid-infrared spectrometry (MIRS) as part of the routine milk recording programs, for 15 farms performed by Qlip B.V. (Zutphen, the Netherlands) and for 2 farms by VVB Veluwe-Ijsselstreek (Nunspeet, the Netherlands). Milk yield and the percentage of protein and fat in the milk of a sample day were used to calculate fat- and protein-corrected milk (FPCM) according to the following equation (CVB, 2016).
2.3 Methane measurements
Enteric CH4 production was measured non-invasively using the GreenFeed system (GF, C-lock Inc. Rapid City, SD, USA). The GF is an adapted feeding station that measures individual CH4 and CO2 production in grams per day during each visit, as described in detail by van Gastelen et al. (2022). For the present study, the average recovery of CO2 was 99.1% (for individual GF systems between 97.6 and 102.7%).
Methane production was measured over a 14-day period, with a minimum 7-day acclimation to the GF prior to the measurement period and visit times per cow ranging from 3 to 6 min. Cows received 2 to 6 kg of compound feed per day via the GF, depending on milk yield and lactation stage. Administration of the compound feed was divided into 4 to 6 feeding periods per day, with at least 3 to 4 h between each feeding period. Per feeding period, 0.5 to 1 kg of compound feed was administered in 12–25 drops of approximately 40 g of feed (ranging between 31 and 51 g per drop, depending on the type of compound feed used). There were 10–30 s between each drop (depending on the maximum number of drops) to ensure a minimum visit time of 3 min, but no longer than 6 min.
On each farm, one GF was installed in the barn. In case grazing was applied at farm level, an additional GF on a pasture trailer was used to ensure adequate CH4 measurements throughout the day. Due to the high diurnal variation of enteric CH4 production and using short-term breath measurements, multiple records are needed to provide a representative average. Therefore, based on what was found in the study of Manafiazar et al. (2017), CH4 measurements from the 14-day measurement period were averaged per cow and 32 cows with fewer than 20 valid records were excluded from the analysis. Methane intensity (g CH4.kg FPCM−1.d−1) was used as a metric for CH4 emission rather than CH4 yield (g CH4.kg DM−1.d−1). Methane production (g.d−1) is strongly related to total feed intake, which makes it necessary to take measures of feed intake into account when comparing CH4 emission. However, feed intake was not available on individual cow level, thus CH4 production was corrected for FPCM yield, as it is the closest available measure related to feed intake. Note that CH4 production was averaged over two weeks while FPCM yield resulted from a single day of milk samples.
2.4 Rumen sampling
Rumen fluid samples were collected in the second week of the measurement period (Supplementary Table 1) using the oral stomach tube (OST) (Muizelaar et al., 2020). Briefly, the OST consisted of a manual pump and a 190 cm long spiral probe with a perforated suction head at the end, inserted through the esophagus into the dorsal cranial part of the rumen. Rumen fluid was collected by the manual pump. The first 500 ml of the rumen fluid was discarded to minimize contamination with saliva. Subsequently, samples of 3 ml were collected and immediately frozen in dry ice. Samples were stored at –80°C until analysis.
2.5 Microbial DNA extraction and sequencing
Extraction of microbial DNA from rumen samples, library construction of hypervariable region V4 (from 16S rRNA gene) and subsequent sequencing on an Illumina HiSeq platform were performed at Genotypic Technology Pvt. Ltd. In Bangalore, India.
DNA from rumen fluid samples was purified using the Qiagen Dneasy Blood and tissue Kit (Qiagen, Hilden, Germany). Prior to processing the samples using this method, approximately 200μl of ruminal fluid was taken in sterile Tomy tubes containing 3–4 beads and homogenization was carried out at 4,000 rpm for 120 s. A volume of 200 μl (10mg ml−1) lysozyme (MilliporeSigma, St. Louis, USA) was added to the homogenates. The homogenate tube was invert mixed and incubated for 30 min at 37°C. A volume of 200μl AL buffer was added to the samples and vortexed briefly. The samples were subjected to Proteinase K treatment at 56°C for 2 hours followed by Rnase A treatment (MP Biomedicals, Solon, USA) at 65°C for 20 min. The lysate was mixed well with 100% ethanol and loaded onto Qiagen Dneasy blood and tissue column (Qiagen, Hilden, Germany). The samples were further processed following manufacturer’s instructions. Finally, DNA was eluted in 45μl 10mM Tris.Cl, pH 8.0 (Sigma-Aldrich, St. Louis, USA). The concentration and purity of genomic DNA was quantified using the Nanodrop Spectrophotometer (Thermo Scientific; 2000). The integrity of the DNA was assessed by agarose gel electrophoresis.
Sequencing libraries were prepared by a two-step polymerase chain reaction (PCR)-based workflow based on primers specific to V4 region of the 16S rRNA gene (Caporaso et al., 2011). In the first round of PCR, the V4 region of the 16S rRNA gene was amplified using the region-specific primers V4-515F (GTGCCAGCMGCCGCGGTA) and V4-806R (GACTACHVGGGTATCTAATCC) designed by Genotypic Technology Pvt. Ltd. In Bangalore, India. Using the KAPA HiFiHotStart PCR Kit (KAPA Biosystems Inc., Boston, MA USA) and a primer concentration of 5μM, 50ng of genomic DNA was amplified by following first round of PCR condition: 3 min at 95°C, 26 × (30 s at 95°C, 30 s at 64°C, and 30 s at 72°C), and 5 min at 72°C. The amplicons generated were analyzed on a 1.2% agarose gel. The second round of PCR was performed to index the amplicons generated in the first round of PCR. 1μl of the 1:2 diluted PCR amplicons generated in the first round were amplified by following second round of PCR condition: 3 min at 95°C, 10 × (30 s at 95°C, 30 s at 55°C, and 30 s at 72°C), and 5 min at 72°C to add Illumina barcoded adaptors for sequencing (Nextera XT v2 Index Kit, Illumina, USA). Amplicons (sequencing libraries) generated by the second round of PCR were analyzed on a 1.2% agarose gel. The libraries were normalized and pooled for high-throughput multiplex sequencing. Finally, these pools were quantified using the Qubit dsDNA HS assay and fluorometer (Thermo Fisher Scientific, MA, USA). The normalized sample was denatured and fed into the Illumina HiSeqXTen sequencer, where it was sequenced for 150*2 cycles to generate at least 0.7 million paired-end reads. Upon completion of the sequencing run, the data were demultiplexed using bcl2fastq v2.20 software (Illumina, San Diego, USA).
2.6 Sequences pre-processing
Reads were preprocessed using QIIME2 suite v2020.8 (Bolyen et al., 2019). Reads were first checked for low quality bases (Q30) with FAST QC v 0.11.9, then trimmed of primers with Cutadapt plug-in before being merged using FASTQ-join. The merged reads were denoised, dereplicated, and chimera sequences were removed using the DADA2 plugin (Callahan et al., 2016) with default parameters from the QIIME2 suite. The resulting Amplicon Sequence Variants (ASV) were classified based on SILVA v.138 database (Quast et al., 2013). To achieve the classification a Naive Bayesian classifier, pre-trained, was used with the ‘feature-classifier classify-sklearn’ command implemented in Qiime2 (Bokulich et al., 2018). The classifier was optimized for 515F/806R region at 99% similarity and can be found here: https://resources.qiime2.org/#naive-bayes-classifiers-2. Confidence level was set at 0.7% by default.
2.7 Balanced experimental design
A balanced experimental design was established from this large cohort after data generation to balance the factors influencing CH4 intensity and rumen microbiota (Figure 1A). First, two dairy cows with outlier CH4 intensity (above third quartile added of three times the interquartile range) were removed from the dataset. Second, dairy cows were grouped into three lactation stages, namely early (0–93 days in milk (DIM)), mid (93–183 DIM) and late (>183 DIM), according to Bainbridge et al. (2016). Third, dairy cows within each lactation stage were split in two dietary categories, a group that had access to fresh grass during the measurement period and a group that had not access to fresh grass during the measurement period. This resulted in six groups. Fourth, the top fifth lowest and top fifth highest CH4 emitters within each of these six groups were selected (Figure 1B), after checking for statistical significance of the difference of their mean CH4 intensity by a Welch test (Figure 1A), and placed in two groups; a low and high CH4 emitting group (N=30 per group) that was balanced for lactation stage and diet type (i.e., with or without access to fresh grass). All the high and low emitters cows within this experimental design were either Holstein Friesian or Holsten Friesian cross breed.
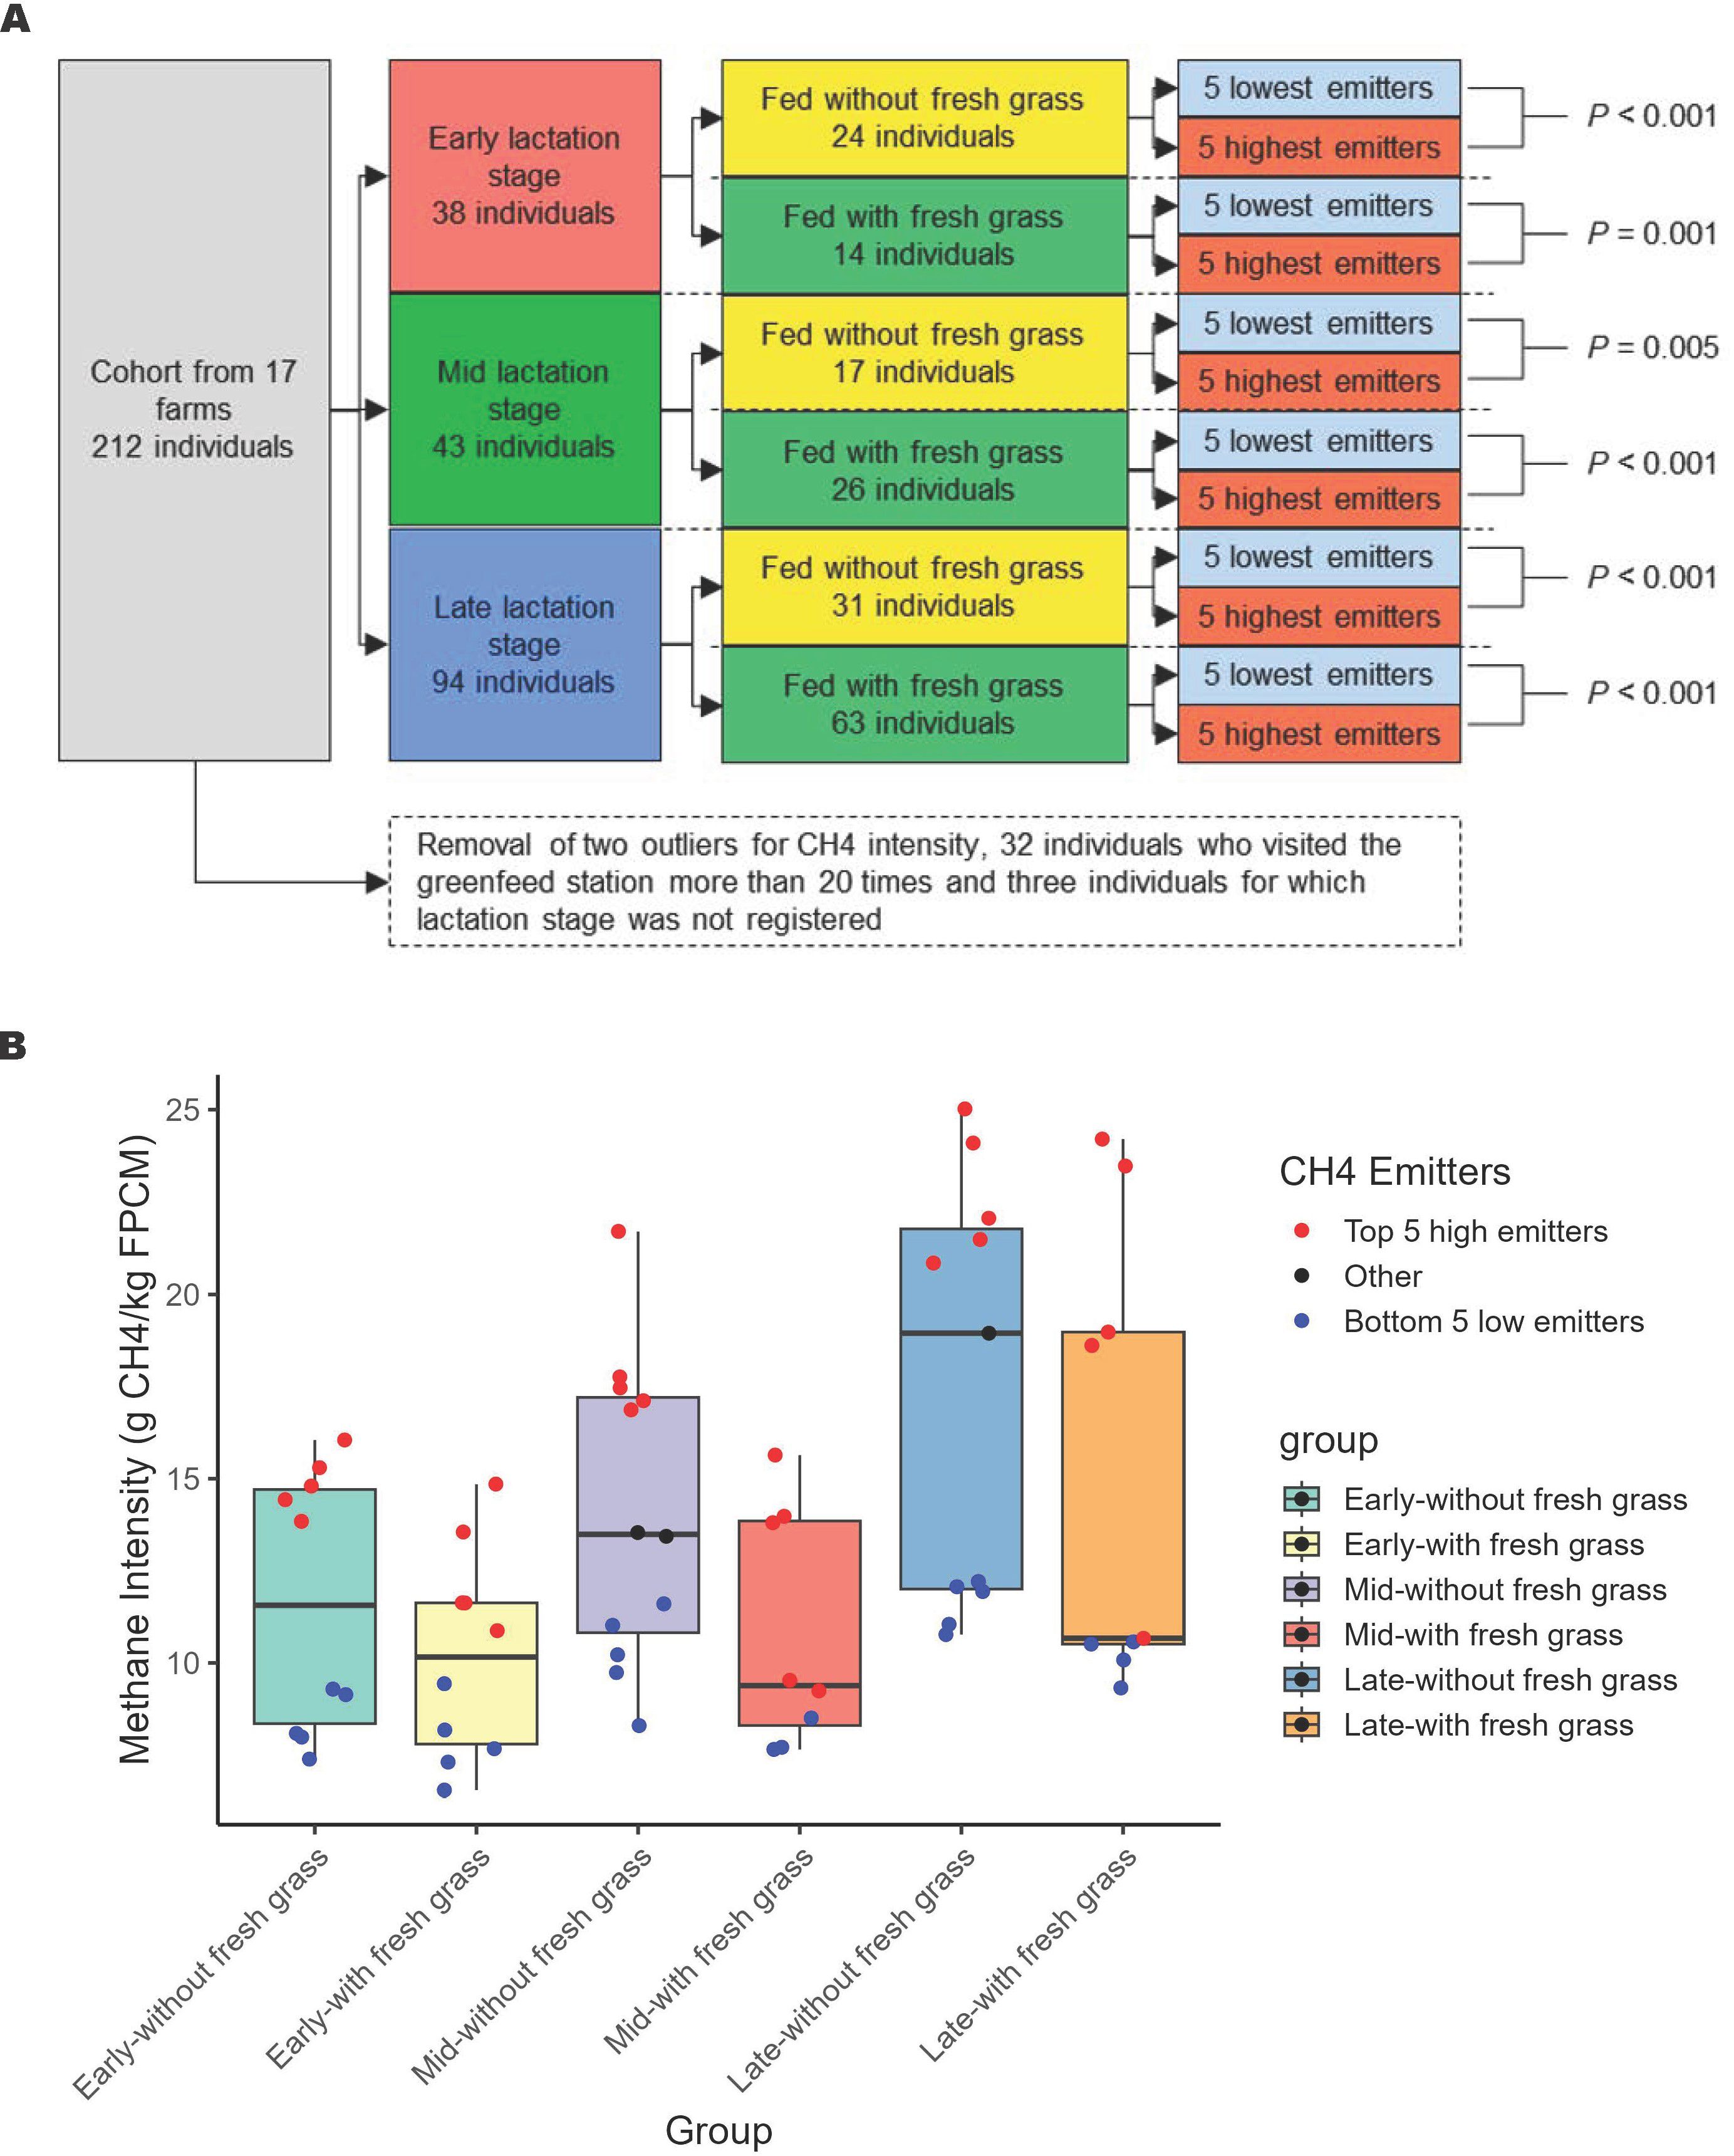
Figure 1. Selecting high and low methane (CH4) emitters from the cohort of 212 cows. (A) provides a schematic representation of the balanced experimental design. Cows were initially stratified by lactation stage and further grouped by diet (with or without fresh grass). From each of the six resulting subgroups, the five lowest and five highest methane emitters were selected, forming balanced “low” and “high” emitter groups of 30 cows each. The groups were balanced for lactation stage and diet. Statistical significance in CH4 intensity differences was evaluated using Welch’s t-test, with the p-value reported. (B) displays the mean CH4 intensity for each subgroup, categorized by lactation stage (early, middle, or late) and diet type (with or without fresh grass). The top five highest emitters (in red) and the bottom five lowest emitters (in blue) within each subgroup were selected to form the “high” and “low” emitting groups, respectively.
2.8 Statistical analysis
All statistical analysis were performed in R v4.0.3 (R Core Team, 2020) using phyloseq (McMurdie and Holmes, 2013), vegan (Oksanen et al., 2012) and ropls (Thévenot et al., 2015) packages. Methane intensity was compared between low and high CH4 emitter groups by a Welch test. The low-high dataset previously described was filtered for low abundant and low prevalent taxa (more than five in at least a third of individuals) to limit the zero-inflation issue (from 90.1% 0 in the dataset prior filtering to 34.0% 0 after filtration). Relative abundance of ASVs were then transform by centered log-ratio (CLR) which allows to overcome differences in sequencing depth without wasting data as in rarefaction (McMurdie and Holmes, 2014; Gloor et al., 2017) and at the same time replace data into a Euclidean space (Quinn et al., 2019). Multivariate dimension reduction approaches, namely principal component analysis (PCA) and orthogonal partial least-square discriminant analysis (o-PLS-DA) were performed following the CLR normalization and a z-score scaling to adjust feature-wise homogeneity. Orthogonal signal correction was used to decorrelate variation that would be unrelated to the discriminant low and high emitter groups. Significance of the predictive performance (Q2) was assessed by random permutation of 10% of the samples in the discriminant groups repeated 200 times. Variables important for projection with a value above two were defined as associated with low or high emitters depending on their contribution on the predictive component. The relative abundance of taxa was used to plot the VIP rather than CLR transformed value for comprehension purpose.
3 Results
3.1 Methane emission and animal characteristics
Methane intensity from the broad cohort of 212 cows, depleted of two outliers and 32 cows that visited the GF less than 20 times, ranged from 6.55 to 25.02 g.kg FPCM−1.d−1 (Figure 2). The low CH4 emitters were predominantly cows in early or mid-lactation, whereas the high CH4 emitters were mostly cows in late lactation. To isolate individual effects on CH4 intensity from important confounding factors, we created a balanced experimental design that account for lactation stage (i.e., early, mid, and late) and diet type (i.e., with or without access to fresh grass) for two groups of low and high CH4 emitters. The average CH4 intensity in the low CH4 group (9.5 ± 1.57 g.kg FPCM−1.d−1) was significantly different from average CH4 intensity in the high CH4 group (16.8 ± 4.11 g.kg FPCM−1.d−1, P < 0.001). The group composition was not biased for specific farms (Supplementary Figure 1) and only one cow in each group was sampled twice.
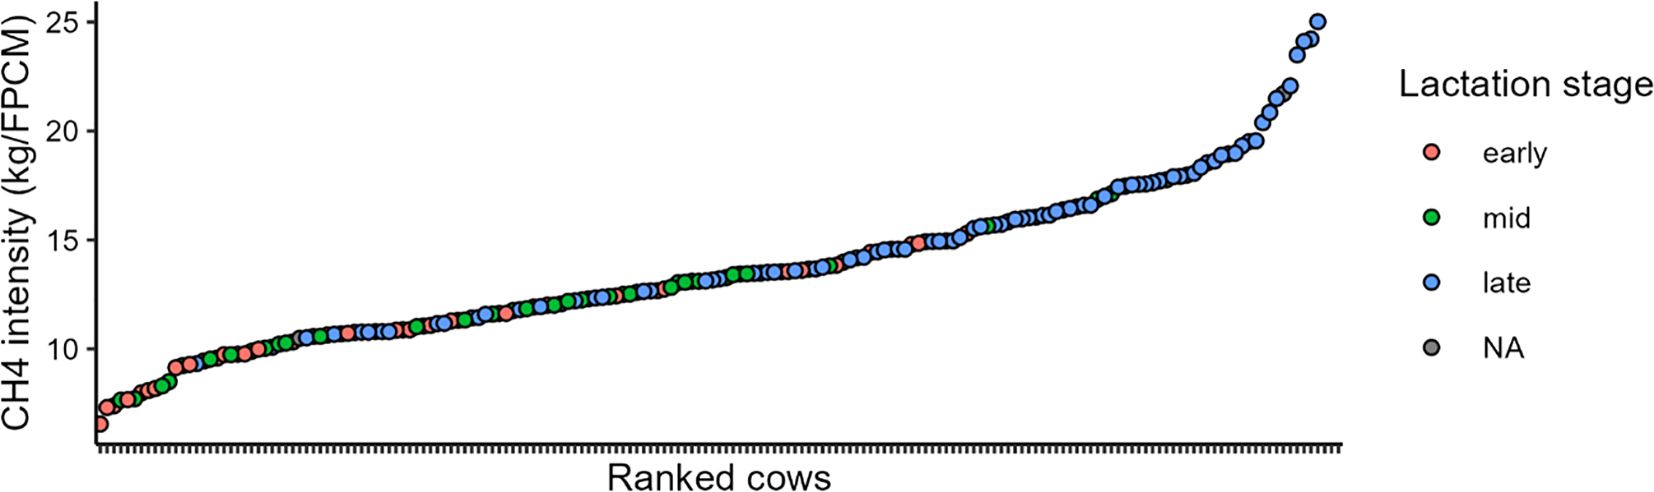
Figure 2. Methane emission of dairy cows from the cohort of 212 dairy cows representative of the Dutch cattle farming ranked from lowest to highest and depleted by two outliers and 32 cows that visited the greenfeed station less than 20 times.
3.2 Microbiota composition
The dataset from the balanced experimental design contained 23,578 ASV for 60 samples before filtering for low abundant and low prevalent ASV. After the filtering, 2,250 taxa remained. On average, 98.10 ± 2.10% of the ASV were identified as bacteria and 1.90 ± 2.10% were identified as archaea (Supplementary Figure 2). At the Phylum level, Firmicutes (56.6 ± 9.46%), Bacteroidota (31.90 ± 10.17%) and Proteobacteria (3.10 ± 3.55%) composed most of the taxa (Supplementary Figure 3).
The microbial composition at Phylum level across the 17 farms is presented in Supplementary Figure 4. In farm “I”, the relative abundance of the most abundant phylum, Firmicutes, varied considerably, ranging from a minimum of 47.12 ± 9.18% to a maximum of 71.04 ± 10.55%. A PCA was performed to have an overview of the main factors that influenced the composition of rumen microbiota of cows in the balanced experimental design (Figure 3). The first two principal components (PC) of the PCA explained 29% of the total variance. The most visible separation on the PCA, if any, was related to diet type, namely, the presence of fresh grass in the diet. No discrimination by the lactation stage or by the grouping of cows as low or high CH4 emitters was observed.
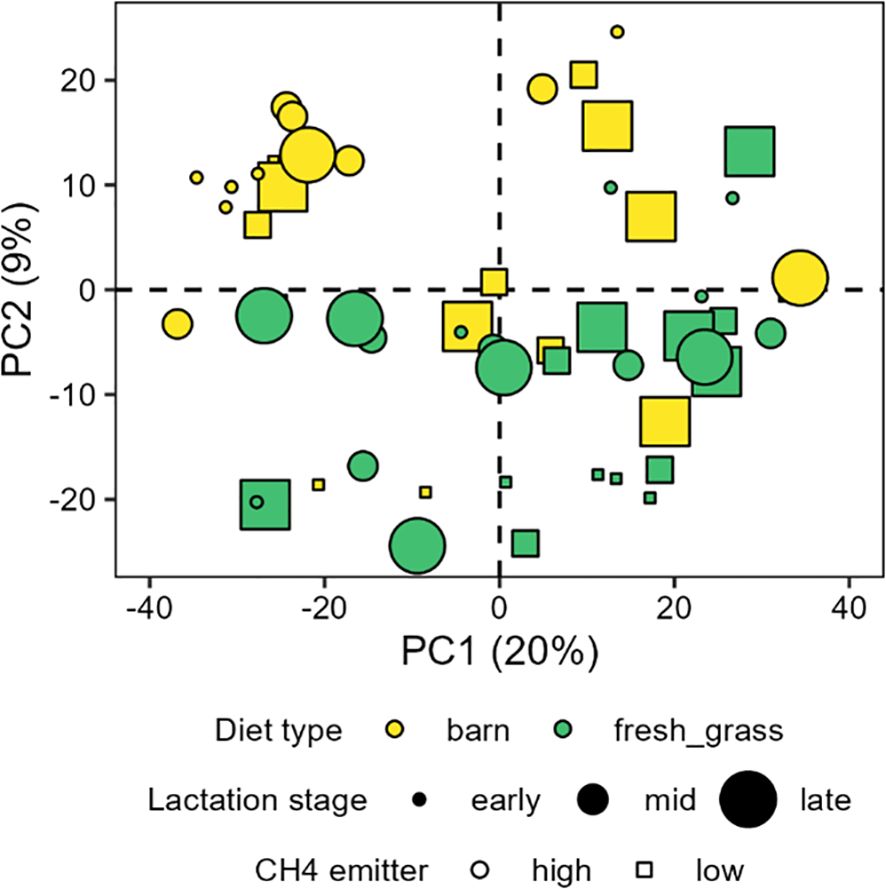
Figure 3. Principal component analysis scores plot of cow rumen fluid microbiota composition from the balanced design of 60 cows. Diet type, rather than lactation stage or CH4 emission category, structures the PCA.
3.3 Microbiota composition differences between low and high emitters
A multivariate discriminant analysis, o-PLS-DA, was performed to reveal ASV associated with low and high CH4 emitter groups in the balanced experimental design (Figure 4). The predictive accuracy of the o-PLS-DA was 0.16 (Q2 = 0.16) and significant (P = 0.01). A total of 88 VIP (ASVs used in the model) were above the defined threshold of two, i.e., for VIP highly discriminant for the two groups (Figure 5). Collectively, these VIP represented 14.0 ± 4.9% of the total relative abundance across all the 60 samples of the balanced experimental design (Supplementary Figure 5). Thirty-six taxa were more abundant in the high CH4 emitter group than in the low emitter group, whereas 52 were more abundant in the low CH4 emitter group than in the high emitter group. The 36 ASV that were relatively more abundant in the high CH4 emitter group were identified in the family [Eubacterium]_coprostanoligenes, Absconditabacteriales_(SR1), Christensenellaceae, Clostridia_UCG−014, Gastranaerophilales, Hungateiclostridiaceae, Lachnospiraceae, Oscillospiraceae, Prevotellaceae, Ruminococcaceae, Saccharimonadaceae, Spirochaetaceae and one uncultured family from the Armatimonadota Phylum. The 52 ASV more abundant in low CH4 emitter group were identified in the family [Eubacterium]_coprostanoligenes, Anaerolineaceae, Christensenellaceae, Clostridia_UCG−014, Desulfobulbaceae, Eubacteriaceae, F082 from the Bacteroidales order, Lachnospiraceae, Methanobacteriaceae, unknown family from the Clostridia class, Oscillospiraceae, Prevotellaceae, Rikenellaceae and Ruminococcaceae.
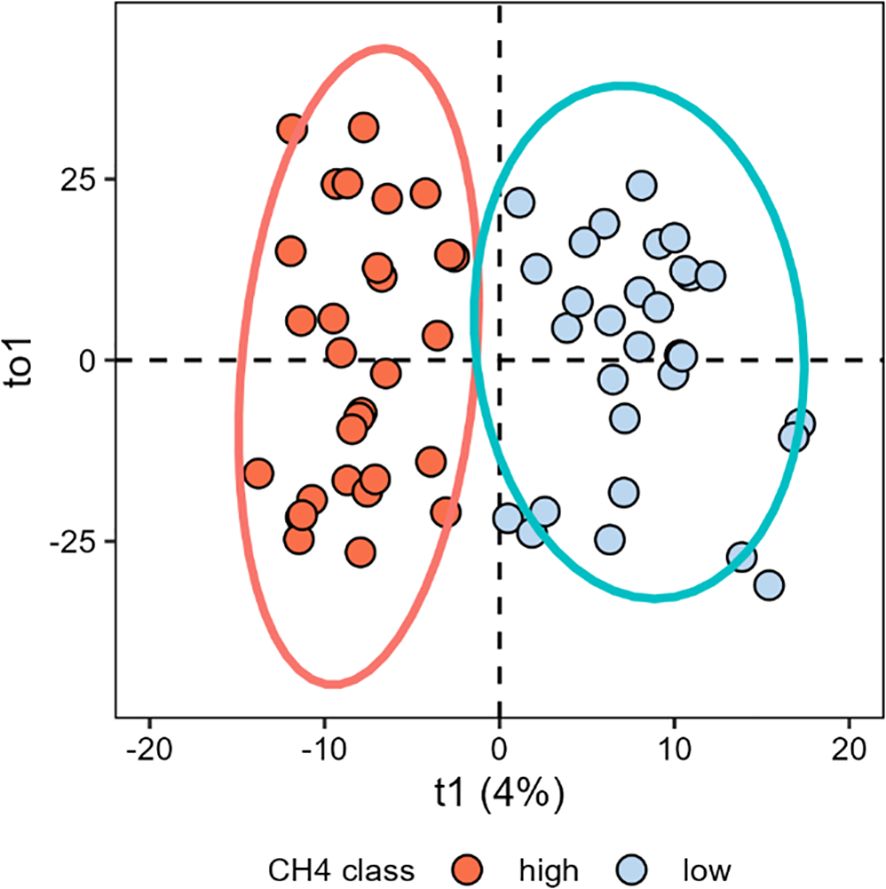
Figure 4. Orthogonal partial least square discriminant analysis (oPLS-DA) of rumen fluid from low and high emitters (N=30 per group) in the balanced experimental design from the cohort of dairy cattle. R2Y = 82%, Q2Y = 0.16, P = 0.01.
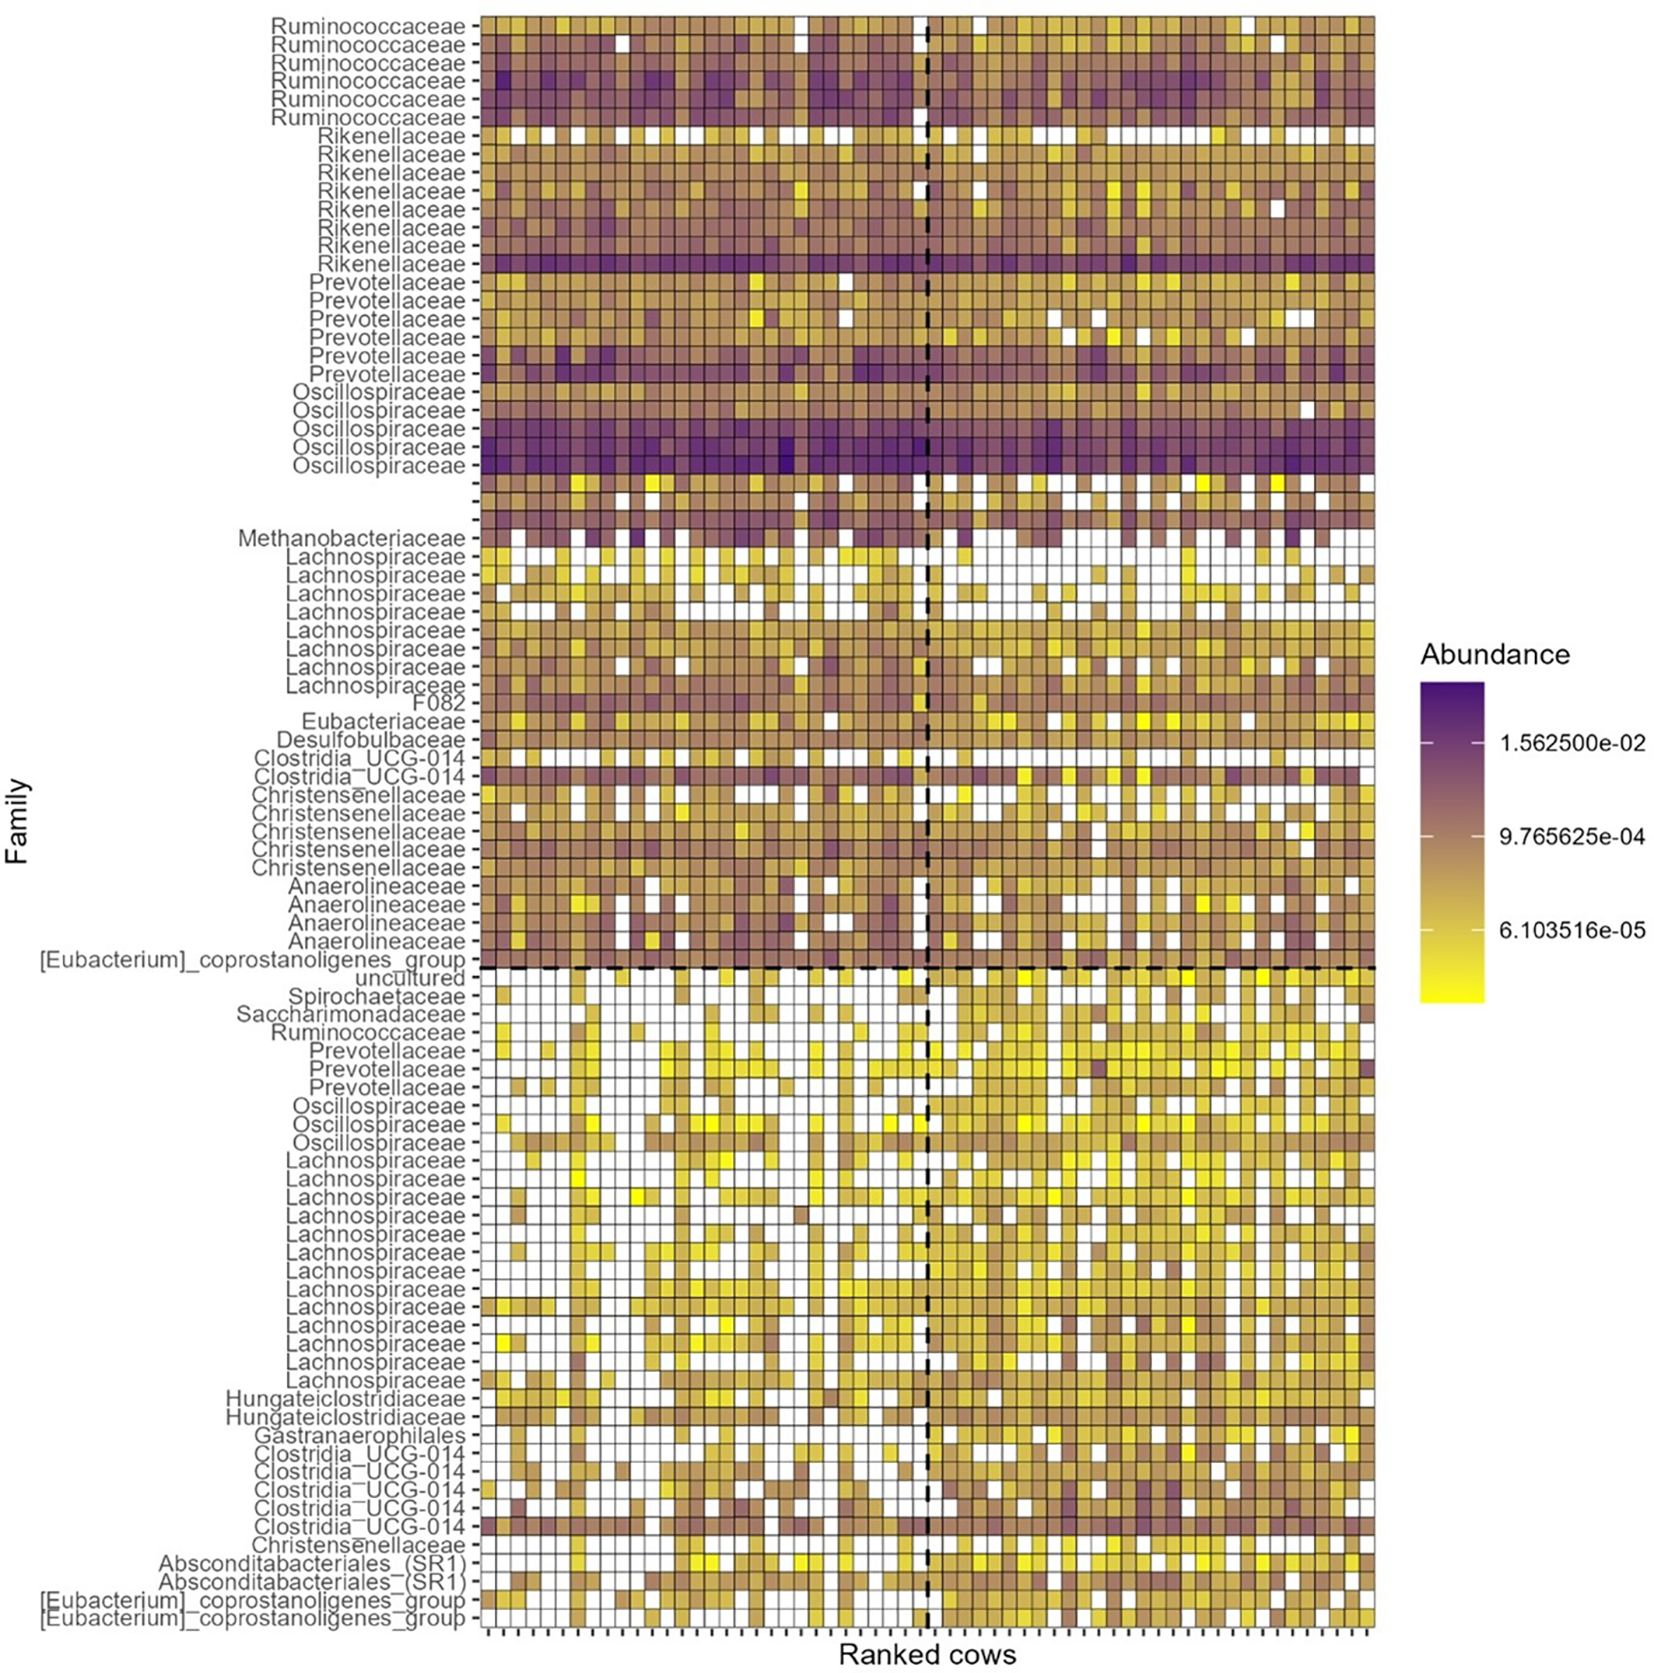
Figure 5. Heatmap of taxa with variable importance in projection (VIP > 2) identified in the oPLS-DA differentiating low and high methane emitters. Each cow is ranked from low (left side, 30 lowest) to high emission (right side, 30 highest). Each taxon is identified by its Family rank when possible (otherwise left unnoted) and ordered alphabetically within taxa more abundant in high emitters (bottom half) and more abundant in low emitters (top half). Abundance (0–1) within each cows’ rumen fluid is color coded.
4 Discussion
In this study, we investigated the association between microbial taxa and CH4 intensity, using data collected from individual cattle across seventeen Dutch dairy farms operating under practical farming conditions. As individual dry matter intake (DMI) measurements are often unavailable in such settings, CH4 intensity, defined as CH4 production per unit of fat- and protein-corrected milk (FPCM), was used as a proxy instead of CH4 yield, which is expressed as CH4 production per unit of DMI. During the analysis of the data in this study, the inherent complexities and variability in dairy cattle farm conditions and husbandry practices presented significant challenges in identifying consistent rumen microbial taxa associated with CH4 intensity as shown in the variation of the main Phyla (Supplementary Figure 4). We attempted to mitigated some of the variability by applying a balanced design post-data collection, carefully accounting for factors such as lactation stage and the availability of fresh grass, both of which are known to influence rumen microbiota, either directly or indirectly. Although the dynamic and diverse nature of our dataset complicates the identification of specific taxa with precision, our primary objective was to uncover consistent microbial patterns linked to the observed CH4 emission intensities. Therefore, while acknowledging the inherent complexity, our analysis focused on identifying robust microbial signatures that consistently associated with CH4 emission intensities, even if the precise taxonomic resolution remained challenging. As an outlook, future research could explore these broader ecological factors to gain a more comprehensive understanding of the microbial influences on CH4 production in diverse farm settings.
In a broader context, this study was part of a larger inventory study in which CH4 production was measured from 1,106 cows of 18 farms (Koning et al., 2020). The linear mixed model analysis conducted in the inventory study revealed that grazing, coupled with seasonal variations, accounted for approximately 3% of the variation in CH4 intensity. While the impact of fresh grass on CH4 emission was modest in the study of Koning et al. (2020), our study demonstrated a more pronounced effect of fresh grass on rumen microbiota while the effect of lactation stage was more ambiguous. Our findings highlight a complex, multifactorial relationship between grazing practices, rumen microbial dynamics, and CH4 emission under real-world farming conditions. Nonetheless, it is plausible that the binary classification of fresh grass availability may mask subtle yet significant dietary variations, which could intricately influence the structure and function of the rumen microbiota involved in CH4 production. These unaccounted dietary nuances may contribute to the observed variability in CH4 emission, underscoring the need for more granular assessments of feed composition and its microbial interactions.
Interestingly, our analysis revealed a notable similarity in the bacterial community composition within the rumen of both high and low CH4-emitting cows. One of the most predominant families identified was Lachnospiraceae, which was consistently present in both high and low emitters. Bacteria from the Lachnospiraceae have been associated with CH4 emission in ruminants in various studies (Ramayo-Caldas et al., 2020; Shabat et al., 2016; Kittelmann et al., 2014). They are known to produce H2 which is then used to reduce CO2 into CH4. The Lachnospiraceae family encompasses a range of species known for their diverse abilities to degrade plant polysaccharides, highly present in cow diets (Biddle et al., 2013; Sorbara et al., 2020). This metabolic versatility likely contributes to the widespread presence of Lachnospiraceae in the rumen of cows across different farms. The ability of this bacterial family to efficiently process a variety of plant-based diets enables its prevalence in bovine ruminal microbiomes, regardless of variations in the plant material composition in the feed across the 17 farms studied. Interestingly, Shabat et al. (2016) also reported that genes from the Lachnospiraceae family were enriched in cows both with a low or high feed efficiency, and subsequently a high or low CH4 production, respectively. In a recent study, Kaminsky et al. (2023) highlighted the flexibility of the NK3A20 isolate from the Lachnospiraceae family to grow from different substrates. They observed that this isolate exhibited varied H2 production depending on the substrate, with notably lower H2 production when metabolizing galacturonic acid. This could imply a reduced potential for CH4 production under certain dietary conditions. Based on these findings, it can be speculated that the presence of Lachnospiraceae in both the low and high CH4 emitting group may not solely be attributable to the variations in diet composition across farms. Instead, the inherent genetic and metabolic adaptability of this bacterial family, particularly in response to different substrates, could play a significant role in its prevalence and activity in varying CH4 production contexts. Overall, despite their divergent CH4 emission profiles in high and low CH4 emitters, the overall microbial structure remained largely conserved, suggesting that differences in CH4 emission may be driven by functional or metabolic shifts within the microbial community, rather than substantial changes in its taxonomic composition.
In our study, members of the Ruminococcaceae family were found to be more prevalent in low CH4-emitting cows, contrasting with prior research that frequently reported higher abundances of Ruminococcaceae in high CH4 emitters. This discrepancy suggests that the relationship between Ruminococcaceae and CH4 production may be context-dependent, potentially influenced by factors such as diet composition, host genetics, or environmental conditions, highlighting the complexity of microbial contributions to CH4 emission (Tapio et al., 2017; Ramayo-Caldas et al., 2020). Ruminococcaceae are known for their role in cellulose degradation and H2 production, their prevalence in low CH4 emitters in our study prompts further investigation. Furthermore, the absence of Fibrobacteraceae, particularly the absence of ASVs associated with Fibrobacter succinogenes, among the variables identified as important for projection (VIP), is noteworthy and warrants further investigation. Fibrobacter species are specialized in cellulose and hemicellulose degradation but do not produce H2. The inability of the PLS-DA model to identify Fibrobacteraceae as a key variable in the VIP, alongside the overrepresentation of Ruminococcaceae, suggests that factors beyond dietary composition are influencing the microbial community structure in the rumen. Given the shared role of Fibrobacter and Ruminococcaceae in cellulose degradation, a concurrent increase in the members from both taxa would be expected if diet were the primary determinant. However, the absence of this association in our findings indicates that other environmental or host physiological factors may play a more critical role in shaping the relative abundance and dominance of Ruminococcaceae within the rumen microbiome.
As discussed earlier, CH4 production in the rumen is primarily driven by archaea, particularly members of the Methanobacteriaceae family. In our study, Methanobrevibacter was the only genus that significantly differed between high and low CH4-emitting groups, with its abundance being higher in the low-emitting group. This limited detection of archaeal taxa may be attributed to methodological and technical constraints, as we employed primers targeting the V4 region of the 16S rRNA gene, which are designed to capture both bacterial and archaeal populations. However, the use of archaeal-specific primers targeting alternative regions of the 16S rRNA gene could provide a more comprehensive and accurate characterization of the archaeal community within the rumen (Pausan et al., 2019). Alternatively, researchers may utilize archaea-specific primers targeting the mcrA gene, which encodes the α-subunit of methyl-coenzyme M reductase, a key enzyme in methanogenesis. This approach enables a more precise assessment of archaeal communities, particularly in CH4-producing environments (Friedrich, 2005). Amplifying and sequencing the mcrA gene would not only enhance taxonomic resolution but also provide direct insights into the methanogenic potential and community composition in ruminants (Casañas et al., 2015). This approach is especially relevant in rumen studies, where a detailed understanding of methanogen diversity could contribute to strategies for mitigating CH4 emissions. While the 515F/806R primers used in this study effectively served the purpose of our broader study focused on large-scale microbial community comparisons and recovering global ecological patterns (Caporaso et al., 2011), we recognize that for studies specifically targeting the archaeal component of the rumen microbiome, and especially those investigating CH4 production, adopting the above-mentioned suggested approaches of utilizing archaea-specific primers would be highly beneficial. Another possible explanation for identifying only one archaeal ASV as discriminant is that the relative abundance of methanogens may not be a strong enough factor to differentiate high and low CH4 emitters. Research has indicated that gene expression levels, rather than the relative abundance of archaea, could serve as a more accurate marker for distinguishing between CH4 emission profiles (Roehe et al., 2016; Shi et al., 2014). This implies that functional activity of methanogens, rather than their population size, could play a more significant role in determining CH4 emission (Shi et al., 2014). reported a higher relative abundance of Methanosphaera spp. and a lower relative abundance of organisms belonging to the Methanobrevibacter gottschalkii clade in the low CH4 yield sheep. Even though these authors found some other shifts in subpopulations of methanogens, they concluded that the higher CH4 yield of the high CH4 emitting sheep was unlikely to be due to an increased relative abundance of these methanogens. They did find strong correlations between gene expression of methanogens and CH4 yield. It is therefore recommended for follow-up research to focus on gene expression rather than relative abundance to discuss the role of archaea in enteric CH4 production.
Our study elucidates the intricate interactions between dietary factors, rumen microbiota composition, and CH4 emission in dairy cattle, emphasizing the necessity for a more refined approach that extends beyond basic phenotype comparisons. The inherent variability across farm conditions complicates the identification of consistent microbial signatures associated with CH4 production. When designing studies in real-world farm settings, it is essential to account for the diverse management practices and environmental factors that influence microbial dynamics. Methodologies such as living labs offer a more accurate representation of microbial community responses to fluctuating on-farm conditions, thereby enhancing the precision of CH4 mitigation strategies. However, the dynamic and multifactorial nature of commercial farming presents significant challenges in identifying reliable rumen based “microbial biomarkers” for CH4 emission. Despite these obstacles, our findings underscore the critical need to incorporate on-farm variability to deepen our understanding of microbial dynamics and their contribution to CH4 production, ultimately improving the development of targeted mitigation strategies. While direct methanogen data is valuable (Patra et al., 2017; Danielsson et al., 2017), our findings underscore the need for a broader ecological perspective in understanding CH4 emissions in real-world settings. We show that shifts in the wider microbial community, including non-methanogenic taxa, are significantly associated with CH4 intensity produced by dairy cattle (Danielsson et al., 2017; Wallace et al., 2015; Bekele et al., 2010) likely reflecting environmental conditions and complex microbial interactions that indirectly regulate methanogenesis.
The pronounced susceptibility of CH4-associated rumen microbiota to environmental conditions necessitates a fundamental shift towards context-aware CH4 mitigation strategies in dairy farming. Interventions should leverage holistic approaches like optimized soil and grassland management, which impact the entire microbial community (Guo et al., 2024; Egan et al., 2018; Su et al., 2023; Chernov and Semenov, 2021). To advance sustainable solutions, future research must prioritize on-farm investigations into the effects of specific farm factors on key microbial groups involved in methanogenesis, including hydrogen producers, and their complex interactions. This integrative, field-based approach is crucial for achieving meaningful and consistent reductions in CH4 emissions.
Data availability statement
The datasets presented in this study can be found in online repositories. The names of the repository/repositories and accession number(s) can be found in the article/Supplementary Material.
Ethics statement
The study was conducted in accordance with the Dutch Animal Experiments Act in compliance with European Union Directive 2010/63 and approved by the Central Committee for Animal Experiments (The Hague, The Netherlands, 2016.D-0066.001). The study was conducted in accordance with the local legislation and institutional requirements.
Author contributions
SR: Data curation, Formal analysis, Investigation, Methodology, Software, Visualization, Writing – original draft, Writing – review & editing. LK: Data curation, Formal analysis, Investigation, Methodology, Software, Visualization, Writing – original draft, Writing – review & editing. AB: Data curation, Methodology, Software, Supervision, Visualization, Writing – review & editing. SV: Investigation, Project administration, Resources, Writing – review & editing. DS: Methodology, Software, Visualization, Writing – review & editing. EZ: Data curation, Formal analysis, Software, Validation, Visualization, Writing – review & editing. LŠ: Conceptualization, Funding acquisition, Project administration, Resources, Supervision, Writing – review & editing. SK: Conceptualization, Data curation, Formal analysis, Funding acquisition, Investigation, Methodology, Project administration, Resources, Software, Supervision, Validation, Visualization, Writing – original draft, Writing – review & editing.
Funding
The author(s) declare that financial support was received for the research and/or publication of this article. This research was conducted by Wageningen Livestock Research, commissioned and funded by the Ministry of Agriculture, Fisheries, Food Security and Nature (DGA-SKI/22244146, dated 19 July 2022), as part of the Dutch government’s Policy Support Research framework under the theme “Climate Smart Methane Emission in Livestock Farming” (project number BO-53-003-032).
Acknowledgments
We are deeply grateful to the farmers who collaborated with us, demonstrating their willingness to engage, contributing valuable insights, and taking responsibility for the project by, for example, training their animals and ensuring the GreenFeed system remained operational. We gratefully acknowledge all technicians, especially Theo van Hattum and Henk Gunnink, who installed the GreenFeed systems and kept them operational on all farms. We acknowledge the veterinarians who helped us taking the rumen fluid samples. Finally, we would like to thank all colleagues who helped collecting the rumen fluid samples, with special thanks to Marleen Plomp, Wouter Muizelaar, Henk Schilder, and Piet van Wikselaar.
Conflict of interest
The authors declare that the research was conducted in the absence of any commercial or financial relationships that could be construed as a potential conflict of interest.
Generative AI statement
The author(s) declare that no Generative AI was used in the creation of this manuscript.
Publisher’s note
All claims expressed in this article are solely those of the authors and do not necessarily represent those of their affiliated organizations, or those of the publisher, the editors and the reviewers. Any product that may be evaluated in this article, or claim that may be made by its manufacturer, is not guaranteed or endorsed by the publisher.
Supplementary material
The Supplementary Material for this article can be found online at: https://www.frontiersin.org/articles/10.3389/frmbi.2025.1540197/full#supplementary-material
References
Bainbridge M. L., Cersosimo L. M., Wright André-DenisG., Kraft J. (2016). Rumen bacterial communities shift across a lactation in holstein, Jersey and holstein × Jersey dairy cows and correlate to rumen function, bacterial fatty acid composition and production parameters. FEMS Microbiol. Ecol. 92, fiw059. doi: 10.1093/femsec/fiw059
Bekele A. Z., Koike S., Kobayashi Y. (2010). Genetic diversity and diet specificity of ruminal prevotella revealed by 16S rRNA gene-based analysis. FEMS Microbiol. Lett. 305, 49–575. doi: 10.1111/j.1574-6968.2010.01911.x
Biddle A., Stewart L., Blanchard J., Leschine S. (2013). Untangling the genetic basis of fibrolytic specialization by lachnospiraceae and ruminococcaceae in diverse gut communities. Diversity 5, 627–405. doi: 10.3390/d5030627
Bokulich N. A., Kaehler B. D., Rideout J. R., Dillon M., Bolyen E., Knight R., et al. (2018). Optimizing taxonomic classification of marker-gene amplicon sequences with QIIME 2’s Q2-feature-classifier plugin. Microbiome 6, 905. doi: 10.1186/s40168-018-0470-z
Bolyen E., Rideout J. R., Dillon M. R., Bokulich N. A., Abnet C. C., Al-Ghalith G. A., et al. (2019). Reproducible, interactive, scalable and extensible microbiome data science using QIIME 2. Nat. Biotechnol. 37, 852–857. doi: 10.1038/s41587-019-0209-9
Callahan B. J., McMurdie P. J., Rosen M. J., Han A. W., Johnson A. Jo A., Holmes S. P. (2016). DADA2: high-resolution sample inference from illumina amplicon data. Nat. Methods 13, 581–835. doi: 10.1038/nmeth.3869
Caporaso J.G., Lauber C. L., Walters W. A., Berg-Lyons D., Lozupone C. A., Turnbaugh P. J., et al. (2011). Global Patterns of 16S rRNA Diversity at a Depth of Millions of Sequences per Sample. Proc. Natl. Acad. Sci. 108, 4516–4522. doi: 10.1073/pnas.1000080107
Casañas M.A.A., Rangkasenee N., Krattenmacher N., Thaller G., Metges C. C., Kuhla B. (2015). Methyl-coenzyme M reductase A as an indicator to estimate methane production from dairy cows. J. Dairy Sci. 98, 4074–4835. doi: 10.3168/jds.2015-9310
Chernov T. I., Semenov M. V. (2021). Management of soil microbial communities: opportunities and prospects (a review). Eurasian Soil Sci. 54, 1888–1902. doi: 10.1134/S1064229321120024
CVB (2016). Tabellenboek veevoeding 2016. Wageningen, The Netherlands: Federatie Nederlandse Diervoederketen (FND).
Danielsson R., Dicksved J., Sun L., Gonda H., Müller B., Schnürer A., et al. (2017). Methane production in dairy cows correlates with rumen methanogenic and bacterial community structure. Front. Microbiol. 8. doi: 10.3389/fmicb.2017.00226
Difford G. F., Plichta D. R., Løvendahl P., Lassen J., Noel S. J., Højberg O., et al. (2018). Host genetics and the rumen microbiome jointly associate with methane emissions in dairy cows. PloS Genet. 14, e1007580. doi: 10.1371/journal.pgen.1007580
Egan G., Zhou X., Wang D., Jia Z., Crawley M. J., Fornara D. (2018). Long-term effects of grassland management on soil microbial abundance: implications for soil carbon and nitrogen storage. Biogeochemistry 141, 213–285. doi: 10.1007/s10533-018-0515-1
Friedrich M. W. (2005). Methyl-coenzyme M reductase genes: unique functional markers for methanogenic and anaerobic methane-oxidizing archaea. Methods Enzymology 397, 428–442. doi: 10.1016/S0076-6879(05)97026-2
van Gastelen S., Dijkstra J., Heck J. M.L., Kindermann M., Klop A., de Mol R., et al. (2022). Methane mitigation potential of 3-nitrooxypropanol in lactating cows is influenced by basal diet composition. J. Dairy Sci. 105, 4064–4825. doi: 10.3168/jds.2021-20782
Gloor G. B., Macklaim J. M., Pawlowsky-Glahn V., Egozcue J. J. (2017). Microbiome datasets are compositional: and this is not optional. Front. Microbiol. 8. doi: 10.3389/fmicb.2017.02224
Guo T., Wang X., Zhang Q., Jia Y., Wang Y., Wei L., et al. (2024). Effects of the alpine meadow in different phenological periods on rumen fermentation and gastrointestinal tract bacteria community in grazing yak on the qinghai-tibetan plateau. BMC Microbiol. 24, 62. doi: 10.1186/s12866-024-03182-y
Huws S. A., Creevey C. J., Oyama L. B., Mizrahi I., Denman S. E., Popova M., et al. (2018). Addressing global ruminant agricultural challenges through understanding the rumen microbiome: past, present, and future. Front. Microbiol. 9. doi: 10.3389/fmicb.2018.02161
Kaminsky R. A., Reid P. M., Altermann E., Kenters N., Kelly W. J., Noel S. J., et al. (2023). Rumen lachnospiraceae isolate NK3A20 exhibits metabolic flexibility in response to substrate and coculture with a methanogen. Appl. Environ. Microbiol. 89, e00634235. doi: 10.1128/aem.00634-23
Karlsson A.-K., Krizsan S. J., Nilsdotter-Linde N. (2024). SustAinimal grazing living lab - a survey of grazing management on dairy farms in northern Sweden. Acta Agriculturae Scandinavica Section B - Soil Plant Sci. 74. doi: 10.1080/09064710.2024.2304757
Kittelmann S., Pinares-Patiño C. S., Seedorf H., Kirk M. R., Ganesh S., McEwan J. C., et al. (2014). Two different bacterial community types are linked with the low-methane emission trait in sheep. PloS One 9, e1031715. doi: 10.1371/journal.pone.0103171
Koning L., van Riel J., Šebek L. (2020). Enteric methane emission of the dutch dairy herd : average and variation of enteric methane emission among the dutch dairy herd. Wageningen: Wageningen Livestock Res. doi: 10.18174/531257
Kurth J. M., Op den Camp H. J. M., Welte C. U. (2020). Several ways one goal-methanogenesis from unconventional substrates. Appl. Microbiol. Biotechnol. 104, 6839–6545. doi: 10.1007/s00253-020-10724-7
Li X. (2021). Plant cell wall chemistry: implications for ruminant utilisation. J. Appl. Anim. Nutr. 9, 31–56. doi: 10.3920/JAAN2020.0017
Manafiazar G., Zimmerman S., Basarab J. A. (2017). Repeatability and variability of short-term spot measurement of methane and carbon dioxide emissions from beef cattle using greenFeed emissions monitoring system. Can. J. Anim. Sci. 97, 118–126. doi: 10.1139/cjas-2015-0190
McMurdie P. J., Holmes S. (2013). Phyloseq: an R package for reproducible interactive analysis and graphics of microbiome census data. PloS One 8, e612175. doi: 10.1371/journal.pone.0061217
McMurdie P. J., Holmes S. (2014). Waste not, want not: why rarefying microbiome data is inadmissible. PloS Comput. Biol. 10, e10035315. doi: 10.1371/journal.pcbi.1003531
Mizrahi I., Jami E. (2018). Review: the compositional variation of the rumen microbiome and its effect on host performance and methane emission. Animal 12, s220–s232. doi: 10.1017/S1751731118001957
Morgavi D. P., Forano E., Martin C., Newbold C. J. (2010). Microbial ecosystem and methanogenesis in ruminants. Animal: Int. J. Anim. Bioscience 4, 1024–1036. doi: 10.1017/S1751731110000546
Muizelaar W., Bani P., Kuhla B., Larsen M., Tapio I., Yáñez-Ruiz D. R., et al. (2020). “Rumen fluid sampling via oral stomach tubing method,” in Methods in cattle physiology and behaviour research. Eds. Mesgaran S. D., Baumont René, Munksgaard L., Humphries D., Kennedy E., Dijkstra J., Dewherst R., Ferguson H., Terré M., Kuhla Björn (Leibniz Institute for Farm Animal Biology (FBN, Dummerstorf). doi: 10.5680/mcpb008
Oksanen J. F., Blanchet G., Kindt R., Legendre P., Minchin P. R., O’Hara R. B., et al. (2012). Vegan: community ecology package. Available at: http://CRAN.R-project.org/package=vegan.
Pasinato S., Ferrero F., Rolando G., Comino L., Tabacco E., Borreani G. (2023). A living lab approach for sustainable intensification of dairy production: A case study of an organic and a conventional farm in northern Italy. Eur. J. Agron. 149, 126904. doi: 10.1016/j.eja.2023.126904
Patra A., Park T., Kim M., Yu Z. (2017). Rumen methanogens and mitigation of methane emission by anti-methanogenic compounds and substances. J. Anim. Sci. Biotechnol. 8, 135. doi: 10.1186/s40104-017-0145-9
Pausan M. R., Csorba C., Singer G., Till H., Schöpf V., Santigli E., et al. (2019). Exploring the archaeome: detection of archaeal signatures in the human body. Front. Microbiol. 10. doi: 10.3389/fmicb.2019.02796
Quast C., Pruesse E., Yilmaz P., Gerken J., Schweer T., Yarza P., et al. (2013). The SILVA ribosomal RNA gene database project: improved data processing and web-based tools. Nucleic Acids Res. 41, D590–D596. doi: 10.1093/nar/gks1219
Quinn T. P., Erb I., Gloor G., Notredame C., Richardson M. F., Crowley T. M. (2019). A field guide for the compositional analysis of any-omics data. GigaScience 8, giz107. doi: 10.1093/gigascience/giz107
Ramayo-Caldas Y., Zingaretti L., Popova M., Estellé J., Bernard A., Pons N., et al. (2020). Identification of rumen microbial biomarkers linked to methane emission in holstein dairy cows. J. Anim. Breed. Genet. 137, 49–59. doi: 10.1111/jbg.12427
R Core Team (2020). Methodology reference (Vienna, Austria: European Environment Agency). Available at: https://www.eea.europa.eu/data-and-maps/indicators/oxygen-consuming-substances-in-rivers/r-development-core-team-2006 (Accessed January 11, 2025).
Rinne M., Jaakkola S., Huhtanen P. (1997). Grass maturity effects on cattle fed silage-based diets. 1. Organic matter digestion, rumen fermentation and nitrogen utilization. Anim. Feed Sci. Technol. 67, 1–17. doi: 10.1016/S0377-8401(96)01141-8
Roehe R., Dewhurst R. J., Duthie C.-A., Rooke J. A., McKain N., Ross D. W., et al. (2016). Bovine host genetic variation influences rumen microbial methane production with best selection criterion for low methane emitting and efficiently feed converting hosts based on metagenomic gene abundance. PloS Genet. 12, e1005846. doi: 10.1371/journal.pgen.1005846
Shabat S. K. B., Sasson G., Doron-Faigenboim A., Durman T., Yaacoby S., Berg Miller M. E., et al. (2016). Specific microbiome-dependent mechanisms underlie the energy harvest efficiency of ruminants. ISME J. 10, 2958–2725. doi: 10.1038/ismej.2016.62
Shi W., Moon C. D., Leahy S. C., Kang D., Froula J., Kittelmann S., et al. (2014). Methane yield phenotypes linked to differential gene expression in the sheep rumen microbiome. Genome Res. 24, 1517–1525. doi: 10.1101/gr.168245.113
Sorbara M. T., Littmann E. R., Fontana E., Moody T. U., Kohout C. E., Gjonbalaj M., et al. (2020). Functional and genomic variation between human-derived isolates of lachnospiraceae reveals inter- and intra-species diversity. Cell Host Microbe 28, 134–1465.e4. doi: 10.1016/j.chom.2020.05.005
Su J., Ji W., Sun X., Wang H., Kang Y., Yao B. (2023). Effects of different management practices on soil microbial community structure and function in alpine grassland. J. Environ. Manage. 327, 116859. doi: 10.1016/j.jenvman.2022.116859
Tapio I., Snelling T. J., Strozzi F., Wallace J. (2017). The ruminal microbiome associated with methane emissions from ruminant livestock. J. Anim. Sci. Biotechnol. 8, 7. doi: 10.1186/s40104-017-0141-0
Thévenot E. A., Roux A., Xu Y., Ezan E., Junot C. (2015). Analysis of the human adult urinary metabolome variations with age, body mass index, and gender by implementing a comprehensive workflow for univariate and OPLS statistical analyses. J. Proteome Res. 14, 3322–3355. doi: 10.1021/acs.jproteome.5b00354
Totty V. K., Greenwood S. L., Bryant R. H., Edwards G. R. (2013). Nitrogen partitioning and milk production of dairy cows grazing simple and diverse pastures. J. Dairy Sci. 96, 141–149. doi: 10.3168/jds.2012-5504
Ungerfeld E. M. (2020). Metabolic hydrogen flows in rumen fermentation: principles and possibilities of interventions. Front. Microbiol. 11. doi: 10.3389/fmicb.2020.00589
Wallace R.J., Rooke J. A., McKain N., Duthie C.-A., Hyslop J. J., Ross D. W., et al. (2015). The rumen microbial metagenome associated with high methane production in cattle. BMC Genomics 16, 8395. doi: 10.1186/s12864-015-2032-0
Keywords: dairy cattle, emission, GreenFeed system, living lab, methane, microbiome, rumen
Citation: Roques S, Koning L, Bossers A, van Gastelen S, Schokker D, Zaccaria E, Šebek L and Kar SK (2025) Farm conditions shape microbial communities and their association with methane intensity in dairy cattle: insights from the rumen microbiome at the community level. Front. Microbiomes 4:1540197. doi: 10.3389/frmbi.2025.1540197
Received: 05 December 2024; Accepted: 08 April 2025;
Published: 30 April 2025.
Edited by:
Mohaddaseh Ramezani, Iranian Biological Resource Center (IBRC), IranReviewed by:
Santiago Cadena, Autonomous University of the State of Morelos, MexicoHualong Hong, Xiamen University, China
Copyright © 2025 Roques, Koning, Bossers, van Gastelen, Schokker, Zaccaria, Šebek and Kar. This is an open-access article distributed under the terms of the Creative Commons Attribution License (CC BY). The use, distribution or reproduction in other forums is permitted, provided the original author(s) and the copyright owner(s) are credited and that the original publication in this journal is cited, in accordance with accepted academic practice. No use, distribution or reproduction is permitted which does not comply with these terms.
*Correspondence: Soumya K. Kar, c291bXlhLmthckB3dXIubmw=
†Present address: Simon Roques, Université Clermont Auvergne, INRAE, VetAgro Sup, UMR Herbivores, Saint-Genes-Champanelle, France
‡These authors have contributed equally to this work