 Yuting Zhu
 Leanne C. Powers
 David J. Kieber
 William L. Miller
- 1Wadsworth Center, New York State Department of Health, Albany, NY, United States
- 2Department of Chemistry, State University of New York College of Environmental Science and Forestry, Syracuse, NY, United States
- 3Department of Marine Sciences, University of Georgia, Athens, GA, United States
Hydrogen peroxide (H2O2) is an important reactive oxygen species (ROS) in natural waters, affecting water quality via participation in metal redox reactions and causing oxidative stress for marine ecosystems. While attempts have been made to better understand H2O2 dynamics in the global ocean, the relative importance of various H2O2 sources and losses remains uncertain. Our model improves previous estimates of photochemical H2O2 production rates by using remotely sensed ocean color to characterize the ultraviolet (UV) radiation field in surface water along with quantitative chemical data for the photochemical efficiency of H2O2 formation. Wavelength- and temperature-dependent efficiency (i.e., apparent quantum yield, AQY) spectra previously reported for a variety of seawater sources, including coastal and oligotrophic stations in Antarctica, the Pacific Ocean at Station ALOHA, the Gulf of Mexico, and several sites along the eastern coast of the United States were compiled to obtain a “marine-average” AQY spectrum. To evaluate our predictions of H2O2 photoproduction in surface waters using this single AQY spectrum, we compared modeled rates to new measured rates from Gulf Stream, coastal, and nearshore river-outflow stations in the South Atlantic Bight, GA, United States; obtaining comparative differences of 33% or less. In our global model, the “marine-average” AQY spectrum was used with modeled solar irradiance, together with satellite-derived surface seawater temperature and UV optical properties, including diffuse attenuation coefficients and dissolved organic matter absorption coefficients estimated with remote sensing-based algorithms. The final product of the model, a monthly climatology of depth-resolved H2O2 photoproduction rates in the surface mixed layer, is reported for the first time and provides an integrated global estimate of ∼21.1 Tmol yr−1 for photochemical H2O2 production. This work has important implications for photo-redox reactions in seawater and improves our understanding of the role of solar irradiation on ROS cycling and the overall oxidation state in the oceans.
1 Introduction
It is well established that oxidation and reduction (redox) reactions control biogeochemical processes and affect water quality in the environment (Kieber et al., 2003; Morel and Price, 2003; Learman et al., 2011). Early work provided the first theoretical evidence that the redox potential of seawater is controlled exclusively by the oxygen (O2) system (Cooper, 1937). Since then, a great deal of work has generally confirmed that if present, the O2 system has essential roles in controlling redox chemistry in the ocean (Keeling et al., 2009; Lu et al., 2018; Zhang et al., 2018). While the oxygen-water redox pair controls redox conditions over long-geological timescales, the situation is more complex, especially on timescales at which many biogeochemical processes occur (Rose, 2016). Along the four-electron pathway between oxygen and water are a set of reactive oxygen species (ROS), namely superoxide (O2−), hydrogen peroxide (H2O2) and hydroxyl radical (OH•), that individually participate in critical redox chemistry (Petasne and Zika, 1987; Sawyer, 1991; Wuttig et al., 2013; Sutherland et al., 2021), and ultimately have significant impacts on the biogeochemical cycling of essential trace elements and reduced carbon in the ocean (Zepp et al., 1992; Scully et al., 2003; White et al., 2003; Rose and Waite, 2006; Rose, 2016). The low seawater concentrations of these ROS (at fM to nM levels) reflect a balance of sources and sinks for each ROS in the system, revealing just how fast the redox cycle spins (Haag and Hoigne, 1986; Mopper and Zhou, 1990; Goldstone and Voelker, 2000).
In marine surface waters, photochemical reactions participate in redox chemistry by creating a diverse blend of oxidized and reduced chemical products (Andrews et al., 2000; Sharpless and Blough, 2014). The absorption of ultraviolet radiation (UVR; 290–400 nm) by chromophoric dissolved organic matter (CDOM) initiates photochemical reactions in the ocean (Mopper et al., 2015). Many of these photochemical reactions involve molecular oxygen, leading to the formation of an array of ROS, including those mentioned above (O2−, H2O2, and OH•) and singlet oxygen (Kieber et al., 2003; White et al., 2003; Rose and Waite, 2006; Kieber et al., 2014; Powers and Miller, 2015a; Ossola et al., 2021). The generation of these redox-active species is ubiquitous in sunlight-irradiated waters containing CDOM, with photochemical ROS production rates dependent on the solar photon flux, absorbance of solar energy, and photochemical reaction efficiency (Cooper and Zika, 1983; Kieber et al., 2014; Powers and Miller, 2014, 2016; Ossola et al., 2021).
In aquatic environments, H2O2 is important 1) in the degradation and indirect photobleaching of CDOM and organic pollutants (Goldstone et al., 2002; Scully et al., 2003), 2) in the redox cycling of biologically important trace metals (Moffett and Zika, 1987; Voelker and Sulzberger, 1996; Kieber et al., 2003; Miller et al., 2009), and 3) as an oxidative stress in aquatic ecosystems (Kieber et al., 2003; Zepp et al., 2003; Clark et al., 2008; Morris et al., 2011). H2O2 has been widely studied not only due to its biogeochemical reactivity, but also due to its greater concentration and stability relative to other ROS (O’Sullivan et al., 2005). However, it is O2− that represents the initial electron transfer to O2 and subsequently serves as the photochemical precursor for H2O2. O2− is especially interesting because it can act as either an oxidant or a reductant, depending on the chemical encounter. If it reacts via an oxidative pathway it returns to the dissolved O2 pool and again participates in oxidative reactions just like it always did. If it reacts via a reductive pathway, however, it can result in the production of H2O2, then OH• and eventually water with a net “consumption” of O2 (Sutherland et al., 2020). In this way, the production and reactive pathways for O2− in seawater serve as crucial controlling factors for many biological and chemical cycles in the photic zone (Rose, 2016).
There is good evidence for widespread dark extracellular O2− and H2O2 production by marine microorganisms (Diaz et al., 2013), confounding the long held idea that photochemistry is the primary marine source of O2−, and therefore, H2O2 in sunlit surface waters. A compilation of O2− production rates by marine cyanobacteria, phytoplankton, and heterotrophic bacteria suggests a marine biological oxygen sink amounting to 15–50% of the net oxygen production (Sutherland et al., 2020). Given that this estimate was not corrected for the much colder waters and slower biological rates in the deep dark ocean, as well as observations that H2O2 concentrations are negligible below the surface mixed layer, it is almost certainly an overestimate. However, the contribution of these known biological sources for ROS relative to abiotic photochemical production in sunlit surface waters remains unresolved. Furthermore, measured biological O2− rates are by definition “net” production rates and are typically determined in the absence of solar radiation (Diaz et al., 2013; Sutherland et al., 2020). It is currently unclear what, if any, changes in observed rates and pathways result from sunrise turning the nighttime into the day, with its myriad of UVR-generated chemical transients. While reduction (via catalase or peroxidase) is typically the dominant pathway for H2O2 decay, oxidation pathways have been reported to exceed reduction in some surface coastal waters, suggesting contribution of unknown abiotic or metabolic pathways (Sutherland et al., 2021). Photochemical O2− measurements may also be flawed, since they are often estimated using steady-state O2− concentrations in sunlit waters and dark decay rates (Powers et al., 2015). It is clear that decay rates in sunlit waters are not well defined and quantitative data are sorely needed. Thus, our current understanding of these critical reactions required for accurate modeling of the redox state of the surface ocean remains incomplete.
Despite the uncertainties previously discussed, an evaluation of surface ocean photochemical O2− and H2O2 production rates based on the current state of the science is warranted. Powers and Miller (2014) presented a method to estimate global ocean photochemical H2O2 and O2− production using modeled solar irradiances and remotely sensed ocean color and temperature. However, depth-resolved rates were not calculated nor were error estimates presented. In this work, we improve upon this initial method in several ways. Notably the spectral efficiency of H2O2 photoproduction used in previous studies, represented by the apparent quantum yield (AQY) spectrum, was previously based on extended irradiations that likely resulted in an underestimate of AQY due to a lack of reciprocity (Powers and Miller, 2014). Here we update H2O2 photoproduction models using only AQY spectra determined when H2O2 accumulation rates are within a linear range (Kieber et al., 2014). Furthermore, Powers and Miller (2014) used a 2:1 stoichiometric ratio for O2−:H2O2 production based on an assumption that O2− dismutation adequately describes the relationship between O2− and H2O2 in open ocean seawater (Powers and Miller, 2014). Subsequently, direct, simultaneous measurements of O2− and H2O2 photoproduction rates for waters from deep profiles in the Gulf of Alaska revealed an average stoichiometry of 4:1, but with a large range between samples from the surface, 1,000 m, and just above the seafloor (Powers et al., 2015). Most relevant here, the ratio between O2− and H2O2 photoproduction rates for surface waters was highest, averaging 10.1 ± 5.4 or 13.8 ± 6.7 comparing rates normalized to CDOM absorbance (Powers et al., 2015). Work relating the photoproduction of one-electron reductants, the precursors for O2− and H2O2, also suggests that the ratio between O2− and H2O2 photoproduction is well above 2, ranging from 6—16 in a variety of natural and synthetic water samples (Zhang and Blough, 2016; Le Roux et al., 2021). These results are not surprising since the oxidation of O2− to O2 is more thermodynamically favorable than reduction to H2O2 in conditions present in most surface waters (Sawyer, 1991; Rose, 2016).
Most importantly, photochemical rates in the surface ocean depend on the light available and the absorbance of that light by CDOM. Previous models of oceanic UV attenuation estimated from remotely sensed ocean color have assumed that the fraction of attenuation due to CDOM is 0.68 at 320 nm, a value determined by Fichot and Miller (2010) using a large open ocean data set. However, this average ratio must be extrapolated spectrally and can deviate greatly depending on dissolved water constituents and suspended particles (Cao et al., 2018; Zhu and Kieber, 2020). Algorithms that compute diffuse attenuation coefficients (Kd(λ)) (Fichot et al., 2008; Cao et al., 2014) and CDOM absorption coefficients (ag(λ)) independently (Cao and Miller, 2015) allow for a more robust estimate of the light available for CDOM-initiated photochemical reactions in the surface ocean. This is especially true in complex inshore waters, where modeled photochemical rates can vary ± 100% between those that use this average ag(λ)/Kd(λ) ratio and those using ag(λ) and Kd(λ) determined separately to calculate a specific ratio for each pixel (Cao et al., 2018). We previously assumed that these extreme differences in rates were not a problem for global ocean models (Powers and Miller, 2014), but ag(λ)/Kd(λ) for UV wavelengths can be much greater than 0.7 (Johannessen, 2003) and recent work demonstrated that modeled ag(λ)/Kd(λ) ratios exhibited a large range in the open ocean (Zhu and Kieber, 2020). These updates were used along with recent experimental data to provide new constraints on the magnitude of photochemical O2− and H2O2 production in the marine environment.
2 Materials and methods
2.1 Sample collection
Surface seawater (5 m) samples were collected at three stations in the South Atlantic Bight (SAB) aboard the R/V Savannah in March 2018. The geographic locations of the sampling stations are depicted in Figure 1. All samples were 0.2 μm gravity-filtered (Whatman Polycap 36AS) directly from Niskin bottles into combusted (4 h at 500°C) 1 L borosilicate glass bottles (Kimax). All tubing, filters, and bottle caps were pre-cleaned with dilute (0.1 M) HCl and rinsed several times with 18.2 MΩ cm Milli-Q water (Millipore). Bottles were rinsed three times with filtered sample before final collection. Samples were irradiated within hours of collection, or within 1–2 days prior to an experiment. Samples not irradiated immediately after collection were stored at 4°C until use. Because many H2O2 photoproduction rates and AQY measurements have been made on stored samples (Kieber et al., 2014; Powers and Miller, 2014), shipboard irradiations were also conducted to determine H2O2 time-dependent photoproduction rates using freshly collected samples. These experiments were also used to assess how well modeled photoproduction rates predicted measured rates in freshly collected samples.
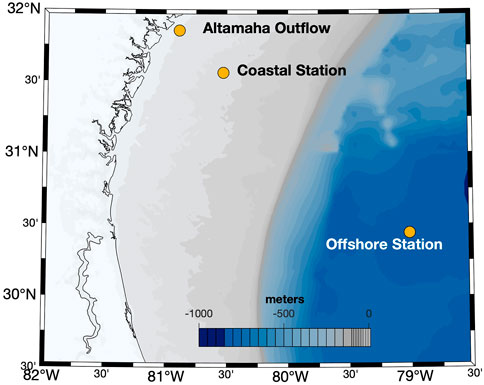
FIGURE 1. Locations of the sampling stations in the South Atlantic Bight. Bathymetry and topography data from the Global Self-consistent, Hierarchical, High-resolution Geography Database (GSHHG) were plotted using the m_map package for Matlab® (Pawlowicz, 2020). Water-column color coding indicates the depth in meters.
2.2 Laboratory H2O2 determination
H2O2 concentrations in seawater samples (including irradiated samples and dark controls) were measured with a flow injection analysis (FIA) chemiluminescence (CL) system (Waterville Analytical, FeLume) using methods described in detail previously (King et al., 2007; Powers et al., 2015). Briefly, the carrier solution (0.2 M HCl) and chemiluminescent reagent, 2 μM 10-methyl-9-(p-formylphenyl)acridinium carboxylate trifluoromethanesulfonate (AE), were mixed and pumped to a spiral flow cell (Global FIA) using a peristaltic pump (Rainin). A ∼0.2 ml sample loop was filled by syringe and the sample was introduced to the carrier stream using a 10-port valve (VICI). The sample and carrier–AE solution mixed with 0.1 M carbonate buffer (pH 10.4) to initiate CL in the flow cell, which was situated below a photomultiplier tube (PMT; Hamamatsu HC135 PMT, 900 V, 400 ms integration). The PMT signal was recorded using Waterville Analytical software (LabView); 3—5 injections were repeated per sample. The FIA system was calibrated with H2O2 standards prepared in seawater using a 2 mM H2O2 stock solution diluted from 30% H2O2 (J.T. Baker), with concentrations confirmed using its absorbance at 240 nm and a molar absorptivity of 38.1 M−1 cm−1 (Miller and Kester, 1988).
2.3 Photochemical experiments
Photochemical experiments were conducted onboard the R/V Savannah with a Suntest CPS solar simulator (Atlas) equipped with a 1.5 kW Xenon lamp and a daylight filter to limit irradiation below 290 nm. These photochemical experiments were conducted to test for linearity in H2O2 photoproduction and to compare rates measured using freshly collected samples with those modeled as described in Sections 3.2, 3.4. Prior to irradiation, seawater samples were partitioned into 15 matched 10 cm cylindrical quartz spectrophotometric cells (Spectrocell) at room temperature. Cells were filled with no headspace and sealed using gas-tight screw caps with Teflon-faced butyl rubber septa. To ensure reproducible and quantifiable light exposures, cells were oriented vertically directly below the solar simulator in a black, anodized, water-cooled aluminum irradiation block. This block allowed no transfer of light between cells. The block was fitted with a half-inch thick grey PVC lid with 1.6 cm diameter holes centered directly above each cell window to remove residual off-axis photons and maximize collimated radiation within the cell, thus ensuring a reproducible and known pathlength for calculations (Powers and Miller, 2015b). The block was maintained at 20°C using a circulating water bath and cells were removed at various time points throughout each experiment to measure H2O2 and determine rates. One dark control was kept in the block and shielded from light while all other dark controls were kept in the water bath.
The spectral downwelling irradiance (
where
where S is the irradiated surface area (m2) and
2.4 Global photochemical model
In general, we followed the methods outlined in Fichot and Miller (2010) and Zhu and Kieber (2020) for global photochemical flux estimates. Briefly, H2O2 photochemical production rates (
where
We followed Zhu and Kieber (2020) and Cao et al. (2018) for the remote sensing retrievals of
The SMARTS 2.9.5 model (Gueymard, 2001) was used to calculate monthly climatologies of the daily integrated spectral solar irradiance just above the sea surface under clear skies (
For H2O2 photoproduction, Kieber et al. (2014) compared AQYs from a variety of seawater sources, including coastal and oligotrophic stations in Antarctica, the Pacific Ocean at Station ALOHA, the Gulf of Mexico, and several sites along the eastern coast of the United States. They found that AQYs exhibited limited variability for all regions studied when corrected for temperature. For our H2O2 photochemical production estimates, the following equation was used to estimate wavelength-dependent AQYs at 25°C:
The AQY spectrum in Eq. 5 was obtained from non-linear regression analyses of combined AQY data from all seawater sources studied by Kieber et al. (2014).
Temperature-dependent AQY (
where R is the universal gas constant (8.314 × 10⁻³ kJ mol−1 K−1) and T is the temperature (K). For our global estimate,
3 Results
3.1 H2O2 photoproduction in the South Atlantic Bight
H2O2 photoproduction rates were determined from the differences between H2O2 concentrations in irradiated seawater samples and dark controls. Changes in photoproduced [H2O2] were examined during prolonged irradiations of filtered seawater collected from three stations in the SAB (Figure 2). These samples, designated as Altamaha Outflow, Coastal, and Offshore Stations provided a gradient from colored inshore to blue offshore water samples for the shipboard irradiations used to test our model’s accuracy in different CDOM domains. These samples had average
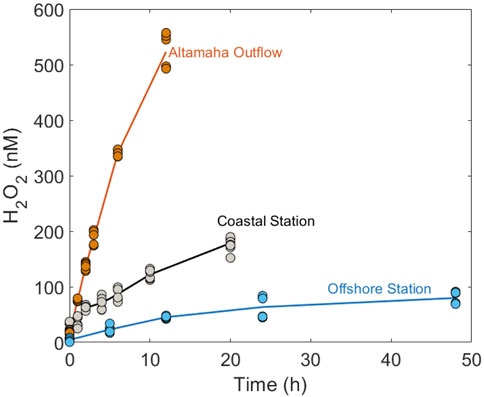
FIGURE 2. Photoproduced H2O2 versus irradiation time (h) for samples collected in the South Atlantic Bight in March 2018.
Previously, it was shown that the photoproduction of H2O2, as well as several other CDOM photoproducts (including CO, CO2, and carbonyl compounds), is a nonlinear function of the light exposure time (Kieber et al., 2014; Powers and Miller, 2015b; Zhu and Kieber, 2018). Similarly, nonlinear accumulation was observed here for H2O2 photoproduction in seawater from the Altamaha Outflow, Coastal, and Offshore Stations (Figure 2), occurring at
Under natural sunlight, the transition to non-linear H2O2 photoproduction should occur only after 1–2 days of exposure or more. This is because the daily downwelling solar irradiation in mid-latitude regions of NW Atlantic entering the ocean is ∼ three times less than the daily-integrated irradiation output of the 1.5 kW Xenon lamp used in our shipboard irradiations. Furthermore, downwelling UV irradiance decreases exponentially with depth (Fichot and Miller, 2010; Zhu and Kieber, 2019). Depending on CDOM, MLD, and surface mixing rates, the average
3.2 Natural variability and errors associated with AQYs
For H2O2 photoproduction, a single “marine-average” AQY spectrum (Eq. 5) derived by Kieber et al. (2014) from a large variety of seawater sources, was used to model global photochemical production rates. As a limited test for its general applicability, we used this same average AQY to predict H2O2 production rates in our SAB samples. All wavelength-dependent AQY data reported by Kieber et al. (2014) and the “marine-average” AQY spectrum are shown in Figure 3A. The “marine-average” AQY spectrum is not statistically different from the AQY spectrum obtained using pooled AQY data in the Caribbean Sea, Orinoco River outflow (Venezuela), Suwanee River (Georgia, United States), Vineyard Sound (Massachusetts, United States), Shark River outflow (Florida, United States), and the Antarctic (Yocis et al., 2000). Here we also compare the “marine-average” AQY to the AQY spectra measured for the SAB by Powers and Miller (2016) (Figure 3A). For direct comparison with Powers and Miller (2016), the Kieber et al. (2014) “marine-average” AQY spectrum was fit to the following equation:
where m1 and m2 are the fitting parameters obtained by fitting AQY data to Eq. 7. The fitting parameters with the 95% CI for AQY reported in Kieber et al. (2014) and Powers and Miller (2016) are presented in Table 1. As seen in Table 1, m2 from the two studies are not significantly different, given the overlap in the 95% CI for m2. A significant difference was observed for m1 after a temperature correction (from 20°C to 25°C) was applied to the Powers and Miller (2016) AQY data. The difference in m1 translates to a 23% difference in
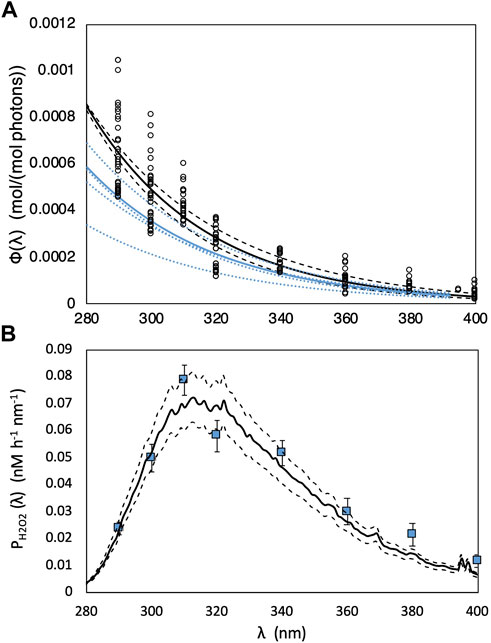
FIGURE 3. (A) “Marine-average” AQY spectrum [Φ(λ)] versus wavelength (λ; nm) (solid black line) computed from all measured monochromatic AQY data at 25°C reported in Kieber et al. (2014) (black open dots). Dashed black lines are the modeled AQY spectrum calculated using upper and lower limits of m1 and m2 in Table 1. The solid blue line shows pooled Φ(λ) computed from polychromatic AQY data reported in Powers and Miller (2016). Φ(λ) from individual experiments reported in Powers and Miller (2016) are depicted with blue dotted lines. (B) Simulated H2O2 photoproduction rates (
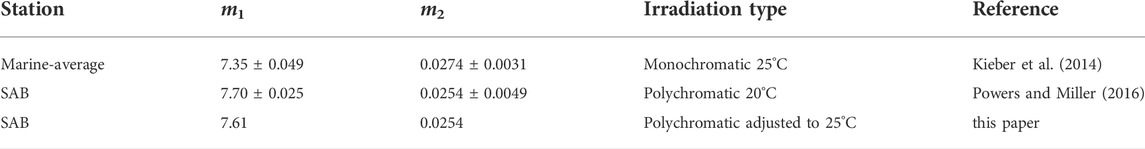
TABLE 1. Comparison between AQY parameters in Powers and Miller (2016) and the “marine-average” AQY parameters used in the global model. For monochromatic irradiations, AQY parameters were derived by a nonlinear regression of AQY versus λ. Uncertainties listed for m1 and m2 represent the margin of error with 95% confidence level. For polychromatic data, the parameters were determined using a non-linear curve-fitting routine in Matlab® (nlinfit), to solve for the best-fit equation to describe all light treatment data.
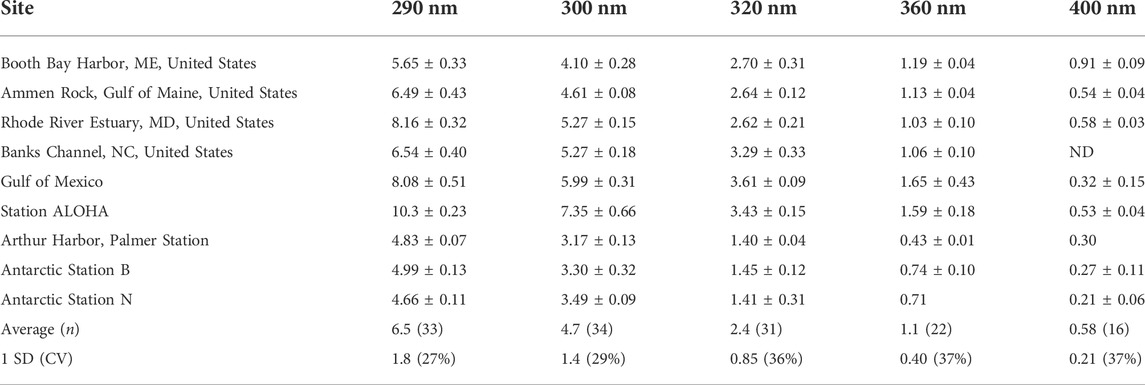
TABLE 2. Summary of marine H2O2 Φ(λ) data [×10–4 mol/(mol photons)] determined at 25°C (Kieber et al., 2014) ± 1 SD, when available. ND is not determined.
To assess the natural variability associated with wavelength-dependent AQYs, a summary of measured
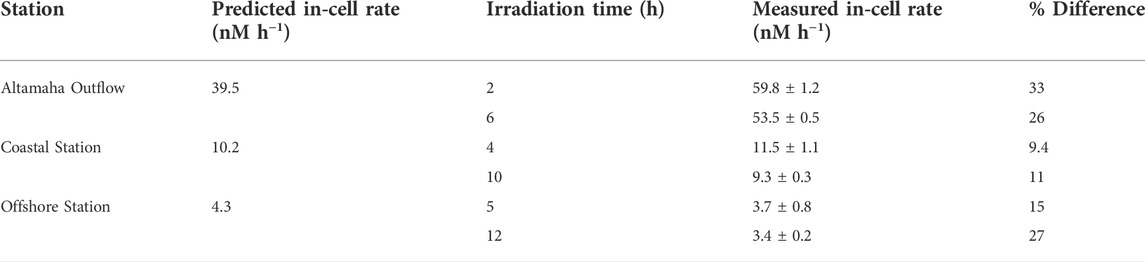
TABLE 3. Predicted H2O2 photoproduction rates in the quartz irradiation cells using the “marine-average” AQY and measured H2O2 photoproduction rates (± 1 SD) in filtered water samples at two time points. % differences between measured and predicted rates are also listed.
To further justify the use of the “marine-average” AQY in our global estimates, we compared measured H2O2 photoproduction rates in our SAB samples to those predicted using the “marine-average” AQY (
3.3 Errors associated with apparent quantum yield temperature adjustments using Ea
Natural variability was observed when fitting the Arrhenius equation to H2O2 data used to determine
where Ap is a pre-exponential factor, R is the universal gas constant (8.314 × 10⁻³ kJ mol−1 K−1), and T is temperature (K). The
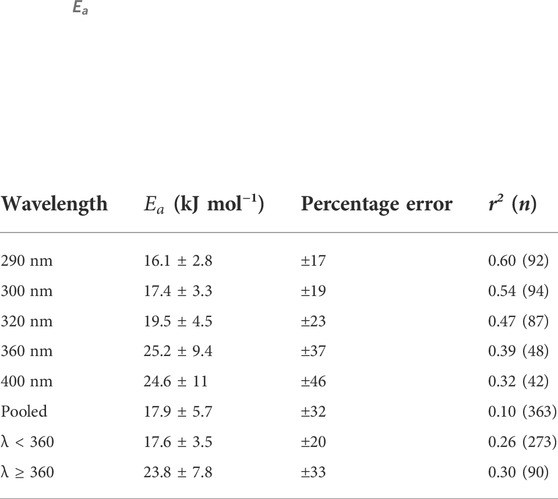
TABLE 4.
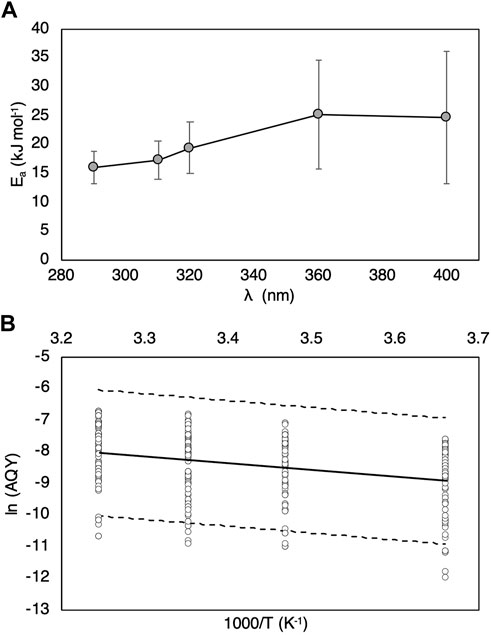
FIGURE 4. (A) Average activation energies (
3.4 Modeled depth-dependent H2O2 photoproduction
Monthly climatologies of H2O2 photochemical production rates were determined at z = 0, 1, and 20 m using Eq. 4. Corresponding global maps of computed photoproduction rates are presented in Figure 5. We show global maps for February, May, August, and November, as representatives for the spatial variability of H2O2 photoproduction rates during each season. Global maps for
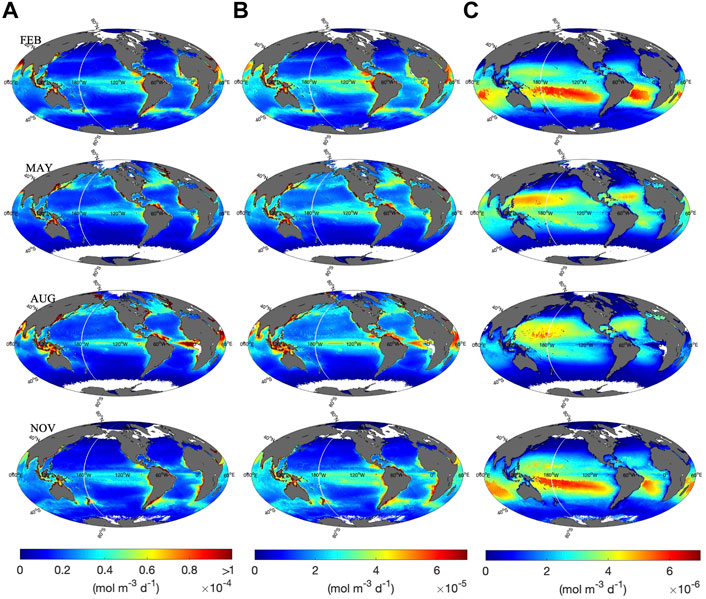
FIGURE 5. Calculated H2O2 photoproduction rates at (A) 0 m, (B) 1 m, and (C) 20 m in February, May, August and November. Note the difference in scale between (A–C). White indicates no data.
In surface waters, the spatial and vertical distribution of the modeled H2O2 photoproduction rate is similar to that observed for carbonyl compounds (Zhu and Kieber, 2020). In particular, the spatial distribution was mainly controlled by UV irradiance, the CDOM absorption coefficient and seawater temperature. High CDOM-absorbing coastal and upwelling areas exhibited the highest H2O2 photoproduction rates at 0 and 1 m (Figure 5). Equatorial waters also exhibited relatively high H2O2 photoproduction rates among open-ocean waters, due to their relatively high SST, upwelling in the equatorial eastern Pacific and the equatorial eastern Atlantic, as well as the high abundance of UV exposure. At mid-to high-latitudes, higher H2O2 photoproduction rates were found during the summer (e.g., August in the Northern Hemisphere) as compared to the winter (e.g., February in the Northern Hemisphere). The vertical distribution of H2O2 photoproduction rate in the water column was controlled by the exponential attenuation of UV radiation in the water column, resulting in H2O2 photoproduction rates at 20 m that were ∼1–2 orders of magnitude lower than rates computed for the same location at 0 m. As expected, higher H2O2 photoproduction rates were calculated for oligotrophic waters at 20 m compared to coastal and upwelling regions, due to deeper penetration of UV radiation compared to high CDOM-absorbing waters (Supplementary Figure S3).
Monthly 11-year (2007–2017) averaged estimates of H2O2 photoproduction rates at 0 m (computed with Eq. 4) are compared to previous literature reports of in situ H2O2 photoproduction rates to further evaluate our global model. Here we focus on low CDOM-absorbing waters in the open ocean that cover the majority of the surface area of the global oceans. Kieber et al. (2014) reported a daily H2O2 photoproduction rate of 72 nM d−1 at an oligotrophic station near 40 °N 70 °W in July 1999. By comparison, our modeled H2O2 photoproduction rate at 0 m for this location was 64 nM d−1 in July, only a 12% difference between the measured and climatologically modeled rate using an average marine AQY. This is within the ±33% error previously determined comparing our measured and predicted H2O2 photoproduction rates (Section 3.2). In Antarctic waters, Yocis et al. (2000) reported 2.4–3.5 nM h−1 in situ photoproduction rates near 60° S 55° W in summer, which translates to ∼24–35 nM d−1 assuming that the daily integrated photon flux equals ten times the hourly photon flux measured during the incubation experiment. Our modeled rate for this location is 17 nM d−1 in December and is ∼29% lower than the measured range. At our Offshore Station (near 30° N 79° W) in the SAB, we measured a 3.7 nM h−1 H2O2 photoproduction rate in March using a solar simulator with an integrated photon flux of 0.36 mol photons m−2 h−1. For this location, integrating
A reasonable agreement between modeled and measured H2O2 photoproduction rates was also reported by Powers and Miller, (2014). The estimated H2O2 photoproduction rate at 1 m from this previous modeling effort was 63 nM d−1 at 40 °N 70 °W in July, and 32.5 nM d−1 at 55° S 55° W in December. In the present study, our modeled H2O2 photoproduction rates at 1 m isodepth are 49.4 nM d−1 at 40 °N 70 °W in July, and are 24.4 nM d−1 at 55° S 55° W in December. The ∼30% difference between estimated photoproduction rates from the two models is within the ±36% error that is associated with the natural variability of AQYs at 320 nm (Table 2).
3.5 Depth-integrated H2O2 photoproduction fluxes
Global maps depicting depth-integrated H2O2 photoproduction fluxes in the surface mixed layer (
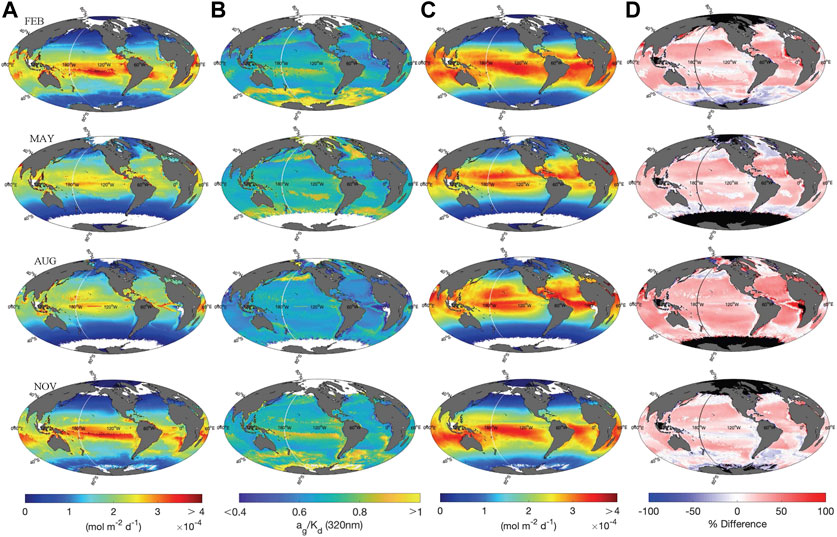
FIGURE 6. (A) Global maps of
To directly compare our photochemical model with several previous studies that used a constant
where
Hövemoller diagrams depicting average and median monthly variations of
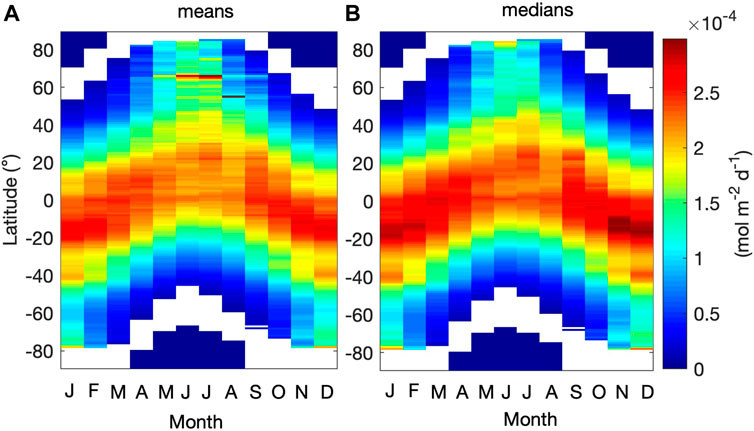
FIGURE 7. Hövemoller diagrams comparing the monthly (A) average and (B) median values of
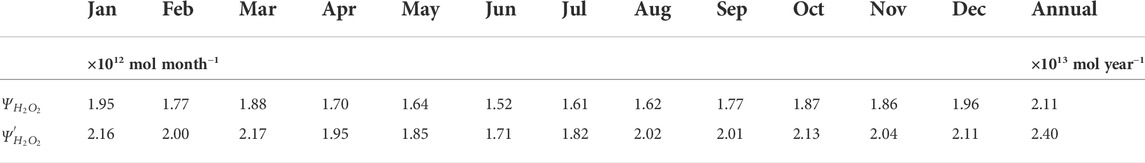
TABLE 5. Estimated monthly and annually integrated H2O2 photoproduction budgets (
For our annual H2O2 photoproduction budget estimate, errors contributed by uncertainties in model inputs were evaluated following the approach used by previous global photochemical models (Fichot and Miller, 2010; Zhu and Kieber, 2020). As discussed in Section 3.2, wavelength-dependent AQYs exhibited natural variability and we expect that the errors associated with the wavelength- and temperature-dependent AQYs are within 33% and 32%, respectively. In our global model, pooled fitting parameters for the “marine-average” AQY equation and an average value of
4 Discussion
4.1 Comparison of photochemical and biological H2O2 production
Results from this study can be used to compare photochemical and biological production of H2O2 in the marine environment. Palenik and Morel (1988) found evidence of a biological H2O2 source between 40 and 60 m in the Sargasso Sea, which they estimated to be on the order of 1–3 nM h−1. Subsequent work in the Gulf of Alaska near Kodiak Island reported biological H2O2 production rates ranging from 1.1—1.9 nM h−1 in samples collected at 10 m based on H2O2-spiking experiments and modeling results (Vermilyea et al., 2010). Using a similar approach, Roe et al. (2016) found average biological H2O2 production rates at Station ALOHA to be 1.2 ± 0.9 nM h−1 at 25 m, 0.5 ± 0.2 nM h−1 at 75 m, and 0.1 ± 0.1 nM h−1 at the deep chlorophyll maximum, approximately 105–130 m. Intriguingly, biological O2− production rates were variable and generally lower in the same samples, amounting to 0.25 ± 0.14 nM h−1 at 25 m and 0.11 ± 0.25 at 75 m corresponding to the deep chlorophyll maximum (Roe et al., 2016). This implies that biologically produced H2O2 cannot result exclusively from extracellular dismutation. Recent work evaluated H2O2 production during incubations of 12 strains of representative marine bacteria and found a large range in rates from below detection to 300 amol cell−1 h−1 (Bond et al., 2020). In comparing these rates to reported O2− production rates from the same bacteria, some species had rates of O2− and H2O2 that were comparable in magnitude, while others were different by orders of magnitude, again suggesting that the mechanisms whereby these two ROS are released to seawater may not be quantitively linked in biological systems and thus estimates that H2O2 is contributed to open ocean surface seawater at a rate of ∼0.15 nM h−1 may be most reasonable (Bond et al., 2020).
If we consider a biological H2O2 production from 0.1—1 nM h−1 and a surface area of the ocean of 3.62 × 10¹⁴ m2 (Charette and Smith, 2010), a very crude calculation of the biological production of H2O2 in the top 100 m yields an annual production of ∼ 32–320 Tmol yr−1. The lower end of this range is similar to our modeled H2O2 photoproduction estimate. However, this crudely calculated biological H2O2 production assumes a constant production rate determined from a limited number of ecological settings and species, so consequently, may vary significantly if evaluated for another time or another place. Global production estimates would likely decrease significantly if temperature dependence is considered, given that temperature typically decreases rates of biological activities (Crichton et al., 2021; Sarmento et al., 2010), e.g., by a factor of ∼2 for every 10°C decrease in temperature (Packard et al., 1975). More work is needed to determine the effects of sunlight, temperature, and other stressors on the production of both O2− and H2O2 by marine microorganisms to refine this estimate.
4.2 Superoxide production budget estimate
To calculate the globally integrated O2− production budget we first estimated the O2−:H2O2 production ratio based on a survey of ratios described in the literature. Powers et al. (2015) reported a ratio of 10.1(±5.4):1, determined from pooled photoproduction rates measured in marine surface water samples collected in the Gulf of Alaska. Interestingly, direct measurements of O2− and H2O2 at discrete time points over prolonged irradiation of the same samples yielded ratios with an even wider range from 2.4 to 10. The reader is referred to Table 6 for a summary of O2− and H2O2 photoproduction ratios in the SAB and the Gulf of Alaska (Powers et al., 2015; Powers and Miller, 2016). While those ratios do not represent initial rates required for photochemical rate modeling, much work remains to refine the quantitative relationship between photoproduced O2− and H2O2 in marine systems. Even though O2− photoproduction can be measured at pM s−1 levels, determining initial rates by linear regression of [O2−] versus time before steady-state concentrations are reached will likely underestimate true production since O2− decay is significant at all points in the time series. On the other hand, assumptions made to calculate O2− photoproduction from [O2−] steady-state values and measured dark decay rates may not accurately reflect the full suite of O2− reactions during solar radiation. Photoproduction rates of one-electron reductants (i.e., precursors for photoproduced O2−) suggest that O2− to H2O2 photoproduction ratios could range from 6 to 16 (Zhang et al., 2016; Le Roux et al., 2021), though open-ocean samples have not been tested. Le Roux et al. (2021) found ratios between one-electron reductants and O2− ranging from ∼1.5 to 2 for standard reference materials. This was attributed to an inability to accurately determine O2− photoproduction rates. Recent work to model (Ma et al., 2020) and measure (Le Roux et al. in review; personal communication) light-dependent O2− decay has revealed that O2− estimates using steady-state concentrations and dark decay are in error, but again these experiments have not yet been conducted in seawater. Finally, the temperature dependence for O2− photoproduction is not known and has not been evaluated. Consequently, for our model assessment, we selected a O2−:H2O2 ratio of 10:1 as a reasonable value based on our current knowledge, allowing a back-of-the-envelope calculation of global O2− photochemical production on the order of ∼211 Tmol yr−1.
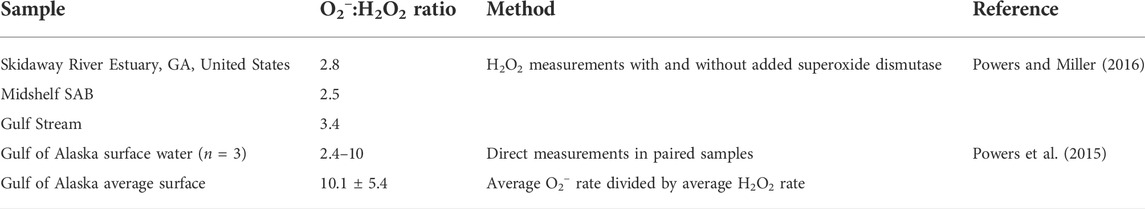
TABLE 6. Reported O2− and H2O2 photoproduction ratios and additional ancillary information.
Direct measurements of particle-associated (i.e., biological) O2− production have been reported in several field studies. Rose et al. (2008) measured [O2−] in dark (30 min removed from sunlight) seawater downstream from particles collected on a 0.2 µm filter in the eastern equatorial Pacific, and reported O2− production of <1.1 nM h−1 at most depths but >1.8 nM h−1 at depths between 15 and 100 m. The maximum O2− production rate reported in Rose et al. (2008) was 4.4 nM h−1 at 30 m near the chlorophyll maximum at one station. In Great Barrier Reef lagoon waters, net, and presumably biological, O2− production rates were 18 ± 11 nM h−1 outside of a Trichnodesnium bloom and 25 ±14 nM h−1 inside the bloom (Rose et al., 2010). Similarly, net O2− production rates in samples from the Gulf of Alaska were <1– ∼20 nM h−1 (Hansard et al., 2010) and were typically higher in the surface (∼5–25 nM h−1) than at 50 m (<1–7 nM h−1). Thus, as an alternative estimate to that reported by Sutherland et al. (2020), we applied the same approach used above to estimate biological H2O2 production rates (See Section 4.1) and calculate biological O2− production in the top 100 m. Assuming that biological O2− production may be 1–20 nM h−1 and the surface area of the ocean is 3.62 × 10¹⁴ m2 (Charette and Smith, 2010), annual O2− biological production could be on the order of 320–6,300 Tmol yr−1. The lower end of the estimated range is of the same magnitude as our photochemical O2− flux estimate of ∼211 Tmol yr−1 in the surface mixed layer. However, overestimation is expected regarding these biological O2− production estimates since, as in the H2O2 calculations, the temperature dependence of these rates was not quantified and thus were not considered.
4.3 Conclusion and implications
In this work, an annual H2O2 photoproduction budget of 21.1 ± 7.5 Tmol yr−1 was estimated using a global-scale photochemistry model driven by remotely sensed ocean data. This annual budget is significantly higher than global estimates for other marine photoproducts: carbon monoxide (2.5–4.2 Tmol yr−1) (Zafiriou et al., 2003; Stubbins et al., 2006; Fichot and Miller, 2010), and the low-molecular-weight carbonyl compounds formaldehyde (4.1 Tmol yr−1), acetaldehyde (2.0 Tmol yr−1), glyoxal (0.35 Tmol yr−1) and methylglyoxal (0.11 Tmol yr−1) (Zhu and Kieber, 2020). It is often assumed that CO2 is the dominant carbon-based photoproduct of CDOM photochemistry but rates supporting this contention were primarily obtained from inshore waters (Miller and Zepp, 1995; Mopper and Kieber, 2002). Direct AQY measurements for open ocean seawater, however, are extremely limited. Previous estimates based on CO photochemical fluxes and a CO2:CO ratio of 15 in riverine and coastal waters (Miller and Zepp, 1995), predict an annual CO2 budget of 37.5–63 Tmol yr−1. Our global modeled production for H2O2 seems to be of a similar magnitude as that for CO2, suggesting that H2O2 is also a dominant photoproduct of marine photochemistry.
H2O2 photoproduction might serve as a better proxy than CO for estimating CO2 photoproduction. Large variabilities were observed in CO2:CO production ratios, greatly increasing the uncertainty of previous global estimates for CO2 photoproduction that rely on this ratio (White et al., 2010; Reader and Miller, 2012). Powers and Miller (2015a) demonstrated that H2O2 and CO2 photoproduction exhibited a well-defined relationship in a variety of marine waters and reported an average CO2:H2O2 molar photoproduction ratio of 6.6 ± 1.8. Using an annual H2O2 photoproduction budget of 21.1 Tmol yr−1 and a CO2: H2O2 molar ratio of 6.6, the estimated annual CO2 photoproduction budget is 139 Tmol yr−1, which is ∼2–4 times higher than the CO2 budget estimated with CO fluxes and a CO2:CO ratio of 15. To further constrain the potential use of H2O2 as a proxy to estimate CO2 photoproduction, much more work is needed to define the variability in CO2: H2O2 ratios, particularly in blue water.
Our study provides constraints for O2− photoproduction in oceanic waters. Assuming a O2−: H2O2 production ratio of 10:1, gives an annual O2− photoproduction budget of ∼211 Tmol yr−1. Despite challenges and potentially large uncertainties with this estimate, attempts to quantify O2− photoproduction on a global scale are of great interest. The exact relationship between photochemical and biological production of O2− in marine environments may have important implications for oceanic redox chemistry and marine ecology. Sutherland et al. (2020), using a compilation of laboratory derived O2− production rates from marine microorganisms, estimated dark O2− production on the order of 3–4 Pmol yr−1 in the top 200 m, almost 20 times higher than our photochemical estimate in the surface mixed layer. It should be noted again that temperature and various other environmental stress factors (e.g., UV light) could significantly influence biological O2− production rates and these have yet to be evaluated. Consequently, it may be premature to extrapolate laboratory O2− dark production rates to large geographic scales.
In this work, we presented global-scale estimates of depth-resolved H2O2 photoproduction in sunlit surface seawater using remotely sensed ocean color. With slight modifications, the model employed in this study can be used to investigate ROS and other photo-redox reactions having defined AQY and temperature dependences at increasingly finer spatial and temporal resolutions. Our modeling approach provides new potential for examination of varying redox conditions and relationships to other important elemental cycles (e.g., Fe, Cu, Mn, N, C) in the surface oceans on regional scales and in relation to local transient oceanographic events (e.g., upwelling, rain, eddy evolution).
Data availability statement
The original contributions presented in the study are included in the article/Supplementary Material, further inquiries can be directed to the corresponding authors.
Author contributions
WM, LP, DK, and YZ designed the work. LP and WM conducted the sample collection and photochemistry experiments in the field. YZ ran the model. LP and YZ performed the data analyses. YZ, LP, DK, and WM prepared the manuscript.
Funding
Financial support was provided by the U.S. National Science Foundation through awards to the University of Georgia (OCE-1924763 and 1635618 to WM and LP) and SUNY-ESF (OCE- 1756907 to DK).
Conflict of interest
The authors declare that the research was conducted in the absence of any commercial or financial relationships that could be construed as a potential conflict of interest.
Publisher’s note
All claims expressed in this article are solely those of the authors and do not necessarily represent those of their affiliated organizations, or those of the publisher, the editors and the reviewers. Any product that may be evaluated in this article, or claim that may be made by its manufacturer, is not guaranteed or endorsed by the publisher.
Supplementary material
The Supplementary Material for this article can be found online at: https://www.frontiersin.org/articles/10.3389/frsen.2022.1009398/full#supplementary-material
References
Andrews, S. S., Caron, S., and Zafiriou, O. C. (2000). Photochemical oxygen consumption in marine waters: A major sink for colored dissolved organic matter? Limnol. Oceanogr. 45, 267–277. doi:10.4319/lo.2000.45.2.0267
Bond, R. J., Hansel, C. M., and Voelker, B. M. (2020). Heterotrophic bacteria exhibit a wide range of rates of extracellular production and decay of hydrogen peroxide. Front. Mar. Sci. 7, 00072. doi:10.3389/fmars.2020.00072
Cao, F., Fichot, C. G., Hooker, S. B., and Miller, W. L. (2014). Improved algorithms for accurate retrieval of UV/visible diffuse attenuation coefficients in optically complex, inshore waters. Remote Sens. Environ. 144, 11–27. doi:10.1016/J.RSE.2014.01.003
Cao, F., and Miller, W. L. (2015). A new algorithm to retrieve chromophoric dissolved organic matter (CDOM) absorption spectra in the UV from ocean color. J. Geophys. Res. Oceans 120, 496–516. doi:10.1002/2014JC010241
Cao, F., Mishra, D. R., Schalles, J. F., and Miller, W. L. (2018). Evaluating ultraviolet (UV) based photochemistry in optically complex coastal waters using the Hyperspectral Imager for the Coastal Ocean (HICO). Estuar. Coast. Shelf Sci. 215, 199–206. doi:10.1016/J.ECSS.2018.10.013
Charette, M. A., and Smith, W. H. F. (2010). The volume of Earth’s ocean. Oceanogr. Wash. D. C. 23, 112–114. doi:10.5670/oceanog.2010.51
Clark, C. D., De Bruyn, W. J., Jakubowski, S. D., and Grant, S. B. (2008). Hydrogen peroxide production in marine bathing waters: Implications for fecal indicator bacteria mortality. Mar. Pollut. Bull. 56, 397–401. doi:10.1016/j.marpolbul.2007.10.017
Cooper, L. H. N. (1937). Oxidation-reduction potential in sea water. J. Mar. Biol. Assoc. U. K. 22, 167–176. doi:10.1017/s0025315400011929
Cooper, W. J., and Zika, R. G. (1983). Photochemical formation of hydrogen peroxide in surface and ground waters exposed to sunlight. Science 220, 711–712. doi:10.1126/science.220.4598.711
Crichton, K. A., Wilson, J. D., Ridgwell, A., and Pearson, P. N. (2021). Calibration of temperature-dependent ocean microbial processes in the cGENIE.muffin (v0.9.13) Earth system model. Geosci. Model Dev. 14, 125–149. doi:10.5194/gmd-14-125-2021
Diaz, J. M., Hansel, C. M., Voelker, B. M., Mendes, C. M., Andeer, P. F., and Zhang, T. (2013). Widespread production of extracellular superoxide by heterotrophic bacteria. Science 340, 1223–1226. doi:10.1126/science.1237331
Fichot, C. G., and Miller, W. L. (2010). An approach to quantify depth-resolved marine photochemical fluxes using remote sensing: Application to carbon monoxide (CO) photoproduction. Remote Sens. Environ. 114, 1363–1377. doi:10.1016/J.RSE.2010.01.019
Fichot, C. G., Sathyendranath, S., and Miller, W. L. (2008). SeaUV and SeaUVC: Algorithms for the retrieval of UV/Visible diffuse attenuation coefficients from ocean color. Remote Sens. Environ. 112, 1584–1602. doi:10.1016/J.RSE.2007.08.009
Galí, M., Kieber, D. J., Romera-Castillo, C., Kinsey, J. D., Devred, E., Pérez, G. L., et al. (2016). CDOM sources and photobleaching control quantum yields for oceanic DMS photolysis. Environ. Sci. Technol. 50, 13361–13370. doi:10.1021/acs.est.6b04278
Goldstone, J. V., Pullin, M. J., Bertilsson, S., and Voelker, B. M. (2002). Reactions of hydroxyl radical with humic substances: Bleaching, mineralization, and production of bioavailable carbon substrates. Environ. Sci. Technol. 36, 364–372. doi:10.1021/es0109646
Goldstone, J. V., and Voelker, B. M. (2000). Chemistry of superoxide radical in seawater: CDOM associated sink of superoxide in coastal waters. Environ. Sci. Technol. 34, 1043–1048. doi:10.1021/es9905445
Gueymard, C. A. (2001). Parameterized transmittance model for direct beam and circumsolar spectral irradiance. Sol. Energy 71, 325–346. doi:10.1016/S0038-092X(01)00054-8
Haag, W. R., and Hoigne, J. (1986). Singlet oxygen in surface waters. 3. Photochemical formation and steady-state concentrations in various types of waters. Environ. Sci. Technol. 20, 341–348. doi:10.1021/es00146a005
Hansard, P. S., Vermilyea, A. W., and Voelker, B. M. (2010). Measurements of superoxide radical concentration and decay kinetics in the Gulf of Alaska. Deep Sea Res. Part I Oceanogr. Res. Pap. 57, 1111–1119. doi:10.1016/j.dsr.2010.05.007
Johannessen, S. C. (2003). Calculation of UV attenuation and colored dissolved organic matter absorption spectra from measurements of ocean color. J. Geophys. Res. 108, 3301. doi:10.1029/2000JC000514
Keeling, R. F., Körtzinger, A., and Gruber, N. (2009). Ocean deoxygenation in a warming world. Ann. Rev. Mar. Sci. 2, 199–229. doi:10.1146/annurev.marine.010908.163855
Kieber, D. J., Miller, G. W., Neale, P. J., and Mopper, K. (2014). Wavelength and temperature-dependent apparent quantum yields for photochemical formation of hydrogen peroxide in seawater. Environ. Sci. Process. Impacts 16, 777–791. doi:10.1039/C4EM00036F
Kieber, D. J., Peake, B. M., Neale, P. J., and Mopper, K. (2003). “Reactive oxygen species in aquatic ecosystems,” in UV effects in aquatic ecosystems. Editors E. V. Helbling, and H. Zagarese (Cambridge, UK: Royal Society of Chemistry), 251–288.
King, D. W., Cooper, W. J., Rusak, S. a., Peake, B. M., Kiddle, J. J., O’Sullivan, D. W., et al. (2007). Flow injection analysis of H2O2 in natural waters using acridinium ester chemiluminescence: Method development and optimization using a kinetic model. Anal. Chem. 79, 4169–4176. doi:10.1021/ac062228w
Le Roux, D. M., Powers, L. C., and Blough, N. V. (2021). Photoproduction rates of one-electron reductants by chromophoric dissolved organic matter via fluorescence spectroscopy: Comparison with superoxide and hydrogen peroxide rates. Environ. Sci. Technol. 55, 12095–12105. doi:10.1021/acs.est.1c04043
Learman, D. R., Voelker, B. M., Vazquez-Rodriguez, A. I., and Hansel, C. M. (2011). Formation of manganese oxides by bacterially generated superoxide. Nat. Geosci. 4, 95–98. doi:10.1038/ngeo1055
Lu, W., Ridgwell, A., Thomas, E., Hardisty, D. S., Luo, G., Algeo, T. J., et al. (2018). Late inception of a resiliently oxygenated upper ocean. Science 361, 174–177. doi:10.1126/science.aar5372
Ma, J., Nie, J., Zhou, H., Wang, H., Lian, L., Yan, S., et al. (2020). Kinetic consideration of photochemical formation and decay of superoxide radical in dissolved organic matter solutions. Environ. Sci. Technol. 54, 3199–3208. doi:10.1021/acs.est.9b06018
Miller, C. J., Rose, A. L., and Waite, T. D. (2009). Impact of natural organic matter on H2O2-mediated oxidation of Fe(II) in a simulated freshwater system. Geochim. Cosmochim. Acta 73, 2758–2768. doi:10.1016/j.gca.2009.02.027
Miller, W. L., and Kester, D. R. (1988). Hydrogen peroxide measurement in seawater by (p-Hydroxyphenyl)acetic acid dimerization. Anal. Chem. 60, 2711–2715. doi:10.1021/ac00175a014
Miller, W. L., and Zepp, R. G. (1995). Photochemical production of dissolved inorganic carbon from terrestrial organic matter: Significance to the oceanic organic carbon cycle. Geophys. Res. Lett. 22, 417–420. doi:10.1029/94GL03344
Moffett, J. W., and Zika, R. G. (1987). Reaction kinetics of hydrogen peroxide with copper and iron in seawater. Environ. Sci. Technol. 21, 804–810. doi:10.1021/es00162a012
Mopper, K., Kieber, D. J., and Stubbins, A. (2015). “Marine photochemistry of organic matter: Processes and impacts,” in Biogeochemistry of marine dissolved organic matter. Editors D. A. Hansell, and C. A. Carlson. 2nd Ed. (San Diego, CA: Academic Press), 389–450. doi:10.1016/B978-0-12-405940-5.00008-X
Mopper, K. W., and Kieber, D. J. (2002). “Chapter 9 – photochemistry and the cycling of carbon, sulfur, nitrogen and phosphorus,” in Biogeochemistry of marine dissolved organic matter. Editors D. A. Hansell, and C. A. Carlson (San Diego, CA: Academic Press), 455–507. doi:10.1016/B978-012323841-2/50011-7
Mopper, K., and Zhou, X. (1990). Hydroxyl radical photoproduction in the sea and its potential impact on marine processes. Science 250, 661–664. doi:10.1126/science.250.4981.661
Morel, F. M. M., and Price, N. M. (2003). The biogeochemical cycles of trace metals in the oceans. Science 300, 944–947. doi:10.1126/science.1083545
Morris, J. J., Johnson, Z. I., Szul, M. J., Keller, M., and Zinser, E. R. (2011). Dependence of the cyanobacterium prochlorococcus on hydrogen peroxide scavenging microbes for growth at the ocean’s surface. PLoS One 6, e16805. doi:10.1371/journal.pone.0016805
Ossola, R., Jönsson, O. M., Moor, K., and McNeill, K. (2021). Singlet oxygen quantum yields in environmental waters. Chem. Rev. 121, 4100–4146. doi:10.1021/acs.chemrev.0c00781
O’Sullivan, D. W., Neale, P. J., Coffin, R. B., Boyd, T. J., and Osburn, C. L. (2005). Photochemical production of hydrogen peroxide and methylhydroperoxide in coastal waters. Mar. Chem. 97, 14–33. doi:10.1016/j.marchem.2005.04.003
Packard, T. T., Devol, A. H., and King, F. D. (1975). The effect of temperature on the respiratory electron transport system in marine plankton. Deep Sea Res. Oceanogr. Abstr. 22, 237–249. doi:10.1016/0011-7471(75)90029-7
Palenik, B., and Morel, F. M. M. (1988). Dark production of H2O2 in the Sargasso Sea. Limnol. Oceanogr. 33, 1606–1611. doi:10.4319/lo.1988.33.6part2.1606
Pawlowicz, R. (2020). M_Map: A mapping package for MATLAB. version 1.4m, [Computer software]. Available at: www.eoas.ubc.ca/∼rich/map.html
Petasne, R. G., and Zika, R. G. (1987). Fate of superoxide in coastal sea water. Nature 325, 516–518. doi:10.1038/325516a0
Powers, L. C., Babcock-Adams, L. C., Enright, J. K., and Miller, W. L. (2015). Probing the photochemical reactivity of deep ocean refractory carbon (DORC): Lessons from hydrogen peroxide and superoxide kinetics. Mar. Chem. 177, 306–317. doi:10.1016/j.marchem.2015.06.005
Powers, L. C., and Miller, W. L. (2016). Apparent quantum efficiency spectra for superoxide photoproduction and its formation of hydrogen peroxide in natural waters. Front. Mar. Sci. 3, 00235. doi:10.3389/fmars.2016.00235
Powers, L. C., and Miller, W. L. (2014). Blending remote sensing data products to estimate photochemical production of hydrogen peroxide and superoxide in the surface ocean. Environ. Sci. Process. Impacts 16, 792–806. doi:10.1039/C3EM00617D
Powers, L. C., and Miller, W. L. (2015a). Hydrogen peroxide and superoxide photoproduction in diverse marine waters: A simple proxy for estimating direct CO2 photochemical fluxes. Geophys. Res. Lett. 42, 7696–7704. doi:10.1002/2015GL065669
Powers, L. C., and Miller, W. L. (2015b). Photochemical production of CO and CO2 in the Northern Gulf of Mexico: Estimates and challenges for quantifying the impact of photochemistry on carbon cycles. Mar. Chem. 171, 21–35. doi:10.1016/j.marchem.2015.02.004
Reader, H. E., and Miller, W. L. (2012). Variability of carbon monoxide and carbon dioxide apparent quantum yield spectra in three coastal estuaries of the South Atlantic Bight. Biogeosciences 9, 4279–4294. doi:10.5194/bg-9-4279-2012
Roe, K. L., Schneider, R. J., Hansel, C. M., and Voelker, B. M. (2016). Measurement of dark, particle-generated superoxide and hydrogen peroxide production and decay in the subtropical and temperate North Pacific Ocean. Deep Sea Res. Part I Oceanogr. Res. Pap. 107, 59–69. doi:10.1016/j.dsr.2015.10.012
Rose, A. L., Godrant, A., Godrant, A., Furnas, M., and Waite, T. D. (2010). Dynamics of nonphotochemical superoxide production in the Great Barrier Reef lagoon. Limnol. Oceanogr. 55, 1521–1536. doi:10.4319/lo.2010.55.4.1521
Rose, A. L. (2016). The influence of reactive oxygen species on local redox conditions in oxygenated natural waters. Front. Earth Sci. 4, 1–11. doi:10.3389/feart.2016.00096
Rose, A. L., and Waite, T. D. (2006). Role of superoxide in the photochemical reduction of iron in seawater. Geochim. Cosmochim. Acta 70, 3869–3882. doi:10.1016/j.gca.2006.06.008
Rose, A. L., Webb, E. A., Waite, T. D., and Moffett, J. W. (2008). Measurement and implications of nonphotochemically generated superoxide in the equatorial Pacific Ocean. Environ. Sci. Technol. 42, 2387–2393. doi:10.1021/es7024609
Sarmento, H., Montoya, J. M., Vázquez-Domínguez, E., Vaqué, D., and Gasol, J. M. (2010). Warming effects on marine microbial food web processes: How far can we go when it comes to predictions? Philos. Trans. R. Soc. B Biol. Sci. 365, 2137–2149. doi:10.1098/rstb.2010.0045
Schmidtko, S., Johnson, G. C., and Lyman, J. M. (2013). Mimoc: A global monthly isopycnal upper-Ocean Climatology with mixed layers. J. Geophys. Res. Oceans 118, 1658–1672. doi:10.1002/jgrc.20122
Scully, N. M., Cooper, W. J., and Tranvik, L. J. (2003). Photochemical effects on microbial activity in natural waters: The interaction of reactive oxygen species and dissolved organic matter. FEMS Microbiol. Ecol. 46, 353–357. doi:10.1016/S0168-6496(03)00198-3
Sharpless, C. M., and Blough, N. V. (2014). The importance of charge-transfer interactions in determining chromophoric dissolved organic matter (CDOM) optical and photochemical properties. Environ. Sci. Process. Impacts 16, 654–671. doi:10.1039/C3EM00573A
Stubbins, A., Uher, G., Law, C. S., Mopper, K., Robinson, C., and Upstill-Goddard, R. C. (2006). Open-ocean carbon monoxide photoproduction. Deep Sea Res. Part II Top. Stud. Oceanogr. 53, 1695–1705. doi:10.1016/j.dsr2.2006.05.011
Sutherland, K. M., Grabb, K. C., Karolewski, J. S., Taenzer, L., Hansel, C. M., and Wankel, S. D. (2021). The redox fate of hydrogen peroxide in the marine water column. Limnol. Oceanogr. 66, 3828–3841. doi:10.1002/lno.11922
Sutherland, K. M., Wankel, S. D., and Hansel, C. M. (2020). Dark biological superoxide production as a significant flux and sink of marine dissolved oxygen. Proc. Natl. Acad. Sci. U. S. A. 117, 3433–3439. doi:10.1073/pnas.1912313117
Tanskanen, A., Krotkov, N. A., Herman, J. R., and Arola, A. (2006). Surface ultraviolet irradiance from OMI. IEEE Trans. Geosci. Remote Sens. 44, 1267–1271. doi:10.1109/TGRS.2005.862203
Vermilyea, A. W., Paul Hansard, S., and Voelker, B. M. (2010). Dark production of hydrogen peroxide in the Gulf of Alaska. Limnol. Oceanogr. 55, 580–588. doi:10.4319/lo.2010.55.2.0580
Voelker, B. M., and Sulzberger, B. (1996). Effects of fulvic acid on Fe(II) oxidation by hydrogen peroxide. Environ. Sci. Technol. 30, 1106–1114. doi:10.1021/es9502132
White, E. M., Kieber, D. J., Sherrard, J., Miller, W. L., and Mopper, K. (2010). Carbon dioxide and carbon monoxide photoproduction quantum yields in the Delaware Estuary. Mar. Chem. 118, 11–21. doi:10.1016/j.marchem.2009.10.001
White, E. M., Vaughan, P. P., and Zepp, R. G. (2003). Role of the photo-Fenton reaction in the production of hydroxyl radicals and photobleaching of colored dissolved organic matter in a coastal river of the southeastern United States. Aquatic Sci. - Res. Across Boundaries 65, 402–414. doi:10.1007/s00027-003-0675-4
Wuttig, K., Heller, M. I., and Croot, P. L. (2013). Pathways of superoxide (O2–) decay in the eastern tropical north atlantic. Environ. Sci. Technol. 47, 10249–10256. doi:10.1021/es401658t
Yocis, B. H., Kieber, D. J., and Mopper, K. (2000). Photochemical production of hydrogen peroxide in Antarctic Waters. Deep Sea Res. Part I Oceanogr. Res. Pap. 47, 1077–1099. doi:10.1016/S0967-0637(99)00095-3
Zafiriou, O. C., Andrews, S. S., and Wang, W. (2003). Concordant estimates of oceanic carbon monoxide source and sink processes in the Pacific yield a balanced global “blue-water” CO budget. Glob. Biogeochem. Cycles 17, 1015. doi:10.1029/2001GB001638
Zepp, R. G., Callaghan, T. V., and Erickson, D. J. (2003). Interactive effects of ozone depletion and climate change on biogeochemical cycles. Photochem. Photobiol. Sci. 2, 51–61. doi:10.1039/B211154N
Zepp, R. G., Faust, B. C., and Hoigne, J. (1992). Hydroxyl radical formation in aqueous reactions (pH 3-8) of iron(II) with hydrogen peroxide: The photo-fenton reaction. Environ. Sci. Technol. 26, 313–319. doi:10.1021/es00026a011
Zhang, F., Xiao, S., Kendall, B., Romaniello, S. J., Cui, H., Meyer, M., et al. (2018). Extensive marine anoxia during the terminal Ediacaran Period. Sci. Adv. 4, eaan8983. doi:10.1126/sciadv.aan8983
Zhang, T., Diaz, J. M., Brighi, C., Parsons, R. J., McNally, S., Apprill, A., et al. (2016). Dark production of extracellular superoxide by the coral porites astreoides and representative symbionts. Front. Mar. Sci. 3, 00232. doi:10.3389/fmars.2016.00232
Zhang, Y., and Blough, N. V. (2016). Photoproduction of one-electron reducing intermediates by chromophoric dissolved organic matter (CDOM): Relation to O2- and H2O2 photoproduction and CDOM photooxidation. Environ. Sci. Technol. 50, 11008–11015. doi:10.1021/acs.est.6b02919
Zhu, Y., and Kieber, D. J. (2019). Concentrations and photochemistry of acetaldehyde, glyoxal and methylglyoxal in the Northwest Atlantic Ocean. Environ. Sci. Technol. 53, 9512–9521. doi:10.1021/acs.est.9b01631
Zhu, Y., and Kieber, D. J. (2020). Global model for depth-dependent carbonyl photochemical production rates in seawater. Glob. Biogeochem. Cycles 34, 1–20. doi:10.1029/2019GB006431
Keywords: photochemistry, superoxide, remote sensing, UV radiation, reactive oxygen species
Citation: Zhu Y, Powers LC, Kieber DJ and Miller WL (2022) Depth-resolved photochemical production of hydrogen peroxide in the global ocean using remotely sensed ocean color. Front. Remote Sens. 3:1009398. doi: 10.3389/frsen.2022.1009398
Received: 01 August 2022; Accepted: 05 October 2022;
Published: 20 October 2022.
Edited by:
Carmen Cillero Castro, 3edata Environmental Engineering. S.l., SpainReviewed by:
Richard Zepp, US Environmental Protection Agency, Athens, United StatesCurtis Mobley, retired from Sequoia Scientific, Inc., United States
Copyright © 2022 Zhu, Powers, Kieber and Miller. This is an open-access article distributed under the terms of the Creative Commons Attribution License (CC BY). The use, distribution or reproduction in other forums is permitted, provided the original author(s) and the copyright owner(s) are credited and that the original publication in this journal is cited, in accordance with accepted academic practice. No use, distribution or reproduction is permitted which does not comply with these terms.
*Correspondence: Yuting Zhu, eXpodUBzeXIuZWR1; Leanne C. Powers, bGNwb3dlcnNAZXNmLmVkdQ==
‡Present Address: Department of Marine Chemistry and Geochemistry, Woods Hole Oceanographic Institution, Woods Hole, MA, United States
†These authors have contributed equally to this work