 Erik Meyer
 Kurt Fristrup
 Anthony C. Caprio1
 Carlos Linares
 Megan F. McKenna
- 1Sequoia and Kings Canyon National Parks, National Park Service, Three Rivers, CA, United States
- 2Natural Sounds and Night Skies Division, National Park Service, Fort Collins, CO, United States
- 3Department of Biological Science, Boise State University, Boise, ID, United States
Forest management strategies that create spatially diverse fire-caused disturbance outcomes, consistent with historic fire regimes, are a desired condition for fire adapted western United States forests. In this context, the temporal dynamics of forest response to fire can inform the tempo and scale of forest management, including prescribed burning. Here, we investigated the use of ecoacoustic methods to assess ecological condition in a four-year period (2016–2019) after wildfire in a giant sequoia forest landscape within Kings Canyon National Park, California, United States. Audio recorders at nine sites were deployed soon after the 2015 Rough Fire subsided. The monitoring sites were located in regions with different fire histories, representing five fire history categories. We used the Acoustic Complexity Index (ACI) to document biotic chorus complexity. This previously tested ecoacoustic index provided a daily indicator of biotic sound activity in frequencies dominated by avian calls. Patterns in ACI were evaluated using generalized additive mixed models to understand the relationship with time-since-fire and covariates that accounted for season, fire history category, and weather conditions. We showed that time-since fire and fire-history influenced patterns in ACI after accounting for season and air temperature effects. Monitoring sites where prescribed fire preceded the Rough Fire showed the highest predicted ACI and evidence for a relatively consistent seasonal pattern in ecoacoustic activity across subsequent seasons. Sites without prescribed fire and burned by the Rough Fire exhibited the most pronounced successive decreases in ACI in the first and second years after the fire. The daily temporal resolution of the ecoacoustic index also revealed phenological shifts related to time-since-fire and fire history. Sites unburned by the Rough Fire offered some context for how fire changed ecoacoustic activity post-wildfire, however evidence suggested they were also impacted by the presence of the nearby Rough Fire. The patterns in the ecoacoustic index when combined with vegetation surveys offered complementary insights into ecological dynamics of regeneration after fire. Our exploratory analysis showed that using ecoacoustic methods in wildfire monitoring offers a scalable approach to remote sensing of ecological trends. Archived recordings from the monitoring effort afford future opportunities for new or more detailed insights.
Introduction
Megafires, large wildfires with serious economic and ecological consequences, are increasingly common worldwide and a new reality for land managers (Adams, 2013). In California (United States), the interaction of climate change, drought, and altered historical fire regimes have led to increased frequency and severity of fires across the state’s diverse biomes (Steel et al., 2015; Schweizer et al., 2020; Stephens et al., 2020). Since 2000, California has experienced 18 of its 20 largest wildfires in recorded history, each burning over 65,000 hectares (CalFire, 2021). In 2020 and 2021, five of the six largest wildfires occurred, eclipsing 800,000 total hectares burned. Though fire is an essential part of many ecosystems in California, the impact of megafires can be catastrophic in forests where fire has been routinely suppressed, resulting in homogenous, high-severity burns (Coop et al., 2020; Stephens et al., 2020).
Public land management agencies, such as the U.S. National Park Service, are often the areas impacted by high-severity megafires. Tasked with protecting and managing natural resources at landscape scales, national parks confront threats that are amplified by rapidly changing environmental conditions (Westerling, 2016). The history of fire exclusion extending back to Euroamerican settlement has greatly altered ecosystem susceptibility to fire. Increased forest density and greater fuel accumulations resulted in fires of greater severity and increased connectivity over the landscape (Meyer et al., 2019). Within giant sequoia (Sequoiadendron giganteum) groves, lower severity fires burned approximately every 5–25 years prior to Euroamerican settlement, with frequency influenced by climate conditions (Swetnam, 1993; Swetnam et al., 2009).
Forest management strategies that create spatially diverse fire-caused disturbance outcomes, consistent with historic fire regimes, are a desired condition for fire adapted western U.S. forests (NPS, 2003; Fontaine and Kennedy, 2012; Simonson et al., 2014; DellaSala et al., 2017). This strategy, termed “pyrodiversity”, provides for ecosystem integrity and function across varied taxa such as bats, birds, and small mammals, while reducing fuel loads, forest density, and the probability of future high-severity fires (Tingley et al., 2016; Steel et al., 2019). Prescribed burning has been implemented at various scales using more frequent, low-intensity fires, which are similar to historical burning by Indigenous peoples and natural, lightning-ignited fires (Kilgore and Taylor, 1979; van Mantgem et al., 2016). Landscape scale prescribed burns are one method fire managers use to promote integrity of the ecosystems and safety of nearby communities. Yet these actions are often limited by funding, human health and safety, diverse jurisdictions, and air quality concerns (DellaSala et al., 2017; Stephens et al., 2020). Monitoring ecological systems after prescribed burns or wildlife to assess pyrodiversity outcomes requires innovative approaches that sample over large spatial and temporal scales and captures diverse features of the biological community.
The conditions of the forest after fire, both prescribed and wild, are typically measured through vegetation sampling using indicators such as tree species composition and condition, understory regrowth, and burn severity (Mutch and Swetnam, 1995; Knapp et al., 2005; Nesmith et al., 2011; Meyer et al., 2019). When measuring animal response to fire, studies are often limited to a single species (e.g., Black-backed Woodpecker, Picoides arcticus; California spotted owl, Strix occidentalis occidentalis) (Jones et al., 2016; Stillman et al., 2019; Kramer et al., 2021) or are limited to small study areas (Kilgore, 1971). Integrated studies of responses over the broader ecological community are limited. One challenge to studying fire response relationships across diverse taxa is the difficulty in capturing the spatial-temporal component of communities, which are strongly tied to the time since disturbance, local climate, seasonality, natural history, local or global migrations, and diel behavioral patterns (Leech and Crick, 2007; Lindenmayer et al., 2016). When multi-species studies do account for seasonal and other long-term wildlife trends, widespread coverage is unlikely because most survey methods are labor intensive, costly, and require specialized skills (Driscoll et al., 2010; Bagne and Purcell, 2011). Despite these challenges a few studies have garnered insight on these dynamics (e.g., Tingley et al., 2016; Steel et al., 2019). Building on these studies, more comprehensive ecological methods for understanding the ecosystem response to fires and fire management are desirable in the context of increasing risk of megafires.
The emerging field of ecoacoustics offers rapid analysis tools for passive acoustic monitoring (PAM) data to quantify aspects of the acoustically active biological community (Sueur and Farina, 2015; Grant and Samways, 2016; Stowell and Sueur, 2020). This relatively low-cost, data-rich technology requires the deployment of autonomous acoustic recording units (ARUs), which are placed at study locations to record the acoustic environment within a specified frequency range. Community ecoacoustic indices are calculated as summaries of the acoustic patterns generated by all sounds in a recording (Sueur and Farina, 2015; Buxton et al., 2018; Bradfer-Lawrence et al., 2019; Darras et al., 2019). Over 70 indices have been extracted from PAM datasets with differing time and frequency parameters related to study objectives (Buxton et al., 2018). Successful applications of these indices have addressed temporal patterns of terrestrial wildlife activity, response to ecological disturbance (Gasc et al., 2018; Lee et al., 2017), biodiversity assessments, and their respective dependencies on site characteristics and habitat structure (Buxton et al., 2018). These ecoacoustic indices offer simple computational recipes to document temporal trends with high resolution on broad spatial scales, yet they present limitations. Just as with other indices of biodiversity, the compression of complex data into a single numeric summary to represent a dynamic ecosystem yields useful information only if researchers carefully examine the relationship between the index and the underlying process of interest (Gasc et al., 2013; Fuller et al., 2015). The index used in this study (Acoustic Complexity Index) is particularly apt at detecting patterns in terrestrial avian activity, especially during dawn chorus (Pieretti et al., 2011; Buxton et al., 2016; Eldridge et al., 2016; Lee et al., 2017; Ross et al., 2018).
We completed a nearly continuous four-year PAM effort to understand ecological dynamics following the 2015 Rough Fire in a giant sequoia (Sequoiadendron giganteum) forest in Sequoia and Kings Canyon National Parks (SEKI), California, United States. Acoustic and environmental monitoring was maintained at nine sites grouped in five different fire history categories arising from the 2015 Rough Fire, prescribed burning, and history of logging. Ecological conditions were evaluated using an ecoacoustic index (Acoustic Complexity Index, ACI) that represented the variety of biological sounds in frequencies dominated by the avian calls. Daily measurements of ACI enabled us to parse the effects of weather and seasonal phenology to reduce their capacity to obscure or confound the effects of fire history. The results were combined with post-fire vegetation surveys to gauge benefits of incorporating PAM into post-fire monitoring efforts as a complimentary ecological index.
Materials and Methods
Background on Study Region
This study took place in the Grant Grove Peninsula (GGP), a roughly 6,177-hectare region of Sequoia and Kings Canyon National Parks (SEKI), California, United States ranging from 1,000 to 2,350 m in elevation (Figure 1). In addition to burned areas from the 2015 Rough fire, this region of the southern Sierra Nevada has a rich history of prescribed fire used to manage the forested landscape for habitat structure and resource protection (Swetnam et al., 2009; NPS, 2020).
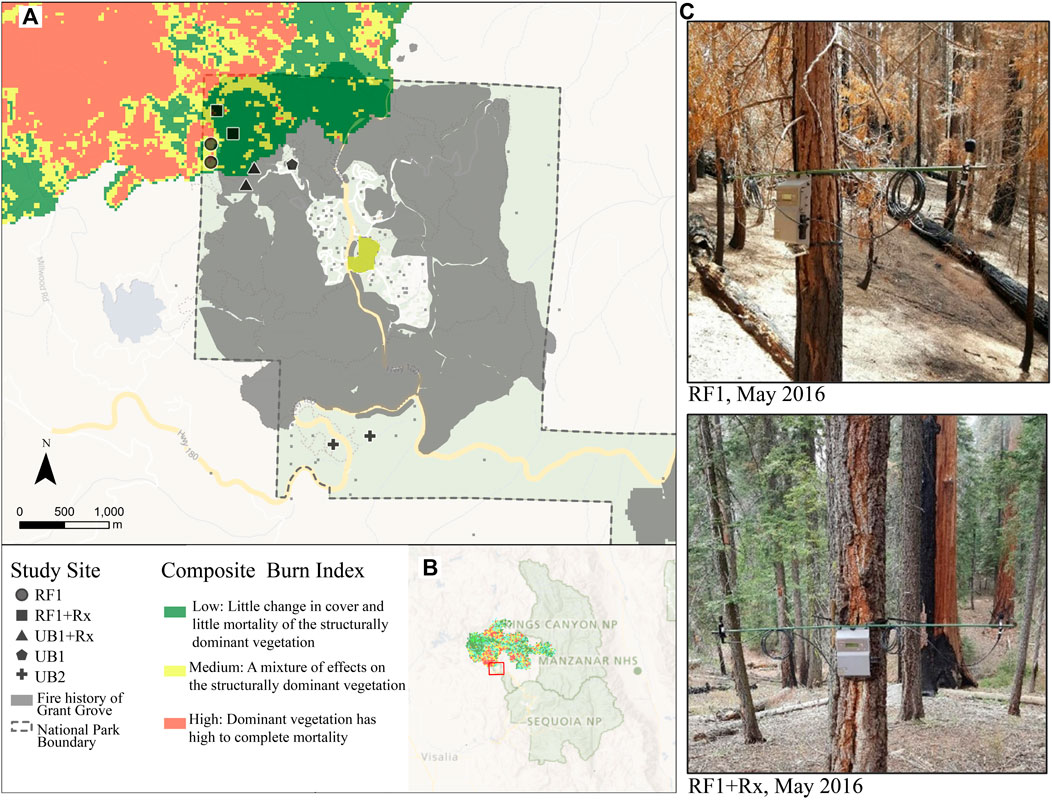
FIGURE 1. Map of the study region in the Grant Grove region of Sequoia and Kings Canyon National Parks, California (A), including study sites, prior fire history, and the 2015 Rough Fire perimeter and fire severity indices. (B) The greater study area, with the Rough Fire perimeter and fire severity indices shown. The Composite Burn Index (CBI) is a standardized fire severity rating based on a composite of effects to the understory vegetation (grass, shrub layers), midstory trees and overstory trees. Raster data were acquired from Forest Service data repository (USFS, 2015). (C) Photographs of two of the nine acoustic monitoring sites in May 2016 (six mounts after Rough Fire was contained). Acoustic recorders (Song Meter 3, Wildlife Acoustic Inc.) were attached to the trees with microphones extending 0.5 m from the recorder. RF1 = Rough Fire without prior prescribed burns. RF1 + Rx = Rough Fire with prior prescribed burns (Table 1 for descriptions).
From 2012 to 2016, California experienced the most severe drought in at least the last century (Griffin and Anchukaitis, 2014), resulting in the death of an estimated 129 million trees in the state (Moore et al., 2018). Large, protected areas, like SEKI, were not spared from these conditions. By 2016, an estimated 20% of all living trees had died in SEKI lower elevation mixed conifer forests (Stephenson et al., 2019), with the magnitude of the effect decreasing with increasing elevation (Paz-Kagan et al., 2017). Much of the mortality was exacerbated by bark beetles, with differential effects depending on the tree and bark beetle species. Large pines suffered particularly high mortality, with 50–70 percent of larger pines dying in some areas (Stephenson et al., 2019). Drought induced tree mortality were effectively moderated by prior burn treatments that reduced tree densities (Restaino et al., 2019; van Mantgem et al., 2016; van Mantgem et al., 2021).
The Rough Fire struck the region at the height of these conditions in 2015. On 31 July 2015, a lightning strike north of Kings Canyon National Park ignited the Rough Fire, ultimately burning 61,324 hectares (613 km2) over 4 months with 3,810 hectares within the park. To assess the severity of the 2015 Rough Fire on the entire study area, multi-spectral satellite imagery from 14 October 2014 (pre-fire) and 9 October 2015 (post-fire) were compared using the satellite image-based summary of RAVG Composite Burn Index (NPS, 2003; USFS, 2015). The Composite Burn Index (CBI) is a standardized fire severity rating based on a composite of effects to the understory vegetation (grass, shrub layers), midstory trees and overstory trees and conveys the degree of burn severity through a comparison with satellite-driven burn severity data (USFS, 2015). Burn severity categories of CBI range from 0 (unchanged/not detected) to 3 (highest severity) (Table 1). In the burned landscape for the Rough Fire high-severity fire accounted for an estimated 31% (Figure 1). The fast growing megafire reached the giant sequoia forests of the GGP on 11 September 2015. While low-severity fire impacts were present in a large portion of the sequoia forest within GGP (73%), several patches of high-severity fire impacts (4%) existed in areas without previous prescribed fires (Figure 1). The most significant impacts to the GGP were on portions of the grove outside the park and not directly part of the study area.
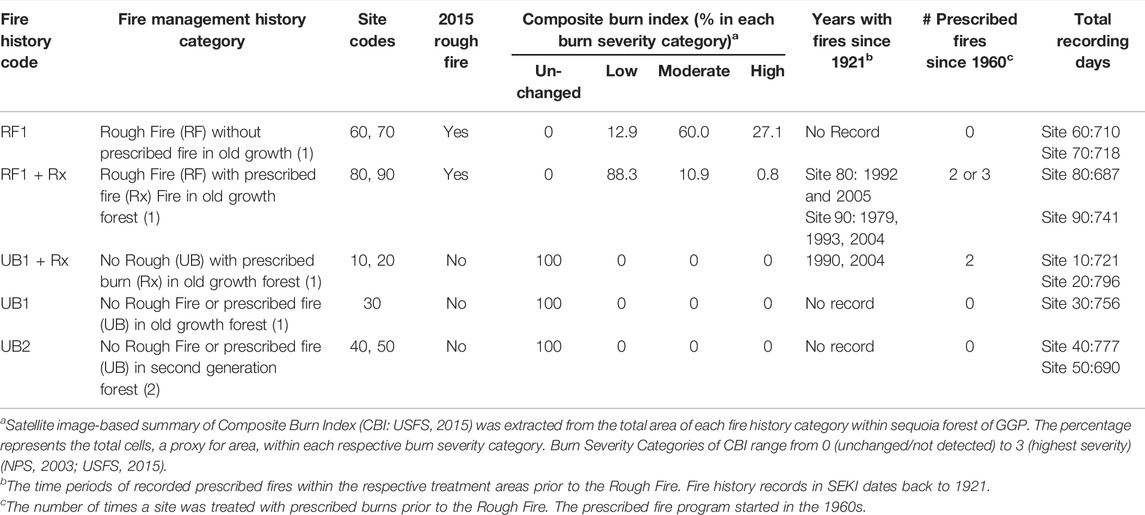
TABLE 1. Fire history conditions and recording days at each acoustic monitoring site (N = 9).
Study Sites
Nine sites were selected within the GGP representing five different fire history categories (Table 1, Supplementary Figure S1): two sites in old growth forest burned by the Rough Fire without a history of prescribed fire (RF1); two sites in old growth forest burned by the Rough Fire with prior prescribed fire (RF1 + Rx); two sites in old growth forest unburned by the Rough Fire but with prior prescribed fire (UB1 + Rx); one site in old growth sequoia forest with no recorded fire history (UB1); and two sites in a second growth sequoia forest with no recorded fire history (UB2).
All nine sites were within giant sequoia-mixed conifer forests, which also included white fir (Abies concolor), red fir (Abies magnifica), sugar pine (Pinus lambertiana), ponderosa pine (Pinus ponderosa), jeffery pine (Pinus jeffreyi), and incense cedar (Calocedrus decurrens) (Haultain et al., 2020). Only the UB2 sites were within a logged area with second-growth giant sequoia trees approximately 100 years old, all other sites were within late succession old growth forests with mature, giant sequoia trees typically more than 1,500 years old.
Acoustic Monitoring
We placed one SM3 Songmeter (Wildlife Acoustic, Inc.) acoustic recording unit (ARU) at each of the nine study sites (Figure 1, Supplementary Figure S1). Locations for each ARU were determined via random point generation in ArcGIS software (ESRI, Inc.) within each respective fire history categories. Criteria for site selection included within sequoia tree vegetation, 60 m from fire history boundary, at least 25 m from a hiking trail, 40 m from a service road, and 100 m from a meadow or stream and 245 m from another recorder location. The spatial separation of at least 245 m from another site ensured spatial independence for biological sounds.
Each ARU was affixed approximately 2 m above ground to a standing, high-canopied tree (Figure 1C, Supplementary Figure S1). An external A2 acoustic microphone (sensitivity of −4 ± 3dB (0 dB = 1 V/Pa @1 kHz) and dynamic range of 14–94 dB sound pressure level at 0 dB gain) was mounted to a 1 m rod that extended horizontally from the unit (Figure 1C). The ARUs were programmed to record each day for 5.5 h. In the morning, the ARUs recorded for 4 h, starting 1 h before sunrise. In the evening, they recorded 1.5 h before sunset. During Daylight Savings Time (approximately March–November), the ARUs recorded this schedule every day. At other times of the year, we scheduled ARUs to record every other day to extend the recording period in winter months when access to the sites was more difficult. Each recording was saved in an uncompressed WAV audio file format with the following audio settings: gain of 35 dB and sampling rate at 48 kHz.
From the spring through fall, each site was visited weekly to check memory cards, battery life, and equipment damage. In the winter months, site visits were less frequent, ranging from every 2 weeks to once each month depending on snow conditions. Recordings were collected from June 2016 through November 2019 with some variation in total recording days across sites (Table 1).
All audio data were converted to calibrated 1-s one-third octave band sound pressure levels (SPL) with nominal frequencies of 12.5–8,000 Hz using the technical specifications of the ARUs to provide absolute measures of SPL (Merchant et al., 2015) within one-third octave bands. This time-frequency representation has been used effectively in several ecological studies (Buxton et al., 2016; Buxton et al., 2018) and is the standard resolution used in National Park Service standard acoustic monitoring (Lynch et al., 2011). Using previously described methods (Buxton et al., 2018), from the SPLs we calculated the acoustic complexity index (ACI) and a measure of background sound levels in 10-min intervals (R code available: https://irma.nps.gov/DataStore/Reference/Profile/2293158). We used 1.6–8 kHz nominal third-octave frequency bands to represent biological sounds, a frequency range dominated by avian calls. To represent low-frequency background sound (anthropogenic and weather sounds), we used nominal one-third octave bands between 0.315–1.25 kHz. We ultimately used a single index, ACI, rather than a suite of indices because it has shown to be a suitable index to describe ecological conditions, particularly avian diversity (Pieretti et al., 2011; Farina et al., 2015; Buxton et al., 2016; Ross et al., 2018). At each site, all 10-min ACI values were summarized into a daily mean.
The automated data processing routine allowed for rapid processing of audio data when SD cards were retrieved on a weekly basis. The rapid processing allowed us to diagnose data quality issues and provide near real-time assessments of equipment performance and acoustic conditions.
Environmental Data
We included weather (temperature and rain) conditions in our analyses to improve interpretations of ACI. At each study site, temperature dataloggers (iButtons; Thermochron iButton, Maxim Integrated, Inc.) were affixed to trees in the forest understory. Each iButton was placed within 2 m of the ARU at approximately the same height above ground. They recorded temperature throughout the day at 30-min intervals. iButtons were retrieved and replaced approximately every 6 weeks, except in 2019 when conditions were too hazardous to visit the sites due to risk of falling branches and trees.
The occurrence of daily rain events was obtained from the Park Ridge weather station located approximately 3 km from the study area (RAWS, 2021). Hourly rain depth was summed for each day and converted to a binary variable indicating presence or absence of rain. We also used this data source for a daily regional air temperature measure.
Statistical Approach
Daily ACI, transformed by the base 10 logarithm, was the response variable in the models because we were interested in what explanatory variables influenced observed patterns in ACI. This transformation expressed the premise that explanatory variables had multiplicative effects on ACI, so the log transformation resulted in an additive model framework. Fire effects were represented by two explanatory variables: Fire History category (FH, Table 1 for descriptions) and Days Since Rough Fire (dayRF) was contained (06 November 2015). Additional variables were incorporated to explore effects on ACI: seasonal and interannual conditions were represented as Julian day and weather effects were represented by regional air temperature and a binary variable for measurable rainfall on that day. Although we found evidence for site specific temperature improving model fit, we did not include the variable in the final models because iButton (iButtonLink, LLC) data was not collected during the last year of ARU deployments due to unsafe conditions. In some cases, presence of abiotic sounds can influence ACI, so we included a variable for background sound levels below the frequencies of the biotic sounds we sought to measure.
We fitted 192 models we considered to express plausible relationships between these explanatory variables and ACI. Generalized Additive Mixed Models (GAMM) provided the structure for each model, fitted using package mgcv (Core Team, 2017; Wood, 2017). GAMM enabled us to investigate potentially nonlinear relationships between the explanatory variables and ACI, which seemed certain for seasonality and plausible for other factors. Additionally, GAMM framework enabled us to account for temporally autocorrelated data.
The first, simplest model used Site as a random effect. Two more models were generated by adding Days Since Rough Fire as a separate smooth term for each fire history (common to both) plus alternative representations for Julian Day: a simple smooth or distinct smooths for each fire history category. These three options were doubled to six by adding a set of models that included fire history as a factorial variable. These six options were quadrupled to 24 by adding three options to express the effects of air temperature: a shared smooth, distinct smooths by fire history, and distinct smooths by site. These 24 options were quadrupled to 96 by adding three options to express the effects of background noise level: a shared smooth, distinct smooths by fire history, and distinct smooths by site. The final doubling of model formulae was realized by adding a set of models that included the categorical Rain variable. Temporal autocorrelation of daily ACI was represented by the corCAR1 function on date nested within site variables. All models assumed Gaussian errors in fitting the dependent variable (an identity link function was used). Further, we investigated collinearity of explanatory variables a priori and found low correlation among variables.
Multimodel inference in the R statistical environment was used to evaluate which model provided the lowest AICc values: the best mix of prediction accuracy and concision (Burnham et al., 2011; MuMIn v1.43.17; Core Team, 2017). The best-performing model was then used to interpret the patterns in ACI. Partial conditional dependence plots (e.g., Figure 2) affirmed that residual errors were generally unimodal and symmetric about the predicted values.
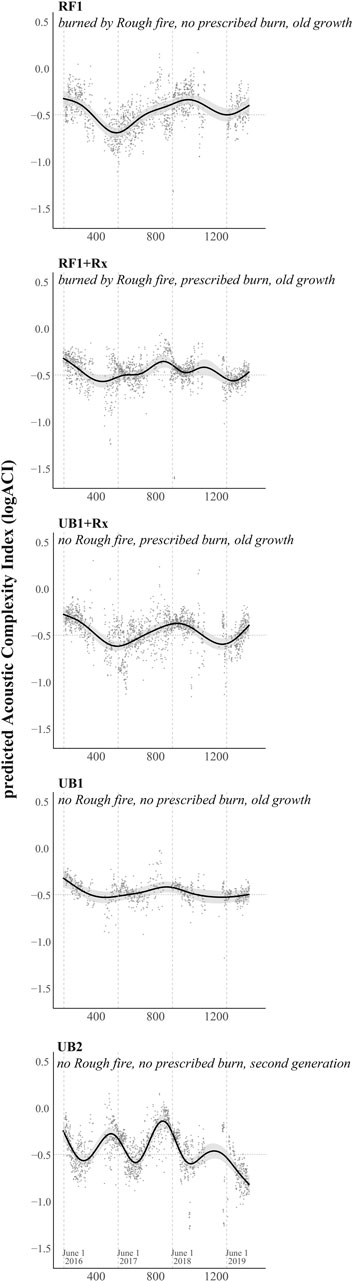
FIGURE 2. Predicted relationships between ACI and days since Rough Fire was extinguished across fire history sites over the four-year monitoring period. Plots are partial conditional dependence plots of the logarithm of predicted Acoustic Complexity Index, log10(ACI) and days since Rough Fire was extinguished. Vertical dashed lines reference 1st June across all years for reference to typical seasonal increase in ACI related to spring ecoacoustics activity dominated by avian calling.
Using the predicted ACI values from the best performing model, we compared patterns across all fire history categories, between sites burned by Rough Fire, and within the seasonal peak in ACI.
Vegetation Surveys
To understand changes in vegetation and habitat structure post-fire, vegetation surveys were conducted at each site in the beginning of the study (June 2016) and repeated at the end of the study (June 2019). Two or three randomly located plots were sampled near each acoustic recorder site to measure features of the vegetation, including ground and canopy cover and fuel load (Table 3). Plot locations were determined through random point generation in ArcGIS software (ESRI, Inc.), under the conditions that each plot was within a 150 m buffer of the study site ARU. Area sampled was based on the nearest 20 large trees [trees ≥10 cm diameter at breast height (DBH)] and nearest 20 small trees (<10 cm DBH) to the plot center. Cover of bare ground, herbaceous plants, and shrubs were determined using three 15 m point-intersect transects run at random directions from the marked plot center. Overstory canopy cover was determined at plot center using a spherical densiometer with four subsamples collected at each cardinal compass direction and then averaged together. Fuel loads, consisting of litter, duff, and coarse woody debris were measured along the three 15 m transects using Brown’s Inventory methods (Brown, 1974).
Results
Acoustic data were collected from June 2016 through November 2019 at all nine sites within a giant sequoia forest in California, United States resulting in a total of 6,598 recording days. Total recordings days at each site varied slightly (Table 1, Supplementary Figure S2).
Variation in Ecoacoustic Index
Our statistical analysis exploring the relationship between ecoacoustic index (ACI) and a suite of plausible explanatory variables revealed strong evidence for variation explained by time-since-fire and fire history (Figure 2) while controlling for effects of season and air temperature. The best performing statistical model using multimodel inference method (Supplementary Table S1) showed a delta AIC of 12 from the next best performing model and therefore this model was used to interpret the relationships between the explanatory variables and ACI (Burnham et al., 2011). The best performing model explained 69% (adjusted r-sq = 0.69) of the observed variation in ACI and included four explanatory variables: day since Rough Fire was conditioned on fire history category, air temperature, season (Julian Day), and site as random effect (Table 2).
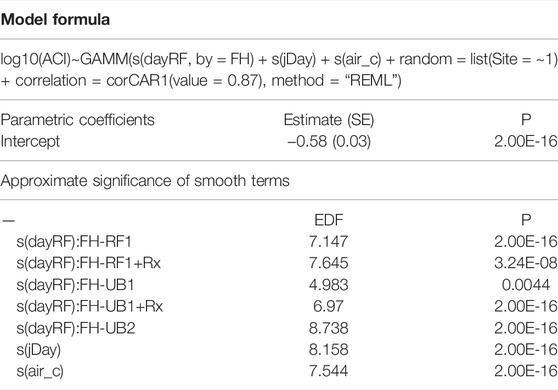
TABLE 2. Summary of best performing generalized additive mixed model (GAMM) assessing the relationship of Acoustic Complexity Index (ACI) to fire history, seasonality, and weather (regional temperature and rain). SE = standard error; dayRF = days since Rough Fire extinguished; jDay = Julian day; air_c = air temperature; FH = fire history category (Table 1); site = monitoring site number; REML = restricted maximum likelihood smoothing parameter.
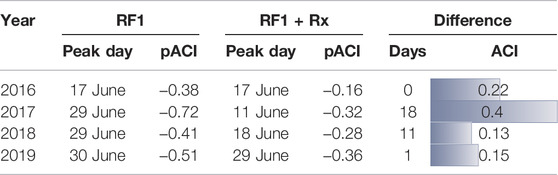
TABLE 3. Summary of peak day and predicted ACI (pACI) in June across all years of monitoring at sites burned by the Rough Fire.
Evidence for the influence of fire on ACI was expressed as distinct smooth terms for days since Rough Fire for each fire history category (Table 2; Figure 2). While ACI was similar across all sites in the first spring post fire (∼day 200, Figure 2), the patterns began to deviate in the second spring post fire (∼day 600, Figure 2), with a pronounced decrease at the RF1 category. The RF1 + Rx category showed some variation in ACI after the Rough Fire with lower ACI in the second spring after the fire but then less pronounced fluctuations throughout the remainder of the study (Figure 2). At the sites unburned by Rough Fire, UB1+Rx had low ACI values in the second spring after the fire (∼day 600, Figure 2) and UB1 showed similar, but less pronounced seasonal patterns in ACI throughout the study period (Figure 2) and the only smooth function with low evidence of effect on ACI from days since fire in this fire history category (Table 2). The patterns in UB2 sites showed the strongest seasonal variation expressed by maximum ACI values in early summer and minimum ACI values in mid-winter before a sharp decline beginning around day 1,200 (Figure 2). The UB2 peaks in ACI also occurred earlier in the spring season compared to the other fire history categories (Figure 2).
We found strong evidence that season, modeled as Julian day, was a significant predictor of ACI with higher predicted ACI in late spring months (Table 2; Figure 3A). A comparison of predicted ACI values within the month of June showed differences in magnitude across the fire history categories (Figure 3B). The first June (2016) after the fire had the highest predicted ACI across all sites with a decrease in second season (2017) and evidence for an increase in third season (2018). The predicted ACI in the second spring after the fire (2017) had the greatest differences between fire history categories, especially the RF1 compared to RF1 + Rx (Figure 3). UB1 + Rx also showed a similar decrease in ACI the second spring post fire, similar to RF1. These sites are relatively close to the edge of the Rough Fire (Figure 1). The differences between predicted ACI narrowed in June 2018 and were most similar across all fire history categories. All fire history categories showed lower predicted ACI in June 2019 compared to 2018 (Figure 3), suggesting a regional effect related to drought conditions during the study period, although this was not directly tested. This effect was less pronounced at RF1 + Rx and UB1 fire history categories. Regional air temperature also showed evidence for an effect on AIC (Table 2). AIC was predicted to be lower at high and lower temperatures.
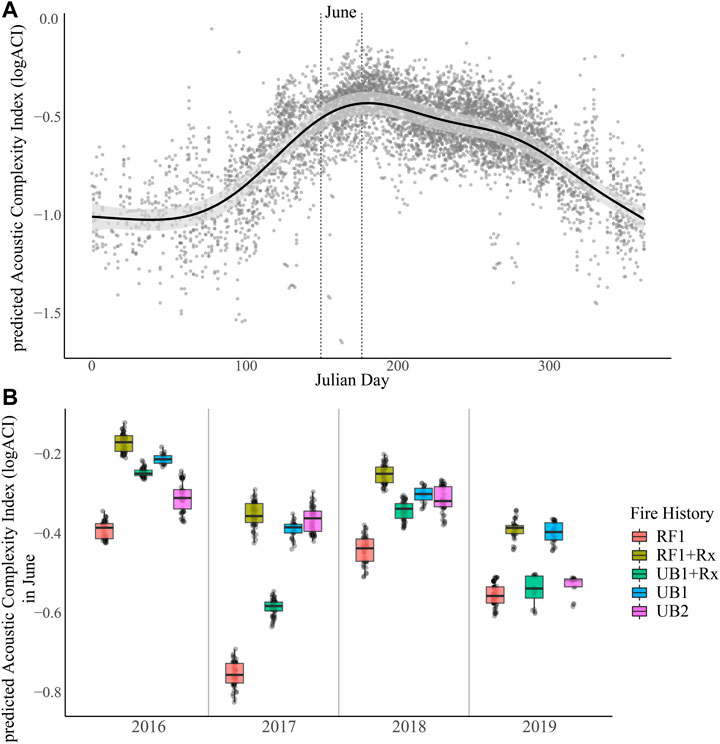
FIGURE 3. Seasonal effects on Acoustic Complexity Index. (A) Predicted relationship between ACI and Julian day across all sites and years showing increase in ACI in the month of June. (B) Comparison of predicted ACI in the month of June—the peak period in avian ecoacoustic activity—across all years and within each fire history category. RF1 = burned by the Rough Fire without a prescribed fire history in old growth forest; RF1 + Rx = burned by the Rough Fire with prior prescribed fire in old growth forest; UB1 + Rx = unburned by the Rough Fire but with prior prescribed fire in old growth forest; UB1 = no recorded fire history in an old growth sequoia forest; UB2 = no recorded fire history in a second-generation sequoia forest.
Comparison of Sites Burned by Rough Fire
We compared the predicted acoustic complexity at sites burned by the 2015 Rough Fire (RF1 and RF1 + Rx) to evaluate differences in ACI related to prescribed burning prior to wildfire. Across all years, monthly median predicted ACI was higher at the sites with prescribed burning occurring prior to the Rough Fire (RF1 + Rx, Figure 4). The differences in ACI were greatest in the second season after the fire (2017), then the difference between these fire history categories decreased in 2018 and 2019 (Figure 4).
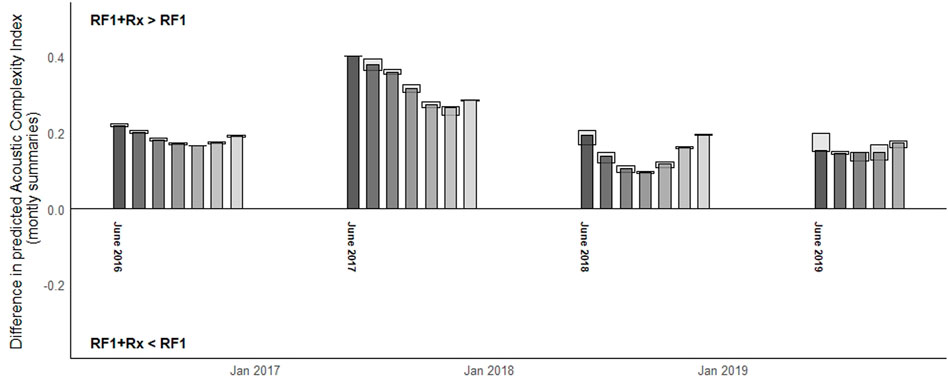
FIGURE 4. Difference in predicted Acoustic Complexity Index between sites burned by the Rough Fire with prior prescribed burn (RF1 + Rx) compared to sites without prior prescribed burn (RF1). Positive values indicated ACI or ecoacoustic activity was higher at sites with prescribed burn prior to Rough Fire. Gray shaded bars are median differences for the specific month, colored by month. Light gray bars behind are the 75th and 25th quartiles for the monthly differences.
Using the predicted daily ACI in June across all years, we observed evidence for a shift in the seasonal timing peak ACI between RF1 and RF1 + Rx (Table 4). In the first June after the fire (2016) peak day was similar across all sites, but AIC was greater at RF1 + Rx sites. In second and third spring after Rough Fire (2017, 2018) peak day was earlier at RF1 + Rx sites and largest difference in ACI values was in the second spring post fire. In fourth season, peak ACI shifted back to late-June for the RF1 + Rx sites similar to the RF1 sites.
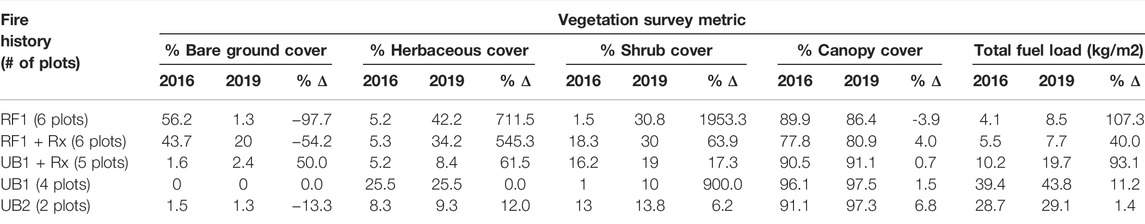
TABLE 4. Summary of vegetation surveys post Rough Fire at sites in the different fire history treatments. Values were averaged across all plots and sites within the different fire history categories.
Changes in Vegetation and Habitat Structure
We observed changes in vegetation and habitat structure from the post fire vegetation surveys conducted in spring 2016 and 2019 (Table 4, Supplementary Figure S1) and the changes differed across fire history categories. In general, the vegetation structure on the ground changed to a greater degree at the sites with Rough Fire (RF1 and RF1 + Rx). For example, bare ground was reduced by 50–100% at Rough Fire sites from the growth of shrubs and herbaceous plants, compared to little change or increase at the non-Rough Fire sites (UB1 + Rx, UB1, UB2). Differences in canopy cover varied across sites, yet patterns related to fire history category were less obvious. Canopy decreased by 4% at RF1 and increased at UB2 by 7%. Total fuel load increased at all fire histories plots with the greatest increase at RF1 and the least change at UB2.
Discussion
Monitoring ecological systems after disturbance using methods that represent broad ecological features and sample over large temporal and spatial scales can provide a comprehensive picture of system response. Passive acoustic monitoring offers these benefits with emerging scalable technologies and analytical methodologies. Our exploratory study using four-years of nearly continuous passive acoustic monitoring (PAM) data collected at nine sites with five different fire histories demonstrated the potential to employ ecoacoustic methods to study ecosystem response to wildfire on landscape scales. We found distinct patterns in ecoacoustic index related to time-since-fire, fire history category, season, and air temperature. Vegetation surveys evaluating habitat structure conducted at the beginning and end of the study (Table 4) documented changes in the habitat expected post fire and complimented interpretation of observed changes an ecoacoustic index collected at finer temporal resolution.
Post-Fire Avian Response Using Ecoacoustics
Previous studies on avian response trajectories to fire provide important context for interpreting observed changes in ACI related to time-since-fire and fire history. Species abundance is known to increase immediately after low-severity fire (Hutto and Patterson, 2016). In our study, we found strong evidence that the highest ACI occurred in the first spring after the fire and to the greatest degree at the study sites impacted by the Rough Fire with prior prescribed burning (RF1 + Rx, Figure 2), indicating that low-severity burned areas increases ecoacoustic activity. Further, the relatively stable post-fire ACI relationship across the subsequent seasons at RF1 + Rx sites suggested that resident and migratory bird species may have ultimately benefited from low-severity fire; an outcome that has been documented in nearby mixed conifer Sierra Nevada forests (Bagne & Purcell, 2011). The vegetation surveys at the low-severity burned sites (RF1 + Rx) also showed that habitat structure changes likely resulted in increased habitat heterogeneity by reducing forest fuel while maintaining a green, uncharred forest canopy with understory structure (Table 4).
In the absence of prior prescribed fire, the Rough Fire burned at moderate to high-severity at the RF1 sites (Figure 1; Table 1) and we did not see the same response trajectory in ACI compared to the low-severity burned sites (RF1 + Rx). The ACI response pattern at RF1 sites exhibited the most pronounced successive decreases in the first and second years after the fire (Figures 2, 3). By the third year of monitoring (2018) the ACI response pattern at RF1 rebounded and predicted ACI values were most similar to the RF1 + Rx sites (Figure 3), indicating habitat conditions at the moderate to high-severity burned sites improved by the third season. Vegetative surveys in the fourth year (2019) showed a dramatic increase in shrub cover compared to the first season after the fire (Table 4). However, canopy cover was reduced by 4% which may have shifted the bird community compositions to early succession bark foragers and cavity nesting avian species (Stephens et al., 2015). While this study did not investigate shifts in species composition related to post fire conditions, future analysis of the archived acoustic data may further elucidate these observed shifts in ecoacoustic activity in relation to species present near these sites.
Consideration of Landscape-Scale Changes Related to Fire
The sites unburned by the Rough Fire (UB1 + Rx, UB1, and UB2) offered some context for how fire changed ecoacoustic activity post-wildfire. ACI similarities between RF1 + Rx and UB1 + Rx suggested that overall lower sustained ACI measured at RF1 could be avoided with increased and active prescribed fire management program. However, the unburned sites are all relatively close to where the Rough Fire burned (Figure 1) and our results suggest these sites were impacted by the presence of the nearby Rough Fire, therefore not considered true control sites. Specifically, while the UB1 + Rx had consistent and sustained higher predicted ACI, similar to RF1 + Rx, the response trajectory post-fire was more similar to that of RF1 (Figure 2) with a second spring season post-fire reduction in ecoacoustic activity (Figure 3). These results indicated that wildfire likely changed ecological conditions in nearby unburned forests, even if habitat structure did not change (Table 4).
Prior to the Rough Fire, the fire history at the RF1 sites was like that of the UB1 site (Table 1), both late succession giant sequoia forest. Thus, comparing the RF1 and UB1 response trajectories likely reflected the effect of high-severity fire in late succession forests when fire has been excluded from the system. Compared to RF1, UB1 exhibited higher overall predicted ACI, yet less seasonal ACI variation (Figure 2). The lower ACI variation across season likely related to a lack of early successional bird communities and may even indicate lower species diversity and density, as has been found in other late successional forests in Oregon, United States (Cushman and McGarigal, 2003). Even with reduced habitat structure and ecoacoustic activity at moderate to high-severity burn sites (RF1) when compared to RF1 + Rx, the Rough Fire may have increased species diversity in an otherwise late succession giant sequoia forest when compared to UB1.
Within the Grant Grove peninsula, it was difficult to find late succession sequoia forests that were not previously burned to compare to RF1. The only other options besides one site within UB1 for representing fire suppressed sequoia forests was to include sites in previously logged second generation forests (UB2), which were geographically appropriate but dissimilar in habitat structure (Figure 1; Table 4). Most giant sequoia logging in this area took place in the late 1800 s, and after an early successional herbaceous stage, the logged forests rapidly transitioned to dense thickets of second-generation giant sequoias with very little understory diversity and structure (Biswell et al., 1966). In the absence of disturbance, this condition persisted at UB2, and the resulting ACI suggested strong and consistent seasonal patterns with a pronounced negative response towards the end of the study. The sharp decline in ACI at UB2 towards the end of the study might indicate local movement away from the fire-suppressed, early successional UB2 forests toward the nearby newly recovering areas of the Rough Fire. Further evaluation of species composition across all years is necessary to understand how shifts in ecoacoustic activity may be connected based on responses across the region.
Drought conditions across all monitoring sites likely influenced the observed decrease in ACI in the final year of monitoring (2019, Figure 2, 3) but was not explicitly evaluated in this study. Other studies have documented Sierra Nevada avian population declines from drought and climate change (Roberts et al., 2019). Assessment of multiple and interacting threats to this forest system complicated the observed relationships to fire history presented in this study yet provided some evidence that could be investigated in future studies. To further understand these interacting disturbance regimes on ecological conditions, longer term acoustic monitoring to compare to measures of disturbance is needed.
The daily temporal resolution of the ecoacoustic index showed evidence for phenological shifts in ecoacoustic activity related to fire history category. Daily predicted ACI increased to a local maximum in June in all years at most sites (Figure 3), yet we found that peak activity in June differed between the RF1 and RF1 + Rx sites (Table 3). Later peaks at RF1 sites in 2017 and 2018 suggested that birds may utilize less disturbed habitats before moving to more disturbed habitats across this forest landscape. These changes in phenology through ACI further elucidated post-fire effects across habitats by signaling the onset, magnitude, and timing of seasonal ecoacoustic activity and how these interactions maybe related in a pyrodiverse giant sequoia forest landscape.
Expanding Ecoacoustic Methods for Ecological Insight
Although we documented evidence for acoustic patterns that correspond to ecological changes known to have occurred in the first four years after a fire, longer term studies could address additional suites of questions, such as succession, ecological stability, and fire regime shifts (Fontaine and Kennedy, 2012), as well as interactions with broader regional pattern such as drought. The longer-term ecosystem responses to fire that have been documented (Stephens et al., 2015; Tingley et al., 2016) likely have concomitant ecoacoustic expressions. The modest cost of sustaining a passive acoustic monitoring network and near-real time index of ecoacoustic activity encourages integration into long-term research programs, yet integration into fire management strategies remains challenged by established protocols, budgets, and perceptions of the value added.
Future research that adopts ecoacoustic indices can benefit from the pragmatic lessons presented here. First, co-locating acoustic recorders with other environmental sensors would improve predictions by controlling for micro-climate drivers in ecoacoustic activity. Second, we obtained informative results from a single ecoacoustic index, ACI; however, a multivariate response model employing a suite of ecoacoustic indices may reveal more detailed patterns of the ecological community. The elevated complexity of these analyses will be increasingly justified as the diversity of sampled ecosystems and acoustically active communities increases (Buxton et al., 2018). Specific detectors that identify bird species and call types can merge behavioral information into ecoacoustic trends, enhancing opportunities to identify mechanisms and drivers of observed patterns, like the fire-history related reductions and phenological shifts. Automated techniques for extraction and classification of species-specific acoustic signals are rapidly improving (Balantic and Donovan, 2020; de Oliveira et al., 2020; Knight et al., 2020). Lastly, periodic communication of acoustical summaries and near-real time alerts to anomalous events like biological invasions have the potential to inform resource management decisions and actions as events unfold (Wood et al., 2019). The capacity to archive acoustic data generates future opportunities to extract more detailed information from these data.
Adopting Ecoacoustic Methods Into Fire Management Strategies
Understanding environmental conditions often relies on indices derived from remote sensing to provide simplified trends in conditions. For example, satellite derived drought indices are relied upon for monitoring and evaluating drought severity across landscapes (Lydersen et al., 2016). Climate indices are used to characterize an aspect of ocean circulation pattern (Schwing et al., 2002). The public, government, and researchers routinely utilize these indices as benchmarks to inform their decisions about the status of conditions. The strength of these indices is a simple diagnostic quantity captured over broad spatial and temporal scales; the limitations are the simplification of complex dynamics represented in a single index.
While ecoacoustic indices are known to represent features of the biological community (Bradfer-Lawrence et al., 2019; Metcalf et al., 2020; Stowell and Sueur, 2020), adoption of these methods into larger scale assessments is limited. These acoustic monitoring sites sit within a broader regional landscape, where management agencies routinely use remote sensing indices to better understand conditions. We argue that this predicted ecoacoustic index, when collected at daily resolution and processed nearly in real-time, offers a scalable remote sensing index to monitor ecological condition after wildfire and complements vegetation surveys and burn severity indices. While only evaluated in a giant sequoia forest landscape, other forest types may show similar ecoacoustic trajectories after wildfires.
Conclusion
This research explored the use of ecoacoustic methods to represent ecological conditions after wildfire in iconic giant sequoia forests of the western United States. Remaining giant sequoia stands are threatened by increases in size and occurrence of catastrophic wildfires. We present a timely study exploring sequoia forest condition using remote acoustic sensing as a complement to traditional forest health metrics. Passive acoustic monitoring was sustained almost continuously for four years at nine sites. The monitoring sites represented five fire histories which expressed distinct and persistent patterns in time series of an ecoacoustic index computed from the recordings. The analyses also revealed which times of year exhibited the greatest contrasts in the ecoacoustic index and possible landscape-scale effects related to wildfire. Using ecoacoustic indices in wildfire monitoring may provide a scalable remote sensing benchmark of ecological condition. For example, these methods could be applied after prescribed burns to quantify the temporal dynamics of recovery to inform the scheduling and spatial scale of such burns to realize management objectives for resource conservation and restoration of sustainable fire regimes.
Data Availability Statement
The raw data supporting the conclusion of this article will be made available by the authors, without undue reservation.
Author Contributions
EM, KF, LS, and MM contributed to the conception and design of the study. EM and LS facilitated acoustic data collection, evaluated data quality, and performed initial data analysis. AC facilitated data collection, quality, and summaries for vegetation surveys. EM and MM provided overall project management and guidance. EM, MM, and CL developed and performed the ecoacoustic analysis. EM wrote the first draft of the manuscript. MM wrote sections of the manuscript. All authors contributed to manuscript revision, read, and approved the submitted version.
Funding
This research was funded by the National Park Service.
Conflict of Interest
The authors declare that the research was conducted in the absence of any commercial or financial relationships that could be construed as a potential conflict of interest.
Publisher’s Note
All claims expressed in this article are solely those of the authors and do not necessarily represent those of their affiliated organizations, or those of the publisher, the editors and the reviewers. Any product that may be evaluated in this article, or claim that may be made by its manufacturer, is not guaranteed or endorsed by the publisher.
Acknowledgments
We thank Annie Esperanza for her extensive support of this work. We thank Tyler Coleman for reviewing this manuscript. We also thank NPS employees Robert Mertens, Kelly Martin, Joshua Flickinger, Colin Bloom, Bailey Rockwell, Laura Del Valle Rosario, Andrea Garcia Jimenez, Danielle Shaffer, Hannah Waterhouse, Mark Garrett, Mari Knowles, Robert Kemper, Taylor Fridrich, Genomé Rodriguez, and Matthew Larsen for field work. We appreciate the extensive technical support provided by the National Park Service Natural Sounds and Night Skies Division, including Jacob Job, Christopher Garsha, Damon Joyce, and Emma Brown.
Supplementary Material
The Supplementary Material for this article can be found online at: https://www.frontiersin.org/articles/10.3389/frsen.2022.837866/full#supplementary-material
Supplementary Figure S1 | Photographs of study sites in across five different fire history treatments in Grant Grove, Kings Canyon National Park, CA United States. Included are: Rough Fire burned, no prescribed fire (RF1) in (A) May 2016 and (B) November 2019; Rough Fire burned, prescribed fire (RF1 + Rx) in (C) May 2016 and (D) November 2019; No Rough Fire burned, prescribed fire (UB1 + Rx) in (E) May 2016 and (F) November 2019; No Rough Fire burned, no prescribed fire (UB1) in (G) May 2016 and (H) November 2019; and No Rough Fire burned, no prescribed fire in second generation forest (UB2) in (I) May 2016 and (J) November 2019.
Supplementary Figure S2 | Summary of recording days in each month across all years of monitoring.
Supplementary Table S1 | Summary of 10 best performing models evaluated using model selection procedure (ACIc). All model structures also included the following components: temporal correlation for day and REML method. Model terms: logACI=log of acoustic complexity index, FH=fire history category, dayRF=days since Rough Fire extinguished, jDay=Julian day, air_c = regional air temperature, Site = unique site ID (see Table 1), and “re”=random effect.
References
Adams, M. A. (20132013). Mega-fires, Tipping Points and Ecosystem Services: Managing Forests and Woodlands in an Uncertain Future. For. Ecol. Manag. 294, 250–261. doi:10.1016/j.foreco.2012.11.039
Bagne, K. E., and Purcell, K. L. (2011). Short-term Responses of Birds to Prescribed Fire in Fire-Suppressed Forests of California. J. Wildl. Manag. 75 (5), 1051–1060. doi:10.1002/jwmg.128
Balantic, C. M., and Donovan, T. M. (2020). Statistical Learning Mitigation of False Positives from Template-Detected Data in Automated Acoustic Wildlife Monitoring. Bioacoustics 29 (3), 296–321. doi:10.1080/09524622.2019.1605309
Biswell, H. H., Buchanan, H., and Gibbens, R. P. (1966). Ecology of the Vegetation of a Second-Growth Sequoia Forest. Ecology 47 (4), 630–634. doi:10.2307/1933942
Bradfer-Lawrence, T., Gardner, N., Bunnefeld, L., Bunnefeld, N., Willis, S. G., and Dent, D. H. (2019). Guidelines for the Use of Acoustic Indices in Environmental Research. Methods Ecol. Evol. 10 (10), 1796–1807. doi:10.1111/2041-210X.13254
Brown, J. K. (1974). "Handbook for Inventorying Downed Woody Material," in Intermountain Forest and Range Experiment Station, General Technical Report GTR-INT-16 Ogden. UT, USA: USDA Forest Service. Available from: https://www.fs.usda.gov/treesearch/pubs/28647, p. 34.
Burnham, K. P., Anderson, D. R., and Huyvaert, K. P. (2011). AIC Model Selection and Multimodel Inference in Behavioral Ecology: Some Background, Observations, and Comparisons. Behav. Ecol. Sociobiol. 65 (1), 23–35. doi:10.1007/s00265-010-1029-6
Buxton, R. T., Brown, E., Sharman, L., Gabriele, C. M., and McKenna, M. F. (2016). Using Bioacoustics to Examine Shifts in Songbird Phenology. Ecol. Evol. 6 (14), 4697–4710. doi:10.1002/ece3.2242
Buxton, R. T., McKenna, M. F., Clapp, M., Meyer, E., Stabenau, E., Angeloni, L. M., et al. (2018). Efficacy of Extracting Indices from Large-Scale Acoustic Recordings to Monitor Biodiversity. Conservation Biol. 32 (5), 1174–1184. doi:10.1111/cobi.13119
CalFire, (2021). CalFire. California Government. Available from: fire.ca.gov/stats-events/. Accessed April 3, 2022.
Coop, J. D., Parks, S. A., Stevens-Rumann, C. S., Crausbay, S. D., Higuera, P. E., Hurteau, M. D., et al. (2020). Wildfire-Driven Forest Conversion in Western North American Landscapes. BioScience 70 (8), 659–673. doi:10.1093/biosci/biaa061
Core Team, R. (2017). R: A Language and Environment for Statistical Computing. (3.1.4). R Foundation for Statistical Computing. Available from: https://www.r-project.org/.
Cushman, S. A., and McGarigal, K. (2003). Landscape-level Patterns of Avian Diversity in the Oregon Coast Range. Ecol. Monogr. 73 (2), 259–281. doi:10.1890/0012-9615(2003)073[0259:lpoadi]2.0.co;2
Darras, K., Batáry, P., Furnas, B. J., Grass, I., Mulyani, Y. A., and Tscharntke, T. (2019). Autonomous Sound Recording Outperforms Human Observation for Sampling Birds: a Systematic Map and User Guide. Ecol. Appl. 29 (6), e01954. doi:10.1002/eap.1954
de Oliveira, A. G., Ventura, T. M., Ganchev, T. D., Silva, L. N. S., Marques, M. I., and Schuchmann, K.-L. (2020). Speeding up Training of Automated Bird Recognizers by Data Reduction of Audio Features. PeerJ 8, e8407. doi:10.7717/peerj.8407
DellaSala, D. A., Hutto, R. L., Hanson, C. T., Bond, M. L., Ingalsbee, T., Odion, D., et al. (2017). Accommodating Mixed-Severity Fire to Restore and Maintain Ecosystem Integrity with a Focus on the Sierra Nevada of California, USA. Fire Ecol. 13 (2), 148–171. doi:10.4996/fireecology.130248173
Driscoll, D. A., Lindenmayer, D. B., Bennett, A. F., Bode, M., Bradstock, R. A., Cary, G. J., et al. (2010). Fire Management for Biodiversity Conservation: Key Research Questions and Our Capacity to Answer Them. Biol. Conservation 143 (9), 1928–1939. doi:10.1016/j.biocon.2010.05.026
Eldridge, A., Casey, M., Moscoso, P., and Peck, M. (2016). A New Method for Ecoacoustics? toward the Extraction and Evaluation of Ecologically-Meaningful Soundscape Components Using Sparse Coding Methods. PeerJ 4 (6), e2108. doi:10.7717/peerj.2108
Farina, A., Ceraulo, M., Bobryk, C., Pieretti, N., Quinci, E., and Lattanzi, E. (2015). Spatial and Temporal Variation of Bird Dawn Chorus and Successive Acoustic Morning Activity in a Mediterranean Landscape. Bioacoustics 24 (3), 269–288. doi:10.1080/09524622.2015.1070282
Fontaine, J. B., and Kennedy, P. L. (2012). Meta-analysis of Avian and Small-Mammal Response to Fire Severity and Fire Surrogate Treatments in U.S. Fire-Prone Forests. Ecol. Appl. 22 (5), 1547–1561. doi:10.1890/12-0009.1
Fuller, S., Axel, A. C., Tucker, D., and Gage, S. H. (2015). Connecting Soundscape to Landscape: Which Acoustic index Best Describes Landscape Configuration? Ecol. Indicators 58, 207–215. doi:10.1016/j.ecolind.2015.05.057
Gasc, A., Sueur, J., Jiguet, F., Devictor, V., Grandcolas, P., Burrow, C., et al. (2013). Assessing Biodiversity with Sound: Do Acoustic Diversity Indices Reflect Phylogenetic and Functional Diversities of Bird Communities? Ecol. Indicators 25, 279–287. doi:10.1016/j.ecolind.2012.10.009
Gasc, A., Gottesman, B. L., Francomano, D., Jung, J., Durham, M., Mateljak, J., et al. (2018). Soundscapes Reveal Disturbance Impacts: Biophonic Response to Wildfire in the Sonoran Desert Sky Islands. Landscape Ecol. 33 (8), 1399–1415. doi:10.1007/s10980-018-0675-3
Grant, P. B. C., and Samways, M. J. (2016). Use of Ecoacoustics to Determine Biodiversity Patterns across Ecological Gradients. Conservation Biol. 30 (6), 1320–1329. doi:10.1111/cobi.12748
Griffin, D., and Anchukaitis, K. J. (2014). How Unusual Is the 2012-2014 California Drought? Geophys. Res. Lett. 41 (24), 9017–9023. doi:10.1002/2014GL062433
Haultain, S. A., Reyes, E. T., Menke, J. M., Johnson, D. N., and Karavidas, D. L. (2020). Sequoia and Kings Canyon National Parks Vegetation Classification and Mapping Project Report. Fort Collins, Colorado: National Park Service. Available from: https://irma.nps.gov/DataStore/Reference/Profile/2272522.
Hutto, R. L., and Patterson, D. A. (2016). Positive Effects of Fire on Birds May Appear Only under Narrow Combinations of Fire Severity and Time-Since-Fire. Int. J. Wildland Fire 25 (10), 1074–1085. doi:10.1071/WF15228
Jones, G. M., Gutiérrez, R., Tempel, D. J., Whitmore, S. A., Berigan, W. J., and Peery, M. Z. (2016). Megafires: an Emerging Threat to Old-forest Species. Front. Ecol. Environ. 14 (6), 300–306. doi:10.1002/fee.1298
Kilgore, B. M. (1971). Response of Breeding Bird Populations to Habitat Changes in a Giant Sequoia Forest. Am. Midland Naturalist 85 (1), 135–152. doi:10.2307/2423918
Kilgore, B. M., and Taylor, D. (1979). Fire History of a Sequoia-Mixed Conifer Forest. Ecology 60 (1), 129–142. doi:10.2307/1936475
Knapp, E. E., Keeley, J. E., Ballenger, E. A., and Brennan, T. J. (2005). Fuel Reduction and Coarse Woody Debris Dynamics with Early Season and Late Season Prescribed Fire in a Sierra Nevada Mixed conifer forest. For. Ecol. Manag. 208 (1–3), 383–397. doi:10.1016/j.foreco.2005.01.016
Knight, E. C., Sòlymos, P., Scott, C., and Bayne, E. M. (2020). Validation Prediction: a Flexible Protocol to Increase Efficiency of Automated Acoustic Processing for Wildlife Research. Ecol. Appl. 30 (7), e02140. doi:10.1002/eap.2140
Kramer, A., Jones, G. M., Whitmore, S. A., Keane, J. J., Atuo, F. A., Dotters, B. P., et al. (2021). California Spotted Owl Habitat Selection in a Fire-Managed Landscape Suggests Conservation Benefit of Restoring Historical Fire Regimes. For. Ecol. Manag. 479, 118576. doi:10.1016/j.foreco.2020.118576
Lee, B. P. Y.-H., Davies, Z. G., and Struebig, M. J. (2017). Smoke Pollution Disrupted Biodiversity during the 2015 El Niño Fires in Southeast Asia. Environ. Res. Lett. 12 (9), 094022. doi:10.1088/1748-9326/aa87ed
Leech, D. I., and Crick, H. Q. P. (2007). Influence of Climate Change on the Abundance, Distribution and Phenology of woodland Bird Species in Temperate Regions. Ibis 149 (s2), 128–145. doi:10.1111/j.1474-919X.2007.00729.x
Lindenmayer, D. B., Candy, S. G., MacGregor, C. I., Banks, S. C., Westgate, M., Ikin, K., et al. (2016). Do temporal Changes in Vegetation Structure Additional to Time since Fire Predict Changes in Bird Occurrence? Ecol. Appl. 26 (7), 2267–2279. doi:10.1002/eap.1367
Lydersen, J. M., Collins, B. M., Miller, J. D., Fry, D. L., and Stephens, S. L. (2016). Relating Fire-Caused Change in forest Structure to Remotely Sensed Estimates of Fire Severity. Fire Ecol. 12 (3), 99–116. doi:10.4996/fireecology.1203099
Lynch, E., Joyce, D., and Fristrup, K. (2011). An Assessment of Noise Audibility and Sound Levels in U.S. National Parks. Landscape Ecol. 26 (9), 1297–1309. doi:10.1007/s10980-011-9643-x
Merchant, N. D., Fristrup, K. M., Johnson, M. P., Tyack, P. L., Witt, M. J., Blondel, P., et al. (2015). Measuring Acoustic Habitats. Methods Ecol. Evol. 6 (3), 257–265. doi:10.1111/2041-210X.12330
Metcalf, O. C., Barlow, J., Devenish, C., Marsden, S., Berenguer, E., and Lees, A. C. (2020). Acoustic Indices Perform Better when Applied at Ecologically Meaningful Time and Frequency Scales. Methods Ecol. Evol. 12, 421–431. doi:10.1111/2041-210X.13521
Meyer, M. D., Estes, B. L., Wuenschel, A., Bulaon, B., Stucy, A., Smith, D. F., et al. (2019). Structure, Diversity and Health of Sierra Nevada Red Fir Forests with Reestablished Fire Regimes. Int. J. Wildland Fire 28 (5), 386–396. doi:10.1071/WF18114
Moore, J., Pope, J., Woods, M., and Ellis, A. (2018). 2017 Tree Mortality Aerial Detection Survey Results, Vol Report R5-.
Mutch, L., and Swetnam, T. (1995). Effects of Fire Severity and Climate on Ring-Width Growth of Giant Sequoia after Fire.
Nesmith, J. C. B., Caprio, A. C., Pfaff, A. H., McGinnis, T. W., and Keeley, J. E. (2011). A Comparison of Effects from Prescribed Fires and Wildfires Managed for Resource Objectives in Sequoia and Kings Canyon National Parks. For. Ecol. Manag. 261 (7), 1275–1282. doi:10.1016/j.foreco.2011.01.006
NPS (2003). Sequoia and Kings Canyon National Parks Fire Management Plan. Washington, DC: U.S. National Park Service.
Paz-Kagan, T., Brodrick, P. G., Vaughn, N. R., Das, A. J., Stephenson, N. L., Nydick, K. R., et al. (2017). What Mediates Tree Mortality during Drought in the Southern Sierra Nevada? Ecol. Appl. 27 (8), 2443–2457. doi:10.1002/eap.1620
Pieretti, N., Farina, A., and Morri, D. (2011). A New Methodology to Infer the Singing Activity of an Avian Community: The Acoustic Complexity Index (ACI). Ecol. Indicators 11 (3), 868–873. doi:10.1016/j.ecolind.2010.11.005
RAWS (2021). Remote Automatic Weather Stations USA Climate Archive. Western Regional Climate Center. Available from: https://raws.dri.edu/cgi-bin/rawMAIN.pl?caCPKR. (Accessed April 3, 2022).
Restaino, C., Young, D. J. N., Estes, B., Gross, S., Wuenschel, A., Meyer, M., et al. (2019). Forest Structure and Climate Mediate Drought-Induced Tree Mortality in Forests of the Sierra Nevada,USA. Ecol. Appl. 29 (4), e01902. doi:10.1002/eap.1902
Roberts, L. J., Burnett, R., Tietz, J., and Veloz, S. (2019). Recent Drought and Tree Mortality Effects on the Avian Community in Southern Sierra Nevada: a Glimpse of the Future? Ecol. Appl. 29 (2), e01848. doi:10.1002/eap.1848
Ross, S. R. P.-J., Friedman, N. R., Dudley, K. L., Yoshimura, M., Yoshida, T., and Economo, E. P. (2018). Listening to Ecosystems: Data-Rich Acoustic Monitoring through Landscape-Scale Sensor Networks. Ecol. Res. 33 (1), 135–147. doi:10.1007/s11284-017-1509-5
Schweizer, D., Nichols, T., Cisneros, R., Navarro, K., and Procter, T. (2020). “Wildland Fire, Extreme Weather and Society: Implications of a History of Fire Suppression in California, USA,” in Extreme Weather Events and Human Health: International Case Studies. Editor R. Akhtar (Springer International Publishing), 41–57. doi:10.1007/978-3-030-23773-8_4LB-Schweizer2020
Schwing, F. B., Murphree, T., and Green, P. M. (2002). The Northern Oscillation Index (NOI): A New Climate index for the Northeast Pacific. Prog. Oceanography 53 (2–4), 115–139. doi:10.1016/S0079-6611(02)00027-7
Simonson, W. D., Allen, H. D., and Coomes, D. A. (2014). Applications of Airborne Lidar for the Assessment of Animal Species Diversity. Methods Ecol. Evol. 5 (8), 719–729. doi:10.1111/2041-210X.12219
Steel, Z. L., Safford, H. D., and Viers, J. H. (2015). The Fire Frequency-Severity Relationship and the Legacy of Fire Suppression in California Forests. Ecosphere 6 (1), 1–23. doi:10.1890/ES14-00224.1
Steel, Z. L., Campos, B., Frick, W. F., Burnett, R., and Safford, H. D. (2019). The Effects of Wildfire Severity and Pyrodiversity on Bat Occupancy and Diversity in Fire-Suppressed Forests. Sci. Rep. 9 (1), 16300. doi:10.1038/s41598-019-52875-2
Stephens, J. L., Ausprey, I. J., Seavy, N. E., and Alexander, J. D. (2015). Fire Severity Affects Mixed Broadleaf-conifer forest Bird Communities: Results for 9 Years Following Fire. The Condor 117, 430–446. doi:10.1650/condor-14-58.1
Stephens, S. L., Westerling, A. L., Hurteau, M. D., Peery, M. Z., Schultz, C. A., and Thompson, S. (2020). Fire and Climate Change: Conserving Seasonally Dry Forests Is Still Possible. Front. Ecol. Environ. 18, 354–360. doi:10.1002/fee.2218
Stephenson, N. L., Das, A. J., Ampersee, N. J., Bulaon, B. M., and Yee, J. L. (2019). Which trees die during drought? The key role of insect host-tree selection. J. Ecol. 107, 2383–2401. doi:10.1111/1365-2745.13176
Stillman, A. N., Siegel, R. B., Wilkerson, R. L., Johnson, M., Howell, C. A., and Tingley, M. W. (2019). Nest Site Selection and Nest Survival of Black-Backed Woodpeckers after Wildfire. The Condor 121 (3), duz039. doi:10.1093/condor/duz039
Stowell, D., and Sueur, J. (2020). Ecoacoustics: Acoustic Sensing for Biodiversity Monitoring at Scale. Remote Sens Ecol. Conserv 6 (3), 217–219. doi:10.1002/rse2.174
Sueur, J., and Farina, A. (2015). Ecoacoustics: the Ecological Investigation and Interpretation of Environmental Sound. Biosemiotics 8 (3), 493–502. doi:10.1007/s12304-015-9248-x
Swetnam, T. W., Baisan, C. H., Caprio, A. C., Brown, P. M., Touchan, R., Anderson, R. S., et al. (2009). Multi-millennial Fire History of the Giant forest, Sequoia National Park, California, USA. Fire Ecol. 5 (3), 120–150. doi:10.4996/fireecology.0503120
Swetnam, T. W. (1993). Fire History and Climate Change in Giant Sequoia Groves. Science 262 (5135), 885–889. doi:10.1126/science.262.5135.885
Tingley, M. W., Ruiz-Gutiérrez, V., Wilkerson, R. L., Howell, C. A., and Siegel, R. B. (2016). Pyrodiversity Promotes Avian Diversity over the Decade Following forest Fire. Proc. R. Soc. B. 283 (1840), 20161703. doi:10.1098/rspb.2016.1703
USFS (2015). RAVG Data Bundle for the ROUGH Fire Occurring on the Sierra National Forest/Sequoia National Forest - 2015 (CA3687411890520150801). Editor U. S. F. Service. Available from: https://fsapps.nwcg.gov/ravg/background-products-applications.
van Mantgem, P. J., Caprio, A. C., Stephenson, N. L., and Das, A. J. (2016). Does Prescribed Fire Promote Resistance to Drought in Low Elevation Forests of the Sierra Nevada, California, USA? Fire Ecol. 12 (1), 13–25. doi:10.4996/fireecology.1201013
van Mantgem, P. J., Caprio, A. C., Stephenson, N. L., and Das, A. J. (2021). Forest Resistance to Extended Drought Enhanced by Prescribed Fire in Low Elevation Forests of the Sierra Nevada. Forests 12 (9), 1248. doi:10.3390/f12091248
Westerling, A. L. (2016). Increasing Western US forest Wildfire Activity: Sensitivity to Changes in the Timing of spring. Phil. Trans. R. Soc. B 371 (1696), 20150178. doi:10.1098/rstb.2015.0178
Wood, C. M., Popescu, V. D., Klinck, H., Keane, J. J., Gutiérrez, R. J., Sawyer, S. C., et al. (2019). Detecting Small Changes in Populations at Landscape Scales: a Bioacoustic Site-Occupancy Framework. Ecol. Indicators 98 (November 2018), 492–507. doi:10.1016/j.ecolind.2018.11.018
Keywords: megafire, ecological disturbance, passive acoustic monitoring, acoustic complexity index, biodiversity assessment, Rough Fire
Citation: Meyer E, Fristrup K, Caprio AC, Seale LD, Linares C and McKenna MF (2022) Exploring Ecoacoustic Trajectories in a Giant Sequoia Forest After Wildfire. Front. Remote Sens. 3:837866. doi: 10.3389/frsen.2022.837866
Received: 17 December 2021; Accepted: 14 March 2022;
Published: 25 April 2022.
Edited by:
DelWayne Roger Bohnenstiehl, North Carolina State University, United StatesReviewed by:
Kayla Stan, University of Alberta, CanadaAmandine Gasc, Institut de Recherche Pour le Développement (IRD), France
Copyright © 2022 Meyer, Fristrup, Caprio, Seale, Linares and McKenna. This is an open-access article distributed under the terms of the Creative Commons Attribution License (CC BY). The use, distribution or reproduction in other forums is permitted, provided the original author(s) and the copyright owner(s) are credited and that the original publication in this journal is cited, in accordance with accepted academic practice. No use, distribution or reproduction is permitted which does not comply with these terms.
*Correspondence: Erik Meyer, ZXJpa19tZXllckBucHMuZ292
†Present Address: L. Don Seale, Ouachita National Forest, Hot Springs, AR, United States