 Inken Schulze
 Mayya Gogina
 Mischa Schönke
 Michael L. Zettler
 Peter Feldens
 - Leibniz Institute for Baltic Sea Research Warnemünde, Rostock, Germany
This study investigated the seasonality of acoustic backscatter intensities, exploring three habitats in the southwestern Baltic Sea: 1) a mussel-covered reef, 2) coarse sand and gravel, and 3) seagrass meadows. Backscatter information of different, partly calibrated frequencies (200, 400, 550, and 700 kHz) was collected in three seasons (May, August, and October). The acoustic data were supported by point samples and video profiles for grain size and benthic community analysis. Angular response curves helped to quantify the seasonal backscatter response of the different frequencies. The multifrequency and multiseasonal backscatter maps distinguish the three habitats and reveal variable seasonal differences in acoustic backscatter, but not all changes in the benthic community can be recognized in the acoustic data. 1) The high-backscatter response of the mussel-covered reef shows little seasonal differences and was frequency independent. 2) The ecologically valuable coarse sand and gravel areas show small-scale seasonal alterations in the sediment composition and morphology, mainly caused by changes in local hydrodynamics. Higher frequencies were found best suited to identify coarse sand and gravel. 3) Seagrass meadows seasonality is dominated by growth of seagrass blades, increasing the backscatter response compared to bare sand. The use of multiple frequencies is beneficial as the low frequency is sensitive to changes in the shallow subsurface and benthic features such as seagrass rhizomes, while the higher frequency highlights changes related to coarser sediment.
1 Introduction
Habitat mapping is of growing importance to assess the environmental state of the sea and for subsequent monitoring to identify changes. In shallow waters, acoustic surveys can complement remote sensing based on satellites and airplanes. In turbid waters as well as intermediate and deeper water depths where optical methods such as satellite imaging and LiDAR cannot be used (Song et al., 2015), acoustic remote sensing is the method of choice. Targets for acoustic remote sensing include the geological conditions, but also the biodiversity, particularly benthic life (Rattray et al., 2009). Abiotic and biotic properties of the seafloor are affected by seasonal changes, for example, temperature, oxygen, salinity, daylight, and wind stress or currents. However, the research data about seasonal changes in acoustic backscatter are limited, especially regarding the influence of benthic habitats on acoustic signals. In general, understanding of seasonal variability in benthic habitats and inhabitation of macrofaunal communities is still limited.
In acoustic remote sensing, backscatter data recorded with a multibeam echosounder (MBES) or side-scan sonar (SSS) are widely used to derive sedimentological parameters (e.g. grain size), and localize hard substrates (Dartnell and Gardner, 2004; Tauber, 2012; Papenmeier et al., 2020), which are often required as basic input for benthic habitat maps or habitat modeling (Darr et al., 2014; Schiele et al., 2015). In recent years, studies have indicated a great potential especially of multifrequency acoustics for an improved seafloor classification and interpretation (Clarke, 2015; Feldens et al., 2018; Gaida et al., 2018; Janowski et al., 2018; Brown et al., 2019; Costa, 2019). The focus is hereby not only on the high frequencies allowing for a high resolution, but on the investigation of the optimal frequency combination for the distinction of specific habitats. The inclusion of lower frequencies seems to provide more contrast, especially within soft sediment habitats (Costa, 2019). The signal penetrates deeper into the sediment in case of higher frequencies, generating additional volume scattering that may be used to differentiate habitats. Even though the exact scattering depth remains unknown, more comprehensive information about the upper centimeters of the seafloor can be gained (Feldens et al., 2018), that is of interest for investigations of sediment layering, bioturbation traces, or roots/rhizomes. A limited, but increasing number of studies investigate the direct impact of benthic communities on backscatter properties of commonly used acoustic devices, thereby opening the possibility of efficiently surveying basic biological parameters of macrobenthic communities. Recent investigations show a potential for acoustic mapping of, for example, tube worms (Heinrich et al., 2017), squid egg clusters (Foote et al., 2006), mussel beds (Snellen et al., 2008), corals (Czechowska et al., 2020), or bristle worms (Feldens et al., 2018). In case of benthic flora studies, for example, seagrass meadows (Held and Schneider von Deimling, 2019) (an extended list of studies can be found in the review study by Gumusay et al. (2019)) or macroalgae (Kruss et al., 2017). Increasing sensitivity brings up the question to which extent seasonality of abiotic and biotic habitats is reflected in acoustic surveys. This is important for both the establishment of time series for monitoring purposes, as well as for interpreting the results of acoustic surveys undertaken in different seasons.
In this meso-scale field study, we tested if seasonal changes can be observed in the MBES backscatter strength of different frequencies (calibrated 200 and 400 kHz, uncalibrated 550 and 700 kHz) in shallow water habitats close to the coastline (for location see Figure 1). Three habitat types, which are common in the southern Baltic Sea, are the focus of our investigation: 1) a reef covered by mussel banks, 2) coarse sand and gravel (CSG), and 3) seagrass meadows on fine sand. The comparison of backscatter mosaics for 3 months (May, August, and October) highlights seasonal changes. The compilation of multifrequency backscatter to a false-color image allows for a rapid spatial overview, while angular response curves show more detailed information on the acoustic response of the habitats to different frequencies. Biological and sedimentological ground-truthing with grab samples support and validate the acoustic measurements.
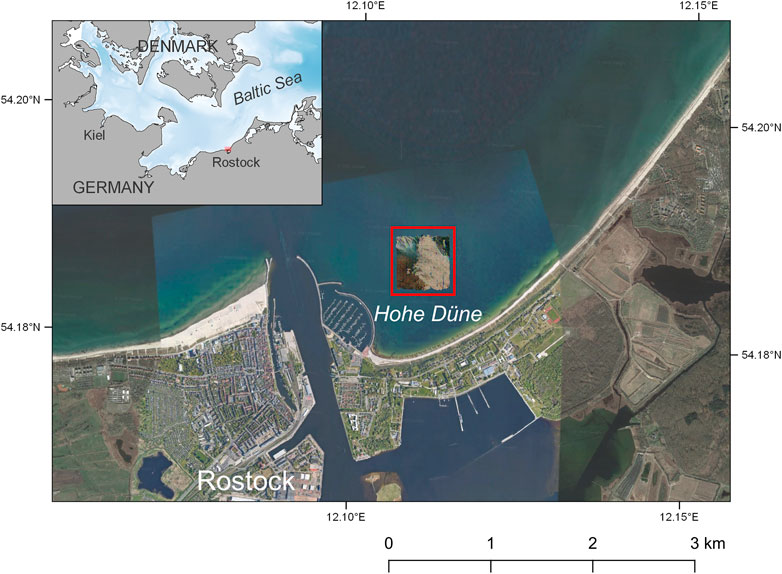
FIGURE 1. Location of the Hohe Düne research area close to the coast of Rostock in the southwestern Baltic Sea. Map projection is UTM33N WGS84. Background image: Google Maps 2022.
2 Materials and methods
2.1 Study site
The investigation site is located near Hohe Düne/Rostock (HD) in the southern Baltic Sea in water depths of 5–7 m and less than 1,200 m distance to the coast (Figure 1). The site was chosen based on accessibility, and the presence of different habitats according to the HELCOM Underwater biotope and habitat classification system (Schiele et al., 2015). Three different biotopes were predicted for the study site: photic sand dominated by multiple infaunal bivalve species including C. glaucum/M. balthica/M. arenaria (AA.J3L9), photic mixed substrate dominated by algae (AA.M1C/S), and photic mixed substrate dominated by the epibenthic community (AA.M*1). Nearby, photic sand dominated by multiple infaunal polychaete species including Ophelia spp. and Travisia forbesii (AA.J3L11) is found. The area is under anthropogenic influence including frequent waves formed by large ferries, commercial fishing with gill nets, proximity of a marina, and high coastal tourism activities. Additionally, there is a freshwater discharge from the Warnow River, after its flow through the city of Rostock.
2.2 Field work
Acoustic data in the Hohe Düne focus area were recorded using a Norbit STX echosounder mounted on the research vessel of the Leibniz Institute for Baltic Research Warnemünde (IOW), Klaashahn, a 7 m long aluminum catamaran. Surveys were conducted in May 2019, August 2019 and October 2019, to cover three different seasons. Weather conditions in May 2019 allowed only for a limited dataset. The Norbit iWBMS STX multibeam echosounder (MBES) is equipped with an Applanix Wavemaster sensor for motion compensation. The received EGNOS correction data improved the navigation to better than 1 m accuracy both in latitude and longitude. In August and October, real-time kinematic positioning (RTK) corrections were used to improve the navigation to cm accuracy. To ensure calibration, data were recorded using an equiangular spacing of 512 beams without roll compensation, following the manufacturer’s recommendations for the use of calibrated systems. The pulse length was set to 0.2 ms. Although system settings are removed by the calibration process, all user-controllable gain settings were kept stable throughout the survey, only the frequency was changed. The ship speed varied around 3.5 knots. Line direction was enforced by weather conditions and wave direction. Sampling of sediment and biological material was performed using a grab sampler with an area of 0.04 m2. Additional measurements included the water temperature, the salinity, and the level of oxygen. Underwater video data were recorded along parallel profiles at the slowest possible speed with a forward and oblique-looking HD video camera (Seaviewer Sea Drop 6000 HD). The surveys for optical and physical ground-truthing were conducted in April 2019, August 2019 and November 2019. The time delays to the acoustic surveys were caused by bad weather conditions. The grain size analysis was performed by sieving for sediments with components larger than 2 mm, while the optical grain size analysis was performed for samples composed of fine sand.
2.3 Acoustic data processing
2.3.1 Backscatter data
Data were re-exported utilizing Norbit software to incorporate true heave correction and correct the data against manufacturer-supplied system bias. The results of the export are s7k-files, with an uncalibrated snippet and manufacturer-calibrated backscatter time series data available for the 200 and 400 kHz frequency. The determination of system bias of the MBES was performed by the manufacturer for the frequencies of 200 and 400 kHz by calibration with spheres in a test tank, and is applied through a device-specific calibration file. Bathymetric grids were created utilizing the software QPS Qimera with a resolution of 0.25 m. In the software QPS FMGT, backscatter mosaics with a resolution of 0.25 m were created. An angle varying gain (AVG) in the “flat” mode with a window size of 300 pings was applied with the normalization band set to adaptive using the default angles of 30°–60° from nadir. The mosaicing style was set to “blend.” Some data gaps were caused by bad weather conditions, which made navigation along straight lines difficult with the available vessel. The data obtained in August did not allow the creation of an adequate bathymetric map due to wave impact.
2.3.2 False-color images
For visualization purposes, the backscatter mosaics are combined with false-color images. For better comparison, the backscatter range for each frequency is the same for all maps in this study (Table 1). The different frequencies are assigned to two or three of the color channels (red, green, and blue, RGB), creating dual-frequency or multifrequency backscatter maps. As only two frequencies (200 and 400 kHz) are calibrated and available for all 3 months, the dual-frequency maps are preferably shown and discussed. False-color images are also used to visualize the seasonality of the investigation site. In this case, each color channel (RGB) is assigned to the backscatter intensity of 1 month.
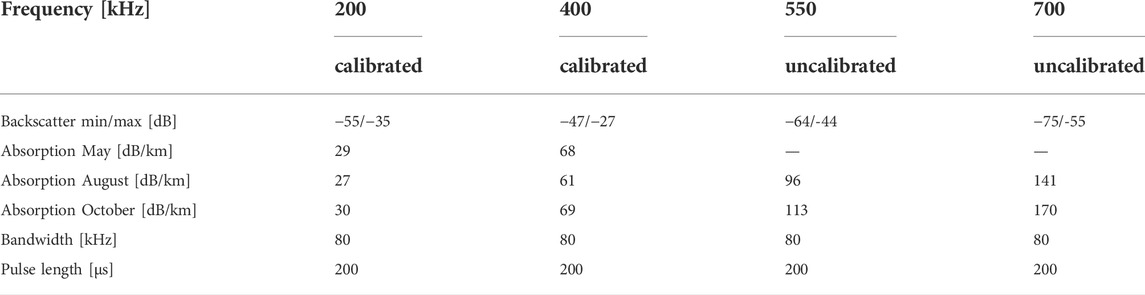
TABLE 1. Minimum and maximum backscatter intensities used in the Hohe Düne investigation area mosaics, and the absorption values used for the different months.
2.3.3 Angular response curves
The calibration allows the direct display of angular response curves (ARC) to support the interpretation of the backscatter maps and the identification of habitats. The angular backscatter strength (Hellequin et al., 2003) is defined as:
where BS is the angular backscatter strength, θ is the incidence angle, EL is the recorded echo level, SL is the source level, TL is the transmission loss (spreading + absorption), and A is the ensonified area. Due to the manufacturer calibration, only values for spreading (set to 40) and absorption (Table 1) were set during data export in the Norbit GUI. To display the ARC, data were exported to the s7k format and the snippet information was exported using the mbsystem (Caress and Chayes, 1996; Caress and Chayes, 2017). The incidence angle was then calculated from the height above the seafloor and across-track distance, assuming a flat seafloor. This assumption is valid for our investigation site, as the observed slope values are minor. To reduce noise, the data of 100 pings were averaged, and then binned into 2°-intervals, displayed from 0° to 70°.
2.4 Biological data processing
The samples were washed through sieves with 1 mm mesh-size and preserved in 4% buffered formaldehyde–seawater solution. All macrobenthic organisms were sorted, identified to the lowest possible taxonomic level, counted and weighted to obtain wet weight biomass (WW). Ash-free dry weight biomass (AFDW) was also derived from wet weight using conversion factors (Gogina et al., 2022). Taxonomy was checked to follow the World Register of Marine Species WoRMS.
The Kruskal–Wallis test was used to identify significant differences in terms of main biological parameters. Community composition was analyzed using multivariate technique hierarchical cluster analysis and analysis of similarity (ANOSIM) in the program PRIMER v7 (Clarke and Gorley, 2015). Biological resemblance among samples was quantified using pairwise Bray–Curtis similarities on log-transformed WW biomass data (as it was expected to be more relevant for the acoustic response than AFDW). Indicator value analysis (IndVal (Dufrêne and Legendre, 1997)) implemented in R package “labdsv” (Roberts, 2013) was used on the biomass data matrix to identify the main taxa which were responsible for differences in the community structure. IndVal is a product of specificity (mean biomass of a given taxon within a cluster compared with the other clusters) and fidelity (taxon occurrence at stations belonging to a cluster), with values reaching 100% when a given taxon is observed at all stations of only one cluster.
3 Results
3.1 Overview
The bathymetric and backscatter maps of the Hohe Düne (HD) investigation site are displayed in Figure 2. The water depths vary between 4.8 and 7.4 m. The area was separated into the broad habitats of coarse sand and gravel (CSG), reef covered with mussels, and seagrass meadows. Their typical appearance in the underwater video footage is shown in Figure 3. The three habitats are recognized by their different appearances in a multifrequency backscatter mosaic (Figure 2B). The general morphological differences within the HD site are minor. The reef forms a local bathymetric height elevated approximately 60 cm above the surrounding seagrass meadows and the CSG habitats. Small-scale morphological changes within the patchy seagrass meadows cannot be determined due to the interference of the plants with the acoustic signal. Within the CSG area, elongated dunes protrude a few tens of centimeters above their surroundings (Figure 2A). The clay and silt, sand and gravel distribution for the three facies are shown in Table 2. The same stations were sampled in different seasons. Larger boulders are present in the video footage, but could not be retrieved with the utilized grab equipment.
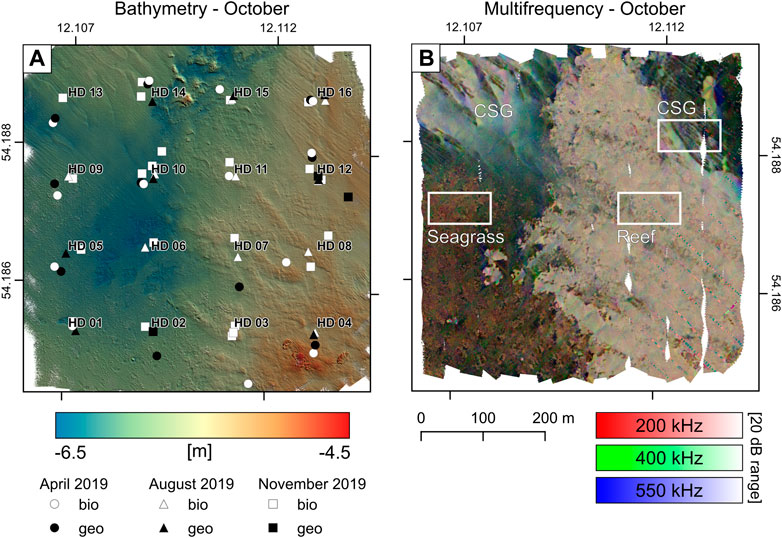
FIGURE 2. (A) Hillshaded (sun azimuth of 35°, sun elevation of 20°) bathymetry of the working area recorded in October 2019 at 400 kHz frequency. The position of grab samples for biological and sedimentological (Table 2) analysis is indicated around the planned stations (HD01 to HD16). (B) Multifrequency backscatter map (200, 400, and 550 kHz) recorded in October 2019. The three identified facies and the positions of detailed views in Figure 4 (reef), Figure 7 (CSG), and Figure 8 (seagrass) are indicated. The combination of the backscatter maps of different frequencies using the three channels of a false-color image allows for an easy, visible distinction of the present habitats.
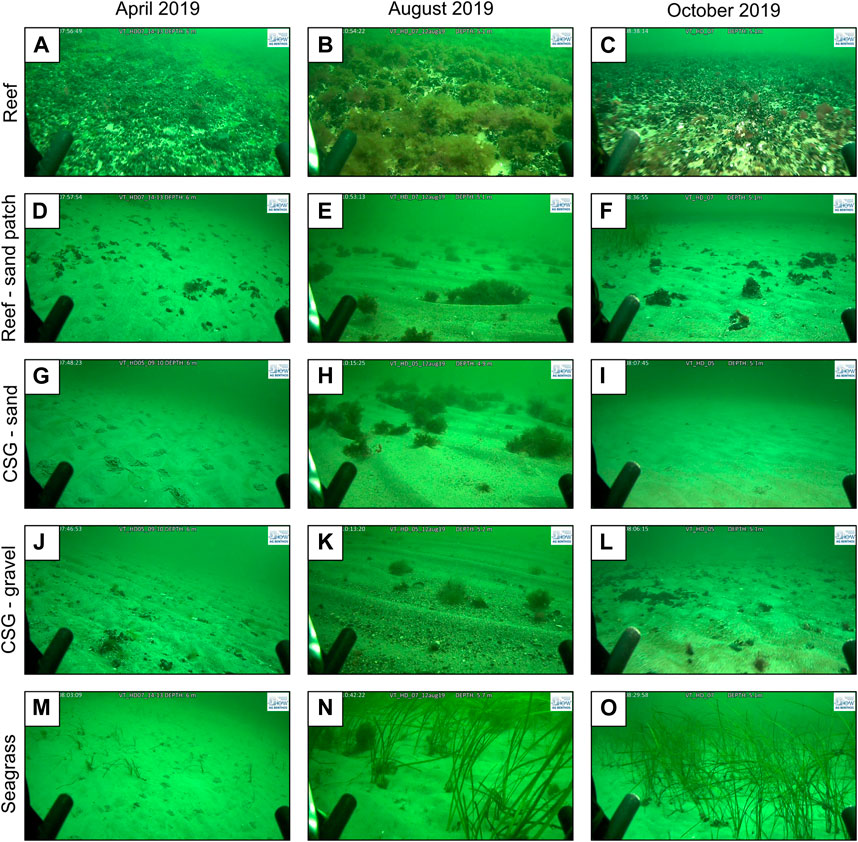
FIGURE 3. Video stills of the three facies from different months. (A–F) Reef facies is characterized by the stones and boulders, covered by Mytilus edulis. In August, red algae grow as a dense layer on top. Sand patches enclosed by the reef occur in NW-SE orientation. The maximum distance between the three photo positions is 1.5 and 5.5 m for the reef itself and sand patches, respectively, and the locations are shown in Figure 4A. (G-L) CSG facies is characterized by a local change of sandy (G–I) and gravelly (J–L) composition. In April, the seafloor is covered by undulating ripples, complemented by worm casts in the sandy parts and loose shells in the gravelly parts. In August, the seafloor surface forms distinct, oriented ripples with loose algae accumulations. In October, the seafloor again shows isolated ripples less pronounced compared to April. In the gravelly areas, shell clusters appear. The maximum distance between the three photo positions is 9.5 and 7.5 m for the sand and gravel CSG areas, respectively, and the locations are shown in Figure 7A. (M–O) Seagrass facies is characterized by the growth of seagrass patches in the sandy environment. While there are only few blades in April, the density of seagrass canopies observed in August is still present in October. The maximum distance between the three photo positions is 3.5 m and the locations are shown in Figure 8A.
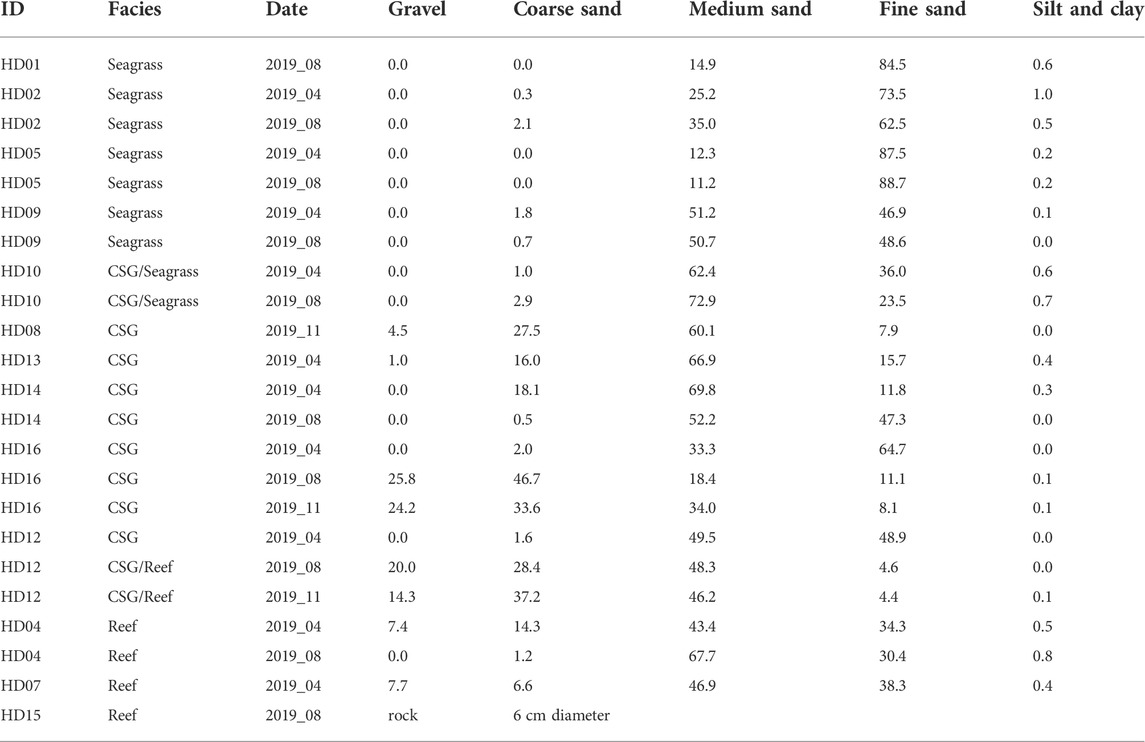
TABLE 2. Percentages of gravel, coarse sand, medium sand, fine sand and silt, and clay in sediments of different facies. The same stations were sampled in different seasons. Position of the geological samples is indicated in Figure 2A.
The analysis of benthic communities, from 53 samples collected during the three sampling campaigns, resulted in 643 observations of 64 taxa, including 23 taxa of arthropods (crabs, shrimps, and barnacles), 20 taxa of annelids (polychaetes and oligochaetes), 14 species of molluscs (clams, sea slugs, and snails), 4 species of bryozoans, 1 species of platyhelminths (flat worms), 1 species of echinoderms (sea star), and 1 taxa of nemerteans (ribbon worms) (details in Supplementary Table S1). In all three seasons, higher values of wet biomass were found in the central and south-eastern parts of the study site, corresponding to the reef habitat (details on biomass in the investigation site are given in Supplementary Figure S1). Wet biomass values in the CSG habitat were consistently the lowest, particularly for the two stations in the northwest and northeast corners of the study area (HD13 and HD16). However, both, high seasonal fluctuation and variability between replicates were observed in all habitats, presumably also related to small-scale patchiness in the investigation site and relatively small sampling area of the grab (0.04 m2).
3.2 Reef
3.2.1 Acoustics and geology
The reef facies is characterized by generally high-backscatter intensities (Table 3). On the reef, stripes and patches of intermediate-backscatter intensity oriented in the NW-SE direction appear irregularly (Figures 4C–H). They are recognized in bathymetric data as shallow depressions (Figures 4A,B) and ground-truthing shows exposed sand patches. In the October multifrequency backscatter map with the additional frequency of 550 kHz (Figure 2B), the exposed sand patches appear in dark blue colors, indicating a preferred high-frequency response. Outside of the sand patches, changes in the dominant frequency are controlled by background noise with little frequency sensitivity, resulting in an overall bright yellowish color in the dual-frequency (Figures 4I–K) and bright greyish colors in the three-frequency mosaic (Figure 2B). Boundaries of the reef facies to the CSG and seagrass facies are generally distinct (Figure 2B).

TABLE 3. Average backscatter (standard deviation) [dB].
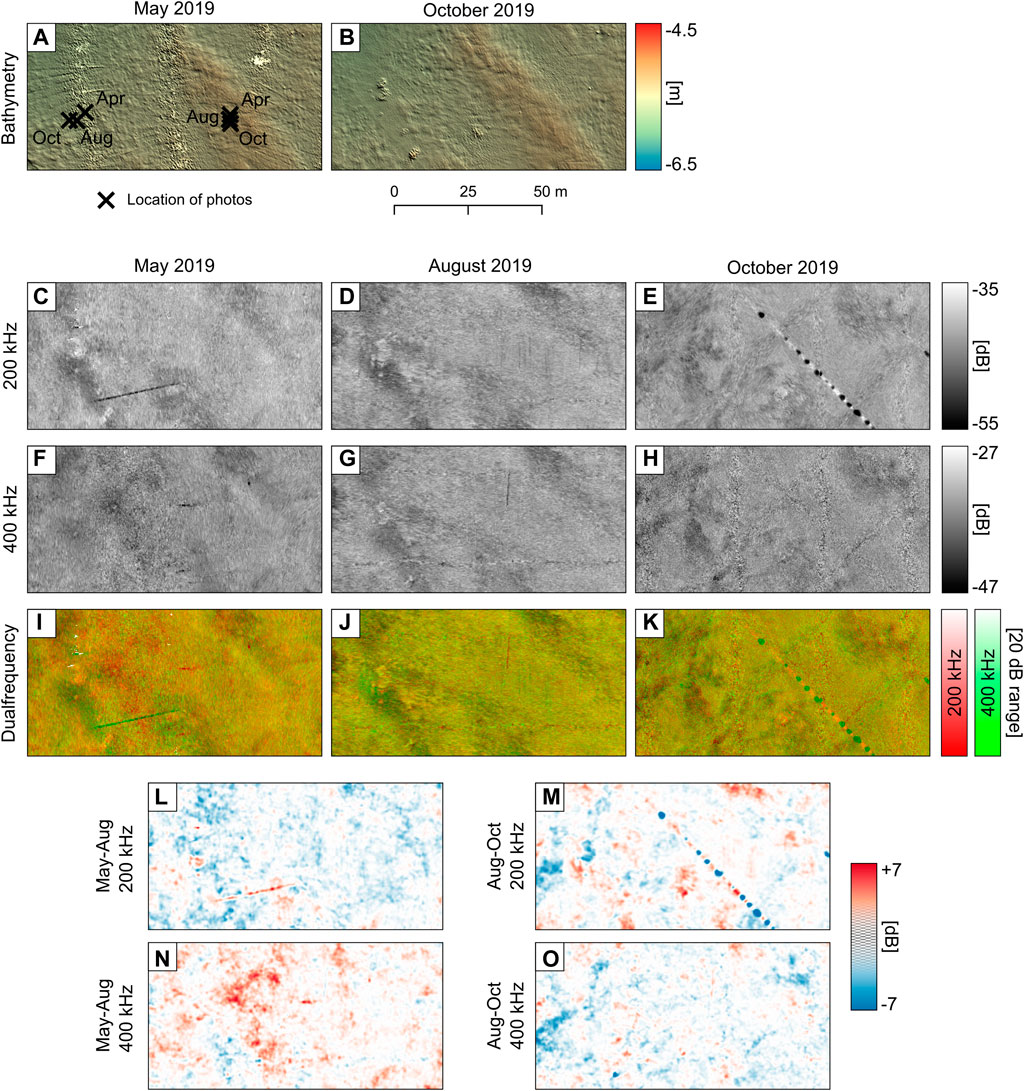
FIGURE 4. Detailed view of acoustic maps of the reef facies (for location see Figure 2B). (A,B) Bathymetry in May (200 and 400 kHz combined) and October (400 kHz). The resolution is 0.25 m and a hillshade is added with sun azimuth of 35° and sun elevation of 20°. (C–E) Backscatter mosaic at 200 kHz frequency for May, August, and October 2019. (F–H) Backscatter mosaic at 400 kHz frequency for May, August, and October 2019. (I–K) Dual-frequency backscatter mosaic for May, August, and October 2019. The 200 kHz frequency is assigned to the red color channel and 400 kHz assigned to the green color channel. (L–M) Difference plots of the 200 kHz backscatter mosaics with a 5 cell lowpass filter showing the change between May to August (L) and August to October (m). (N,O) Difference plots of the 400 kHz backscatter mosaics with a 5 cell lowpass filter showing the change between May to August (N) and August to October (O).
The sediment samples retrieved in the reef facies have an overall composition of fine to medium sand (Table 2). Stones and large boulder accumulations are observed in the underwater video footage, but appear rarely in the exposed sand patches (Figures 3D–F).
3.2.2 Biology
The majority of the reef facies is covered by variable densities of the mussel Mytilus edulis (Figures 3A–C). M. edulis contributes to biomass with 80–99%. Decreasing densities of M. edulis correspond to the occurrence of patches of exposed coarse sand. Camera profiles show that at the transition from the high-backscatter reef to the low-backscatter sand patches mussels are replaced by rippled sand (Figures 3D–F). Excluding blue mussels, however, the remaining biomass is lower than within the seagrass habitat and is dominated by crustaceans, isopods, and gastropods. Species that discriminate this habitat are Amphibalanus improvisus, Microdeutopus gryllotalpa, Gammarus spp, Littorina saxatilis, Littorina littorea, Pusillina inconspicua, Polydora cornuta, and Alitta succinea (detailed countings in Supplementary Table S1). Asterias rubens was mostly observed in video records from this zone. The vegetation was mostly represented by foliose and encrusting red algae of phylum Rhodophyta, such as Polysiphonia fucoides. Less common were the observations of relatively small specimens of Delesseria sanguinea.
3.2.3 Seasonal change—Geology
For the complete reef facies, a reduction in backscatter intensity is observed at the 200 kHz frequency from May to August, while average values remain constant from August to October (Table 3). The backscatter strength decreased by 200 kHz from May to October, although isolated spots of the increasing backscatter strength occurred (Figures 5A,C,E). These spots formed between August and October (Figures 4L,M). As a consequence, in the multiseasonal backscatter map, the reef facies is represented by reddish colors (Figure 6A). The exposed sand patches (low-backscatter stripes) show the strongest backscatter response in October, represented by dark bluish colors.
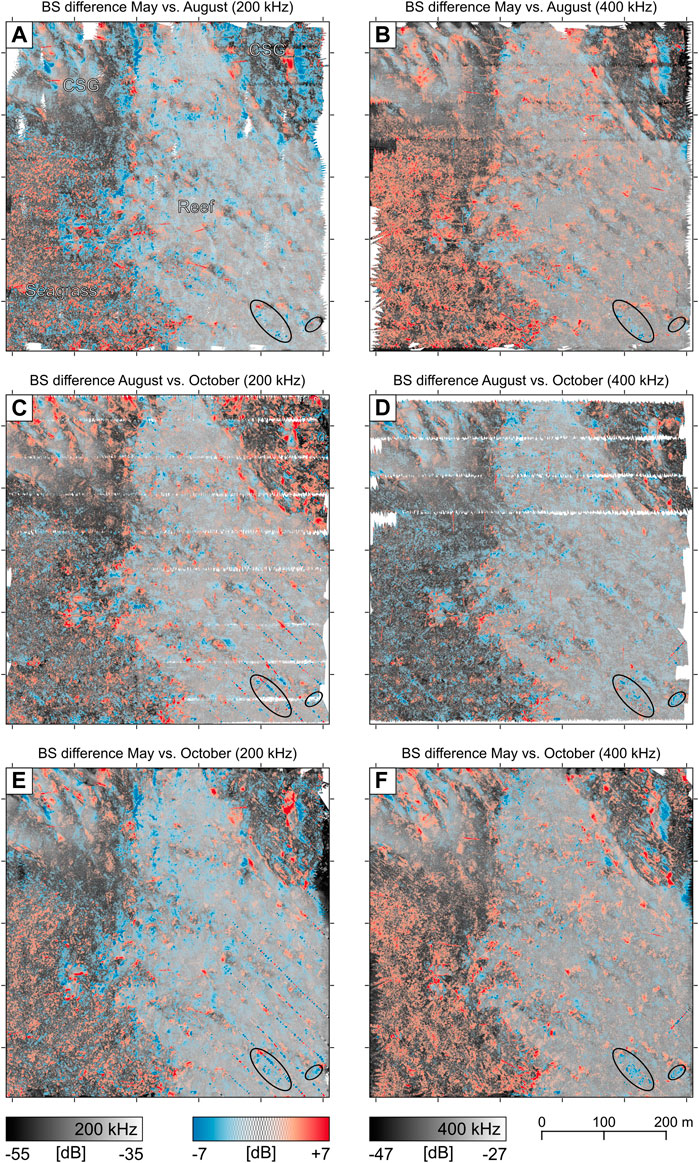
FIGURE 5. Difference plots of acoustic backscatter between May, August, and October, with a 5 cell lowpass filter. Red color corresponds to an increase in the backscatter strength; blue color corresponds to a decrease in the backscatter strength. The center of the color map is transparent to highlight only relevant differences. The backscatter map in the background was recorded in May (A,B), August (C,D), and October (E,F). The circles mark seagrass patches enclosed by the reef and show a reversed seasonal backscatter difference.
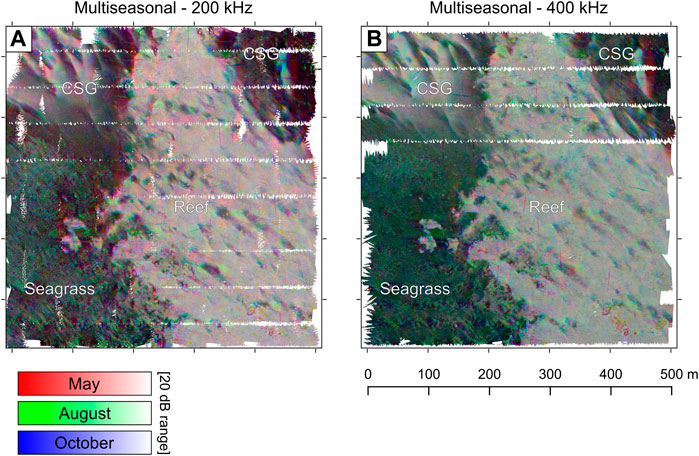
FIGURE 6. Multiseasonal backscatter maps, where the RGB channels of the false-color images are assigned to the backscatter maps of the month May, August, and October, respectively. (A) 200 kHz frequency. The CSG facies is characterized by the change of dark colors, indicating generally low-backscatter values, and brighter stripes, which vary in color, assumed to be caused by hydrodynamically induced shifts in sediment composition. In addition to the low-backscatter stripes, the reef facies appears in a bright reddish color, indicating generally high-backscatter values with a maximum in May. The seagrass facies is dominated by the cloudy seagrass patches in green–turquoise colors based on high-backscatter values in August and October. (B) 400 kHz frequency. The reef facies appears in a bright greyish color, representing only small differences between the months compared to 200 kHz.
For the 400 kHz frequency, a slight overall increase in backscatter strengths is observed from May to August, while a slight decrease prevails during the second time period from August to October (Figures 4N,O). For the total observation period from May to October, mainly an increase in the backscatter strength at isolated spots is observed (Figures 5B,D,F). In the multiseasonal map (Figure 6B), the higher response in August is indicated by a greenish color, and some blue patches point out spots of maximum backscatter intensity observed in October.
An interesting detail is observed in the southeast of the reef facies (marked with circles in Figure 5). Dense seagrass patches embedded in the reef in an area covered by Mytilus edulis show a strong decrease in backscatter from May to October for both frequencies, the 200 and 400 kHz. This is in contrast to backscatter seasonality in the seagrass facies as described later.
3.2.4 Seasonal change—Biology
Though both total biomass and biomass of blue mussels were slightly higher in autumn, according to the Kruskal–Wallis test these, changes were not significant. Surprisingly, Amphibalanus improvisus nearly disappeared in summer, but showed a significant increase in biomass in autumn compared to spring values (Supplementary Table S1, Supplementary Figure S3). A. improvisus is commonly attached to various bivalve shells (dead or alive), including blue mussels, and is known to tolerate strong water flow, large range of salinity, and high levels of pollution. Thus, such an abrupt drop in biomass can possibly be explained by predation. Apart from benthofagous fish, Asterias rubens and the crab Carcinus maenas both prey upon blue mussels and associated epibionts (Laudien and Wahl, 1999). A prominent change in video data is the occurrence of the pseudo-seasonal red algae Polysiphonia fucoides during summer (Figure 3B). This is a relatively small pseudo-seasonal seaweed that can sometimes be seen as an indicator of high nutrient availability and fast growth rates. Annual fronds of many red seaweeds typically regenerate in spring and die back in the autumn, causing a seasonal change in the seaweed cover that is most dense from April to September (Maggs and Hommersand, 1993).
3.3 Coarse sand and gravel (CSG)
3.3.1 Acoustics and geology
The CSG facies is located in the northeast and northwest of the investigation site. The transition of CSG to the seagrass facies is continuous, with a gradual increase in the response to higher frequencies in the multifrequency backscatter mosaics (Figure 2B). The transition from the CSG to the reef facies is generally sharp. Within the CSG facies, a high percentage of gravel and coarse sand was observed at sample locations HD12 (in August) and HD16 (in November), where backscatter intensities are elevated for all months and frequencies. The remaining sample locations showed low to intermediate backscatter intensities and fine to medium sand, with HD14 and HD13 showing increased medium sand contents, and sample HD16 (in April) dominated by fine sand (Table 2). The alteration of the sediment regimes can be observed in the seasonal video footage (Figures 3D–I). The monofrequency images show little difference in areas composed of fine to medium sand, though contrast in the 200 kHz frequency increased, which is reflected in the dual-frequency mosaic (compare Figures 7D,G,J). Seafloor composed of coarse sand gravel shows relatively stronger backscatter intensities at higher frequencies, which results in greenish colors in the dual-frequency mosaic (Figures 7F,I) and bluish colors in the multifrequency mosaic with 550 kHz (Figure 2B). Areas with a stronger response to high-frequency scatter are widespread in the northwest of the study site, and less common in the northeast.
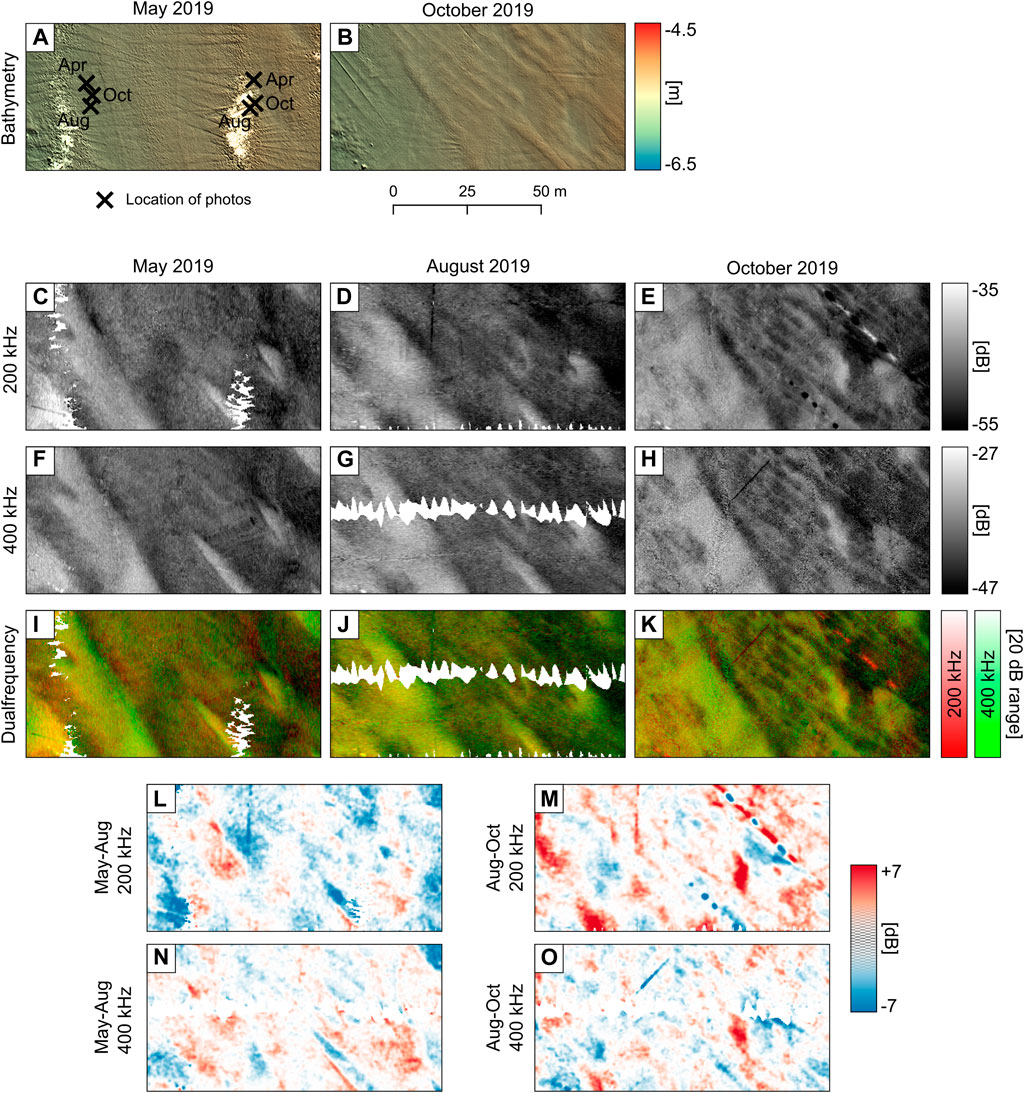
FIGURE 7. Detailed view of acoustic maps of the CSG facies (for location see Figure 2B). (A,B) Bathymetry in May (200 and 400 kHz combined) and October (400 kHz). The resolution is 0.25 m and a hillshade is added with sun azimuth of 35° and sun elevation of 20°. (C–E) Backscatter mosaic at 200 kHz frequency for May, August, and October 2019. (F–H) Backscatter mosaic at 400 kHz frequency for May, August and October 2019. (I–K) Dual-frequency backscatter mosaic for May, August, and October 2019. The 200 kHz frequency is assigned to the red color channel and 400 kHz assigned to the green color channel. (L,M) Difference plots of the 200 kHz backscatter mosaics with a 5 cell lowpass filter show the changes between May to August (L) and August to October (m). (N, O) Difference plots of the 400 kHz backscatter mosaics with a 5 cell lowpass filter show the changes between May to August (N) and August to October (O).
3.3.2 Biology
Community displays the lowest total biomass, total abundance, and species richness (Supplementary Figure S1). The similarity in the community structure of the two stations considered to be concisely located within the CSG habitat (HD13 and HD16) is relatively low (Supplementary Figure S2). The biomass at station HD13 in April and August was dominated by blue mussels (M. edulis), but the species was completely absent in the October sample. However, large mussel patches on coarse sand were observed in some video data from October. The second species in terms of biomass dominance was P. ulvae. Characteristic taxa revealed for this habitat by indicator value analysis based on biomass were polychaetes Capitella capitata, Hediste diversicolor, and Paraonis fulgens. Overall abundance was dominated by P. ulvae with a minimum of 100 ind/m2 in spring and a maximum of 7,325 ind/m2 in autumn (when the contribution of taxa exceeded 95% of relative abundance at both stations). Traces of Arenicola marina were also observed with underwater imaging in this zone, though density was lower compared to the seagrass habitat, and the shape of coiled castings was less pronounced due to sediment properties.
3.3.3 Seasonal change—Geology
The bathymetry of the CSG facies indicates a seasonal change. In May, the seafloor is characterized by a smooth seafloor morphology with few large-scale features, while in October NW-SE elongated sediment ripples shape the seafloor in the northeast (Figures 7A,B). In the backscatter maps, corresponding small-scale stripes of increasing backscatter strength develop from May to October, elongated in the same NW-SE direction (Figures 7C–H). Generally, average backscatter intensities in the CSG facies remain constant throughout the seasons (Table 3), however, differences are observed on smaller scales.
Low to intermediate backscatter areas (fine to medium sand) show an intensity decrease, while high-backscatter areas (coarse sand and gravel) show an intensity increase in the period from May to August (Figures 5A,B and more detailed Figures 7L,N). Toward autumn, the backscatter increases for areas of fine to medium sand from August to October, but decreases for areas composed of coarse sand and gravel (Figures 5C,D and more detailed Figures 7M,O). Seasonal changes at the 200 kHz frequency are more pronounced for the fine sand to gravel areas, while the changes in the 400 kHz frequency focus on coarse sand and gravel seafloor. The result is a reversed pattern in the difference plots for the change from May to August and August to October (Figures 5A–D). The difference between the frequencies is lower when considering the extended time period from May to October, and patterns appear similar in the difference plots (Figures 5E,F).
The multiseasonal backscatter maps represent small-scale seasonal variations within the coarse sand and gravel seafloor by compositions of bright colors (Figure 6). The fine to medium sand seafloor shows fewer seasonal variations, and consequently, dark colors dominate. Spots of green or blue color indicate small-scale backscatter variations in August and October. The high-backscatter stripes in the northeast developed in August and October appear to be more distinct in the 400 kHz frequency (green-bluish colors).
3.3.4 Seasonal change—Biology
The biomass of P. ulvae and C. glaucum increased from spring to autumn, though the pattern for the latter species was not consistent between stations. At both stations, the biomass of M. arenaria was high in summer, but the species was absent or contributed only little in other seasons.
3.4 Seagrass
3.4.1 Acoustics and geology
Sediment in the seagrass area is dominated by fine sand (Table 2). Seagrass itself affects both measurements of bathymetry and backscatter intensity. The bathymetry map shows a smooth seafloor surface in May, except for data artifacts (Figure 8A). In October, numerous patches with sharp edges and small diameters (<1.5 m) occur, protruding the sediment by up to 0.4 m (Figure 8B).
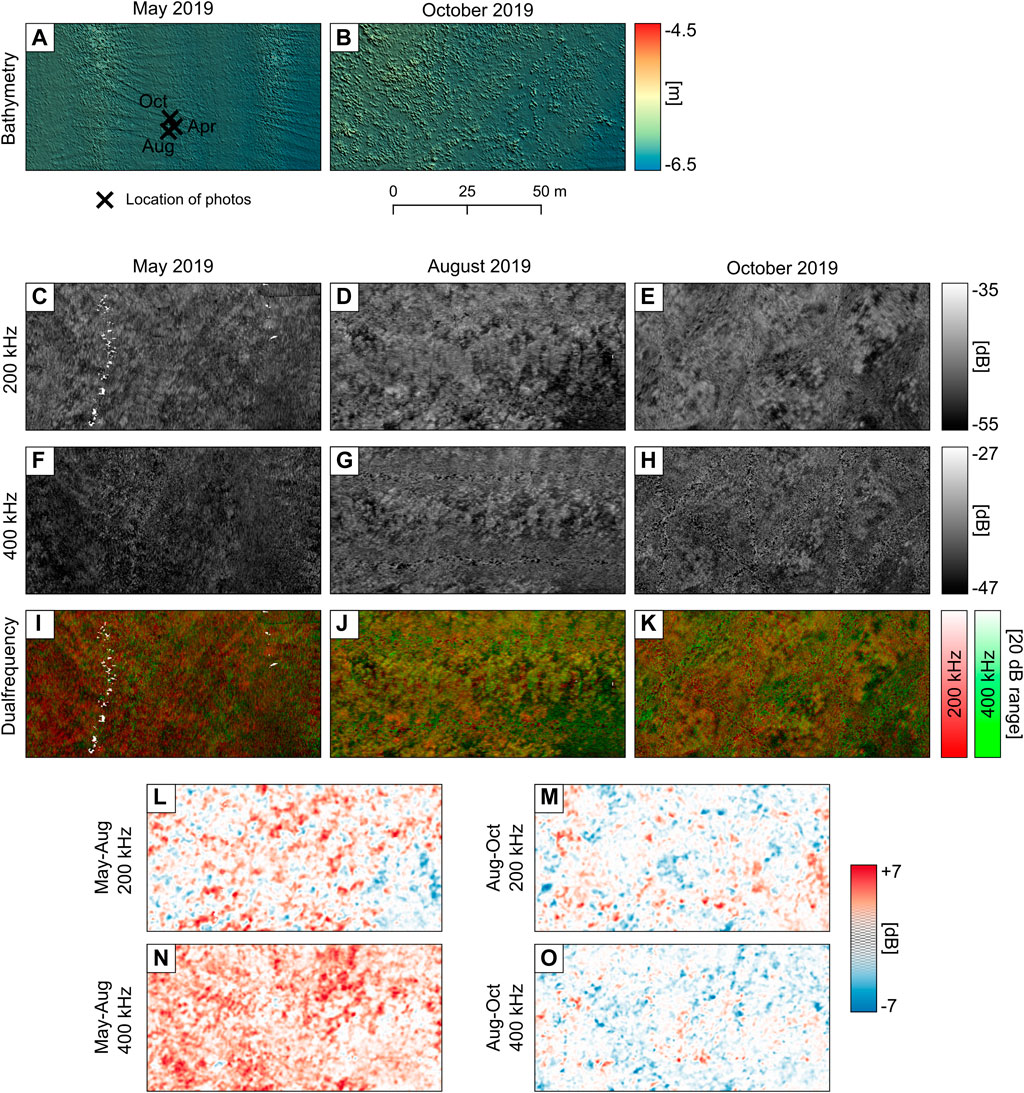
FIGURE 8. Detailed view of acoustic maps of the seagrass facies (for location see Figure 2B). (A, B) Bathymetry in May (200 and 400 kHz combined) and October (400 kHz). The resolution is 0.25 m and a hillshade is added with sun azimuth of 35° and sun elevation of 20°. In May, the seafloor appears smooth (in addition to artifacts), while in October many elevated seagrass patches are visible. (C–E) Backscatter mosaic at 200 kHz frequency for May, August, and October 2019. (F–H) Backscatter mosaic at 400 kHz frequency for May, August, and October 2019. (I–K) Dual-frequency backscatter mosaic for May, August, and October 2019. The 200 kHz frequency is assigned to the red color channel and 400 kHz assigned to the green color channel. (L,M) Difference plots of the 200 kHz backscatter mosaics with a 5 cell lowpass filter show the changes between May to August (L) and August to October (m). (N, O) Difference plots of the 400 kHz backscatter mosaics with a 5 cell lowpass filter show the changes between May to August (N) and August to October (O).
The seagrass facies is generally characterized by low to intermediate backscatter intensities for the uncovered sandy seafloor (as in May, Figures 8C,F) and higher backscatter intensities if seagrass patches are present (Table 3). In the multifrequency image from October with an additional frequency of 550 kHz (Figure 2B), the seagrass appears in patches of red to brownish colors, indicating a relative increase of 200 kHz scatter. In May, the combination of cloudy patches of an increased backscatter strength on a low-backscatter background at 200 kHz frequency (Figure 8C) and only a few patches of the medium backscatter strength on a low-backscatter background at 400 kHz frequency (Figure 8F) results in a dual-frequency backscatter map dominated by dark, reddish colors (Figure 8I). For August and October, both frequencies show patches of the increased backscatter strength (visible in Figures 8D,E,G,H). Contrast is increased in the 200 kHz frequency, causing several red spots in the dual-frequency mosaics (Figures 8J,K).
3.4.2 Biology
The seagrass habitat is shaped by common eelgrass Zostera marina species. Traces of presence and sediment reworking by the lugworm Arenicola marina, particularly its coiled castings, were commonly observed in video records between the seagrass canopies. Contributing most to the overall similarity between samples (stations HD01, HD02, HD05, and HD09) were biomass-dominating bivalves, namely, Mya arenaria, Cerastoderma glaucum, and Macoma balthica. Their average share of total biomass corresponded to 24, 23, and 19%, respectively.
3.4.3 Seasonal change—Geology
From May to October, increased backscatter strengths are observed for both frequencies, although for the 200 kHz frequency some patches of decrease occurred (Figures 5E,F). The increase in seagrass abundance from May to August (Figures 3M,O) coincides with an increase in backscatter intensities, especially for the 400 kHz frequency (Figures 5A,B; Table 3). During the period from August to October, both frequencies showed either constant or only slightly decreasing backscatter strengths, with only occasional patches of increase (Figures 5C,D and detailed Figures 8M,O). Higher backscatter strength in August and October resulted in the appearance of the seagrass facies as green–turquoise patches on dark background in the multiseasonal backscatter maps (Figure 6A).
3.4.4 Seasonal change—Biology
The biomass of Cerastoderma glaucum and Peringia ulvae increased from spring to autumn, whereas biomass of M. arenaria and M. balthica were highest in spring and significantly decreased thereafter. Presumably due to the impact of winter storms, eelgrass canopies were significantly reduced in April compared to higher cover in August and October (Figure 3). The total density of macrofauna in samples collected from seagrass meadows habitat indicated a significant increase from season to season (Supplementary Figure S1). Generally, ANOSIM results suggested that there were no significant differences between seasons in the infauna community structure expressed in biomass. For further details, refer to Supplementary Table S1.
3.5 Angular range analysis
The angular response curves show the behavior of the two calibrated frequencies (200 and 400 kHz) with regard to the specific habitat and season as a function of incidence angle (Figure 9). The decrease in backscatter intensity with increasing incidence angle is larger for the 200 kHz frequency compared to 400 kHz. The reef facies shows larger seasonal variability in the low frequency, where the backscatter strength decreases throughout the year. The higher frequency shows a slight increase in backscatter values for August, and only insignificant differences between May and October. The CSG facies is characterized by a high variability in backscatter values. The backscatter intensity range between the two frequencies is the smallest in May, because intensity at 200 kHz is increased and intensity at 400 kHz is decreased when compared to the values recorded in August and October. Backscatter values for August and October show only insignificant differences for both frequencies. The ARC for both, the reef facies and CSG facies, show undulations in all months, more pronounced at 200 kHz frequency. The seagrass facies shows overall lowest backscatter values and a surprisingly strong backscatter increase for beam angles above 40°, particularly at 400 kHz frequency. This effect is less pronounced in May.
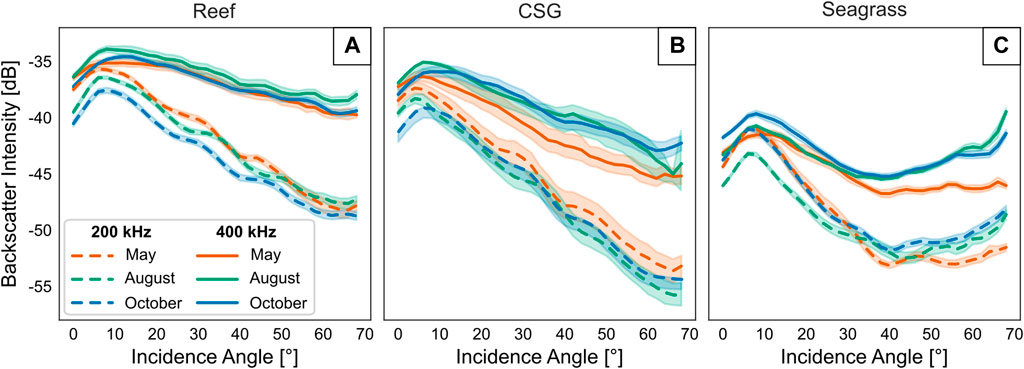
FIGURE 9. Angular range curves (ARCs) at 200 and 400 kHz frequency for the 3 months within the three facies: reef (A), CSG (B), and seagrass (C). Data are extracted from the respective facies details presented before (Figure 2B for locations). A 95%-confidence interval was added to the curves.
4 Discussion
4.1 Application of multifrequency data
The combination of remote sensing and in situ sampling is complementary. Due to different spatial scales available for interpretation (Turner et al., 2003), it allows for a more complete view of benthic habitats. Onshore, the use of remote sensing became increasingly sophisticated over the past decade, ranging from the application of optical spectral signatures for direct detection of species composition (tree types, forest types, and wetland vegetation types) to indirect approaches such as measuring chlorophyll and obtaining information on habitat structure (Turner et al., 2003; Schulte to Bühne and Pettorelli, 2018). Even onshore, specific species and habitats require specific approaches regarding the type and processing of remote sensing data (Yokoya et al., 2017; Wang and Gamon, 2019). Onshore-developed remote sensing techniques are expanded to the shallow coastal areas by investigating spectral reflectance of seagrass and marine algae (Thorhaug et al., 2007). For instance, Kuhwald et al. (2021) developed a method to map seagrass in the turbid waters of the Baltic Sea based on Sentinel-2 data. Such methods are naturally limited by the optical penetration depth, but can be extended to deeper waters by acoustic methods, and be used to identify benthic communities (Kloser et al., 2010). However, despite the usefulness of multifrequency data for acoustic remote sensing (Costa, 2019), the catalog of the multispectral acoustic reflectance of marine habitats is still very limited (Fakiris et al., 2019; Menandro et al., 2022), especially considering the effects of benthic life and seasonality. The backscatter difference plot (Figure 5) shows that improving the temporal resolution by including the month of August in the analysis results in an added value when investigating the habitats’ seasonal dynamics. Therefore, a catalog of acoustic reflectance requires the consideration of seasonality and ideally the use of calibrated systems or establishment of reference sites to allow comparisons between different survey areas and instruments (Roche et al., 2018; Weber et al., 2018). Multispectral approaches are also important because seasonal differences in the investigation sites may not be related to changes in average monofrequency backscatter intensity (which can be below the effects of line azimuth and short-term variability (Lurton et al., 2018; Montereale-Gavazzi et al., 2019), Table 3), but to changes in the response of different frequencies and angular response. Despite conducting intense ground-truthing, it was not possible to relate all the information in the multifrequency mosaics to actual conditions on the seafloor. However, the multifrequency backscatter approach discriminates not only between habitats, but also reveals small-scale changes within a single habitat. The individual habitats are discussed in the following sections.
4.2 Seagrass meadows
The clearest spectral signature in our investigation site is found within the seagrass facies. The detection of seagrass meadows is of interest to coastal and marine management. This ecologically important habitat acts as a nursery ground for fish, coastal protection, and carbon sink (Terrados and Borum, 2004; Cullen-Unsworth and Unsworth, 2013), but is also endangered by climate change (Duarte et al., 2018). Seagrass performs photosynthesis and accordingly oxygen bubbles exist in the tissues and lacunae. As gas is a strong acoustic reflector, seagrass, in combination with its canopy height above the seafloor, is well detectable by different acoustic systems using different frequencies (Fakiris et al., 2019). Seagrass meadows have been studied extensively with acoustic methods (Gumusay et al., 2019; Ballard et al., 2020). The prior studies did not consider seasonal changes in the seagrass acoustic footprint. The observed seasonal effect of Z. marina is a mean backscatter intensity increase of about 1 and 2.5 dB between May and August for the angular corrected mosaic at 200 and 400 kHz, respectively. Changes between August and October are on average smaller (Table 3). Average changes of 2 dB in a backscatter mosaic can be caused both by lines of different azimuth depending on conditions at the seafloor (Lurton et al., 2018) and short-term variability of acoustic measurements on sandy sediments (Montereale-Gavazzi et al., 2019). Therefore, it is not the average increase in backscatter intensity in the seagrass area, but the presence of local changes of up to 7 dB that represents the most important seasonal effect (Figures 8I,N).
The ARC for the seagrass facies shows a strong increase of backscatter values at high angles of incidence (>40°, Figure 9). The effect correlates with the seagrass density (which is increasing from May to August, Figure 3). Usually, a decrease in acoustic backscatter at increasing incidence angles is expected for the sandy seafloor (Yu et al., 2015). ARCs of seagrass meadows reported in previous studies (De Falco et al., 2010; Hasan et al., 2012; Fakiris et al., 2019) did not show this effect, but it was observed consistently in our investigation. The backscatter increase at high incidence angles increases with frequency, similar to the effect observed for backscatter intensity in mosaics. We argue that this inversion at higher incidence angles is caused by the acoustic beam traveling through a larger amount of dense seagrass when compared to low incidence angles. The footprint size steeply increases with the beam number in shallow waters (Hellequin et al., 2003) and contributes to a higher number of seagrass leaves within the outer beams. Scatter from bubbles attached to additional seagrass blades is preserved in the multibeam time series data. The increased sensitivity of the 400 kHz frequency is explained by the size of gas bubbles being closer to the wavelength of the higher frequency (Lurton, 2002). The behavior observed in this study may be a characteristic feature of dense Z. marina seagrass meadows, and reduced for decreasing meadow density.
The different seasonal response of frequencies in the seagrass facies is related to different penetration depths. Signals of lower frequencies have a larger penetration depth (Schneider von Deimling et al., 2013; Gaida et al., 2019). At 500 kHz, the penetration in sandy sediment is estimated at 1.2 cm, while 100 kHz frequency penetration is approximately 9 cm (Huff, 2008). A difference in penetration depth can explain the smaller backscatter increase between May and August at 200 kHz frequency compared to 400 kHz (Figure 8). Although only few seagrass leaves were present after the winter storms, the buried rhizomes were still remaining. Those are located closely below the seafloor surface and can include oxygen bubbles (Borum et al., 2007). Therefore, rhizomes are expected to cause increased volume scatter at 200 kHz frequency compared to 400 kHz. The exceptional decrease in the backscatter strength from May to August from seagrass patches enclosed by the south-eastern reef area (marked in Figure 5) is possibly caused by already high-backscatter values in May. Mussel beds typically show higher backscatter values compared to seagrass (Table 3). The seafloor covered by mussels which are overgrown by dense seagrass meadows results in relatively lower backscatter values, because dense seagrass meadows block the acoustic response of the substrate it is growing on (Gumusay et al., 2019).
4.3 Coarse sand and gravel
The characteristic signature of the CSG facies is the increased high-frequency response for gravelly seafloor (Figure 7), readily observed in a subset of ARC curves of coarse sand and gravel seafloor (Figure 10). The multifrequency maps are particularly useful for the identification of gravelly seafloor, especially with the inclusion of the (uncalibrated) 700 kHz (Figure 10B). The ratio between the seafloor roughness and wavelength of the acoustic signal increases with frequency. Consequently, the specular component of the incident acoustic signal decreases and the spherical scattering in all the directions increases, as the seafloor surface becomes relatively rougher (Lurton, 2002). This explains the almost constant backscatter strength ARC at 700 kHz frequency overall incidence angles (Figure 10A). Additionally, the wavelength at high frequencies is comparable to the sediment grain size (2.1 mm wavelength for 700 kHz at 1,500 m/s, gravel begins 2 mm grain size diameter (Blott and Pye, 2012)), thus additional wave effects, for example, interference, can occur. The gravelly areas are ecologically valuable habitats, but apparently have a seasonal appearance at the investigation site. The multiseasonal data for the CSG facies (Figure 6) and repeated underwater video footage (Figure 3) indicate changes in the bedstate and sediment composition, with an increasing amount of coarse sand and gravel fractions and increasing exposure leading to the formation of large-scale ripple structures in August and October. Hydrodynamics at the investigation site form elongated small-scale sediment ripples that change the seafloor roughness (as visible in August, Figures 3H,K). Presumably, similar effects may be present in comparable CSG habitats in the Baltic Sea, and should be the target of further studies.
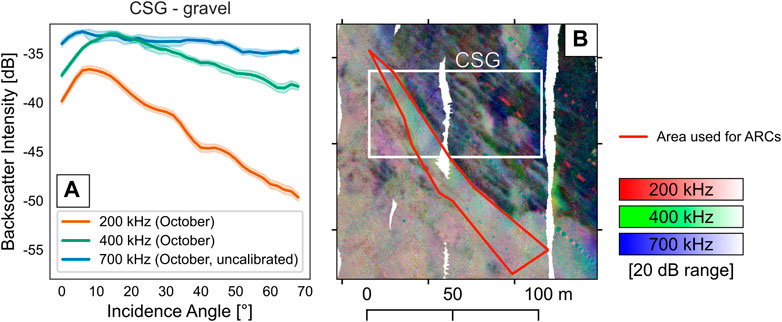
FIGURE 10. (A) Angular range curves (ARCs) at 200, 400, and 700 kHz frequency (October) for a gravelly area within the CSG facies. A 95%-confidence interval was added to the curves. The uncalibrated backscatter values of the 700 kHz frequency allow only for a relative comparison. (B) Exact area used for the ARCs is outlined in red. The multifrequency backscatter map (200, 400, and 700 kHz) in the background shows the transition from the reef to CSG facies in October. The NW-SE orientated ripple occurring in October is prominently visible as bright bluish colors surrounded by dark colors.
The relative increase in the lower frequency (200 kHz) sensitivity to areas of fine to medium sand can be explained by an additional contribution of volume scatter (Feldens et al., 2018) due to increased penetration depth as discussed earlier for the seagrass facies. In the CSG facies, the occurrence of worm casts is associated with fine to medium sands, and can be used as an optical indicator of changes in sediment composition (Longbottom, 1970). It can be assumed that features such as worm casts and worm tubes affect volume scatter, as has been demonstrated in the laboratory (Schulze et al., 2021). However, the effects are so far difficult to quantify for the seafloor with low benthic coverage (Schönke et al., 2019). Benthic macrofauna in the CSG facies is low in biomass, abundance, and species richness, but significant amounts of blue mussels (M. edulis) are found in April and August. They were absent in the grab sample collected in October, but large patches were visible in the video footage, which again emphasizes the limits of point samples in habitats of considerable small-scale heterogeneity.
4.4 Reef
The average acoustic backscatter is seasonally constant compared to the other investigated facies. Average backscatter decreases by 1 dB from May to October at 200 kHz frequency and increases by 0.3 dB at 400 kHz frequency between May and October, including an intermediate increase of 0.9 dB between May and August (Table 3). These differences are within expected changes due to survey geometry or environmental changes (Lurton et al., 2018). A dominating effect on the reef facies is due to the presence of M. edulis growing attached to stones and boulders. Given that the sediment between mussel clumps and stones (which cannot be individually recognized) is of fine to medium sand composition, the increase in backscatter compared to the CSG and seagrass facies is at least partially caused by the mussel coverage. This is in line with previous studies reporting increased column scatter caused by the presence of mussels or shell hash (Lyons, 2005; Schulze et al., 2021). Then, the constant backscatter suggests that mussel coverage remained similar throughout the year, while the multifrequency maps (Figure 2B) suggest a constant response of the habitat to all used frequencies. However, an analysis of the relationship between mussel coverage and backscatter intensity is not possible with our dataset. Although small-scale changes in backscatter intensity are found for mussel-covered seafloor and changes in mussel abundance are observed in the underwater footage, the small-scale heterogeneity does not allow to unambiguously relate underwater video footage displaying mussel abundance to acoustic data.
Patches within the reef composed of coarser sand display lower backscatter intensities compared to mussel-covered areas, and the increased difference between high and low frequency indicates the presence of a coarser substratum. This is worth noting that Mytilus edulis avoids regions of coarser sediment (with the exception of drifting not-attached aggregates of M. edulis clumps).
A clear change observed in video data shows the occurrence of red algae Polysiphonia fucoides in August. Although algae could be identified in acoustic remote sensing in prior studies (Rattray et al., 2009), it was not possible to differentiate the occurrence of P. fucoides in August using multifrequency backscatter mosaics in our investigation site. Potentially, the algae could be imaged by water column imaging (Schimel et al., 2020), however, this is beyond the scope of our study.
5 Conclusion
Backscatter mosaics and angular response curves based on a multi-season multifrequency backscatter survey in the Hohe Düne investigation site (southern Baltic Sea) revealed characteristic spectral features for seagrass as well as coarse sand and gravel habitats. The results complement point-based sampling methods with full-coverage high-resolution data. Seasonal developments of these habitats could be observed and displayed in maps based on acoustic remote sensing. However, limitations in positioning accuracy of point samples still prevent a full understanding of the multispectral signal, especially in areas with high patchiness of habitats and their structuring inhabitants, which was apparent for a reef habitat in the investigation site. Additional field studies and controlled laboratory experiments are required to better understand the acoustic impact of benthic life and to interpret the information included in multispectral acoustic information.
Data availability statement
All data is stored on dedicated servers of the Leibniz Institute for Baltic Sea Research Warnemünde. The raw multibeam echosounder data supporting the conclusion of this article are publicly available at the Pangaea Archive. This data can be found here: https://doi.pangaea.de/10.1594/PANGAEA.946056.
Author contributions
IS, PF, and MZ contributed to conception and design of the study. IS and MG were responsible for the field work. IS led the data analysis, supported by the other authors (MG, PF, MS, and MZ). IS and MG visualized the results. IS and PF wrote the first draft of the manuscript. All authors contributed to manuscript revision, read, and approved the submitted version.
Funding
This research resulted from the BONUS ECOMAP project (funding number 03F0768B), supported by BONUS (Art 185), funded jointly by the EU and the Federal Ministry of Education and Research of Germany (BMBF), the National Centre for Research and Development of Poland (NCBR), and the Innovation Fund Denmark (Innovationsfonden).
Acknowledgments
We would like to thank our BONUS ECOMAP project partner NORBIT Subsea for providing the calibrated NORBIT WMBS STX used for the acoustic measurements. We would like to thank all students helping during the field work. We would like to specially thank the IOW’s workshop team for steering and maintaining our small catamaran “Klaashahn.”
Conflict of interest
The authors declare that the research was conducted in the absence of any commercial or financial relationships that could be construed as a potential conflict of interest.
Publisher’s note
All claims expressed in this article are solely those of the authors and do not necessarily represent those of their affiliated organizations, or those of the publisher, the editors, and the reviewers. Any product that may be evaluated in this article, or claim that may be made by its manufacturer, is not guaranteed or endorsed by the publisher.
Supplementary material
The Supplementary Material for this article can be found online at: https://www.frontiersin.org/articles/10.3389/frsen.2022.956994/full#supplementary-material
References
Ballard, M. S., Lee, K. M., Sagers, J. D., Venegas, G. R., McNeese, A. R., Wilson, P. S., et al. (20202002–2019). Application of acoustical remote sensing techniques for ecosystem monitoring of a seagrass meadow. J. Acoust. Soc. Am. 147, 2002–2019. doi:10.1121/10.0000954
Blott, S. J., and Pye, K. (2012). Particle size scales and classification of sediment types based on particle size distributions: review and recommended procedures. Sedimentology 59, 2071–2096. doi:10.1111/j.1365-3091.2012.01335.x
Borum, J., Sand-Jensen, K., Binzer, T., Pedersen, O., and Greve, T. M. (2007). “Oxygen movement in seagrasses,” in Seagrasses: biology, ecologyand conservation (Springer), 255–270.
Brown, C. J., Beaudoin, J., Brissette, M., and Gazzola, V. (2019). Multispectral multibeam echo sounder backscatter as a tool for improved seafloor characterization. Geosciences 9, 126. doi:10.3390/geosciences9030126
Caress, D. W., and Chayes, D. N. (1996). Improved processing of hydrosweep ds multibeam data on the r/v maurice ewing. Mar. Geophys. Res. 18, 631–650. doi:10.1007/bf00313878
Clarke, J. E. H. (2015). “Multispectral acoustic backscatter from multibeam, improved classification potential,” in Proceedings of the United States hydrographic conference, San Diego, CA, 15–19.
Clarke, K., and Gorley, R. (2015). Getting started with primer v7. PRIMER-E: Plymouth. Plymouth: Plymouth Marine Laboratory, Vol. 20.
Costa, B. (2019). Multispectral acoustic backscatter: How useful is it for marine habitat mapping and management? J. Coast. Res. 35, 1062. doi:10.2112/jcoastres-d-18-00103.1
Cullen-Unsworth, L., and Unsworth, R. (2013). Seagrass meadows, ecosystem services, and sustainability. Environ. Sci. policy Sustain. Dev. 55, 14–28. doi:10.1080/00139157.2013.785864
Czechowska, K., Feldens, P., Tuya, F., Cosme de Esteban, M., Espino, F., Haroun, R., et al. (2020). Testing side-scan sonar and multibeam echosounder to study black coral gardens: a case study from macaronesia. Remote Sens. 12, 3244. doi:10.3390/rs12193244
Darr, A., Gogina, M., and Zettler, M. L. (2014). Functional changes in benthic communities along a salinity gradient– a western Baltic case study. J. Sea Res. 85, 315–324. doi:10.1016/j.seares.2013.06.003
Dartnell, P., and Gardner, J. V. (2004). Predicting seafloor facies from multibeam bathymetry and backscatter data. photogramm. eng. remote sensing 70, 1081–1091. doi:10.14358/pers.70.9.1081
De Falco, G., Tonielli, R., Di Martino, G., Innangi, S., Simeone, S., and Parnum, I. M. (2010). Relationships between multibeam backscatter, sediment grain size and posidonia oceanica seagrass distribution. Cont. Shelf Res. 30, 1941–1950. doi:10.1016/j.csr.2010.09.006
Duarte, B., Martins, I., Rosa, R., Matos, A. R., Roleda, M. Y., Reusch, T. B., et al. (2018). Climate change impacts on seagrass meadows and macroalgal forests: An integrative perspective on acclimation and adaptation potential. Front. Mar. Sci. 5, 190. doi:10.3389/fmars.2018.00190
Dufrêne, M., and Legendre, P. (1997). Species assemblages and indicator species: the need for a flexible asymmetrical approach. Ecol. Monogr. 67, 345. doi:10.2307/2963459
Fakiris, E., Blondel, P., Papatheodorou, G., Christodoulou, D., Dimas, X., Georgiou, N., et al. (2019). Multi-frequency, multi-sonar mapping of shallow habitats—efficacy and management implications in the national marine park of zakynthos, greece. Remote Sens. 11, 461. doi:10.3390/rs11040461
Feldens, P., Schulze, I., Papenmeier, S., Schönke, M., and Schneider von Deimling, J. (2018). Improved interpretation of marine sedimentary environments using multi-frequency multibeam backscatter data. Geosciences 8, 214. doi:10.3390/geosciences8060214
Foote, K. G., Hanlon, R. T., Iampietro, P. J., and Kvitek, R. G. (2006). Acoustic detection and quantification of benthic egg beds of the squid loligo opalescens in monterey bay, California. J. Acoust. Soc. Am. 119, 844. doi:10.1121/1.2149840
Gaida, T. C., Mohammadloo, T. H., Snellen, M., and Simons, D. G. (2019). Mapping the seabed and shallow subsurface with multi-frequency multibeam echosounders. Remote Sens. 12, 52. doi:10.3390/rs12010052
Gaida, T. C., Tengku Ali, T. A., Snellen, M., Amiri-Simkooei, A., van Dijk, T. A. G. P., and Simons, D. G. (2018). A multispectral bayesian classification method for increased acoustic discrimination of seabed sediments using multi-frequency multibeam backscatter data. Geosciences 8, 455. doi:10.3390/geosciences8120455
Gogina, M., Zettler, A., and Zettler, M. L. (2022). Weight-to-weight conversion factors for benthic macrofauna: recent measurements from the baltic and the north seas. Earth Syst. Sci. Data 14, 1–4. doi:10.5194/essd-14-1-2022
Gumusay, M. U., Bakirman, T., Tuney Kizilkaya, I., and Aykut, N. O. (2019). A review of seagrass detection, mapping and monitoring applications using acoustic systems. Eur. J. Remote Sens. 52, 1–29. doi:10.1080/22797254.2018.1544838
Hasan, R. C., Ierodiaconou, D., and Laurenson, L. (2012). Combining angular response classification and backscatter imagery segmentation for benthic biological habitat mapping. Estuar. Coast. Shelf Sci. 97, 1–9. doi:10.1016/j.ecss.2011.10.004
Heinrich, C., Feldens, P., and Schwarzer, K. (2017). Highly dynamic biological seabed alterations revealed by side scan sonar tracking of lanice conchilega beds offshore the island of sylt (german bight). Geo-Mar. Lett. 37, 289–303. doi:10.1007/s00367-016-0477-z
Held, P., and Schneider von Deimling, J. (2019). New feature classes for acoustic habitat mapping—a multibeam echosounder point cloud analysis for mapping submerged aquatic vegetation (sav). Geosciences 9, 235. doi:10.3390/geosciences9050235
Hellequin, L., Boucher, J.-M., and Lurton, X. (2003). Processing of high-frequency multibeam echo sounder data for seafloor characterization. IEEE J. Ocean. Eng. 28, 78–89. doi:10.1109/joe.2002.808205
Huff, L. C. (2008). “Acoustic remote sensing as a tool for habitat mapping in Alaska waters,” in Marine Habitat mapping technology for Alaska. Editors J. R. Reynolds, and H. G. Greene, 29–46.
Janowski, L., Trzcinska, K., Tegowski, J., Kruss, A., Rucinska-Zjadacz, M., and Pocwiardowski, P. (2018). Nearshore benthic habitat mapping based on multi-frequency, multibeam echosounder data using a combined object-based approach: a case study from the rowy site in the southern Baltic Sea. Remote Sens. 10, 1983. doi:10.3390/rs10121983
Kloser, R., Penrose, J., and Butler, A. (2010). Multi-beam backscatter measurements used to infer seabed habitats. Cont. Shelf Res. 30, 1772–1782. doi:10.1016/j.csr.2010.08.004
Kruss, A., Tegowski, J., Tatarek, A., Wiktor, J., and Blondel, P. (2017). Spatial distribution of macroalgae along the shores of kongsfjorden (west spitsbergen) using acoustic imaging. Warszawa, Poland: Polish Polar Research, 205–229. doi:10.1515/popore-2017-0009
Kuhwald, K., Schneider von Deimling, J., Schubert, P., and Oppelt, N. (2021). How can sentinel-2 contribute to seagrass mapping in shallow, turbid baltic sea waters? Remote Sens. Ecol. Conserv. 8, 328–346. doi:10.1002/rse2.246
Laudien, J., and Wahl, M. (1999). Indirect effects of epibiosis on host mortality: seastar predation on differently fouled mussels. Mar. Ecol. 20, 35–47. doi:10.1046/j.1439-0485.1999.00063.x
Longbottom, M. (1970). The distribution of arenicola marina (l.) with particular reference to the effects of particle size and organic matter of the sediments. J. Exp. Mar. Biol. Ecol. 5, 138–157. doi:10.1016/0022-0981(70)90013-4
Lurton, X., Eleftherakis, D., and Augustin, J.-M. (2018). Analysis of seafloor backscatter strength dependence on the survey azimuth using multibeam echosounder data. Mar. Geophys. Res. 39, 183–203. doi:10.1007/s11001-017-9318-3
Lyons, A. P. (2005). The potential impact of shell fragment distributions on high-frequency seafloor backscatter. IEEE J. Ocean. Eng. 30, 843–851. doi:10.1109/joe.2005.862082
Montereale-Gavazzi, G., Roche, M., Degrendele, K., Lurton, X., Terseleer, N., Baeye, M., et al. (2019). Insights into the short-term tidal variability of multibeam backscatter from field experiments on different seafloor types. Geosciences 9, 34. doi:10.3390/geosciences9010034
Maggs, C., and Hommersand, M. (1993). Seaweeds of the british isles. volume i. rhodophyta. part 3a. ceramiales. London: Natural History Museum.
Menandro, P. S., Bastos, A. C., Misiuk, B., and Brown, C. J. (2022). Applying a multi-method framework to analyze the multispectral acoustic response of the seafloor. Front. Remote Sens. 29. doi:10.3389/frsen.2022.860282
Papenmeier, S., Darr, A., Feldens, P., and Michaelis, R. (2020). Hydroacoustic mapping of geogenic hard substrates: challenges and review of german approaches. Geosciences 10, 100. doi:10.3390/geosciences10030100
Rattray, A., Ierodiaconou, D., Laurenson, L., Burq, S., and Reston, M. (2009). Hydro-acoustic remote sensing of benthic biological communities on the shallow south east Australian continental shelf. Estuar. Coast. Shelf Sci. 84, 237–245. doi:10.1016/j.ecss.2009.06.023
Roberts, D. (2013). labdsv: ordination and multivariate analysis for ecology. package version 1.7-0. Available at: http://cran.r-project.org/web/packages/labdsv.
Roche, M., Degrendele, K., Vrignaud, C., Loyer, S., Le Bas, T., and Augustin, J.-M. (2018). Control of the repeatability of high frequency multibeam echosounder backscatter by using natural reference areas. Mar. Geophys. Res. 39, 89–104. doi:10.1007/s11001-018-9343-x
Schiele, K. S., Darr, A., Zettler, M. L., Friedland, R., Tauber, F., and von Weber, M. (2015). Biotope map of the German Baltic Sea. Mar. Pollut. Bull. 96, 127–135. doi:10.1016/j.marpolbul.2015.05.038
Schimel, A. C., Brown, C. J., and Ierodiaconou, D. (2020). Automated filtering of multibeam water-column data to detect relative abundance of giant kelp (macrocystis pyrifera). Remote Sens. 12, 1371. doi:10.3390/rs12091371
Schneider von Deimling, J., Weinrebe, W., Tóth, Z., Fossing, H., Endler, R., and Rehder, G. (2013). A low frequency multibeam assessment: spatial mapping of shallow gas by enhanced penetration and angular response anomaly. Mar. petroleum Geol. 44, 217–222. doi:10.1016/j.marpetgeo.2013.02.013
Schönke, M., Wiesenberg, L., Schulze, I., Wilken, D., Darr, A., and Papenmeier, S. (2019). Impact of sparse benthic life on seafloor roughness and high-frequency acoustic scatter. Geosciences 9, 454. doi:10.3390/geosciences9100454
Schulte to Bühne, H., and Pettorelli, N. (2018). Better together: Integrating and fusing multispectral and radar satellite imagery to inform biodiversity monitoring, ecological research and conservation science. Methods Ecol. Evol. 9, 849–865. doi:10.1111/2041-210x.12942
Schulze, I., Wilken, D., Zettler, M. L., Gogina, M., Schönke, M., and Feldens, P. (2021). Laboratory measurements to image endobenthos and bioturbation with a high-frequency 3d seismic lander. Geosciences 11, 508. doi:10.3390/geosciences11120508
Snellen, M., Simons, D. G., and Riethmueller, R. (2008). High frequency scattering measurements for mussel bed characterisation. J. Acoust. Soc. Am. 123, 3627. doi:10.1121/1.2934852
Song, Y., Niemeyer, J., Ellmer, W., Soergel, U., and Heipke, C. (2015). “Comparison of three airborne laser bathymetry data sets for monitoring the German Baltic Sea Coast,” in Proc. SPIE 9638, remote sensing of the ocean, sea ice, coastal waters, and large water regions 2015, 96380Z. doi:10.1117/12.2194960
Tauber, F. (2012). Meeresbodensedimente in der Deutschen Ostsee. BSH, Bundesamt für Seeschifffahrt und Hydrographie.
Terrados, J., and Borum, J. (2004). “Why are seagrasses important?-goods and services provided by seagrass meadows,” in European seagrasses: An introduction to monitoring and management, 8–10.
Thorhaug, A., Richardson, A., and Berlyn, G. (2007). Spectral reflectance of the seagrasses: thalassia testudinum, halodule wrightii, syringodium filiforme and five marine algae. Int. J. Remote Sens. 28, 1487–1501. doi:10.1080/01431160600954662
Turner, W., Spector, S., Gardiner, N., Fladeland, M., Sterling, E., and Steininger, M. (2003). Remote sensing for biodiversity science and conservation. Trends Ecol. Evol. 18, 306–314. doi:10.1016/s0169-5347(03)00070-3
Wang, R., and Gamon, J. A. (2019). Remote sensing of terrestrial plant biodiversity. Remote Sens. Environ. 231, 111218. doi:10.1016/j.rse.2019.111218
Weber, T. C., Rice, G., and Smith, M. (2018). Toward a standard line for use in multibeam echo sounder calibration. Mar. Geophys. Res. 39, 75–87. doi:10.1007/s11001-017-9334-3
Yokoya, N., Grohnfeldt, C., and Chanussot, J. (2017). Hyperspectral and multispectral data fusion: a comparative review of the recent literature. IEEE Geosci. Remote Sens. Mag. 5, 29–56. doi:10.1109/mgrs.2016.2637824
Keywords: habitat mapping, multibeam echosounder, backscatter, angular response curves, multifrequency, Baltic Sea
Citation: Schulze I, Gogina M, Schönke M, Zettler ML and Feldens P (2022) Seasonal change of multifrequency backscatter in three Baltic Sea habitats. Front. Remote Sens. 3:956994. doi: 10.3389/frsen.2022.956994
Received: 30 May 2022; Accepted: 30 June 2022;
Published: 08 August 2022.
Edited by:
Philippe Blondel, University of Bath, United KingdomReviewed by:
Elias Fakiris, University of Patras, GreeceNikhil Banda, Drumgrange Ltd., United Kingdom
Copyright © 2022 Schulze, Gogina, Schönke, Zettler and Feldens . This is an open-access article distributed under the terms of the Creative Commons Attribution License (CC BY). The use, distribution or reproduction in other forums is permitted, provided the original author(s) and the copyright owner(s) are credited and that the original publication in this journal is cited, in accordance with accepted academic practice. No use, distribution or reproduction is permitted which does not comply with these terms.
*Correspondence: Inken Schulze, aW5rZW4uc2NodWx6ZUBpby13YXJuZW11ZW5kZS5kZQ==