 Maximiliano Arena1,2*
 Paula Pratolongo3,2
 Hubert Loisel4
 Manh Duy Tran4Daniel Schaffer Ferreira Jorge4
 Ana Laura Delgado1,5
- 1Instituto Argentino de Oceanografía (IADO-CONICET-UNS), Bahía Blanca, Argentina
- 2Departamento de Biología Bioquímica y Farmacia, Universidad Nacional del Sur (UNS), Bahía Blanca, Argentina
- 3Centro de Recursos Renovables de la Zona Semiárida (CERZOS-CONICET-UNS), Bahía Blanca, Argentina
- 4Laboratoire d’Océanologie et de Géosciences, Université du Littoral-Côte-d’Opale, Université Lille, CNRS, IRD, UMR, LOG, Wimereux, France
- 5Institut Mediterrani d’Estudis Avançats (IMEDEA-CSIC-UIB), Esporles, Spain
The site AERONET-OC Bahía Blanca (BB-AERONET-OC) is located at the mouth of the Bahía Blanca Estuary, Argentina (Southwestern Atlantic Ocean), a coastal system defined by its high suspended loads and relatively low colored dissolved organic matter. The typically high turbidity of these waters makes the BB-AERONET-OC distinctive within the AERONET-OC network stations, providing exceptional opportunities not only for the validation of atmospheric correction algorithms but also for the development of regional algorithms for coastal complex waters. A SeaWiFS Photometer Revision for Incident Surface Measurements (SeaPRISM) instrument was deployed in January 2020 in the upper rail of a Mareograph Tower, a 15 m tall structure, located 10 miles away from the coast in optically deep waters. In this work we used the remote sensing reflectance (Rrs) derived from the BB-AERONET-OC measurements along with in situ hyperspectral radiometric data to classify optical water types (OWTs). We assigned each Rrs(λ) spectra to one of the five OWTs defined by Tran et al., and OWTs were further characterized with the concentrations of optically significant components (chlorophyll-a and suspended particulate matter) and inherent optical properties (absorptions of phytoplankton, non-algal particles, and dissolved organic matter), retrieved from water samples obtained simultaneously with radiometric spectra. Based on a match-up exercise with in situ data, different schemes of atmospheric correction methods were applied to Sentinel-3 Ocean and Land Colour Instrument (OLCI) images. The operational product OLCI Level 2 European Space Agency (ESA) standard (hereafter referred to as “Standard Neural Network (NN)”) proves to be the most suitable atmospheric correction algorithm, which was then used to describe spatial patterns and temporal variability of the different OWTs in the region. The BB-AERONET-OC site is located in a sharp transition between estuarine and coastal waters that present contrasting optical conditions: OWT 4 dominates over time (73.72% of the observations), followed by OWT 3 (24.74%) and OWT 5 (1.53%). OWTs 4 and 5 are associated with turbid waters of the Bahía Blanca Estuary, especially OWT 5, which typifies the very turbid waters from the inner estuary, with the particulate load dominated by mineral sediments and detritus. OWT 3, in turn, depicts the eutrophic coastal waters of the inner shelf. The variability of OWTs and the relative contribution of organic and inorganic compounds to the suspended material would be mostly related with the prevalence of northwest winds in the area, which would drive the export of estuarine sediments to the shelf.
1 Introduction
The Aerosol Robotic Network (AERONET) is a global network of ground-based Sun and sky radiometers and data archive managed by the National Aeronautics and Space Administration (NASA) Goddard Space Flight Center (GSFC) in partnership with the Laboratoire d’Optique Atmosphérique (LOA) of the University of Lille (France) (Holben et al., 1998). The instruments collect high-quality data on aerosol optical thickness, size distribution, and other atmospheric properties. The AERONET Ocean Color Project (AERONET-OC) is an extension of AERONET’s capabilities to support ocean color research, providing information to calibrate and validate ocean color measurements taken from space-borne instruments. The network is composed of radiometers deployed at coastal sites and marine environments to gather accurate ground-based measurements, which are then used to validate the satellite-derived ocean color data. Thus, AERONET-OC plays a crucial role in improving the accuracy and reliability of satellite-derived ocean color products (Zibordi and Talone, 2020), allowing a more comprehensive understanding of the oceans and their essential functions, and leading to better-informed decisions and policies related to environmental conservation and management.
AERONET-OC sites collect radiometric measurements of the spectral normalized water-leaving radiance, Lwn (λ; mW cm-2 sr−1 µm-1) (λ represents wavelength of visible light expressed in units of nm). The spectral remote-sensing reflectance, Rrs(λ), can be converted from Lwn(λ) and is the fundamental parameter from which bio-optical properties and the concentrations of optically significant substances in water are retrieved. Global Climate Observing System (GCOS, 2011) defines a target accuracy requirement for the water-leaving radiance of 5% specifically for the blue and green wavelengths. This accuracy is achievable in the so-called Case-1 waters (typically oceanic environments), whose inherent optical properties (IOPs) primarily depend on phytoplankton and associated dissolved and particulate matters (Morel and Prieur, 1977). In optically complex waters of estuarine, coastal, and inland environments, IOPs are significantly influenced by other particulate and dissolved constituents mainly from terrestrial origin whose concentrations do not covary with the phytoplankton concentration. In these waters, commonly referred to as Case-2 (Morel and Prieur, 1977), the optical budget depends on the relative contribution of these substances, significantly increasing the uncertainties of Rrs (λ) retrievals and derived ocean color products (Bi et al., 2023).
A methodological approach to solve the problem of estimating the concentration of relevant optically significant substances in complex waters, includes a classification of Rrs (λ) spectra into optical water types (OWTs) (e.g Lubac and Loisel, 2007; Vantrepotte et al., 2012; Hieronymi et al., 2017; Wei et al., 2022; Hieronymi et al., 2023). Rrs(λ) spectra vary in different shapes and magnitudes, in response to the absorption and backscattering of optically significant substances suspended and dissolved in water (Kirk, 2011). Thus, the classification in OWTs provides information about the optically significant components in each class and allows analyzing the variability and trends of the biogeochemical and biological variables they are proxy of (Botha et al., 2020). Statistical methods for clustering, such as k-means, hierarchical clustering and fuzzy clustering are widely used based on the spectral shape or spectral magnitude of Rrs(λ) spectra. For instance, Vantrepotte et al. (2012) identified different OWTs for contrasted turbid coastal areas of the eastern English Channel, southern North Sea and French Guiana using a clustering approach performed on the spectrally normalized reflectance spectra. More recently, Tran et al. (2023) used this same approach as a classification of Rrs(λ) spectra into five different OWTs as a preliminary step to obtain optimized Chl-a retrievals.
In January 2020 the site AERONET-OC Bahía Blanca (BB-AERONET-OC) was established at the mouth of Canal Principal, the main navigation channel of the Bahía Blanca Estuary. This is a complex coastal system characterized by large temporal and spatial variations in turbidity. Previous work by Arena et al. (2022), based on a time series of Landsat 8 - Operational Land Imager (L8-OLI) showed that larger turbidity values consistently characterized the middle section of Canal Principal, and turbidity progressively decreased through the mouth of Canal Principal. Around the location of the site BB-AERONET-OC, a synoptic overview of the average turbidity over the entire time series showed a sharp transition from the turbid waters characterizing Canal Principal, to the clearer water conditions typical of the coastal zone out of the estuary. In turn, the temporal analysis revealed large changes in turbidity in response to meteorological forcings, demonstrating a variety of water types at this site location.
The objective of the present study is to characterize the optical variability around the BB-AERONET-OC site whose Rrs(λ) measurements can also be used to assess the accuracy of atmospheric correction algorithms (Zibordi and Talone, 2020). In this work we used the Rrs(λ) from the BB-AERONET-OC and spectral radiometric measurements obtained from field campaigns, along Canal Principal, to describe the optical variability of waters around the site. We assigned each normalized Rrs(λ) spectra to one of the five OWT’s proposed by Tran et al. (2023) and the different OWTs found in the area were then characterized using the concentrations of optically significant components namely the chlorophyll-a, Chl-a, (in mg.m-3) and suspended particulate matter, SPM, (in g.m-3) concentrations, absorption coefficients by phytoplankton, aph (443, in m-1), non-algal particulate matter, anap (443, in m-1) and colored dissolved organic matter, acdom (443, in m-1), retrieved from in situ water samples collected along with the radiometric measurements. Afterwards, five freely available atmospheric correction algorithms were tested on Ocean and Land Colour Instrument (OLCI) images through a match up exercise using data from the site BB-AERONET-OC. The best performing atmospheric correction algorithm was then applied to all the OLCI images available since 2020 and used to describe spatial patterns and temporal variability of the different OWTs in the study area. Our results emphasize the optical complexity of the waters located around the BB-AERONET-OC and can be used to inform future development of inverse algorithms to accurately retrieve bio-optical parameters in extremely dynamic coastal environments.
2 Materials and methods
2.1 Study area
The Bahía Blanca Estuary (38° 45′S; 62° 22′W) is a mesotidal system, located in a temperate region of the Argentine Sea. The estuary is composed of a series of major tidal channels, oriented NW to SE, separated from each other by extensive intertidal flats, salt marshes, and islands (Pratolongo et al., 2017). The northern portion of the estuarine area is dominated by Canal Principal (Figure 1), the main navigation channel, that extends over more than 60 km and varies in width from about 3 to 4 km at the mouth (22 m depth) to 200 m at the head (3 m depth) (Piccolo and Perillo, 1990; Perillo et al., 2004). This is a complex coastal system characterized by a widespread erosion in mudflats and saltmarshes of the inner section, and strong tidal currents are responsible for the typically high suspended loads in the channel. Off the estuarine influence, a wide inner shelf extends to the 40 m isobath. In this shallow region, called El Rincón, mixing due to wind and tides produces a vertically homogeneous water column throughout the year (Martos and Piccolo, 1988).
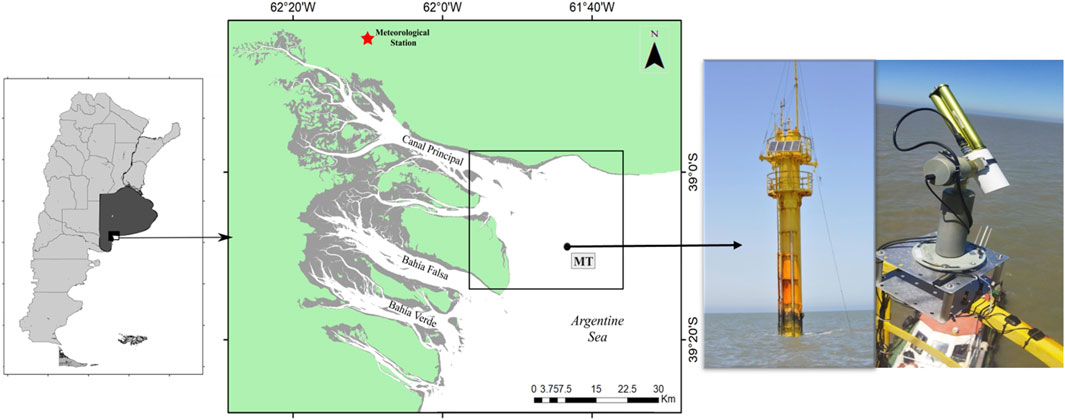
Figure 1. Geographical location of AERONET Bahía Blanca site, Argentina. Red star indicates the location of the meteorological station and the black dot represents the position of the Mareographic Tower (MT).
Previous work, based on in situ observations in the inner section of Canal Principal (Arena et al., 2019), showed that the absorption budget (at 443 nm) of turbid waters close to the head of the estuary were dominated by anap (70%) followed by aph (20%), while acdom presented the lowest contribution (10%). In the coastal waters of the inner shelf, where the phytoplankton community is mainly dominated by diatoms, aph (443) varied from 0.02 to 0.13 m-1 with a mean value of 0.052 m-1, (Delgado et al., 2019). The hydrographic evidence presented by Delgado et al. (2017), coupled with the prevalence of phytoplankton groups well-adapted to turbulent and turbid conditions, such as diatoms which are the most abundant phytoplankton group over coccolithophores, nano-flagellates, and dinoflagellates, suggest that the coastal zone off the mouth of Canal Principal is influenced by relatively turbid water (ranging between 50–100 FNU) outflowing the Bahía Blanca Estuary.
2.2 In situ measurements
2.2.1 Radiometric measurements from the AERONET station
Since January 2020 the site BB-AERONET-OC has been operational at the mouth of Canal Principal, the main navigation channel of the Bahía Blanca Estuary. AERONET-OC collects data from worldwide distributed autonomous above-water CIMEL CE-318 (Cimel Electronique, France) sun-photometers adapted to perform marine radiometric measurements for determining the Lwn(λ), in addition to measurements for retrieving aerosol optical properties. This CIMEL-based system, called SeaWiFS Photometer Revision for Incident Surface Measurements (SeaPRISM), performs multiple sky- and sea-radiance measurements at programmable viewing and azimuth angles at eight center-wavelengths (nominal bands: 412, 443, 488, 531, 551, 667, 870, and 1020 nm) (Zibordi et al., 2009). At the BB-AERONET-OC site, a SeaPRISM instrument was deployed in the upper rail of the Mareographic Tower, a 15 m tall structure, located 10 miles away from the coast (15 m depth). Data provided by NASA (https://aeronet.gsfc.nasa.gov/) include Lwn values determined from measurements screened and processed according to Zibordi et al. (2009).
Level 1.5 data cloud-screened and quality-controlled data collected by the SeaPRISM instrument from January 2020 to May 2023 were downloaded from https://aeronet.gsfc.nasa.gov/. In addition to the AERONET-OC LWN_f/Q data corrected for bidirectional effects (Morel et al., 2002), the alternative LWN_IOP products (Lee et al., 2011) are available. While LWN_f/Q data are generally recommended for applications related to Chla-dominated waters, the alternative products LWN_IOP appear more suitable for optically complex waters (Zibordi et al., 2022; Cazzaniga and Zibordi, 2023). These authors warned that the correction based on Morel et al. (2002; i.e., f/Q) is likely to be affected by large uncertainties. An experimental study focused on the comparison of f/Q- and IOP-based methods (Talone et al., 2018), indicates relative spectrally and water dependent uncertainties varying between 20% and 60% for the f/Q-based approach, with the highest values affecting the blue and red regions. Conversely, the IOP-based approach shows relative uncertainties within 20%–35% and lower dependence on wavelength and water type. These results have motivated the implementation of the IOP-based correction approach in the AERONET-OC processing in addition to the f/Q (Zibordi et al., 2022). The Lwn measured at the site BB-AERONET-OC, corrected using the IOP-based scheme (Lwn-IOP; Lee et al., 2011). was transformed into Rrs(λ) using Eq. 1 and the solar irradiance spectrum, (F0, mW cm2 µm-1) from Thuillier et al. (2003).
2.2.2 Field measurements
In situ measurements of hyperspectral Rrs(λ) were obtained from above-water spectral measurements of water leaving radiance, downwelling radiance reflected from a Spectralon plaque, and sky radiance. Measurements were performed using an Ocean Optics Spectroradiometer HR4000CG (200–1100 nm), (Ocean Optics, Inc.; United States of America), following the NASA-Ocean Optics Protocols for satellite ocean color sensor validation (Mueller et al., 2003). Sampling was always performed under clear sky conditions and low wind speed (<30 km h−1), within 2 h around noon and adopting a viewing angle θ of 40° and a relative azimuth φ of 90°. Rrs(λ) was estimated as follows:
where
Radiometric measurements were taken during September 2017—July 2023 aboard sailboats or small artisanal fishing boats at different sampling points along Canal Principal, from the inner section to the mouth of Canal Principal (38.79°S; 62.27°W) and the coastal zone out of the estuary (39°S–62.5°W; 41.5°S–60°W). To further characterize the optical properties of waters in the Patagonian Shelf, out of the estuarine area and the coastal zone under study (mid shelf and shelf-break), optical and biochemical measurements were collected during a dedicated oceanographic cruise onboard the R/V Dr. Bernardo Houssay (25–28th of March, 2019). A total of 135 surface water samples were taken simultaneously with Rrs(λ) measurements, and analyzed to obtain turbidity (T, FNU), chlorophyll a concentration (Chl-a, μg L−1), concentration of suspended particulate matter (SPM, g m−3), aph (443), anap (443) and acdom (443).
Turbidity was measured using a Hach 2100Q IS portable turbidimeter (FNU). Estimates were obtained by triplicate, after seawatersamples were mixed by gently tumbling the closed 5 L container around several times before subsampling. Turbidity values were then used to set the filtration volume for SPM estimation and to detect problems with sample mixing during subsampling. The dry weight concentration of SPM (mg m−3) was determined by gravimetry, following the protocol proposed by Neukermans et al. (2012). Briefly, a known volume of seawater was passed through a pre-treated and pre-weighed 47 mm Whatman GFF glass fiber filter, with a nominal pore size of 0.7 μm. Filters were pre-treated by ashing at 450°C for 1 h, gently washing in 0.5 L of distilled water to remove loose fractions, drying at 65°C for 1 h, and pre-weighing to the nearest 0.1 mg. Seawater samples were filtered by triplicate on pre-treated filters with an applied vacuum of 300–400 mmHg. Filtration volume was set after Neukermans et al. (2012), considering the previously measured turbidity; for the present study, optimal filtration volumes ranged 0.5–2 L. After filtration, filters were washed with 250 mL of distilled water to remove salts, dried for 48 h at 65°C and re-weighed on the same weighing scale.
Chl-a was estimated by filtering 50 mL of seawater through a Whatman GF/F filter (nominal pore size 0.7 µm) at low vacuum pressure (<5 PSI). Immediately after filtration, all filters were packed individually in aluminum foil and stored in an ultrafreezer at −80°C until analysis. Pigments were extracted in methanol 100% (8 mL), during 12 h at −20°C, in dark, and Chl-a concentration was estimated using the selective fluorometric technique proposed by Welschmeyer (1994). Extract fluorescence was measured with a spectrofluorometer Shimadzu RF 5301 PC (Ex/Em wavelengths: 436/680 nm). To derive the absorption spectra of suspended particulate matter, water samples were filtered and stored using the same procedure described for Chl-a. Total particulate absorption spectra (a(λ), m−1) were estimated through the quantitative filter technique using the quadratic equation of Mitchell (1990). The spectral absorption of each sample was measured using a double beam spectrophotometer Shimadzu UV2450 with integrating sphere, in the 300–800 nm spectral range. After total particulate absorption spectra were measured, the filters were treated with methanol (15 mL; 1 h), and measurements repeated to obtain anap (443). aph (443) was finally estimated by subtracting anap (443) from a(λ). Finally, acdom was estimated from filtered seawater (pre-combusted filters Whatman GF/F, nominal pore size 0.7 µm) using glassware pre-washed according to Mitchell and stramska (2002) from the NASA-Ocean Optics Protocols For Satellite Ocean Color Sensor Validation (HCl 10%; 12 h). Absorption spectra in the 250–750 nm spectral range were measured with a spectrophotometer UV–VIS (Agilent Cary 60), using a 0.1 m pathlength quartz cell.
2.3 Optical water types (OWTs)
Hyperspectral Rrs(λ) data obtained with the hand-held spectroradiometer were resampled to multispectral data using the spectral response functions of the 6 visible OLCI bands (412, 443, 490, 510, 560, and 665 nm) (https://sentinels.copernicus.eu/web/sentinel/technical-guides/sentinel-3-olci/olci-instrument/spectral-characterisation-data). The obtained curves, along with data from the site BB-AERONET-OC, were normalized by considering the ratio between the original Rrs(λ) values and the area below the curve in order to perform the classification introduced by Tran et al. (2023). Regarding BB-AERONET-OC spectra, which are provided in nominal bands, it is worth noting that only six specific wavelengths matching to OLCI bands were considered as inputs for the classification.
In the work by Tran et al. (2023), an unsupervised classification was applied to the normalized spectra derived from worldwide distributed field campaigns along contrasted coastal areas. This unsupervised classification was performed using the Ward’s clustering method. It is a variance analysis used to quantify the distance between different clusters, minimizing the sum of squares of any pair of clusters defined at each step of the procedure. This classification led to the definition of 5 optical water types with distinct Rrs spectral shapes. Those OWTs were then used for labeling inputs of Rrs spectra (e.g., hyperspectral data resampled to multispectral format, multispectral AERONET-OC data, or satellite Rrs) to each of those OWTs defined from their in situ dataset, which are characterized by specific mean and covariance matrices.
For OWT membership computation, we used in this work the normalized Rrs spectra (derived from both Hyperspectral, resampled to OLCI bands, and multispectral AERONET-OC data) as an inputs to assign them into each of the pre-defined OWTs. This was done by using the Mahalanobis distance (
where
2.4 Satellite data and evaluation of atmospheric correction (AC) algorithms
OLCI is a multispectral radiometer currently operational on-board Sentinel-3A (launched in 2016) and B (launched in 2018) observing the Earth at 21 spectral bands from 400 to 1020 nm, with a full spatial resolution at approximately 300 m. We downloaded daily S3/OLCI images Level 1 (full resolution) from the Copernicus Online Data Access (CODA) hosted at EUMETSAT (coda.eumetsat.int). Top-of-atmosphere Level 1 products were processed considering the following atmospheric correction (AC) schemes:
1- “POLYMER” (POLYnomial-based algorithm applied to MERis; v. 4.13) based on an iterative coupled ocean-atmosphere and polynomial spectral matching technique (Steinmetz et al., 2011).
2- “SeaDAS”/l2gen (SeaWiFS Data Analysis System; v8.1, OBPG) algorithm from NASA’s SeaDAS with default settings for OLCI using the 2 bands 779 nm and 865 nm multi-scattering algorithm with Relative Humidity based model selection and iterative NIR correction (Ahmad et al., 2010; Bailey et al., 2010).
3- “SeaDAS-ALT”, an alternative processing for SeaDAS/l2gen using the 2 bands 865/1020 nm multi-scattering algorithm (aerosol mode option = − 2: Multi-scattering with 2-band, RH-based model selection and iterative NIR correction, and Bidirectional reflectance correction = 7; Morel f/Q + Fresnel solar + Fresnel sensor).
4- “ACOLITE/DSF” (Atmospheric correction for OLI ‘lite’/Dark Spectrum Fitting), an imaged-base adapted method for OLCI imagery implemented in ACOLITE using an assumed homogeneous atmosphere over a scene (Vanhellemont and Ruddick, 2021). The atmospheric path reflectance is predicted from multiple dark targets, which are selected accordingly to the lowest observed top of atmosphere reflectance values in all the bands.
5- “Standard NN”, the operational product OLCI L2 ESA standard approach in which atmospheric parameters and water-leaving reflectances are inverted through dedicated neural networks. (EUMETSAT, 2019).
To test the performance of the different AC schemes, we considered Lwn(λ) data measured at the site BB-AERONET-OC at the following wavelengths: 412, 443, 490, 510, 560, 665. The match-up exercise was based on the protocol developed in Bailey and Werdell, (2006). The selection criteria included a time window of ±3 h between the satellite overpass and the in situ measurement, and the Lwn(λ) extraction was performed considering a pixel box of 3-by-3 pixels centered at the location of the BB-AERONET-OC site. A match-up was accepted if at least 6 of 9 pixels of the box were valid (Bailey and Werdell, 2006; Jamet el al., 2011). Afterwards, a spatial uniformity criterion was applied for bands between 412 and 665 nm, based on the coefficient of variation (cv = standard deviation/mean*100). If the cv was higher than 15% the match-up was discarded. A set of quality flags, integrated into the output of each processor, served to determine the validity of individual pixels. Pixels deemed invalid were masked based on criteria such as invalidity, land, cloud, suspicion, high sun-glint, whitecaps, high zenith angle, saturation, and AC failure (Bailey and Wedell, 2006). Additional flags varied depending on the atmospheric correction (AC) method employed. For the “Standard NN,” flags included the adjacency effect and Lwn negative value between 412 and 665 nm, as well as flags indicating being out of range for atmospheric correction neural nets. POLYMER employed flags for negative back-scattering coefficient, out of bounds, exception, thick aerosol, high air mass, and inconsistency. NASA, on the other hand, utilized stray light, very low 560-nm water-leaving radiance Lw (560 nm), and navigation fail flags.
Regarding the data derived from the site BB-AERONET-OC, as mentioned above the Lwn-IOP (Lee et al., 2011) approach was considered to correct for the anisotropy of the water-leaving radiance (Zibordi et al., 2022; Cazzaniga and Zibordi, 2023). In contrast, AC algorithms currently consider different approaches for bidirectional effects. The OLCI “Standard NN” product is a directional water-leaving reflectance not corrected for bidirectional effects (EUMETSAT, 2021), as well as “ACOLITE/DSF”. Meanwhile, POLYMER and SeaDAS l2gen products are already corrected for bidirectional effects as described in Steinmetz et al. (2011) and Bailey et al. (2010).
The assessment of each AC algorithm was performed through linear regression analyses between in situ measurements and satellite Lwn(λ) estimates, and their goodness-of-fit was evaluated through the root mean-square error (RMSE, Eq. (3)), the normalized mean absolute error (NMAE, Eq. (4)), and the Bias (Eq. (5)).
where x is Lwn(λ) measured in situ, y the satellite estimated and n the number of match-ups.
2.5 Spatial and temporal variability of OWTs membership
A continuous monitoring of a significant storm event in the estuary was possible in March 2022, since OLCI captured scenes of pre- and post-storm conditions. A cyclone with tropical characteristics influenced the central region of Argentina and particularly the southwest part of Buenos Aires province during March 24–26th, 2022. The Bahía Blanca area was particularly affected by heavy rains within a cumulative rainfall of 120 mm in 48 h, and powerful hurricane-force winds blowing from the southwest sector during the storm passage. Daily atmospherically corrected OLCI data, were used to monitor the impact of wind and storm events on OWT variability. Due to the heavy cloud coverage during the storm event, only four clear-sky images were available to compare spatial-temporal variations of computed OWTs maps before the event (March 22–23th) to those after (March 27–28th) the storm.
Wind speeds and directions, coincident with the BB-AEROENT-OC sampling period were recorder at the meteorological station Comandante Espora, Bahía Blanca (−38.733 S; −62.167 W, https://www.meteobahia.com.ar/index.php?estacion=Bahia%20Blanca%20(Espora)). The station is equipped with a wind sensor positioned 10 m above the surface, recording wind intensity (m s-1) and direction at a 2-minute frequency. To characterize wind speeds, we considered the arithmetic mode 24 h before the AERONET-OC acquisition date and time.
On the other hand, to analyze the long-term statistical distribution of each OWT, all available daily OLCI Lwn data collected between 2016 and 2023 were associated with the five optical OWTs. Subsequently, the most frequent OWTs observed for each pixel over the OLCI time period were mapped.
3 Results
3.1 In situ Rrs spectra of contrasting waters from estuarine, coastal and mid-outer shelf environments
All Rrs(λ) spectra collected in situ between 2017 and 2023 with a hand-held spectroradiometer, were grouped and their mean ± standard deviation values were plotted (Figure 2) according to the location of sample collection: estuarine, coastal, and mid-outer shelf environments (maps in Figure 2A). These spectra show a wide range of signal amplitudes and shapes across the region mirroring the large variability in types and concentration of optically significant compounds present in these waters.
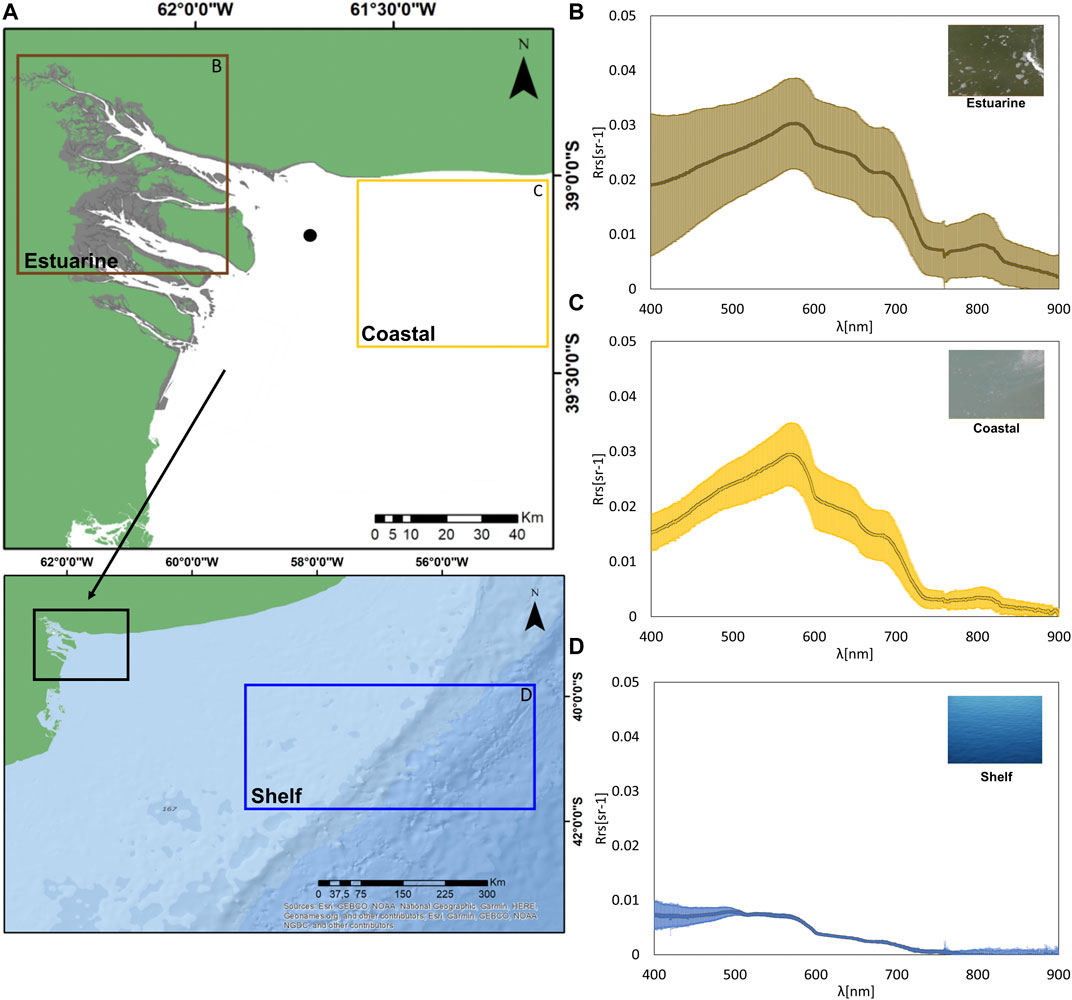
Figure 2. Radiometric remote sensing reflectance (Rrs (λ)) spectra obtained in cruise campaigns (2017–2023) from (A) Estuarine (<10 m depth (z), brown square), (B) Coastal (10 m < z < 50 m, yellow square) and (C) Shelf waters (z > 50 m, blue square). Note that (B−D) figures are not in the same scale. The black dot represents the position of the BB-AERONET-OC site. The solid line stands for the mean values and the colored area for the standard deviation of the Rrs (λ).
The Rrs(λ) spectra obtained in the estuarine environment (Figure 2B) correspond to a shallow and turbulent water column, with the highest turbidity values and variations of the study area. These Rrs(λ) spectra vary over a wide range of magnitudes and spectral shapes, but a common pattern is that values sharply increase over the blue and green regions of the spectrum, with a strong reflectance peak around 570 nm, and then a moderate decrease in magnitude over the red domain. The Rrs depression around 670 nm may be caused by the maximum absorption of Chl-a, while the small Rrs peaks around 680 nm can be attributed to the Chl-a fluorescence peak. A clear Rrs maximum appears at 800 nm, that is characteristic of highly turbid waters with high SPM concentrations (Doxaran et al., 2002).
In contrast, Rrs(λ) data from clear waters of the mid-outer shelf (Figure 2D) present the lowest Rrs(λ) values and relatively flat spectra, in accordance with the low concentration of optically significant components, a typical attribute of blue waters. These curves exhibit maximum reflectance values in the blue part of the visible spectrum and the lowest in the red, but Rrs values are comparatively lower than those observed in coastal and estuarine waters. These spectral curves show a wide plateau between 500 and 570 nm, and do not show any absorption valley or fluorescence peak around 670–680 nm. Rrs values are negligible for longer wavelengths.
In an intermediate position, spectral curves obtained in the coastal region out of the estuary (Figure 2C) have a typical reflectance peak at 570 nm, the depression around 670 nm, and a fluorescence peak around 680 nm can be also observed, but all these features appear to be diminished when compared with estuarine waters. The reflectance peak at 800 nm and Rrs values at longer wavelengths at not negligible, but their magnitudes are much lower than those in estuarine waters, suggesting a minor contribution of SPM to the signal.
3.2 Optical water type classification
Five different OWTs were depicted across the wide range of oceanographic conditions in the area, including Rrs spectra obtained in the mid-outer shelf. Figure 3A displays the averaged normalized Rrs spectra, resampled to OLCI bands, obtained for each OWT, based on the field measurements previously considered in Section 3.1. Figure 3B−F present a synoptic overview of optically active constituents (concentrations of Chl-a and SPM) and inherent optical properties (aph (443), anap (443) and acdom (443)) estimated from water samples corresponding to each class.
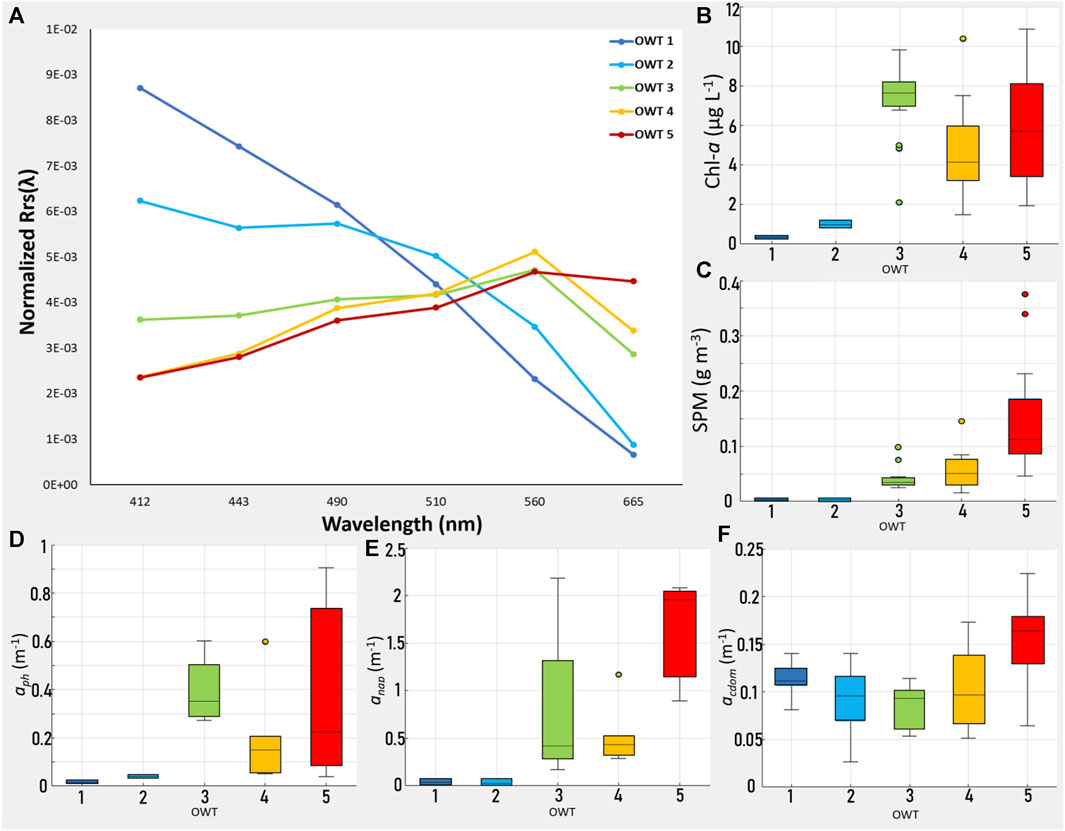
Figure 3. (A) Averaged normalized (Rrs (λ)) spectra corresponding to the OWTs; box plots illustrating the distribution of Chl-a (μg L−1, (B), SPM (g m−3, (C), aph (443, m-1; (D), anap (443, m-1; (E), acdom (443, m-1; (F).
Waters belonging to OWTs 1 and 2 present the typical spectral shapes of oligotrophic and mesotrophic shelf waters with minimum turbidity values (SPM concentrations from 8.60E-04 to 1.57E-03 g m−3). All samples in these classes were collected in the mid-shelf and shelf break, out of the coastal zone and the estuarine influence. Both OWTs present higher values in the blue portion of the spectrum and it is in agreement with the low Chl-a concentrations (both classes ranging from 0.36 to 1.19 μg L−1), small values of aph (443) (0.009–0.03 m-1) as well as anap (443) (0.007–0.01 m-1).
The averaged normalized spectrum for OWT 3 has lower reflectance values in the blue, with a plateau between 490–510 nm, and a relatively small peak around 560 nm. Most samples that belong to this class were collected in the coastal zone, out of the estuarine area, but there are also 16 samples collected in the middle section of Canal Principal. OWT 3 characterizes mesotrophic waters with and intermediate turbidity, with Chl-a concentrations ranging 2.10–9.82 μg L−1 and higher absorption of phytoplankton and NAP (aph (443) 0.27–0.6 m-1; anap (443) 0.17–2.18 m-1), compared to OWTs 1 and 2.
OWTs 4 and 5 corresponded to turbid and highly turbid waters, and all samples in these types were collected within the Bahía Blanca Estuary. Both classes present a reflectance peak at 560 nm and similar Chl-a concentrations, ranging from 2.85 to 10.36 μg L−1. A major difference is that OWT 5 presents a higher reflectance at 665 nm, related with more turbid conditions and a higher concentration of suspended materials that enhance particulate backscattering. Waters belonging to the OWT 4 have SPM concentrations and anap ranging from 0.016 to 0.145 g m-3 and 0.28 to 1.16 m-1, respectively, while in waters in OWT 5 SPM and anap varied from 0.046 to 0.375 g m-3 and 0.9 to 2.07 m-1, respectively. The absorption of CDOM presented low and similar values through the five classes depicted.
Restricting the analysis to samples collected within estuarine and coastal waters, in a radius of 100 km around the BB-AERONET-OC (n = 129), we explored the association of the available biochemical and bio-optical parameters to better characterize the OWT that may be found at the site. On average, the highest Chl-a concentrations along with lowest concentrations of SPM characterized the OWT 3. At the opposite end, OWT 5 has the highest SPM concentrations, but a large variability in Chl-a is observed. Considering the Chl-a/SPM ratio (Figure 4A), the largest values corresponded to OWT 3 (2.06 × 10⁻¹), while OWT 5 presented the lowest ratio (4.96 × 10⁻²), suggesting that phytoplankton (pigmented particles) would not have a significant contribution to the SPM in OWT 5. Considering the covariation between Chl-a and SPM concentrations (Figure 4C), the strongest correlation was observed in OWT 3 (R2 = 0.56) compared to OWT 4 and 5 (R2 = 0.14 and 0.027, respectively), emphasizing the idea of a strong contribution of phytoplankton to the particulate material in OWT 3. On the opposite, the complete lack of a positive correlation between Chl-a and SPM concentrations in OWT 5 are indicative of an allochthonous origin for the particulate material, either mineral sediments or detrital matter derived from sources other than phytoplankton. Also, a strong positive linear correlation was obtained between anap and SPM (Figures 4B, D) in OWT 3 (R2 = 0.91), suggesting that detrital material, possibly derived from phytoplankton, may also have a significant contribution to the SPM.
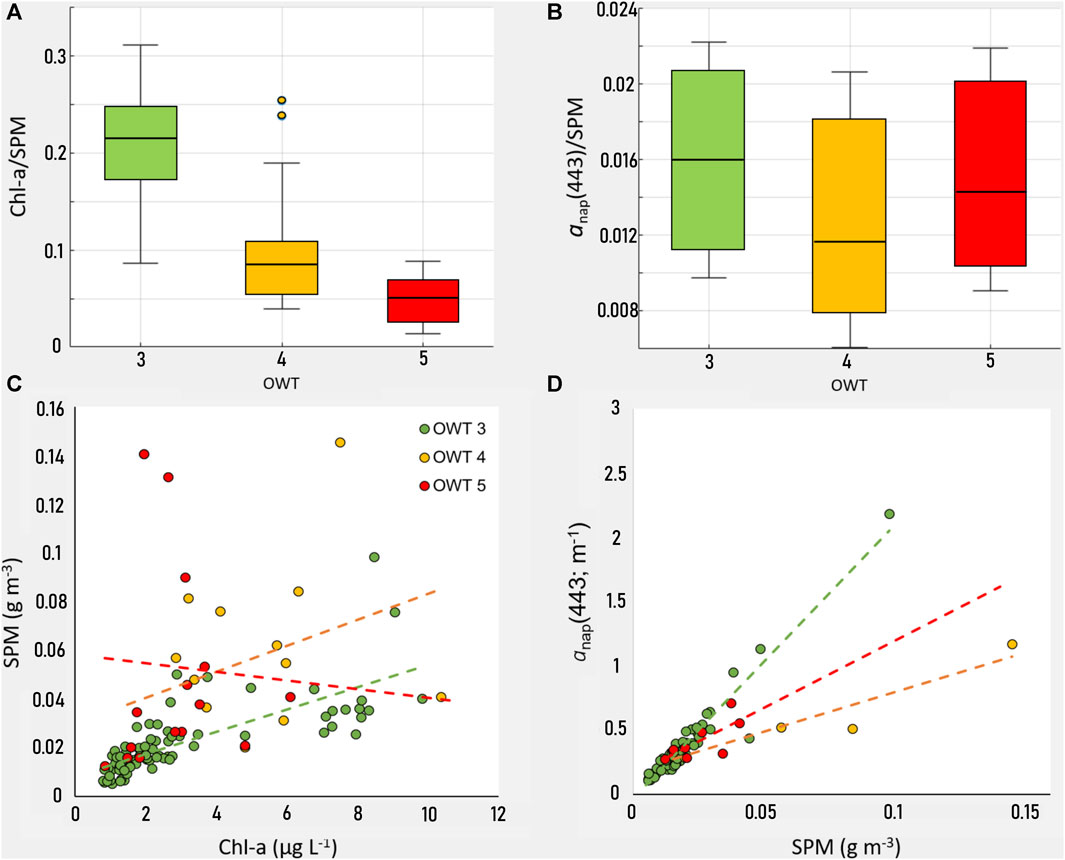
Figure 4. Boxplot distribution of coastal OWTs regarding their Chl-a/SPM ratio (A) and anap (443)/SPM ratio (B) Scatter plots of Chl-a vs. SPM (C) and SPM vs. anap (443) (D). The colors indicate the OWT: OWT 3, in green, OWT 4, in yellow, and OWT 5 in red.
3.3 Validation of OLCI (Sentinel 3A-B) Lwn(λ)
Scatterplots comparing in situ Lwn(λ) measurement derived from the BB-AERONET-OC site and OLCI (Sentinel 3A-B) Lwn(λ) is presented in Figure 5. For all the AC schemes considered, the number of match-ups generated was 34, with the exception of the ‘SeaDAS’ algorithm, that only generated 30 match-ups. Overall, the “Standard NN” presented the most accurate results, with the highest coefficients of determination (R2) at 443 (0.32), 490 (0.5), 510 (0.55), and 560 (0.52) nm. It also presented the lowest bias at every band, with estimated Lwn(λ) values closer to the 1:1 line. For all AC schemes, large uncertainties were observed in the blue bands (412 and 443 nm), with RSME >0.29 mW cm-2 sr−1 μm-1, but better precisions were attained at longer wavelengths.
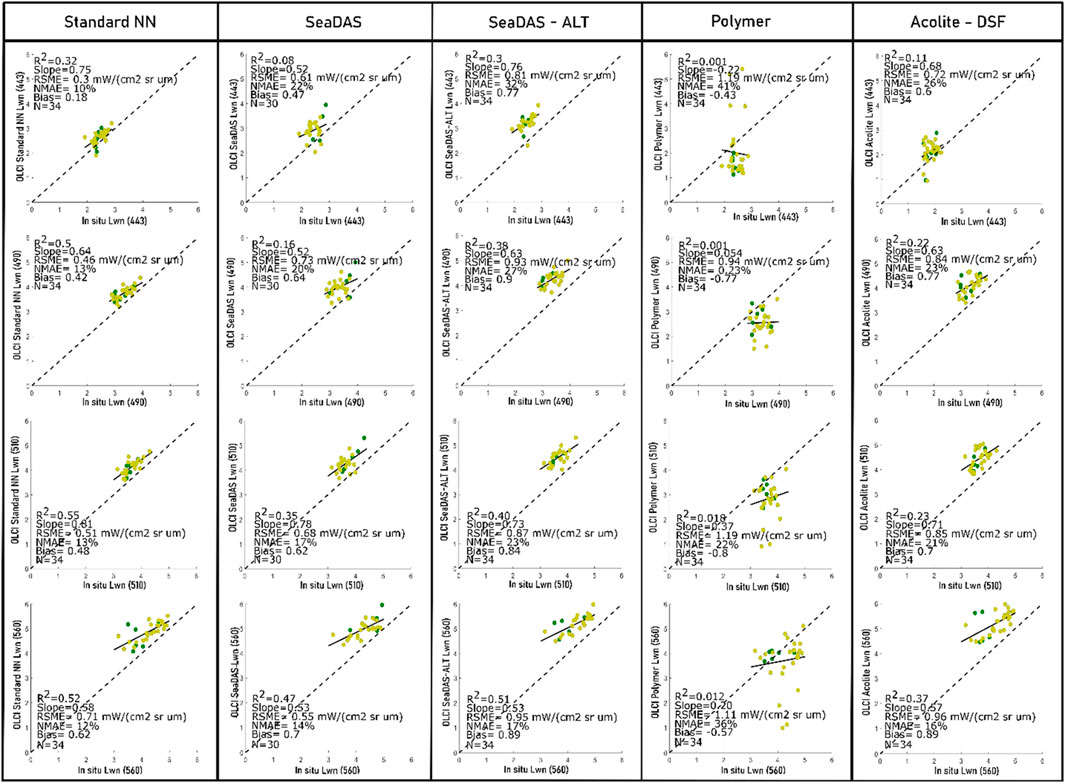
Figure 5. Scatterplots of the match-up exercise of the atmospheric correction algorithm (AC) retrieval and the in situ Lwn (443, 490, 510, 560 nm). Colors indicate the OWT: OWT 3 in green, OWT 4 in yellow.
At 412 nm, the “Standard NN” presented the lowest RSME (0.29 mW cm2 sr µm)–1 and NMAE (12%) (Supplementary Figure S2, Supplementary Material). Similar results were obtained with the l2gen processor whose performance was relatively intermediate (RSME: 0.51 and 0.73, and NMDE: 24 and 38 at 412 nm for “SeaDAS” and “SeaDAS-ALT”, respectively). Results from “SeaDAS”, “SeaDAS-ALT” and “ACOLITE-DSF” were similar, with a slight tendency to overestimation in all cases. In the case of blue-green bands, overestimation resulted in large biases, NMDEs and offsets (Figure 5). POLYMER consistently underestimated Lwn (λ) with negative biases and lower coefficients of determination. It has to be noted that POLYMER performance improved at 510, 560, and 665 nm, but large RSMEs and NMAEs, as well as larger dispersion were observed when compared to the operational algorithm (Figure 5).
3.4 Spatial and temporal variability of Rrs(λ) and OWTs in the study area
Rrs(λ) values derived from all the Lwn(λ) measured at the site BB-AERONET-OC, from January 2020 to May 2023 are displayed in Figure 6A. The spectra exhibit typical features of coastal turbid waters, with a peak at 560 nm indicating the minimum absorption of Chl-a and dispersion by inorganic particles and non-algal particulate matter. Rrs (560) derived from Lwn(λ) varied from 0.0153 to 0.0292 sr−1 with an average value of 0.0232 ± 0.0020 sr−1 (Figure 6A). There was a good agreement in shape and magnitude between the spectral curves obtained with the hand-held spectroradiometer in the area around the Mareograph Tower and values measured at the site BB-AERONET-OC.
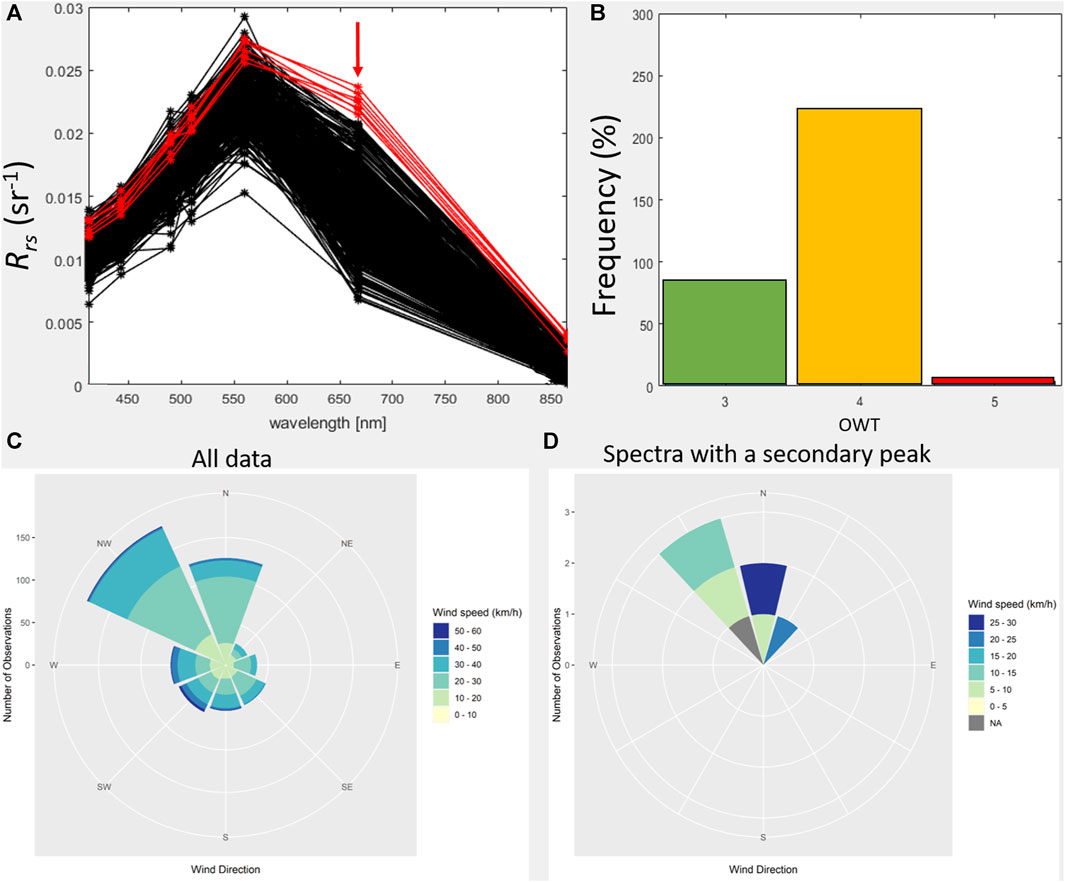
Figure 6. SeaPRISM-measured remote sensing reflectance (Rrs) spectra in AERONET-BB site (A) and frequency distribution of the depicted OWTs (B). (C) Climatological wind conditions (2003–2023) and (D) 24 h s wind conditions for the Rrs spectra in red.
According to the classification of all spectra collected at the site, OWT 4 was the most frequent OWT (73.72% of the observations), followed by OWT 3 (24.74%) and OWT 5 was the less frequent (1.53%, Figure 6B). It was also noted that in 7 out of the 392 valid spectra analyzed, a secondary peak appeared at 667 nm that typifies the OWT 5 (Figure 6A, red spectral lines). The common feature for these samples was a prevalence of northwest winds in the area (Figure 6D).
Remote sensing applications provide an effective approach to monitor water quality conditions over large coastal systems to support the tracking of sediment re-suspension and transport along transitional zones. The significant storm event registered in the estuary had a short duration but strong wind speeds (>60 km h-1; Figure 7A).
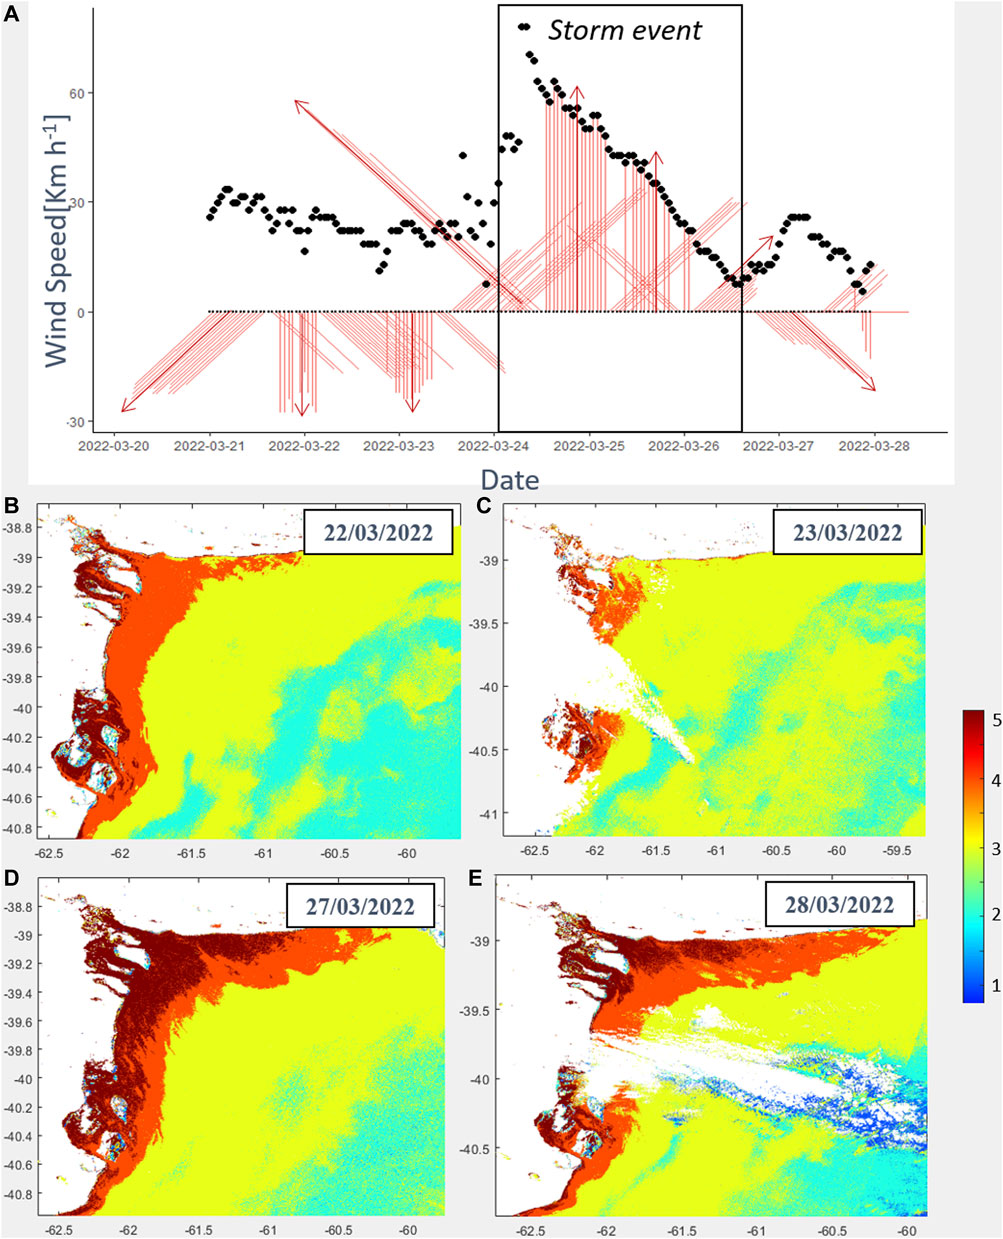
Figure 7. Hourly variation of wind speed (black dots) and direction (red arrows) in response to a storm that occurred in March 2022 (A). Spatial distribution of each OWTs during pre-storm (March 22nd and 23th, 2022) (B, C) and post-storm (March 27th and 28th, 2022) (D, E) conditions in the study area.
Figure 7 presents the distribution of each OWT before (B-C) and after (D-E) the storm passage in the study area. Under regular wind conditions before the storm OWT 3 and 4 dominated the mouth of Canal Principal and the coastal zone next to the estuary. In these conditions, OWT 5 only appeared in the inner zone of Canal Principal and the major channels to the south. The lack of data in the image corresponding to March 23th might respond to the cloud coverage at the beginning of the storm. Also, the prevalent wind direction suddenly changed to the south, what may have caused the observed difference in the extension of OWT 4 between March 22 and 23th. During the storm, wind speeds significantly augmented, causing resuspension in the shallower inner section of major channels, causing a large increase in the suspended load. Run-off during the storm may have also contributed sediments from terrestrial sources to the estuary. After the storm, sustained northwest winds aided to the outflow of these suspended materials and their export off the estuarine area. The remote sensing mapping post-storm revealed that the region was under extremely turbid conditions as it is shown by the wide distribution of the OWT 5 along the whole estuarine system and their extension towards the open coast.
To provide a synthetic overview of the regional long-term pattern of OWTs distribution in the coastal zone, Figure 8 illustrates the most frequently observed OWT for each OLCI pixel over the period 2016–2023. A general transitional gradient is evident from the estuary to the adjacent coastal shelf, with OWT 5 dominating estuarine waters, while OWT 3 characterizes the coastal region out of the estuarine influence. The transitional region among those OWTs, which includes the location of the BB-AERONET-OC, can be described by the OWT 4.
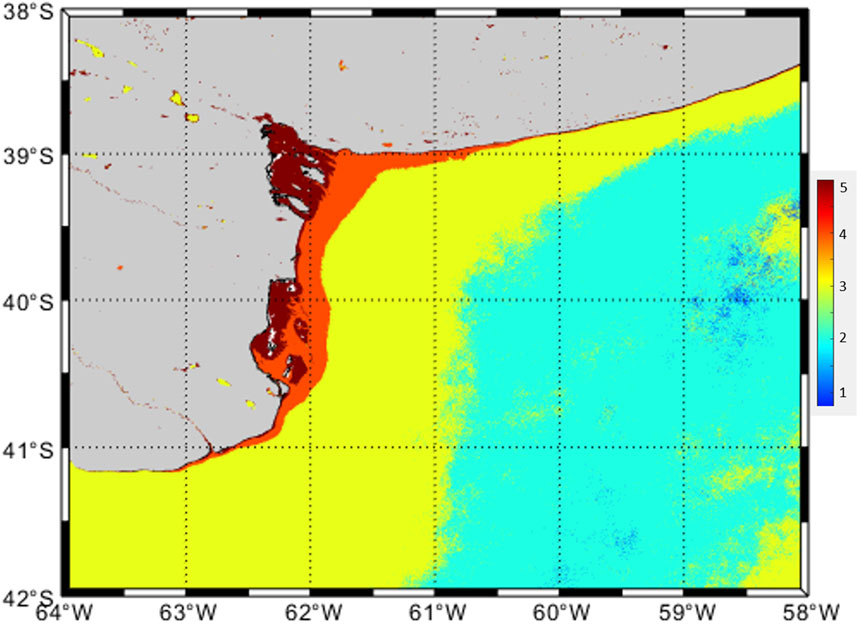
Figure 8. Distribution of the most frequent OWTs considering daily OLCI data between 2016 and 2023.
4 Discussion
Coastal waters share common features and represent the interface between terrestrial environments and open oceans (Spyrakos et al., 2018; Botha et al., 2020). The Rrs(λ) curves presented here showed typical spectral of complex waters, with intermediate to high levels of turbidity, and where the spectral characteristics are dominated by optically significant constituents other than phytoplankton. The backscattering of suspended particles tend to produce a flat spectrum increasing water reflectance from the blue wavelengths through the NIR region, but the distinct absorption of the different components produces the large variety of spectral curves presented here. In this context, OWTs represent snapshots of the continuum of these optical conditions (Moore et al., 2014). We identified water types adopting the same methodological approach presented in Tran et al. (2023), which was developed based on a globally distributed database of Rrs(λ) of contrasting waters of coastal areas. In the present work, we used our site-specific radiometric data and the associated optical properties and biochemical determinations obtained from water samples in coastal and transitional areas surrounding the BB-AERONET-OC site to explore their OWT membership. Thus, they represent locally more refined indicators of water quality.
4.1 The optical water types and Rrs(λ) of the BB-AERONET-OC site
In our study area, there was a large bio-optical and biogeochemical variability among regions, as a function of the anap,, SPM, and Chl-a concentrations derived from field samples. On average, in the inner portion of the estuary, SPM concentration was approximately 50 times higher, and Chl-a was 1.2 times higher, compared to samples obtained in the inner shelf. Our results are in line with those reported in the North Sea, where there were two orders of magnitude of variation in SPM and Chl-a concentrations when the coastal zone was compared with the open marine environment (Babin et al., 2003; Astoreca et al., 2012). According to the supervised classification applied to our regional hyperspectral dataset of normalized Rrs(λ) spectra, water types present a full range of variations from estuarine and coastal waters to open waters in the mid shelf and shelf break. OWTs 3 to 5 characterize waters within the Bahía Blanca Estuary and the coastal area under its influence, while OWTs 1 and 2 define waters from the mid-shelf and the shelf-break, where IOPs primarily depend on the phytoplankton contributions and those optically significant constituents covarying with Chl-a concentrations.
Regarding the area around the BB-AERONET-OC, across the transition between the estuary to the coastal zone, large differences in Rrs(λ) magnitude, especially in the blue and red domains reflect differences in the concentrations of SPM that characterize different sections of the system, from the extremely turbid and eutrophic conditions of the inner estuary, where waters classify OWT 4 and 5, through more diluted waters near the mouth of Canal Principal, at the site itself, where OWT 4 is the dominant type, but OWT 3 is also present almost 25% of the time. In the coastal zone out of the estuarine influence, waters classified as OWT 3. Rrs(λ) spectra have a generally lower magnitude, still mirroring the presence of significant loads of suspended materials, but diminished in magnitude, and a less pronounced fluorescence peak. This agrees with less turbid and mesotrophic conditions of the inner-shelf (Delgado et al., 2019). Within the estuary, the resuspension and transport of suspended loads through Canal Principal is largely induced by winds (Arena et al., 2022) suggesting their large influence in determining the temporal variations of optical properties at the site BB-AERONET-OC. Comparing our results with different AERONET-OC sites (from 2020 to the present), OWT 4 was not observed or less frequent in other regions. For instance, at the LISCO site (Long Island Sound Coastal Observatory, NY, United States of America) the dominant type was OWT 3 (95.83%), while OWT 4 had a low frequency (4.16%). Similarly, the AERONET-OC site, in a platform off the coast of Venice (Italy) presented a dominance of OWT 3 (80% of the observations), followed by OWT 2 (19.57%) and the OWT 1 was the less frequent (0.34%). Finally, the AERONET-OC site located in Lucinda Bay (northeast Australia) was also dominated by OWT 3 (95.34% of the observations) followed by OWT 2 (4.64%).
The SPM contains all organic and mineral material above 0.5–0.7 µm, which can be present as particulate organic carbon (POC), including autotrophic and heterotrophic organisms, and detritus (organic particles), or as inorganic carbon (PIC) which comes mainly from carbonates (Loisel et al., 2009). Around the site, many differences in the spectral shape of Rrs(λ) may derive from the relative contribution of phytoplankton to the SPM budget, as shown by the Chl-a/SPM ratio. This was also observed in other coastal environments where different classification approaches were considered for determining OWTs (e.g Lubac and Loisel, 2007; Vantrepotte et al., 2012; Hieronymi et al., 2017; Wei et al., 2022; Hieronymi et al., 2023). For instance, Lubac and Loisel (2007) explored the mechanisms of variation on Rrs(λ) spectra along the eastern English Channel and southern North Sea, covering a wide range of in-water bio-optical properties. They conclude that POC/SPM ratio progressively increase from class 1 (where POC is dominated by phytoplankton) to class 5 (dominated by mineral particles). For instance, OWT 5, that dominates in the inner estuary, has the lowest Chl-a/SPM ratio, and the lowest correlation between anap and SPM, suggesting a dominance in the contribution of inorganic sediments (Babin et al., 2003).
The opposite situation was observed in the OWT 3, the only water type presents out of the estuarine influence, where phytoplankton seems to be dominant in the SPM composition, and their degradation products may contribute to a large anap - SPM correlation. Although data on POC and PIC concentrations are missing in our analysis, previous work (Arena et al., 2019) suggest that within the inner section of Canal Principal (dominated by OWT 5), turbidity is mainly promoted by fine silts and clays, from resuspension processes and transport over the intertidal and subtidal flats. According to the results presented here, the source of turbidity would progressively change to phytoplankton biomass and their degradation products to the coastal region out of the estuary (OWT 3), as suggested by the highest Chl-a/SPM ratio and strongest correlation between anap and SPM.
4.2 Validation of AC algorithms
Highly dynamic environments, such as the Bahía Blanca Estuary and the shallow coastal waters of our study area, become a challenge for AC purposes due to the presence of contrasted water masses, ranging from clear to very turbid environments, in response to rapid changes linked to several geomorphological, oceanographic and meteorological settings (Miller et al., 2011). In addition, narrow and restricted water bodies, different radiometric signals tend to overlap on the same subset, printing sharp transitional areas among OWTs and their effects cannot be treated separately. Overall, for the water and atmospheric conditions observed at the site BB-AERONET-OC, the operational product (“Standard NN”) showed good agreement with the in situ measurements. We tested different AC approaches where in general, the accuracy of Lwn retrievals had an increasing performance towards longer wavelengths (560–865 nm), with large uncertainties over blue bands likely affected by the presence of atmospheric absorbing aerosols that algorithms could accurately differentiate (Wei et al., 2018). Overestimations of Lwn at blue bands correlated with underestimations of the aerosol optical depth at 865 nm (Zibordi et al., 2018). According to the distribution of Ångström Exponent observed in our study area, we found a predominance of small size aerosol particles (Supplementary Figure S1, Supplementary Material). Specifically, algorithms based on the usage of two-band iterative approaches, as the case of “SEADAS” and “SEADAS-ALT”, might be affected by the presences of fine mode aerosols greatly impact the signal in the blue and become transparent with increasing wavelength, i.e., optical thickness rapidly decreases with wavelength making this AC methods more error-prone in the blue bands due to the insufficient extrapolation of the aerosol contribution from NIR bands to the visible (Frouin et al., 2019; IOCCG, 2020).
In the study area, POLYMER showed a poor performance in retrieving Lwn(λ). This algorithm relies on a spectral optimization approach and uses the whole spectral range to decouple the atmospheric and surface components based on bio-optical models that might be unable to represent higher reflectance in highly turbid waters (Mogran et al., 2019; Vanhellemont and Ruddick, 2021) resulting in an underestimation of Lwn(λ). In addition to this, Lain et al. (2014) addresses that the assumptions made in the in-water model used in POLYMER may not be suitable for eutrophic waters, where different IOP models produce contrasting outputs with varying phytoplankton concentrations. Similarly, POLYMER tended to underestimate the Rrs of turbid inland and coastal waters (see Liu et al., 2021 and references therein). The underestimations are partially caused by the bio-optical model in POLYMER that seems not suitable for optically complex waters, in which particulate and CDOM absorptions do not covary with chlorophyll concentration. The lower performance might also be caused by complex aerosols (Liu et al., 2021). The Ångström coefficient of aerosol in POLYMER is assumed to be 1, whereas the coefficient can vary in our study area between 0–1.8 with a median of 0.76 indicating that small size aerosol particles are present.
Nevertheless, validations performed in medium-turbid environments, reported better estimations for this algorithm than in the present work (e.g. Alikas et al., 2020; Li et al., 2022). Our results agree with those found by Vanhellemont and Ruddick (2021), who presented a poor performance of POLYMER in Belgian coastal waters, meanwhile the “Standard NN” OLCI product performed relatively well.
The significant underestimations of Lwn(λ) resulted from “ACOLITE-DSF” in the study area, might be attributed to the fact that this algorithm does not perform a pixel-by-pixel AC. Instead, a homogeneous atmosphere is assumed over the entire sub-scenes, and its relatively poor performance could be due to variations of the aerosol type across the estuary and the lack of “dark pixels” in the area (Supplementary Figure S1, Supplementary Material). This algorithm has been previously tested in L8-OLI scenes of the Bahía Blanca Estuary using BB-AERONET-OC measurements of Lwn(λ) and it was concluded that the use of a spatially invariant aerosols defined for the whole scene would not be appropriate for this study area (Arena et al., 2021; 2022).
In line with our results, previous works reported a good performance of the operational AC OLCI product (“Standard NN”) for most part of the spectrum in case-2 waters (Tilstone et al., 2021; Vanhellemont and Ruddick, 2021; Windle et al., 2022). One of the reasons could be that the improvements made in reprocessed OLCI Collection 3, including updates to system vicarious calibration gains, bright pixel correction, cloud masking, flags and whitecap correction (Frouin et al., 1996; Stramska and petelski, 2003; Wang and Shi, 2006), resulted in retrievals more suitable for coastal areas (Zibordi et al., 2022). Finally, we consider our dataset representative enough to conclude that the operational product of OLCI can be applied without major disturbances and avoiding negative retrievals along the transitional waters (OWT 3 and 4) of the BB-AERONET-OC site.
4.3 Variability of OWT and Rrs(λ) in the BB-AERONET-OC site related to hydrometeorological conditions
Coastal regions are highly susceptible to optically complex waters conditions as consequence of their proximity to the land and adjacent highly urbanized areas (e.g. runoff of sediments, nutrients and organic matter) and also are under the influence of wind-induced flow patterns causing re-suspension of shallow bottom sediments. The use of optical classification schemes in coastal environments are a powerful tool for the pre-processing of Rrs(λ) spectra as a previous step to obtain optimized bio-optical algorithms (Lubac and Loisel, 2007; Le et al., 2011; Vantrepotte et al., 2012; Tran et al., 2023). Monitoring the variability of OWTs can also help to differentiate the environment and choose the most suitable algorithm for the given environmental conditions (Moore et al., 2014). In this work, we were able to describe the spatial distribution and variability for each OWT detected in the study area with validated OLCI Lwn(λ) images.
During the analyzed storm event, wind speeds significantly increased, with prevalent wind directions from the south producing resuspension in the shallower inner sections of major channels in the Bahía Blanca Estuary, increasing the suspended load over those areas. Before the storm the Rrs(λ) spectra derived from the BB site in the red and NIR part of spectrum presented values of 7.28 10−3 ± 1.20 10−3 sr−1 and 3.44 10−4 ± 2.38 10−4 at 667 and 865 nm respectively). After the storm, sustained northwest winds aided to the export of suspended sediments through the mouth of these major channels, including Canal Principal, where the BB-AERONET-OC site is located. During this period the Rrs(λ) maximum values in the red and NIR part of the spectrum peak around 2.11 10−2 ± 1.61 10−3 sr−1 at 667 and 3.81 10−3 ± 9.42 10−4 sr−1 at 865. The post-storm OWTs map revealed that the region was under extremely turbid conditions as it is shown by the wide distribution of the OWT 5, covering the entire estuarine system and the adjacent coastal area. The large differences observed before and after the storm reveal the strong variability in the temporal distribution of the OWTs and their association with re-suspended solids induced by hydro meteorological forcing, as well as sediment inputs via run-off.
5 Conclusion
The relevance of turbid waters outflowing the Bahía Blanca Estuary has been previously suggested by several authors as a major influence over the adjacent inner-shelf. This finding was supported by hydrographic and biological evidence (Delgado et al., 2015; Delgado et al., 2017). Arena et al. (2022) also concluded that turbidity, at the mouth of Canal Principal, mainly responds to winds that control sediment resuspension and export. Thus, winds would be critical for the sedimentary budget of the estuary and could explain the high turbidity values observed in the adjacent region. This study represents the first one describing the OWT variability around the AERONET-OC site, allowing for better characterization of the bio-optical environment of this site, which is useful by itself but also for further applications of OWT based bio-optical algorithms. According to the classification of all spectra collected at the BB-AERONET-OC site, OWT 4 was the most frequent water type (73.72% of the observations), followed by OWT 3 (24.74%) and OWT 5 was the less frequent (1.53%). In the present study, the “Standard NN” product of OLCI performed well across coastal transitional waters (OWT 3 and 4) of the BB-AERONET-OC site. The classification applied to OLCI scenes over the AERONET-BB site showed an alternance of multiple water types at the AERONET-BB site and a large spatial variability as result of hydrometeorological variations, emphasizing the optical complexity of the site. The typically turbidity of these waters and large variability makes the BB site distinctive among the different AERONET-OC stations, providing exceptional opportunities for the validation of atmospheric correction algorithms.
Data availability statement
The original contributions presented in the study are included in the article/Supplementary Material, further inquiries can be directed to the corresponding author.
Author contributions
MA: Data curation, Formal Analysis, Investigation, Methodology, Writing–original draft, Writing–review and editing. PP: Funding acquisition, Supervision, Writing–review and editing, Conceptualization. HL: Funding acquisition, Project administration, Resources, Supervision, Writing–review and editing, Conceptualization, Methodology. MT: Data curation, Investigation, Methodology, Writing–review and editing. DJ: Data curation, Methodology, Writing–review and editing. AD: Funding acquisition, Project administration, Supervision, Validation, Writing–review and editing, Conceptualization.
Funding
The author(s) declare financial support was received for the research, authorship, and/or publication of this article. The authors would like to thank the Consejo Nacional de Investigaciones Científicas y Técnicas (CONICET) for their financial support. This research was done in the frame of CO2BAHIA project founded by the ECOS2020 initiative (Programa de Cooperación Científico-Tecnológica entre el Ministerio de Ciencia, Tecnología e Innovación de la República Argentina, MNCyT, y ECOS-Sud de Francia), of ANR CO2COAST project (Grant Nos. ANR-20-CE01-0021), of PICT2020-Serie A-02309 founded by the Agencia Nacional de Promoción de la Investigación, el Desarrollo Tecnológico y la Innovación and of “B8” Pampa Azul (MNCyT). The present research was carried out within the framework of the activities of the Spanish Government through the “María de Maeztu Centre of Excellence” accreditation to IMEDEA(CSIC-UIB) (CEX 2021-001198-M). A.L. Delgado acknowledges funding by an individual postdoctoral fellowship “Vicenç Mut” (PD/002/2022) from Govern de les Illes Balears and Fondo Social Europeo.
Acknowledgments
We specially thank the Cámara de Pescadores Artesanales de Monte Hermoso y Pehuén Co (Eduardo Flores and Juancito) and the Consorcio del Puerto de Bahía Blanca for their valuable help, since the collection of in situ samples would not have been possible without their continual contribution. Finally, the authors would like to thank EUMETSAT for the freely distribution of OLCI-A and OLCI-B data, and the AERONET Team for processing and distributing the AERONET-OC data.
Conflict of interest
The authors declare that the research was conducted in the absence of any commercial or financial relationships that could be construed as a potential conflict of interest.
Publisher’s note
All claims expressed in this article are solely those of the authors and do not necessarily represent those of their affiliated organizations, or those of the publisher, the editors and the reviewers. Any product that may be evaluated in this article, or claim that may be made by its manufacturer, is not guaranteed or endorsed by the publisher.
Supplementary material
The Supplementary Material for this article can be found online at: https://www.frontiersin.org/articles/10.3389/frsen.2024.1305787/full#supplementary-material
References
Ahmad, Z., Franz, B. A., McClain, C. R., Kwiatkowska, E. J., Werdell, J., Shettle, E. P., et al. (2010). New aerosol models for the retrieval of aerosol optical thickness and normalized water-leaving radiances from the SeaWiFS and MODIS sensors over coastal regions and Open Oceans. Appl. Opt. 49 (29), 5545. doi:10.1364/ao.49.005545
Alikas, K., Ansko, I., Vabson, V., Ansper, A., Kangro, K., Uudeberg, K., et al. (2020). Consistency of radiometric satellite data over lakes and coastal waters with local field measurements. Remote Sens. 12 (4), 616. doi:10.3390/rs12040616
Arena, M., Delgado, A. L., Celleri, C., and Pratolongo, P. D. (2019). Preliminary assessment of spatial and short-term variability of bio-optical properties in a tidal dominated estuary (Bahía Blanca, Argentina). Regional Stud. Mar. Sci. 29, 100639. doi:10.1016/j.rsma.2019.100639
Arena, M., Delgado, A. L., Pratolongo, P., Celleri, C., and Vitale, A. (2021). “Validation of the atmospheric correction of Landsat OLI imagery and turbidity retrievals using AERONET-OC data from the Bahía Blanca site,” in 2021 XIX Workshop on Information Processing and Control (RPIC) (IEEE), 1–6.
Arena, M., Pratolongo, P., Delgado, A. L., Celleri, C., and Vitale, A. (2022). Spatial and temporal distribution of satellite turbidity in response to different environmental variables in the Bahía Blanca Estuary, South-Western Atlantic. Int. J. Remote Sens. 43 (10), 3714–3743. doi:10.1080/01431161.2022.2105175
Astoreca, R., Doxaran, D. A. V. I. D., Ruddick, K., Rousseau, V., and Lancelot, C. H. R. I. S. T. I. A. N. E. (2012). Influence of suspended particle concentration, composition and size on the variability of inherent optical properties of the Southern North Sea. Cont. Shelf Res. 35, 117–128. doi:10.1016/j.csr.2012.01.007
Babin, M., Stramski, D., Ferrari, G. M., Claustre, H., Bricaud, A., Obolensky, G., et al. (2003). Variations in the light absorption coefficients of phytoplankton, nonalgal particles, and dissolved organic matter in coastal waters around Europe. J. Geophys. Res. Oceans 108 (C7). doi:10.1029/2001jc000882
Bailey, S. W., Franz, B. A., and Werdell, P. J. (2010). Estimation of near-infrared water-leaving reflectance for satellite ocean color data processing. Opt. express 18 (7), 7521–7527. doi:10.1364/oe.18.007521
Bailey, S. W., and Werdell, P. J. (2006). A multi-sensor approach for the on-orbit validation of ocean color satellite data products. Remote Sens. Environ. 102 (1-2), 12–23. doi:10.1016/j.rse.2006.01.015
Bi, S., Hieronymi, M., and Röttgers, R. (2023). Bio-geo-optical modelling of natural waters. Front. Mar. Sci. 10, 1196352. doi:10.3389/fmars.2023.1196352
Botha, E. J., Anstee, J. M., Sagar, S., Lehmann, E., and Medeiros, T. A. (2020). Classification of Australian waterbodies across a wide range of optical water types. Remote Sens. 12 (18), 3018. doi:10.3390/rs12183018
Cazzaniga, I., and Zibordi, G. (2023). AERONET-OC L WN uncertainties: revisited. J. Atmos. Ocean. Technol. 40 (4), 411–425. doi:10.1175/jtech-d-22-0061.1
Delgado, A. L., Guinder, V. A., Dogliotti, A. I., Zapperi, G., and Pratolongo, P. D. (2019). Validation of MODIS-Aqua bio-optical algorithms for phytoplankton absorption coefficient measurement in optically complex waters of El Rincón (Argentina). Cont. Shelf Res. 173, 73–86. doi:10.1016/j.csr.2018.12.012
Delgado, A. L., Loisel, H., Jamet, C., Vantrepotte, V., Perillo, G. M., and Piccolo, M. C. (2015). Seasonal and inter-annual analysis of chlorophyll-a and inherent optical properties from satellite observations in the inner and mid-shelves of the south of Buenos Aires Province (Argentina). Remote Sens. 7 (9), 11821–11847. doi:10.3390/rs70911821
Delgado, A. L., Menéndez, M. C., Piccolo, M. C., and Perillo, G. M. E. (2017). Hydrography of the inner continental shelf along the southwest Buenos Aires Province, Argentina: influence of an estuarine plume on coastal waters. J. Coast. Res. 33 (4), 907–916. doi:10.2112/jcoastres-d-16-00064.1
Doxaran, D., Froidefond, J. M., Lavender, S., and Castaing, P. (2002). Spectral signature of highly turbid waters: application with SPOT data to quantify suspended particulate matter concentrations. Remote Sens. Environ. 81 (1), 149–161. doi:10.1016/s0034-4257(01)00341-8
EUMETSAT (2021). Sentinel-3 OLCI L2 report for baseline collection OL_L2M_003. https://www.eumetsat.int/media/47794.
Frouin, R., Schwindling, M., and Deschamps, P. Y. (1996). Spectral reflectance of sea foam in the visible and near-infrared: in situ measurements and remote sensing implications. J. Geophys. Res. Oceans 101 (C6), 14361–14371. doi:10.1029/96jc00629
Frouin, R. J., Franz, B. A., Ibrahim, A., Knobelspiesse, K., Ahmad, Z., Cairns, B., et al. (2019). Atmospheric correction of satellite ocean-color imagery during the PACE era. Front. Earth Sci. 7, 145. doi:10.3389/feart.2019.00145
GCOS (2011). Systematic observation requirements for satellite-based products for climate, 154. . Geneva: WMO GCOS Rep., 127. 2011 update.
Hieronymi, M., Bi, S., Müller, D., Schütt, E. M., Behr, D., Brockmann, C., et al. (2023). Ocean color atmospheric correction methods in view of usability for different optical water types. Front. Mar. Sci. 10, 1129876. doi:10.3389/fmars.2023.1129876
Hieronymi, M., Müller, D., and Doerffer, R. (2017). The OLCI neural network swarm (ONNS): a bio-geo-optical algorithm for open ocean and coastal waters. Front. Mar. Sci. 4, 140. doi:10.3389/fmars.2017.00140
Holben, B. N., Eck, T. F., Slutsker, I. A., Tanré, D., Buis, J. P., Setzer, A., et al. (1998). AERONET—a federated instrument network and data archive for aerosol characterization. Remote Sens. Environ. 66 (1), 1–16. doi:10.1016/s0034-4257(98)00031-5
Kirk, J. (2011). Light and photosynthesis in aquatic ecosystems. 3rd ed. Cambridge, UK: Cambridge University Press.
Lain, L. R., Bernard, S., and Evers-King, H. (2014). Biophysical modelling of phytoplankton communities from first principles using two-layered spheres: equivalent Algal Populations (EAP) model. Opt. express 22 (14), 16745–16758. doi:10.1364/oe.22.016745
Le, C., Li, Y., Zha, Y., Sun, D., Huang, C., and Zhang, H. (2011). Remote estimation of chlorophyll a in optically complex waters based on optical classification. Remote Sens. Environ. 115 (2), 725–737. doi:10.1016/j.rse.2010.10.014
Lee, Z. P., Du, K., Voss, K. J., Zibordi, G., Lubac, B., Arnone, R., et al. (2011). An inherent-optical-property-centered approach to correct the angular effects in water-leaving radiance. Appl. Opt. 50 (19), 3155–3167. doi:10.1364/ao.50.003155
Li, Q., Jiang, L., Chen, Y., Wang, L., and Wang, L. (2022). Evaluation of seven atmospheric correction algorithms for OLCI images over the coastal waters of Qinhuangdao in Bohai Sea. Regional Stud. Mar. Sci. 56, 102711. doi:10.1016/j.rsma.2022.102711
Liu, H., He, X., Li, Q., Hu, X., Ishizaka, J., Kratzer, S., et al. (2021). Evaluation of ocean color atmospheric correction methods for Sentinel-3 OLCI using global automatic in situ observations. IEEE Trans. Geoscience Remote Sens. 60, 1–19. doi:10.1109/tgrs.2021.3136243
Loisel, H., Mériaux, X., Poteau, A., Artigas, L. F., Lubac, B., Gardel, A., et al. (2009). Analyze of the inherent optical properties of French Guiana coastal waters for remote sensing applications. J. Coast. Res., 1532–1536.
Lubac, B., and Loisel, H. (2007). Variability and classification of remote sensing reflectance spectra in the eastern English Channel and southern North Sea. Remote Sens. Environ. 110 (1), 45–58. doi:10.1016/j.rse.2007.02.012
Martos, P., and Piccolo, M. C. (1988). Hydrography of the Argentine continental shelf between 38° and 42°S. Cont. Shelf Res. 8 (9), 1043–1056. doi:10.1016/0278-4343(88)90038-6
Miller, R. L., Liu, C. C., Buonassissi, C. J., and Wu, A. M. (2011). A multi-sensor approach to examining the distribution of total suspended matter (TSM) in the Albemarle-Pamlico estuarine system, NC, USA. Remote Sens. 3 (5), 962–974. doi:10.3390/rs3050962
Mitchell, B. G. (1990). Algorithms for determining the absorption coefficient for aquatic particulates using the quantitative filter technique, 1302. . Orlando, FL: SPIE, 137–148. Ocean optics X.
Mitchell, B. G., and Stramska, M. (2002). Determination of spectral absorption coefficients of particles, dissolved material and phytoplankton for. Ocean Opt. Protoc. Satell. ocean color Sens. validation Revis. 3, 231, 210004.
Mobley, C. D. (1999). Estimation of the remote-sensing reflectance from above-surface measurements. Appl. Opt. 38 (36), 7442–7455. doi:10.1364/ao.38.007442
Moore, T. S., Dowell, M. D., Bradt, S., and Verdu, A. R. (2014). An optical water type framework for selecting and blending retrievals from bio-optical algorithms in lakes and coastal waters. Remote Sens. Environ. 143, 97–111. doi:10.1016/j.rse.2013.11.021
Morel, A., and Prieur, L. (1977). Analysis of variations in ocean color 1. Limnol. Oceanogr. 22 (4), 709–722. doi:10.4319/lo.1977.22.4.0709
Mueller, J. L., Davis, C. O., Arnone, R. A., Frouin, R., Carder, K. L., Lee, Z. P., et al. (2003). Above-water radiance and remote sensing measurement and analysis protocols. Ocean Optics protocols for Satellite Ocean-color sensor validation, revision 4, vol. III: radiometric measurements and data analysis protocols. NASA Tech. Memo, 21162.
Neukermans, G., Ruddick, K., Loisel, H., and Roose, P. (2012). Optimization and quality control of suspended particulate matter concentration measurement using turbidity measurements. Limnol. Oceanogr. Methods 10 (12), 1011–1023. doi:10.4319/lom.2012.10.1011
Perillo, G. M. E., Piccolo, M. C., Palma, E. D., Pérez, D. E., and Pierini, J. O. (2004). Oceanografía física: ecosistema del estuario de Bahía Blanca, 61–67.
Piccolo, M. C., and Perillo, G. M. (1990). Physical characteristics of the Bahía Blanca estuary (Argentina). Estuar. Coast. Shelf Sci. 31 (3), 303–317. doi:10.1016/0272-7714(90)90106-2
Pratolongo, P., Piovan, M. J., Cuadrado, D. G., and Gómez, E. A. (2017). Coastal landscape evolution on the western margin of the Bahía Blanca Estuary (Argentina) mirrors a non-uniform sea-level fall after the mid-Holocene highstand. Geo-Marine Lett. 37 (4), 373–384. doi:10.1007/s00367-016-0480-4
Spyrakos, E., O'Donnell, R., Hunter, P. D., Miller, C., Scott, M., Simis, S. G., et al. (2018). Optical types of inland and coastal waters. Limnol. Oceanogr. 63 (2), 846–870. doi:10.1002/lno.10674
Steinmetz, F., Deschamps, P. Y., and Ramon, D. (2011). Atmospheric correction in presence of sun glint: application to MERIS. Opt. express 19 (10), 9783–9800. doi:10.1364/oe.19.009783
Stramska, M., and Petelski, T. (2003). Observations of oceanic whitecaps in the north polar waters of the Atlantic. J. Geophys. Res. Oceans 108 (C3). doi:10.1029/2002jc001321
Talone, M., Zibordi, G., and Lee, Z. (2018). Correction for the non-nadir viewing geometry of AERONET-OC above water radiometry data: an assessment of uncertainties. Opt. Express 26, A541–A561. doi:10.1364/OE.26.00A541
Thuillier, G., Hersé, M., Labs, D., Foujols, T., Peetermans, W., Gillotay, D., et al. (2003). The solar spectral irradiance from 200 to 2400 nm as measured by the SOLSPEC spectrometer from the ATLAS and EURECA missions. Sol. Phys. 214, 1–22.
Tilstone, G. H., Pardo, S., Simis, S. G., Qin, P., Selmes, N., Dessailly, D., et al. (2021). Consistency between satellite ocean colour products under high coloured dissolved organic matter absorption in the Baltic Sea. Remote Sens. 14 (1), 89. doi:10.3390/rs14010089
Tran, M. D., Vantrepotte, V., Loisel, H., Oliveira, E. N., Tran, K. T., Jorge, D., et al. (2023). Band ratios combination for estimating chlorophyll-a from sentinel-2 and sentinel-3 in coastal waters. Remote Sens. 15 (6), 1653. doi:10.3390/rs15061653
Vanhellemont, Q., and Ruddick, K. (2021). Atmospheric correction of Sentinel-3/OLCI data for mapping of suspended particulate matter and chlorophyll-a concentration in Belgian turbid coastal waters. Remote Sens. Environ. 256, 112284. doi:10.1016/j.rse.2021.112284
Vantrepotte, V., Loisel, H., Dessailly, D., and Mériaux, X. (2012). Optical classification of contrasted coastal waters. Remote Sens. Environ. 123, 306–323. doi:10.1016/j.rse.2012.03.004
Wang, M., and Shi, W. (2006). Cloud masking for ocean color data processing in the coastal regions. IEEE Trans. Geoscience Remote Sens. 44 (11), 3196–3105. doi:10.1109/tgrs.2006.876293
Wei, J., Lee, Z., Garcia, R., Zoffoli, L., Armstrong, R. A., Shang, Z., et al. (2018). An assessment of Landsat-8 atmospheric correction schemes and remote sensing reflectance products in coral reefs and coastal turbid waters. Remote Sens. Environ. 215, 18–32. doi:10.1016/j.rse.2018.05.033
Wei, J., Wang, M., Mikelsons, K., Jiang, L., Kratzer, S., Lee, Z., et al. (2022). Global satellite water classification data products over oceanic, coastal, and inland waters. Remote Sens. Environ. 282, 113233. doi:10.1016/j.rse.2022.113233
Welschmeyer, N. A. (1994). Fluorometric analysis of chlorophyll a in the presence of chlorophyll b and pheopigments. Limnol. Oceanogr. 39 (8), 1985–1992. doi:10.4319/lo.1994.39.8.1985
Windle, A. E., Evers-King, H., Loveday, B. R., Ondrusek, M., and Silsbe, G. M. (2022). Evaluating atmospheric correction algorithms applied to olci sentinel-3 data of Chesapeake Bay Waters. Remote Sens. 14 (8), 1881. doi:10.3390/rs14081881
Zibordi, G., D’Alimonte, D., and Kajiyama, T. (2022). Automated quality control of AERONET-OC L WN data. J. Atmos. Ocean. Technol. 39 (12), 1961–1972. doi:10.1175/jtech-d-22-0029.1
Zibordi, G., Mélin, F., and Berthon, J. F. (2018). A regional assessment of OLCI data products. IEEE Geoscience Remote Sens. Lett. 15 (10), 1490–1494. doi:10.1109/lgrs.2018.2849329
Zibordi, G., Mélin, F., Berthon, J. F., Holben, B., Slutsker, I., Giles, D., et al. (2009). AERONET-OC: a network for the validation of ocean color primary products. J. Atmos. Ocean. Technol. 26 (8), 1634–1651. doi:10.1175/2009jtecho654.1
Keywords: AERONET-OC, optical water types, atmospheric correction, Sentinel-3 OLCI, coastal waters
Citation: Arena M, Pratolongo P, Loisel H, Tran MD, Jorge DSF and Delgado AL (2024) Optical water characterization and atmospheric correction assessment of estuarine and coastal waters around the AERONET-OC Bahia Blanca. Front. Remote Sens. 5:1305787. doi: 10.3389/frsen.2024.1305787
Received: 02 October 2023; Accepted: 30 January 2024;
Published: 12 February 2024.
Edited by:
Vittorio Ernesto Brando, National Research Council (CNR), ItalyReviewed by:
Tristan Harmel, Earth Observation Unit, FranceAnna Windle, Goddard Space Flight Center, United States
Copyright © 2024 Arena, Pratolongo, Loisel, Tran, Jorge and Delgado. This is an open-access article distributed under the terms of the Creative Commons Attribution License (CC BY). The use, distribution or reproduction in other forums is permitted, provided the original author(s) and the copyright owner(s) are credited and that the original publication in this journal is cited, in accordance with accepted academic practice. No use, distribution or reproduction is permitted which does not comply with these terms.
*Correspondence: Maximiliano Arena, bWFyZW5hQGlhZG8tY29uaWNldC5nb2IuYXI=