 Héritier Khoji Muteya1,2*
 Dieu-donné N’tambwe Nghonda1,2
 François Malaisse2
 Jan Bogaert2
 Yannick Useni Sikuzani1
- 1Ecology, Ecological Restoration, and Landscape Unit, Faculty of Agronomic Sciences, University of Lubumbashi, Lubumbashi, Democratic Republic of Congo
- 2Biodiversity, Ecosystem, and Landscape Axis, University of Liège—Gembloux Agro-BioTech, Gembloux, Belgium
Introduction: Forests in the Zambezi ecoregion play a critical role in sustaining biodiversity and the livelihoods of over 100 million people across Southern and Central Africa. However, these forests face growing threats from human activities. This study assessed forest-cover changes at the national scale within the Zambezi ecoregion from 2000 to 2023.
Methods: A total of 600 Landsat images acquired for the years 2000, 2008, 2016, and 2023 were used to analyze forest cover change. Forest cover was classified using the Random Forest algorithm, integrated with Geographic Information Systems (GIS) and landscape metrics to assess patterns of forest fragmentation and ecological transformation.
Result: The results showed a significant reduction in forest area from 2,328,377.5 km2 to 1,817,513 km2, corresponding to an annual deforestation rate of 0.95%. This decline was associated with a substantial decrease in the largest patch index, signifying increased fragmentation driven primarily by patch dissection and suppression. At the country level, annual deforestation rates above 1% were identified in Malawi (2.07%), Burundi (1.92%), Zimbabwe (1.57%), and Tanzania (1.06%), while lower rates were observed in Zambia (0.93%), Mozambique (0.92%), Angola (0.83%), and southeastern Democratic Republic of the Congo (0.72%). Despite widespread forest loss, some limited forest stability and regeneration offer potential for ecological restoration.
Discussion: The findings emphasize the increasing human-induced pressures on forests within the Zambezi ecoregion and highlight the urgent need for coordinated restoration initiatives by the Southern African Development Community (SADC). Crucial steps include engaging local communities in forest governance, promoting natural forest regeneration, and implementing sustainable agriculture and clean-energy policies to conserve biodiversity and maintain ecosystem services.
1 Introduction
Forests contain most of Earth’s terrestrial biodiversity, with approximately two-thirds located in tropical regions (Krebber and Marcon, 2023). These ecosystems are crucial for climate regulation, having sequestered 17% of global carbon emissions in the 1990s, a figure that decreased to 6% by the 2010s (Hubau et al., 2020). More than 1.5 billion people directly rely on tropical forests for vital resources such as freshwater, medicines, and non-timber forest products (Gould et al., 2024). However, deforestation significantly undermines their ecological integrity, with an estimated 10 million hectares lost annually since 1990 (Sarre, 2020).
For example, in South America, net forest loss between 2000 and 2020 accounted for 5% of the total forest area present in 2000, translating to 0.44 million km2 (Potapov et al., 2022). Southeast Asia experienced a net forest cover reduction of 105,490 km2, or 4.87%, between 1992 and 2018 (Paradis, 2021). Similarly, Central Africa lost approximately 9% of its tropical forest cover since 2000, amounting to about 18 million hectares (Eba’a Atyi et al., 2022), with dry tropical forests also severely affected.
Dry tropical forests, covering roughly 40% of tropical forested areas (Chidumayo, 2013), include the Zambezi ecoregion in Central and Southern Africa—the world’s largest tropical dry forest (Dewees et al., 2010; Kamnitzer, 2024). Recognized among the 200 globally significant ecoregions and the largest in sub-Saharan Africa, this region primarily comprises miombo and mopane woodlands (Timberlake and Chidumayo, 2011). These forests, spanning eight countries (Zambia, Tanzania, the Democratic Republic of Congo (DRC), Angola, Mozambique, Malawi, Zimbabwe, and Burundi) (Ribeiro et al., 2015; Nduwarugira et al., 2017), support diverse plant communities and numerous endemic wildlife species (Ribeiro et al., 2020). Miombo woodlands, dominated by Brachystegia, Julbernardia, and Isoberlinia, flourish on nutrient-poor soils, whereas Mopane woodlands primarily consist of Colophospermum mopane (De Cauwer et al., 2018; Ribeiro et al., 2020).
Over 100 million people depend on the goods and services provided by these forests (Dewees et al., 2010). However, deforestation driven by agriculture, urbanization, mining, charcoal production, and vegetation fires severely threatens biodiversity and ecosystem services (Useni et al., 2017; Jew et al., 2016). Agriculture alone accounts for approximately 70%–80% of deforestation within this ecoregion (Masolele et al., 2024). Urban expansion, notably in southern Katanga (DRC), charcoal production due to limited electricity access, and mining activities, particularly copper and cobalt extraction in Zambia and the DRC, have intensified forest loss (Mwitwa et al., 2012; Useni et al., 2017; Khoji et al., 2022; World Bank, 2024). Additionally, vegetation fires have significantly contributed to forest degradation (Useni et al., 2023).
Despite the severity of these threats, comprehensive studies documenting forest decline in the Zambezi ecoregion remain limited (Mgunda, 2023; Kamnitzer, 2024). Most existing analyses rely heavily on regional policy reports, such as the Maputo Declaration (SADC, 2022). According to this report, the extent of Miombo woodlands declined from 2.7 million km2 in 2006 to 1.9 million km2 by 2021. Other studies have investigated deforestation at the national scale, including research conducted by Depicker et al. (2021), which highlighted a 12% reduction in forest cover in the Kivu Rift (covering Burundi) over two decades; Gondwe et al. (2019), who reported a 25% decline in Malawi’s forest area between 2000 and 2017 in Malawi; Nzunda and Midtgaard (2019) who found substantial forest loss in mainland Tanzania due to small-scale agriculture and charcoal production; Phiri et al. (2019), who estimated an annual deforestation rate of 0.62% in Zambie; Potapov et al. (2012), who documented significant primary forest loss in the DRC; and Cianciullo et al. (2023) who observed a sharp increase in deforestation in Mozambique, especially in protected areas. However, such national-level assessments provide limited insights into regional deforestation patterns, thus constraining the development of effective conservation and management strategies at broader spatial scales. Moreover, methodological differences in image analysis, influenced by research objectives and data availability, may lead to heterogeneous outcomes (Olander et al., 2008).
To address these limitations, it is crucial to analyze the ecoregion as a whole to understand the complex dynamics of deforestation and fragmentation. Integrating remote sensing and Geographic Information Systems (GIS) enables accurate regional-scale forest monitoring, providing spatial-temporal data that improve our understanding of ecological processes (Foody, 2023). Coupled with landscape ecology approaches, these methods effectively assess impacts of land-use changes amid increasing anthropogenic pressures (Crowley and Cardille, 2020). Studies by Hansen et al. (2013), Potapov et al. (2022), and Aleman et al. (2018) demonstrate the efficacy of these techniques for large-scale deforestation analyses, complementing traditional national-level assessments. Moreover, advances in Machine Learning, particularly through platforms like Google Earth Engine, enable efficient processing of extensive datasets, significantly improving the detection of forest cover changes and their impacts on biodiversity and ecosystem services (Gorelick et al., 2017).
This study aims to quantify forest cover changes and fragmentation patterns across the Zambezi ecoregion, hypothesizing an increase in forest fragmentation, a decrease in total forest cover, and a reduction in the largest patch index due to intensifying anthropogenic pressures. Moreover, it anticipates that these dynamics will vary significantly across countries, influenced by socio-economic factors such as population density, energy access, and agricultural intensity. Countries such as Malawi, Burundi, and Zimbabwe, characterized by high population densities, limited electricity access, and substantial agricultural land, are expected to experience the most severe impacts.
2 Materials and methods
2.1 Study area
This study was conducted in the Zambezi ecoregion, spanning Central and Southern Africa, covering an area of 5,017,124 km2 between latitudes 0°59′S and 26°53′S and longitudes 11°46′E and 40°37′E (Figure 1). The ecoregion encompasses eight countries: Angola, Burundi, Malawi, Mozambique, the Democratic Republic of the Congo (DRC), Tanzania, Zambia, and Zimbabwe (Ribeiro et al., 2015; Nkengurutse et al., 2016).
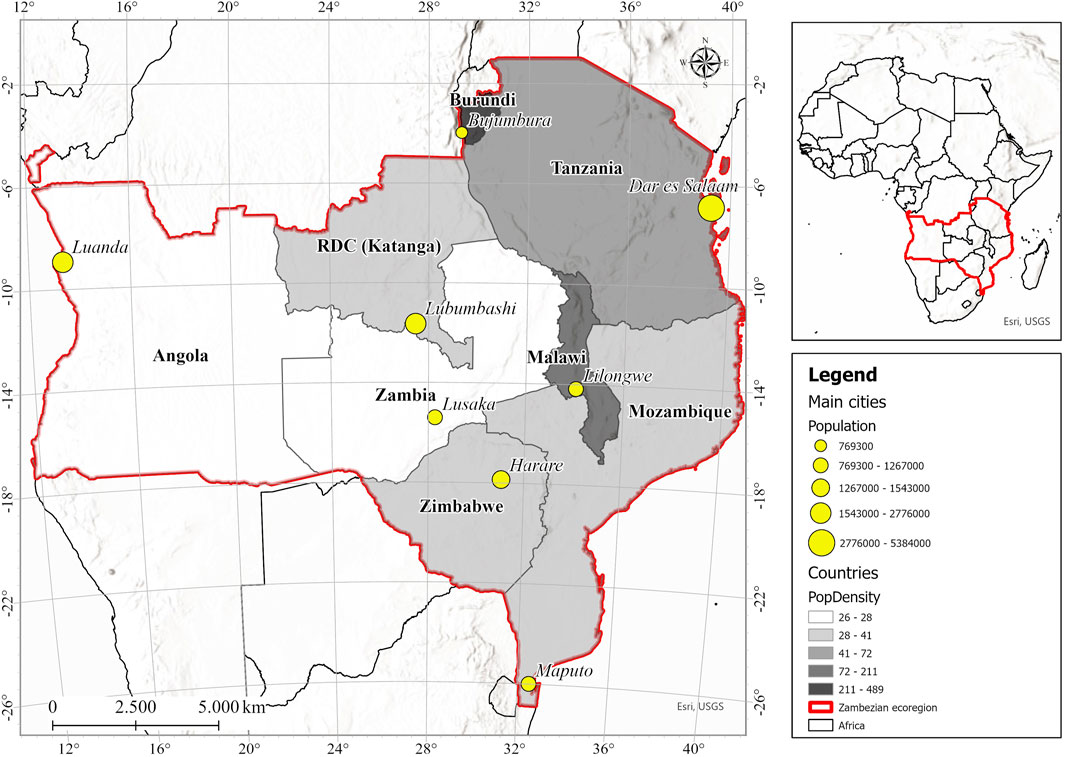
Figure 1. Location of the Zambezi Ecoregion in Southern and Central Africa, which extends across Southern and Central Africa, encompassing Angola, Burundi, Malawi, Mozambique, southeastern DRC, Tanzania, Zambia, and Zimbabwe. Data on urban populations and population density were obtained from the World Bank (2024).
The Zambezi ecoregion features a semi-arid subtropical climate, characterized by distinct seasonality, including a dry season lasting between 5 and 8 months and a wet season of 4–7 months, typical of summer-rainfall tropical forests (Malaisse, 2010). Miombo woodlands are classified into dry and wet types based on an annual rainfall threshold of 1,000 mm, with precipitation ranging from approximately 600 mm in southern Zimbabwe to over 1,600 mm in southeastern DRC (Ribeiro et al., 2020). Average annual temperatures across the region vary between 19°C and 25°C (McSweeney et al., 2010). Predominant soils include acidic Ferralsols and Acrisols, iron-rich Lixisols and Cambisols, as well as Arenosols and Regosols. These soils are generally nutrient-poor with low cation exchange capacity, limiting agricultural productivity (Ribeiro et al., 2020).
Miombo woodlands, the dominant vegetation type within the Zambezi ecoregion, host around 8,500 plant species, of which approximately 54% are endemic (Chirwa et al., 2008). Recognized as a center of Zambezi regional endemism, this biome supports high floral diversity and serves as a habitat for one of Africa’s most significant remaining assemblages of megafauna, marking it as a global biodiversity hotspot (Malaisse, 2010; Timberlake and Chidumayo, 2011). Socio-economically, countries within the Zambezi ecoregion (Table 1) are heavily reliant on subsistence agriculture, logging, and urban expansion, activities that have significantly contributed to increasing deforestation, particularly driven by agricultural expansion and charcoal production (Ribeiro et al., 2020).
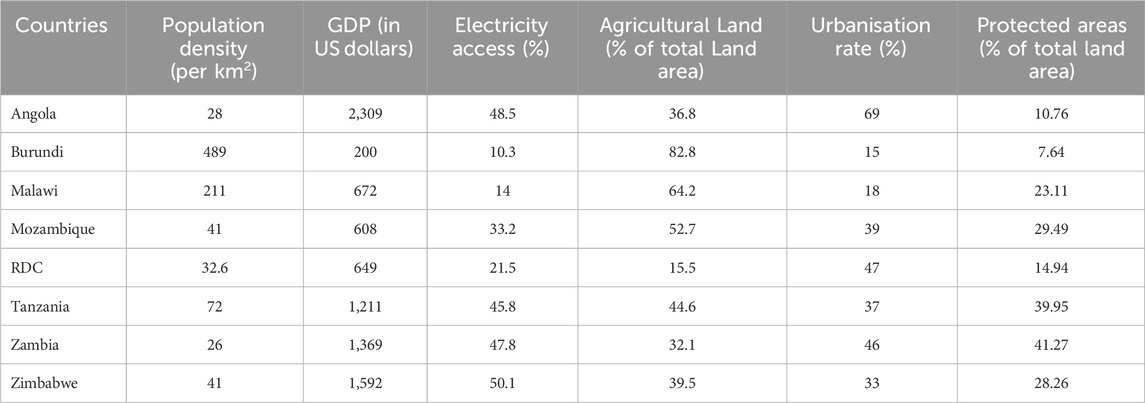
Table 1. Key Indicators for each country in the Zambezi Ecoregion: Population density (2021), gross domestic product (GDP) (2023), electricity access (2022), agricultural land area (2022), and urbanization rate (2023) were sourced from the World Bank (2024). Data on protected areas, expressed as a percentage of the national territory, were obtained from Planet Protected (2024).
2.2 Source and selection of satellite data
This study utilized Landsat satellite imagery from TM (2000), ETM+ (2008), OLI-TIRS 1 (2016), and OLI-TIRS II (2023) sensors, all with a 30-meter spatial resolution. Approximately 150 scenes per year (185 km × 185 km each), with cloud cover below 10%, were selected to ensure high-quality data. These reference years were strategically chosen to correspond with key policy events influencing forest management in the Southern African Development Community (SADC). Specifically, 2000 represents a baseline preceding the SADC Protocol on Forestry (SADC, 2002). 2008 reflects socio-economic shifts due to the global economic crisis and precedes the 2010 SADC Forestry Strategy (SADC, 2010). 2016 marks a significant period preceding the Maputo Declaration (SADC, 2022), and 2023 offers a contemporary evaluation of current forest conditions. Satellite imagery was accessed via Google Earth Engine (GEE), a cloud-based platform that supports large-scale geospatial analysis (Gorelick et al., 2017).
2.3 Image pre-processing
The images selected in Google Earth Engine (GEE) originate from Collection 2, which converts calibrated Top-of-Atmosphere (TOA) brightness temperatures from single and dual thermal infrared bands of Landsat satellites 4–9 into atmospherically corrected surface temperature products (Wulder et al., 2022). In this analysis, the function applyScaleFactors was utilized within GEE to convert raw digital numbers into meaningful physical units. Specifically, optical bands were rescaled by multiplying by 0.0000275 and subtracting 0.2, whereas thermal bands were adjusted by multiplying by 0.00341802 and adding 149.0 (Gorelick et al., 2017). These procedures generated corrected bands, replacing the originals in each image (Wulder et al., 2022). The function was applied to the entire Collection via the map() method, ensuring data consistency. Concurrently, a cloud mask was created using the QA_PIXEL indicator within GEE, enabling the selection and refinement of scenes best suited for the analysis by removing those heavily affected by clouds (Phan et al., 2020).
Subsequently, the median of the processed images was computed to obtain a representative composite image, which was clipped to the study area using the clip() function. Finally, a visualization scheme was established using near-infrared (NIR), red (R), and green (G) bands with precise parameters (minimum and maximum values set to 0 and 0.3, gamma of 2), facilitating visual interpretation (Gorelick et al., 2017). These bands were selected based on their optimal properties for vegetation and land cover analysis: the NIR band strongly reflects chlorophyll content, the R band detects vegetation presence via chlorophyll absorption, and the G band assesses vegetation health and canopy density (Imam, 2019).
2.4 Image classification
Two main land-cover classes were defined: Zambezi woodlands and non-forest. The Zambezi woodlands class encompasses Miombo woodlands, gallery forests, dry dense forests, montane forests, and Mopane woodlands (Malaisse, 2010; De Cauwer et al., 2018). Conversely, the non-forest class includes all other land-cover and cover types.
Training areas were delineated using high-resolution satellite imagery from Google Earth Engine (GEE) and Open Foris Collect Earth (Bey et al., 2016). A stratified random sampling approach was applied to select 1460 points for the non-forest class and 1520 points for the Zambezi woodlands class from the 2023 imagery, ensuring representative coverage across the ecoregion. Woodland areas were delineated based on tree canopy cover, canopy texture, and spectral tone typical of Miombo formations. Non-forest areas were identified using similar visual and spectral criteria, particularly the absence or fragmentation of tree cover. Classification employed the Random Forest classifier, known for its robustness in handling complex remote sensing data (Parmar et al., 2019). Parameters were optimized to include two variables per node (Mtry = 2) and 100 decision trees, following recommendations by Phan et al. (2020), enhancing classification accuracy and reducing overfitting. Other parameters, including the maximum tree depth and the minimum number of samples per leaf, were retained at their default settings, allowing unrestricted tree growth (Probst et al., 2019).
2.5 Accuracy assessment and area estimation
Validation of the supervised classification followed established best practices. Specifically, accuracy assessment adhered to guidelines recommended in the literature (Olofsson et al., 2014). Land-cover change analysis involved generating change maps for three periods: 2000–2008, 2008–2016, and 2016–2023, using the Raster Calculator tool in ArcGIS Pro. This temporal segmentation was selected to effectively capture land-cover transitions occurring over intervals long enough to reflect significant environmental changes (Burel and Baudry, 2012). These intervals provided a robust assessment of key land-cover dynamics.
For each period, 700 sampling points were selected using stratified random sampling, a method recommended by Olofsson et al. (2013) to ensure representative coverage across different land-cover classes. Allocation was as follows: 200 points for stable classes (covering more than 30% of the study area) and 500 points for dynamic classes. Stable classes refer to areas where pixel values remained unchanged between observation dates, indicating no land cover transformation. In contrast, dynamic classes represent areas where changes in land cover were detected over time (Fichera et al., 2012).
Accuracy metrics were calculated according to Equations 1, 3 from Olofsson et al. (2014). Overall accuracy represented the percentage of correctly classified pixels within the entire dataset. User accuracy indicated the proportion of pixels classified into a specific category that matched ground conditions, while producer accuracy represented the proportion of ground-reference pixels correctly identified in the classification (Olofsson et al., 2013). These accuracy metrics are widely recognized as key performance indicators for remote sensing classifications (Nelson et al., 2021).
To quantify uncertainty, adjusted area estimates and associated 95% confidence intervals (standard error × 1.96) were computed using Equations 10, 11 from Olofsson et al. (2014). Finally, quantity and allocation disagreement were assessed following Equations 2–5 outlined by Pontius and Millones (2011), providing insights into both the magnitude and nature of classification errors (Nelson et al., 2021).
2.6 Analysis of landscape spatial structure dynamics
The analysis of landscape composition and configuration in the Zambezi ecoregion, both regionally and at the national level, employed selected spatial indices chosen for their ecological significance and ability to capture essential landscape features. The indices include the Patch Number (PN), reflecting fragmentation by quantifying patch density and landscape subdivision. An increased PN typically indicates habitat fragmentation and ecological disruption (McGarigal, 2015). Class area and Percentage of Landscape (PLAND) were calculated to quantify the spatial extent and relative proportion of each land-cover class, respectively, providing valuable insights into land-cover distribution patterns. The magnitude of deforestation was evaluated by calculating periodic deforestation rates, defined as the ratio of forest area loss (the difference between initial and final forest areas) to the initial forest area (Useni et al., 2020). This measure enabled an accurate assessment of annual deforestation trends by dividing it by the number of years between the initial and final dates.
Additionally, classified maps were integrated into the ArcGIS Pro Raster Calculator to generate change maps, which quantify and spatially represent forest stability, regeneration, and loss.
Additionally, landscape spatial transformation processes (STPs) were analyzed using the decision-tree algorithm proposed by Bogaert et al. (2004), identifying processes such as expansion, aggregation, creation, deformation, displacement, perforation, shrinkage, removal, fragmentation, and dissection. These STPs directly inform on the effects of anthropogenic disturbances, revealing impacts on biodiversity and ecosystem services (Bogaert et al., 2011). Distinctions between fragmentation and dissection were established by comparing patch area, patch number, and perimeter before and after transformation. Specifically, if the ratio of final to initial area (t) is ≤0.75, the process is classified as fragmentation; otherwise, it is considered dissection (de Haulleville et al., 2018).
Finally, the dynamics of fragmentation were quantified using the Largest Patch Index (LPI), a reliable indicator of habitat connectivity and ecological integrity. Decreasing LPI values reflect diminished habitat connectivity, potentially affecting ecosystem functionality and species dispersal, with serious implications for biodiversity persistence, especially under changing climatic conditions (McGarigal, 2015).
3 Results
3.1 Spectral features, accuracy assessment, area estimation, and mapping
Zambezi woodlands exhibited low reflectance in the visible spectrum (Figure 2), particularly prior to the red band (∼665 nm). In contrast, a pronounced peak is observed in the near-infrared region (∼865 nm), which is characteristic of healthy vegetation with dense canopy cover. This is followed by a gradual decrease in reflectance across the shortwave infrared bands (∼1,610–2,200 nm).
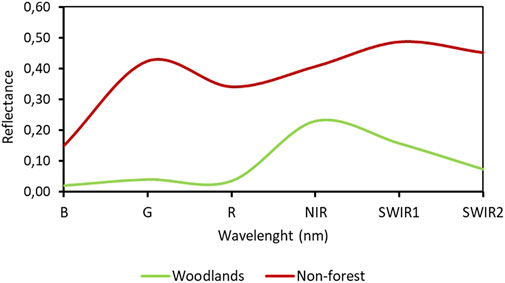
Figure 2. Spectral reflectance profiles of Zambezi woodlands and non-forest classes across the visible, near-infrared (NIR), and shortwave infrared (SWIR) regions. Zambezi woodlands display a pronounced reflectance peak in the NIR region (∼865 nm), and a subsequent decline in the SWIR range (∼1,610–2,200 nm). In contrast, non-forest classes show generally higher reflectance in the visible and SWIR regions.
Conversely, the non-forest class displayed generally higher reflectance in both the visible and shortwave infrared regions, reflecting sparse vegetation, bare soil, or anthropogenic surfaces. One of the non-forest variants showed consistently low reflectance across the entire spectrum, which may correspond to impervious surfaces, heavily shaded areas, or water bodies. These spectral contrasts confirm the clear separability between Zambezi woodland formations and other land cover types.
The supervised classification showed high accuracy, as indicated by the results presented in Table 2. Overall accuracy, user accuracy, and producer accuracy were high, with minimal errors. These findings are supported by low quantity disagreement (QD) and allocation disagreement (AD) metrics, which revealed only slight discrepancies between classified and reference maps. The ratios of AD to QD were consistently below 1, confirming that observed differences were mainly due to quantity disagreements rather than allocation errors (Table 2).
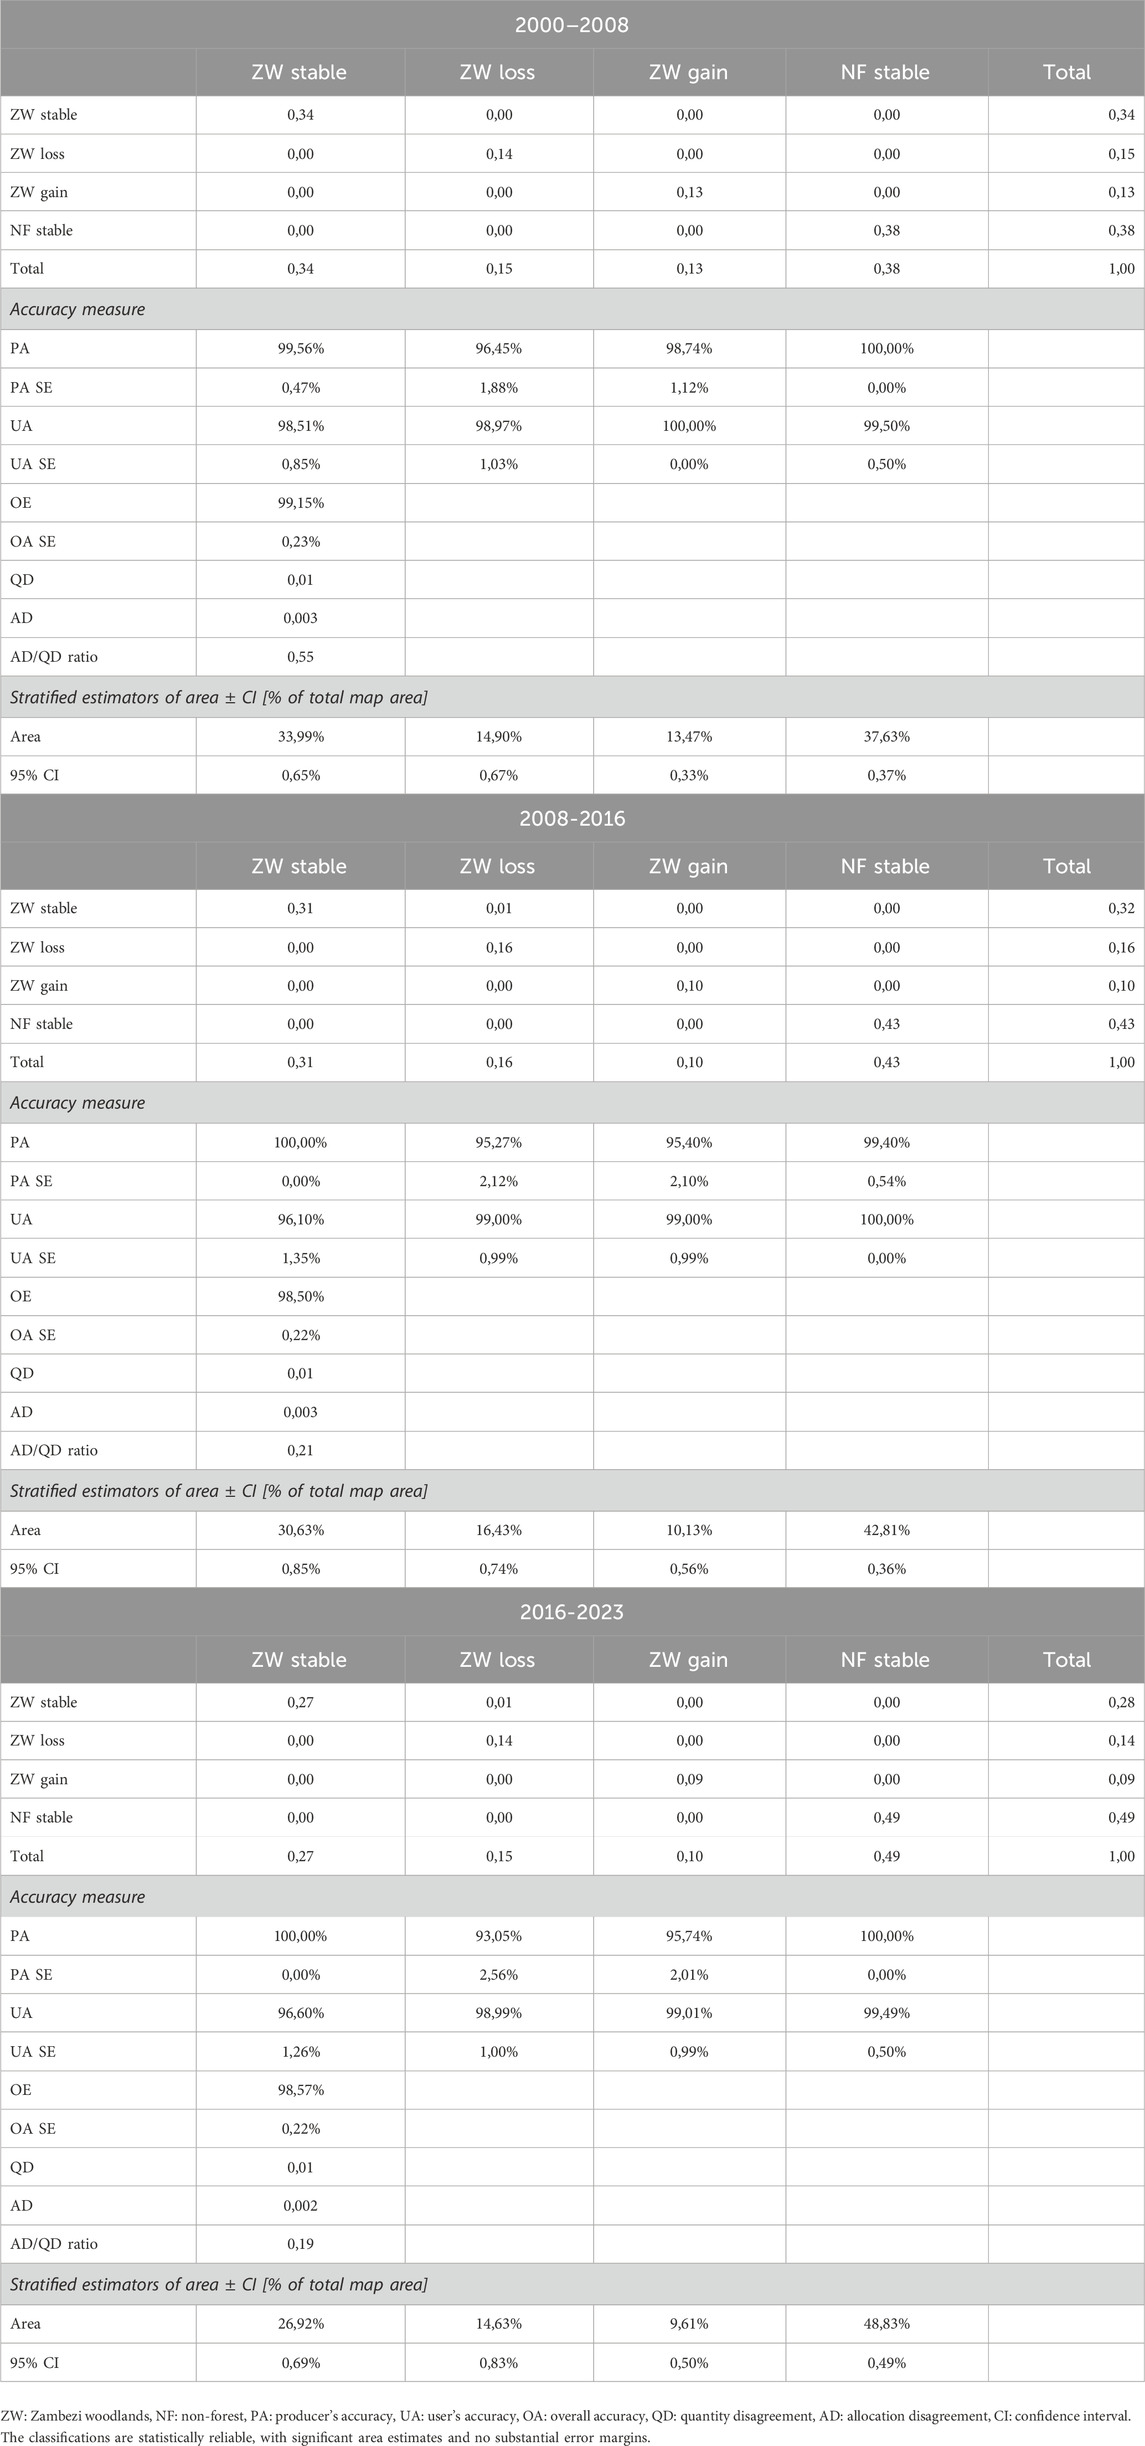
Table 2. Classification accuracy assessment and area estimation for land-cover classes and cover change from 2000 to 2008, 2008–2016, and 2016–2023, based on supervised classification of Landsat images using the Random Forest algorithm.
Visual analysis of land cover maps reveals a decline in Zambezi woodlands between 2000 and 2023 (Figure 3). The adjusted area estimates, calculated using confidence intervals to account for sampling uncertainty, confirmed this progressive increase in forest loss across the study periods (2000–2008, 2008–2016, and 2016–2023) within the Zambezi ecoregion (Table 2).
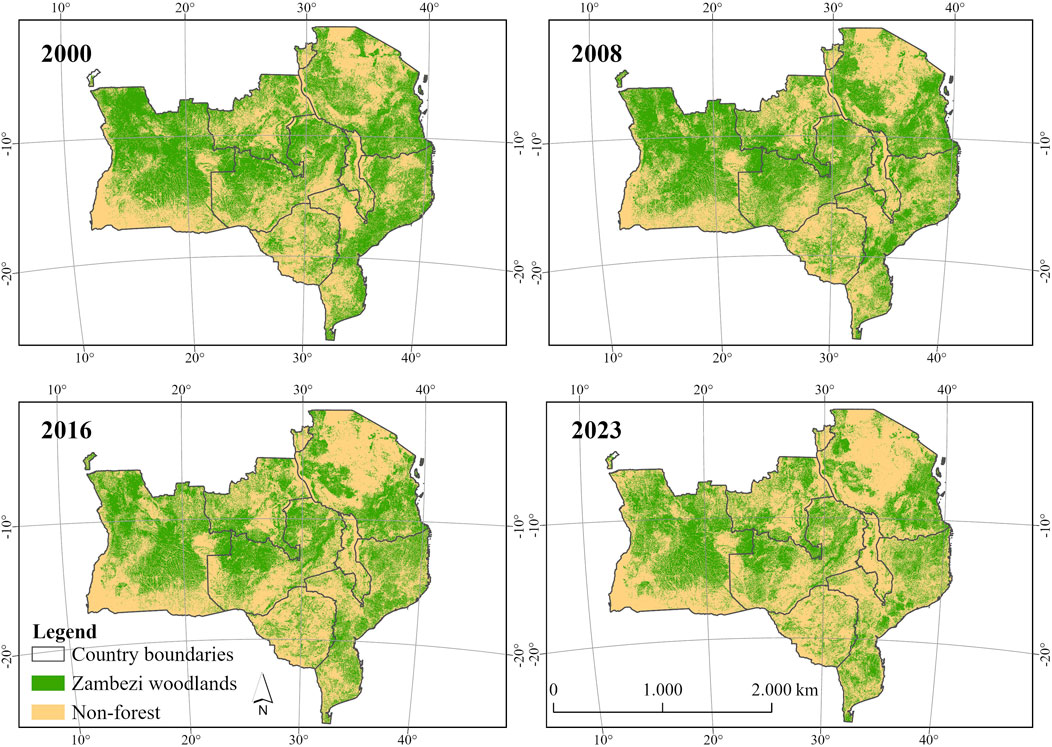
Figure 3. The maps illustrate changes in the spatial distribution of Zambezi woodlands derived from supervised classification of Landsat imagery for the years 2000, 2008, 2016, and 2023 using the Random Forest classifier. A marked decline in woodlands cover is observed between 2000 and 2023.
3.2 Dynamics of landscape composition
The analysis of landscape composition reveals a pronounced decline in forest cover, amounting to a loss of 21.94% over 23 years. The forested area decreased from 2,328,377.5 km2 (46.41% of the ecoregion) in 2000 to 1,817,513.0 km2 (36.23%) in 2023, corresponding to an annual deforestation rate of 0.95%. At the national scale, forest cover exhibited widespread and significant declines. In Angola and Zambia, where forests previously dominated the landscape, non-forest areas have now become predominant. For example, Angola’s forest cover declined from 725,351.50 km2 (56.54% of the national territory) in 2000 to 586,861.50 km2 (45.74%) in 2023, representing an annual deforestation rate of 0.83%. In Zambia, forest area decreased from 409,362.25 km2 (54.37%) in 2000 to 321,477.25 km2 (42.70%) in 2023, corresponding to an annual deforestation rate of 0.93% (Figure 4).
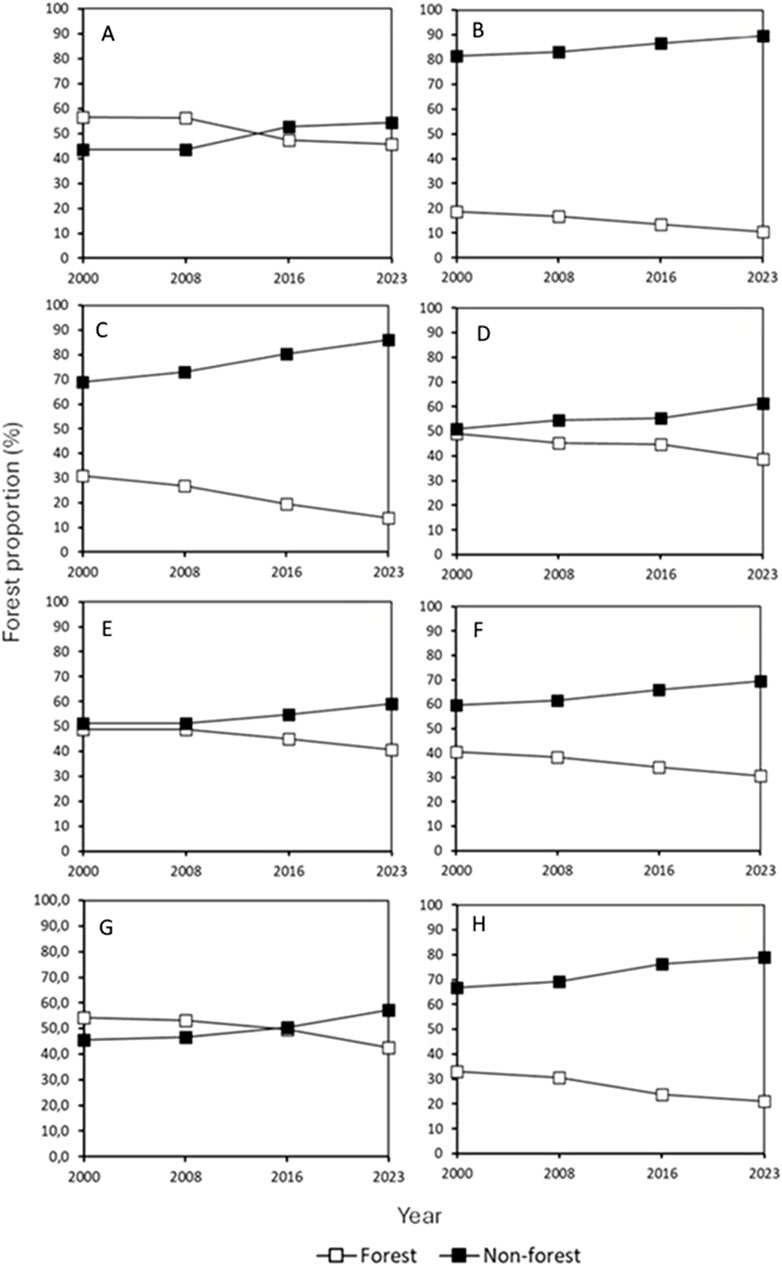
Figure 4. Changes in forest cover proportions in Angola (A), Burundi (B), Malawi (C), Mozambique (D), south-eastern DRC (E), Tanzania (F), Zambia (G), and Zimbabwe (H), derived from the supervised classification of 2000, 2008, 2016, and 2023 Landsat images using the Random Forest algorithm. The results show a decline in forest cover proportions in all countries from 2000 to 2023.
In other countries, Burundi’s forest cover decreased markedly from 5,179.25 km2 (18.61% of national territory) in 2000 to 2,897.50 km2 (10.41%) in 2023, indicating an annual deforestation rate of 1.92%. Malawi experienced a significant decline from 37,201.50 km2 (31.05%) to 19,530.50 km2 (16.30%), corresponding to a 2.07% annual deforestation rate. In Mozambique, forest area decreased from 393,792.00 km2 (49.00%) to 310,816.25 km2 (24.95%) in 2023, with an annual deforestation rate of 0.92%. These countries thus lost nearly half their initial forest cover over the study period (Figure 4). In southeastern DRC, forest cover declined from 239,073.25 km2 (10.19% of the national territory) in 2000 to 199,467.00 km2 (8.50%) in 2023, corresponding to an annual deforestation rate of 0.72%. Tanzania’s forested area fell from 388,819.50 km2 (40.48%) to 293,787.25 km2 (30.58%), translating to a 1.06% annual deforestation rate. Finally, Zimbabwe’s forest area shrank from 129,598.25 km2 (33.10%) to 82,675.75 km2 (21.12%), representing an annual deforestation rate of 1.57% (Figure 4). These findings underscore extensive forest losses across all countries, with notably high deforestation rates in Malawi and Burundi, indicative of intensifying human pressures. However, Angola experienced the greatest absolute forest loss.
Change detection analysis at the ecoregional scale reveals a progressive decrease in stable forest proportion, from 35.06% (2000–2008) to 28.20% (2016–2023), reflecting a consistent decline in forest stability. Simultaneously, forest loss consistently accounted for 13.60% (2000–2008), 14.96% (2008–2016), and 13.00% (2016–2023), suggesting persistent anthropogenic pressure. Conversely, forest regeneration decreased notably, from 12.35% (2000–2008) to 9.17% (2008–2016), and then further declined to 8.73% (2016–2023), indicating a reduced capacity for natural regeneration (Figure 5).
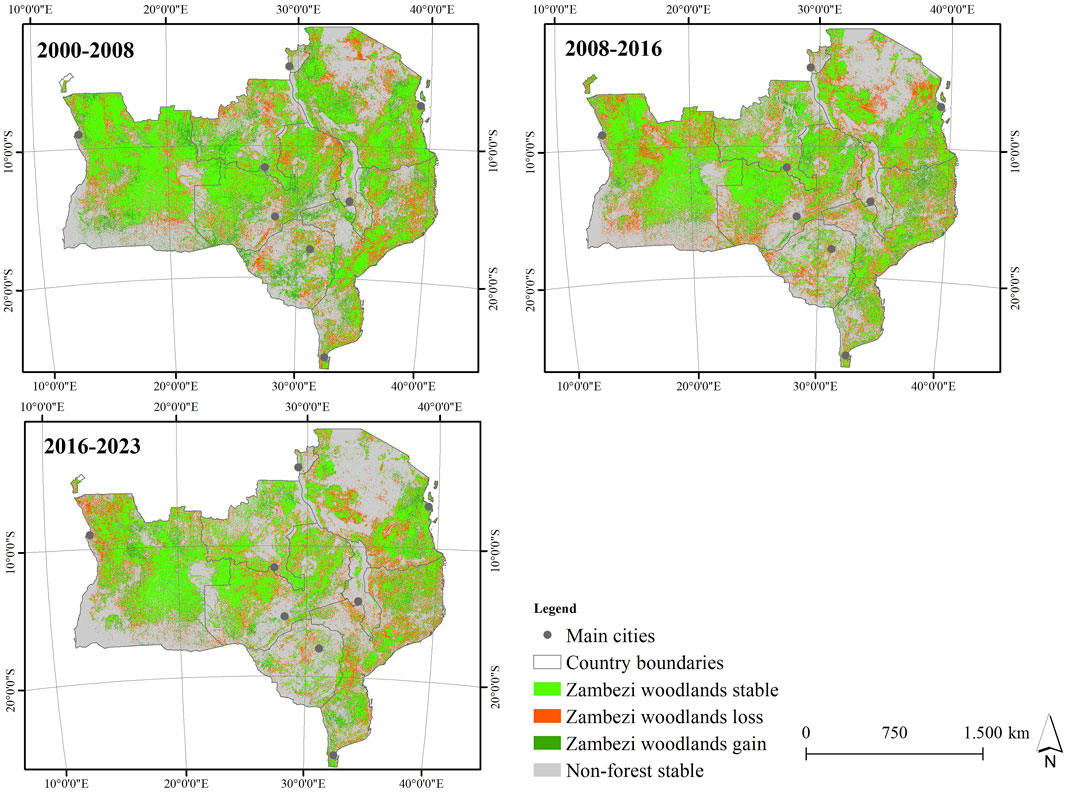
Figure 5. Change maps illustrating shifts in forest cover across the Miombo ecoregion from 2000 to 2008, 2008–2016, and 2016–2023, derived from supervised classification of 2000, 2008, 2016, and 2023 Landsat images using the Random Forest algorithm. The results highlight a marked regression in forest cover between 2000 and 2023.
At the national scale, Angola’s stable forest decreased from 46.22% (2000–2008) to 35.59% (2016–2023), while forest loss increased slightly from 10.44% to 11.18%, and forest regeneration remained relatively stable, shifting marginally from 9.68% to 9.99%. In Burundi, stable forest declined from 7.90% to 5.39%, forest loss decreased from 9.19% to 7.36%, and regeneration dropped from 8.49% to 4.72%. In Zambia, stable forest slightly decreased from 38.33% to 34.05%, forest loss decreased from 14.43% to 13.67%, and regeneration notably declined from 14.81% to 7.31% (Figures 5, 6).
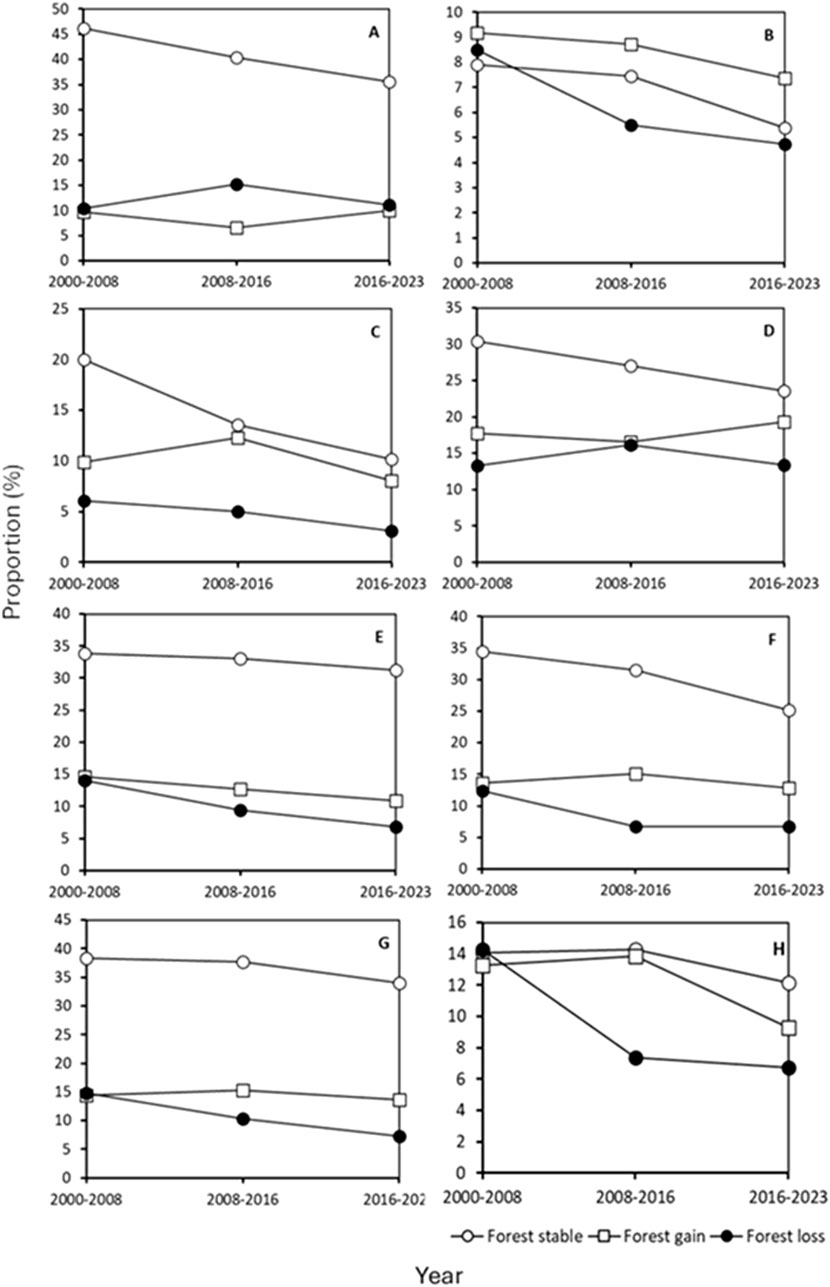
Figure 6. Changes in the proportion of stable forest, forest loss, and forest gain in Angola (A), Burundi (B), Malawi (C), Mozambique (D), south-eastern DRC (E), Tanzania (F), Zambia (G), and Zimbabwe (H), derived from the supervised classification of 2000, 2008, 2016, and 2023 Landsat images using the Random Forest algorithm. The proportion of stable forest, forest loss, and forest gain decreased in all countries between 2000 and 2023.
In the remaining countries, Malawi’s stable forest shrank significantly from 19.99% to 10.17%, forest loss declined from 9.91% to 8.07%, and forest regeneration sharply dropped from 6.08% to 3.09%. Mozambique’s stable forest area fell from 30.45% to 23.62%, while forest loss increased from 17.77% to 19.36%, and regeneration remained relatively stable, rising slightly from 13.29% to 13.41%. In southeastern DRC, stable forest declined from 33.79% to 31.24%, forest loss decreased from 14.57% to 10.87%, and regeneration dropped from 14.03% to 6.81%. Tanzania’s stable forest decreased from 34.39% to 25.16%, forest loss slightly declined from 13.69% to 12.82%, and regeneration reduced from 12.34% to 6.74%. Finally, Zimbabwe’s stable forest decreased from 14.08% to 12.16%, forest loss from 13.26% to 9.28%, and regeneration from 14.26% to 6.71% (Figures 5, 6). Overall, these findings highlight widespread forest loss across all countries, characterized by reduced landscape stability and a marked decline in regeneration capacity—insufficient to offset the observed deforestation.
3.3 Structural dynamics of the landscape
Between 2000 and 2008, forests in the Zambezi ecoregion underwent significant structural changes characterized by dissection, with a proportional area ratio (t) of 0.96. At the national scale, a similar pattern of dissection—indicated by simultaneous reduction in forest area and an increase in patch number—occurred in Angola (t = 0.98), Mozambique (t = 0.92), south-eastern DRC (t = 0.98), Zambia (t = 0.97), and Zimbabwe (t = 0.92). Conversely, Burundi, Malawi, and Tanzania experienced a reduction in both forest area and patch number, indicative of suppression (Figures 7, 8).
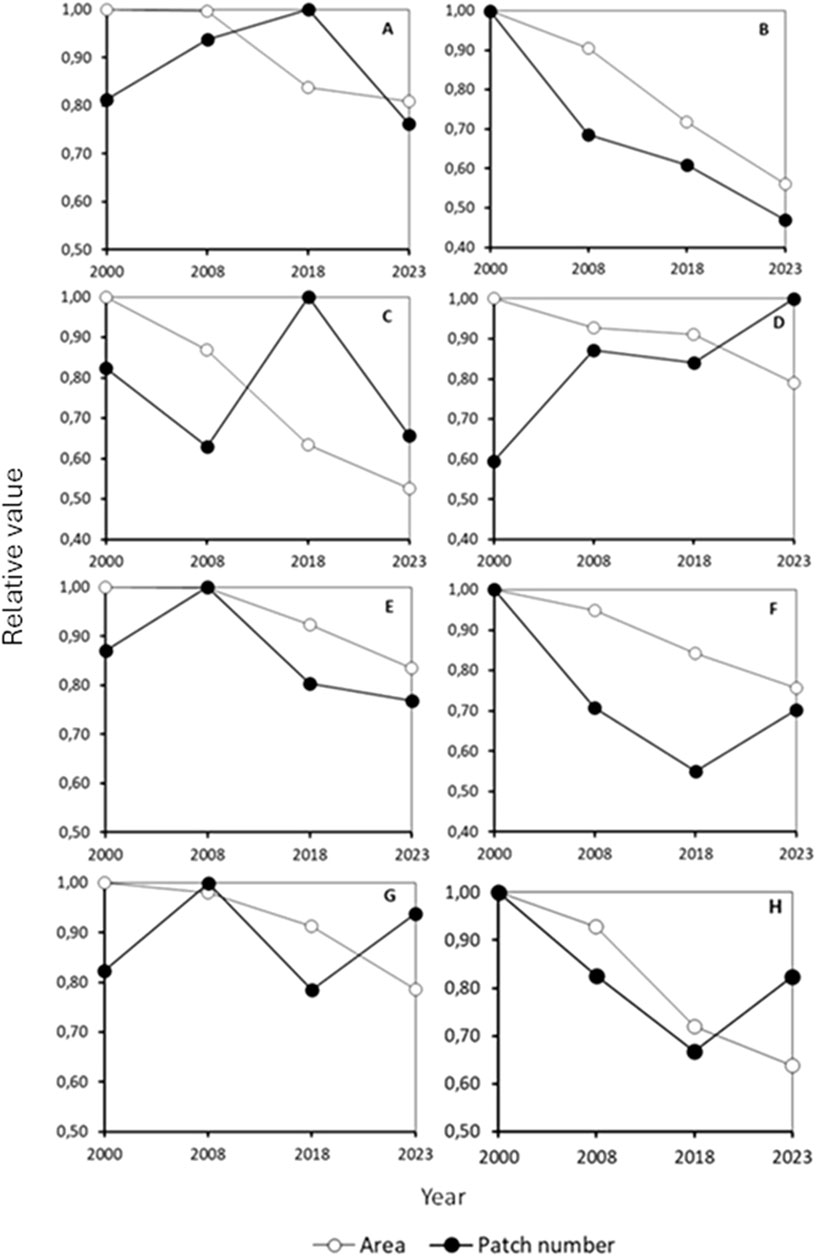
Figure 7. Changes in the relative values of forest area and patch number in Angola (A), Burundi (B), Malawi (C), Mozambique (D), south-eastern DRC (E), Tanzania (F), Zambia (G), and Zimbabwe (H), derived from the supervised classification of 2000, 2008, 2016, and 2023 Landsat images using the Random Forest algorithm. Forest cover decreased in all countries between 2000 and 2023.
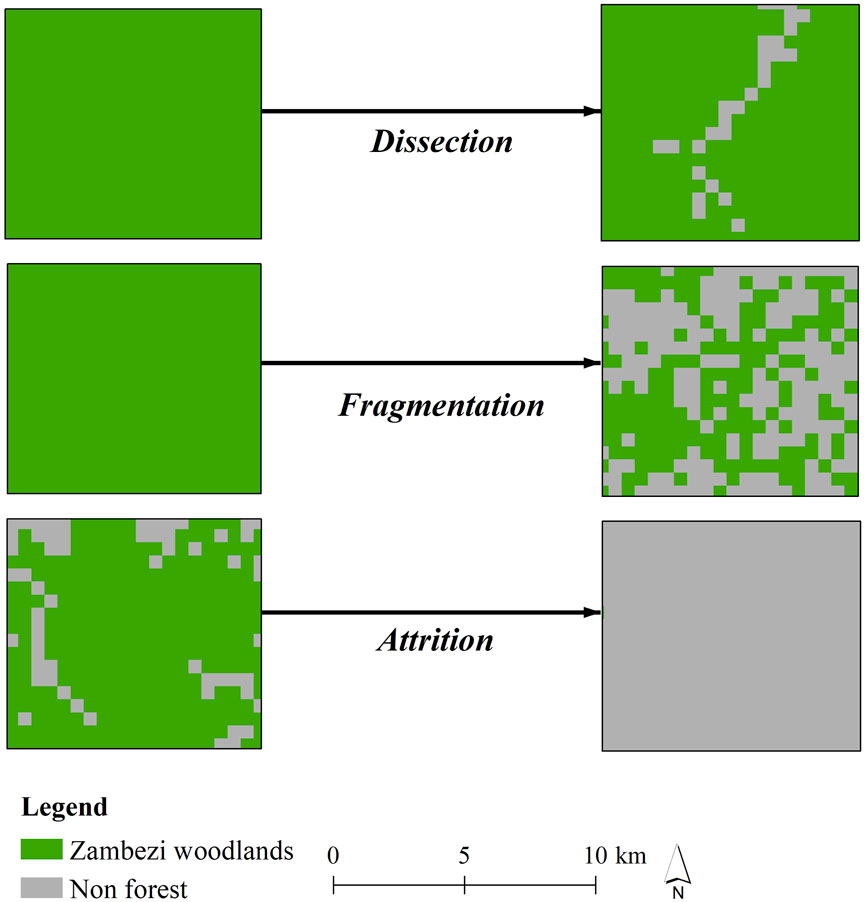
Figure 8. Visualization of spatial transformation processes in the countries of the Zambezi ecoregion (2018–2023), derived from the supervised classification of Landsat images using the Random Forest algorithm.
Between 2008 and 2016, the Zambezi ecoregion again underwent dissection (t = 0.90), while national-level analyses revealed varying spatial transformation processes. Angola (t = 0.83), Mozambique (t = 0.98), Zambia (t = 0.93), and Zimbabwe (t = 0.88) continued experiencing dissection, whereas Malawi showed clear fragmentation (t = 0.73), characterized by substantial loss in forest cover and increased fragmentation. Conversely, Burundi and south-eastern DRC exhibited simultaneous reductions in forest area and patch number, indicating suppression processes (Figures 7, 8).
From 2016 to 2023, forest dynamics at the ecoregional scale were once again dominated by dissection processes (t = 0.90). At the national level, suppression was observed in Angola, Burundi, Malawi, and south-eastern DRC, evidenced by declines in both forest area and patch number. Conversely, dissection characterized forest change in Mozambique (t = 0.86), Tanzania (t = 0.89), Zambia (t = 0.85), and Zimbabwe (t = 0.88), reflecting increasing fragmentation through subdividing larger patches into smaller ones (Figures 7, 8).
Analysis of the Largest Patch Index (LPI) showed a marked reduction at the ecoregional level, from 47.28% in 2000 to 24.52% in 2023, highlighting increased habitat fragmentation. At the national scale, Burundi experienced the greatest decline (from 47.28% to 24.52%), followed by significant decreases in Malawi, Zambia, Mozambique, and Tanzania. Angola, Zimbabwe, and Tanzania experienced relatively moderate declines, though still notable. These results underscore the widespread fragmentation occurring throughout the region, reinforcing concerns about habitat continuity (Figure 9).
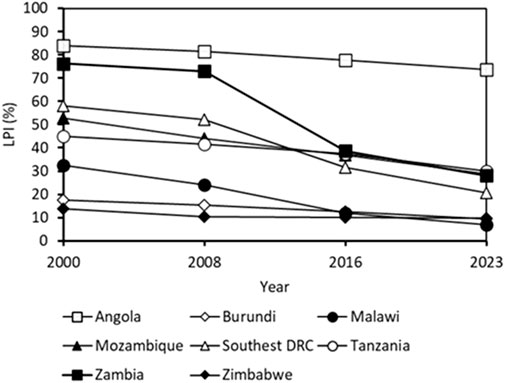
Figure 9. Evolution of the forest LPI in the countries of the Zambezi ecoregion, derived from the supervised classification of Landsat images using the Random Forest algorithm. The decline in this index indicates an increasing trend of forest fragmentation.
4 Discussion
4.1 Methodological approach
The integration of machine learning algorithms with Google Earth Engine (GEE) provides an effective means for monitoring and analyzing large-scale forest dynamics (Gorelick et al., 2017). GEE’s free access to Landsat archives, which are well-suited for assessing forest changes due to their moderate spatial resolution and consistent temporal coverage, remains a key advantage (Zhang et al., 2019). However, the necessity of a stable internet connection—which is often unreliable in certain parts of Africa—presents a significant limitation. Despite this challenge, GEE facilitates large-scale evaluations that help overcome many data accessibility constraints (Gorelick et al., 2017).
The Random Forest algorithm further enhances classification accuracy by efficiently handling large and heterogeneous datasets while reducing overfitting (Phan et al., 2020). The integration of Open Foris Collect Earth and Google Earth Pro was particularly valuable for generating reliable training datasets, especially given the vast extent of the Zambezi ecoregion (Bey et al., 2016). The decision to classify only two major categories (Zambezi woodlands vs non-forest) simplified the analysis but did not account for distinctions between specific woodland types, such as Miombo and Mopane. These subtypes may exhibit local variations in regeneration or degradation patterns. Nevertheless, given the magnitude of deforestation trends at the ecoregion scale, this limitation does not significantly affect the overall conclusions.
Following the guidelines outlined by Olofsson et al. (2014) provided a statistically robust approach to accuracy assessment and area estimation, circumventing the common shortcomings associated with the Kappa statistic (Pontius and Millones, 2011). Key metrics—including overall, user, and producer accuracies—quantified the reliability of classifications, while adjusted area estimates clarified the extent of each land-cover category. Similarly, quantity and allocation disagreements were used to measure discrepancies between classification outputs and validation data.
Landscape dynamics were analyzed using indices derived from Class Area (CA) and Patch Number (PN) for each land-cover class, recognized as critical indicators of spatial structure (McGarigal, 2013). CA enabled the calculation of PLAND, both of which are essential metrics for assessing landscape composition and dynamics (McGarigal, 2015). Additionally, CA served as the basis for computing the Largest Patch Index (LPI), a widely used indicator of fragmentation (McGarigal, 2013), previously applied by Useni et al. (2020) to evaluate Miombo fragmentation within the former Lufira Biosphere Reserve. However, area-based indices are inherently constrained by study scale, as parcel sizes and overall landscape extent define upper and lower analytical limits (McGarigal, 2015). While the use of medium-resolution imagery partially mitigates these constraints, subtle shifts in landscape configuration may still go undetected. Furthermore, CA and PN were incorporated into the algorithm developed by Bogaert et al. (2004) to identify spatial transformation processes. While this algorithm has been widely applied at local scales to analyze configuration changes and their underlying drivers (Mpanda et al., 2022; Useni et al., 2024b), it may have limitations in capturing the full spatial and temporal complexity of deforestation processes.
4.2 Deforestation trends in the Zambezi ecoregion and its countries
Analysis of forest trends in the Zambezi ecoregion reveals a substantial decline in forest cover, mirroring previous findings reported by Kamnitzer (2024) between 1980 and 2020. These results also align with studies from specific sub-regions, such as Katanga in southeastern DRC (Khoji et al., 2023; Useni et al., 2024b), Malawi (Gondwe et al., 2019) and main land Tanzania (Nzunda and Midtgaard, 2019). Furthermore, they are consistent with broader assessments of African tropical forests and global forest trends (Potapov et al., 2022; Aleman et al., 2018; Hansen et al., 2013), despite variations in percentages and methodologies.
At the country level, forest-dominant landscapes in Angola and Zambia have been largely replaced by non-forest cover. In Angola, the cessation of civil war in 2002 triggered rapid land-use changes, driven by population growth, an influx of oil-related revenue, and governance challenges (Pacheco et al., 2021). As the largest forested country in the ecoregion, Angola ranks among the top nations driving global forest loss, according to FAO (2021). Findings in this study confirm the trends reported by Chiteculo et al. (2018), highlighting significant forest declines in Huambo Province, and FAO (2021) at the national level. In Zambia, deforestation is linked to weak forest governance, characterized by legislative inconsistencies, limited administrative capacity, and inadequate resources (Kalaba, 2016). These shortcomings have enabled unregulated fuelwood extraction, charcoal production, mining, and agriculture, exacerbating forest loss (Mwitwa et al., 2012). Despite efforts to decentralize forest management and increase local participation, coordination and monitoring challenges persist. These findings align with Phiri et al. (2019), who documented accelerated deforestation in Zambia since the 1990s.
Other countries, including Burundi, Malawi, and Mozambique, have experienced extensive forest losses, with forest cover declining by nearly half over the study period. In Burundi and Malawi, high population densities—combined with a heavy reliance on subsistence agriculture (Masolele et al., 2024) and limited electricity access (World Bank, 2024)— have intensified pressure on forests for energy production. These countries also face severe funding shortages for biodiversity conservation and restoration initiatives (Polisi et al., 2017; World Bank, 2024). The findings here align with the observations of Depicker et al. (2021) in Burundi, where deforestation began in the 1980s and has since accelerated, as well as those in the FAO (2021) report identifying Malawi among the nations with substantial deforestation rates. Moreover, the results confirm the patterns recorded by Pacheco et al. (2021) in Mozambique, showing increasing forest loss since 2000—despite variations in data sources and methods. Lisboa et al. (2024) attribute this intensifying pressure to agriculture, logging, and timber production. Although recent sustainable forest management strategies have been proposed, implementation remains a major challenge (Pacheco et al., 2021).
Significant forest losses have also occurred in southeastern DRC, Tanzania, and Zimbabwe. In southeastern DRC, mining expansion over the past two decades has led to the conversion of forested land into extraction sites and infrastructure (Mwitwa et al., 2012; Useni et al., 2017). Rapid urban growth has heightened demand for food and charcoal, exacerbated by limited electricity access (Kabulu et al., 2018; Useni et al., 2018; World Bank, 2024). Enforcement of the 2002 Forest Code remains constrained by governance challenges and socio-economic barriers (Gonzalez, 2018). Similar patterns emerged in the Katanga Copperbelt following the liberalization of the mining sector in 2002 (Cabala et al., 2017). In Tanzania, agriculture, widespread charcoal production, and weak policies limiting forest-to-farmland conversion drive extensive deforestation (Doggart et al., 2020; World Bank, 2024). According to the FAO (2021), Tanzania ranks among the top ten contributors to global forest loss. In Zimbabwe, deforestation results from agriculture, infrastructure expansion, logging, wildfires, mining, and charcoal production (Gotore et al., 2019). Additionally, wood use for tobacco curing accounts for nearly one-quarter of total deforestation (Kamnitzer, 2024). The trends identified here align with Gotore et al. (2019), indicating that deforestation, first reported in the 1990s, intensified after 2000. Such declines in forest cover undermine biodiversity, ecosystem services, and overall ecological resilience within the Zambezi ecoregion (Lisboa et al., 2024).
The ecoregion’s annual deforestation rate of 0.95% slightly exceeds Kamnitzer (2024) estimate of 0.75% for 1980–2020 and ranks higher than rates reported for some humid tropical forests, notably the Amazon (0.30%), Southeast Asia (0.31%), and the Congo Basin (0.56%) between 2000 and 2020 (FAO, 2021). While methodological differences partially explain these disparities, dry tropical forests are inherently prone to climatic variability and susceptible to drought stress, which can amplify anthropogenic impacts (Timberlake and Chidumayo, 2011). National-level deforestation rates mirror these overarching trends, surpassing 1% per year in many countries. Malawi’s 2.07% aligns with (FAO, 2021) estimates for 2010–2020. Burundi’s 1.92% moderately corresponds to Depicker et al. (2021) estimate of 1.6% for 1958–2016. Zimbabwe’s 1.57% is close to the UNDP’s (2022) rate of 1.9% between 2000 and 2010, while Tanzania’s 1.06% approximates FAO’s (2021) 0.88%.
Conversely, Mozambique’s 0.92% is higher than Cianciullo et al.’s (2023) 0.23% for 2000–2016 but closer to FAO’s (2021) 0.59%. Zambia’s 0.93% annual rate falls within (Phiri et al., 2019) 0.54%–3.05% bracket, yet surpasses FAO’s (2021) 0.41% for primary forests alone. Angola’s 0.83% aligns with FAO’s general range of 0.74%–0.80% for 2000–2020 (FAO, 2021). Meanwhile, southeastern DRC’s rate of 0.72% is about double the national 0.38% reported by (Eba’a Atyi et al., 2022) between 2001 and 2019. These apparent discrepancies stem from differing definitions, methodologies, and time frames, yet the overarching pattern of forest contraction remains consistent.
Landscape configuration analysis at both the ecoregional and national scales reveals a substantial decline in forest cover, primarily driven by suppression, fragmentation, and dissection processes. Suppression, often triggered by conversion to agriculture or built-up areas, leads to biodiversity loss and facilitates the spread of invasive species (Ribeiro et al., 2020). Fragmentation and dissection—driven by infrastructure development—are particularly pronounced in mining and agricultural areas (Mwitwa et al., 2012), increasing habitat isolation, disrupting ecosystems, and affecting vulnerable species (Khoji et al., 2023). Numerous studies in southeastern DRC corroborate these findings (Khoji et al., 2024; Useni et al., 2024a; Mpanda et al., 2022).
Furthermore, the sustained decline in the Largest Patch Index (LPI) highlights significant forest fragmentation, often attributed to expanding road networks for transporting agricultural and mineral products (Khoji et al., 2023). Such fragmentation undermines regional biodiversity (Lisboa et al., 2024). Similar patterns are observed in southeastern DRC and Zambia, where mining exerts additional fragmentation pressures (Mwitwa et al., 2012).
These multiple pressures contribute to increasing instability within forest ecosystems, often manifested as a gradual erosion of ecological resilience. This instability is evident in the decline of stable forest cover between 2000 and 2023, which compromises essential ecosystem functions, including carbon sequestration, hydrological regulation, and soil erosion control (Ryan et al., 2016).
Although large areas of forest have been lost, data from multiple localities also indicate pockets of forest regeneration. This regeneration capacity, particularly notable in Miombo woodlands, is attributed to species' resprouting and recovery abilities (Montfort et al., 2021; N’tambwe et al., 2024). However, the rate of natural regeneration lags behind forest clearing, particularly in regions where small-scale agriculture and fuelwood harvesting quickly disturb regenerating stands (Ryan et al., 2016). Consequently, the ability of these regenerating forests to restore ecological balance remains constrained.
4.3 Implications for forest management in the Zambezi ecoregion
Our findings confirm a pronounced reduction in forest cover throughout the Zambezi ecoregion, driven by high deforestation rates and intensifying fragmentation. Nonetheless, we identified instances of relative stability and regeneration, albeit insufficient to reverse net losses. On one side, persistent anthropogenic pressures weaken the ecological resilience and service provision of these forests, which support over 100 million people (Dewees et al., 2010). On the other hand, the inherent capacity of Miombo woodlands to regenerate (Montfort et al., 2021; N’tambwe et al., 2024), remains a positive factor. However, the progress of natural succession remains hindered by ongoing land-use demands (Khoji et al., 2023). Alleviating these pressures is essential for maintaining forest viability.
Adherence to SADC’s forest conservation objectives (SADC, 2023) is paramount. Enhancing local community participation in forest governance fosters ownership and accountability. For example, the Wildlife Conservation Society’s projects in Tanzania’s Ruaha-Katavi corridor combine forest restoration with alternative livelihoods—beekeeping, livestock health improvements—to produce long-term economic benefits (Kamnitzer, 2024). SADC’s policies also advocate integrated monitoring frameworks to safeguard Miombo ecosystems, although consistent implementation remains challenging without coordinated oversight (SADC, 2023). Establishing dedicated committees to track compliance and progress could improve outcomes.
Rehabilitating degraded landscapes demands both natural and assisted regeneration, building on successful experiences like those in Niger, Mali, and Senegal (Reij and Garrity, 2016). Reforestation with fast-growing native species can further enhance carbon storage, soil health, and biodiversity (Kyalamakasa et al., 2021). In addition, agricultural policies must reconcile food security with resource conservation. Conservation agriculture, emphasizing minimal soil disturbance, permanent ground cover, and crop rotation, can prevent further conversion of forests (Gliessman, 2018). This approach is particularly pertinent in nations where agriculture spans large proportions of land, as in Burundi (83%), Malawi (64%), and Mozambique (53%) (World Bank, 2024). Agroecological practices trialed in Malawi’s Nkhotakota region have notably supported biodiversity protection while sustaining yields (Pangapanga-Phiri et al., 2024).
For countries heavily dependent on tobacco, such as Zimbabwe, Malawi, and Tanzania, diversifying cropping systems and adopting agroforestry practices help reduce wood consumption for curing while improving land productivity. In the North Kivu region of eastern DRC, for instance, integrating Tephrosia vogelii has boosted soil fertility and mitigated erosion (Dumont et al., 2015). Charcoal dependence, closely linked to limited electrification, highlights the need to scale up renewable energy sources like solar and biogas (World Bank, 2024). Studies suggest that increasing renewables correlates positively with forest conservation (Ponce et al., 2021). Curbing the impacts of urbanization involves promoting sustainable urban planning and expanding protected areas, as demonstrated by Angola, where 10% of national territory is under protection (Planet Protected, 2024).). Such efforts include creating buffer zones and urban parks, following successful models in Addis Ababa (Ethiopia) or Cali (Colombia) (McCarthy, 2022). In mining areas like Zambia and southeastern DRC, sustainable mining practices—site rehabilitation, environmental impact mitigation, and responsible waste management—are essential. The “Forest Smart” framework from PROFOR (2016) offers a notable model that integrates forest stewardship within mining operations.
Finally, while this study quantified deforestation dynamics in the Zambezi ecoregion, it did not identify the specific drivers responsible for forest loss, thereby limiting a comprehensive understanding of the processes underpinning this decline. Nonetheless, it offers a robust foundation for exploring deforestation drivers, using spatiotemporal data and fragmentation indicators that can be employed to model anthropogenic impacts and inform the sustainable management of forest ecosystems.
5 Conclusion
This study quantified the spatiotemporal dynamics of forests in the Zambezi ecoregion from 2000 to 2023 by integrating Landsat imagery classified using the Random Forest algorithm, Geographic Information Systems, and landscape structure indices. The findings confirm a significant decline in forest cover, with an annual deforestation rate of 0.95%, along with increased fragmentation, as evidenced by a rising number of patches and a decrease in the largest patch index. Anthropogenic pressures are reflected in forest patch suppression and dissection processes. Additionally, similar deforestation trends were observed across all countries, with particularly high rates in those characterized by very high population density, limited electricity access, and extensive agricultural land, such as Malawi, Burundi, and Zimbabwe. These results indicate that forest cover in the Miombo ecoregion is under increasing pressure, driving its deforestation. By providing a detailed analysis of deforestation and fragmentation dynamics at the Miombo ecoregion scale, this study makes a valuable contribution to current knowledge. However, it is limited by its focus on deforestation without incorporating specific drivers of forest loss and degradation.
Despite these limitations, the findings underscore the urgency of developing regional forest restoration strategies, including natural regeneration, reforestation, and ecologically sustainable agricultural practices. The identified constraints highlight the need for further research on the underlying drivers of deforestation and forest degradation in the Zambezi ecoregion to enhance the understanding of disturbances affecting these forests.
Data availability statement
The raw data supporting the conclusions of this article will be made available by the authors, without undue reservation.
Author contributions
HK: Conceptualization, Data curation, Formal Analysis, Investigation, Methodology, Resources, Software, Visualization, Writing – original draft, Writing – review and editing. D-dN: Writing – original draft. FM: Writing – review and editing. JB: Conceptualization, Data curation, Funding acquisition, Methodology, Project administration, Supervision, Validation, Writing – original draft, Writing – review and editing. YU: Conceptualization, Data curation, Methodology, Project administration, Resources, Supervision, Validation, Writing – original draft, Writing – review and editing.
Funding
The author(s) declare that financial support was received for the research and/or publication of this article. The research was funded by the Academy for Research and Higher Education, Commission for Development Cooperation-CONV-21-519 (Belgium).
Acknowledgments
The authors acknowledge the Academy of Research and Higher Education (ARES) and the Research Project for Development: “Strengthening the capacity for sustainable management of miombo woodlands by assessing the environmental impact of charcoal production and improving practices towards forest resources (PRD CHARLU)” for financial support for this study through the doctoral scholarship awarded to Dieu-donné N’tambwe Nghonda and Héritier Khoji Muteya.
Conflict of interest
The authors declare that the research was conducted in the absence of any commercial or financial relationships that could be construed as a potential conflict of interest.
Generative AI statement
The author(s) declare that Gen AI was used in the creation of this manuscript. to enhance text readability and correct language usage.
Publisher’s note
All claims expressed in this article are solely those of the authors and do not necessarily represent those of their affiliated organizations, or those of the publisher, the editors and the reviewers. Any product that may be evaluated in this article, or claim that may be made by its manufacturer, is not guaranteed or endorsed by the publisher.
References
Aleman, J. C., Jarzyna, M. A., and Staver, A. C. (2018). Forest extent and deforestation in tropical Africa since 1900. Nat. Ecol. Evol. 2, 26–33. doi:10.1038/s41559-017-0406-1
Bey, A., Sánchez-Paus Díaz, A., Maniatis, D., Marchi, G., Mollicone, D., Ricci, S., et al. (2016). Collect Earth: land use and land cover assessment through augmented visual interpretation. Remote Sens. 8, 807. doi:10.3390/rs8100807
Bogaert, J., Barima, Y. S. S., Ji, J., Jiang, H., Bamba, I., Mongo, L. I. W., et al. (2011). “A methodological framework to quantify anthropogenic effects on landscape patterns,” in Landscape ecology in asian cultures. Editors S.-K. Hong, J.-E. Kim, J. Wu, and N. Nakagoshi (Tokyo: Springer Japan), 141–167. doi:10.1007/978-4-431-87799-8_11
Bogaert, J., Ceulemans, R., and Salvador-Van Eysenrode, D. (2004). Decision tree algorithm for detection of spatial processes in landscape transformation. Environ. Manag. 33, 62–73. doi:10.1007/s00267-003-0027-0
Burel, F., and Baudry, J. (2012). Tec & Doc , 12e tirage. 12th Edn. Ecologie du Paysage: Concepts, Méthodes et Applications. Paris, France.
Cabala, K. S., Useni, S. Y., Kouagou, R. S., Bogaert, J., and Munyemba, K. F. (2017). Dynamique des écosystémes forestiers de I’Arc Cuprifére Katangais en République Démocratique du Congo. I. Causes, transformations spatiales et ampleur. Tropicultura 35, 192–202. Available online at: https://hdl.handle.net/2268/228884.
Chidumayo, E. N. (2013). Forest degradation and recovery in a miombo woodland landscape in Zambia: 22 years of observations on permanent sample plots. For. Ecol. Manag. 291, 154–161. doi:10.1016/j.foreco.2012.11.031
Chirwa, P., Syampungani, S., and Geldenhuys, C. (2008). The ecology and management of the Miombo woodlands for sustainable livelihoods in southern Africa: the case for non-timber forest products. South. For. a J. For. Sci. 70, 237–245. doi:10.2989/SF.2008.70.3.7.668
Chiteculo, V., Lojka, B., Surový, P., Verner, V., Panagiotidis, D., and Woitsch, J. (2018). Value chain of charcoal production and implications for forest degradation: case study of Bié Province, Angola. Environments 5, 113. doi:10.3390/environments5110113
Cianciullo, S., Attorre, F., Trezza, F. R., Rezende, M., Ntumi, C., Campira, J., et al. (2023). Analysis of land cover dynamics in Mozambique (2001–2016). Rend. Fis. Acc. Lincei 34, 81–92. doi:10.1007/s12210-023-01133-9
Crowley, M. A., and Cardille, J. A. (2020). Remote Sensing’s recent and future contributions to landscape ecology. Curr. Landsc. Ecol. Rep. 5, 45–57. doi:10.1007/s40823-020-00054-9
De Cauwer, V., Knox, N., Kobue-Lekalake, R., Lepetu, J., Matenanga, O., Naidoo, S., et al. (2018). Woodland resources and management in southern Africa. Biodivers. Ecol. 6, 296–308. doi:10.7809/b-e.00337
de Haulleville, T., Rakotondrasoa, O. L., Rakoto Ratsimba, H., Bastin, J.-F., Brostaux, Y., Verheggen, F. J., et al. (2018). Fourteen years of anthropization dynamics in the Uapaca bojeri Baill. forest of Madagascar. Landsc. Ecol. Eng. 14, 135–146. doi:10.1007/s11355-017-0340-z
Depicker, A., Jacobs, L., Mboga, N., Smets, B., Van Rompaey, A., Lennert, M., et al. (2021). Historical dynamics of landslide risk from population and forest-cover changes in the Kivu Rift. Nat. Sustain 4, 965–974. doi:10.1038/s41893-021-00757-9
Dewees, P. A., Campbell, B. M., Katerere, Y., Sitoe, A., Cunningham, A. B., Angelsen, A., et al. (2010). Managing the miombo woodlands of southern Africa: policies, incentives and options for the rural poor. J. Nat. Resour. Policy Res. 2, 57–73. doi:10.1080/19390450903350846
Doggart, N., Morgan-Brown, T., Lyimo, E., Mbilinyi, B., Meshack, C. K., Sallu, S. M., et al. (2020). Agriculture is the main driver of deforestation in Tanzania. Environ. Res. Lett. 15, 034028. doi:10.1088/1748-9326/ab6b35
Dumont, E. S., Bonhomme, S., and Sinclair, F. (2015). Guide Technique d’Agroforesterie Pour la Selection et la Gestion des Arbres au Nord-Kivu - République Démocratique du Congo (RDC). Available online at: http://worldagroforestrycentre.org.
Eba’a Atyi, R., Hiol HiolF, F., Lescuyer, G., Mayaux, P., Defourny, P., Bayol, N., et al. (2022). Les forêts du bassin du Congo: État des Forêts 2021. Center for International Forestry Research (CIFOR). doi:10.17528/cifor/008565
FAO (2021). Évaluation des ressources forestières mondiales 2020. Rome, Italy: FAO. Available online at: https://openknowledge.fao.org/handle/20.500.14283/ca9825fr (Accessed October 10, 2024).
Fichera, C. R., Modica, G., and Pollino, M. (2012). Land Cover classification and change-detection analysis using multi-temporal remote sensed imagery and landscape metrics. Eur. J. Remote Sens. 45, 1–18. doi:10.5721/EuJRS20124501
Foody, G. M. (2023). Remote sensing in landscape ecology. Landsc. Ecol. 38, 2711–2716. doi:10.1007/s10980-023-01753-4
Gliessman, S. (2018). Defining agroecology. Agroecol. Sustain. Food Syst. 42, 599–600. doi:10.1080/21683565.2018.1432329
Gondwe, M. F., Cho, M. A., Chirwa, P. W., and Geldenhuys, C. J. (2019). Land use land cover change and the comparative impact of co-management and government-management on the forest cover in Malawi (1999-2018). J. Land Use Sci. 14, 281–305. doi:10.1080/1747423X.2019.1706654
Gonzalez, M. E. (2018). “Ahtziri,” in Droits en RDC: Quels sont les obstacles ? CIFOR-ICRAF Forests News. Available online at: https://forestsnews.cifor.org/57434/droits-en-rdc-quels-sont-les-obstacles?fnl=en (Accessed January 8, 2025).
Gorelick, N., Hancher, M., Dixon, M., Ilyushchenko, S., Thau, D., and Moore, R. (2017). Google Earth engine: Planetary-scale geospatial analysis for everyone. Remote Sens. Environ. 202, 18–27. doi:10.1016/j.rse.2017.06.031
Gotore, T., Muchawona, A., Murepa, R., Tembani, M., Mutete, P., Muchena, R., et al. (2019). Drivers of deforestation and forest degradation in Zimbabwe.
Gould, W. A., Álvarez-Berríos, N. L., Parrotta, J. A., and McGinley, K. (2024). “Chapter 10 - climate change and tropical forests,” in Future forests. Editor S. G. McNulty (Elsevier), 203–219. doi:10.1016/B978-0-323-90430-8.00012-5
Hansen, M. C., Potapov, P. V., Moore, R., Hancher, M., Turubanova, S. A., Tyukavina, A., et al. (2013). High-resolution global maps of 21st-Century forest cover change. Science 342, 850–853. doi:10.1126/science.1244693
Hubau, W., Lewis, S. L., Phillips, O. L., Affum-Baffoe, K., Beeckman, H., Cuní-Sanchez, A., et al. (2020). Asynchronous carbon sink saturation in African and Amazonian tropical forests. Nature 579, 80–87. doi:10.1038/s41586-020-2035-0
Imam, E. (2019). Remote sensing and GIS Module: Colour composite images and visual image interpretation. Remote Sens. GIS. Available online at: https://epgp.inflibnet.ac.in/.
Jew, E. K. K., Dougill, A. J., Sallu, S. M., O’Connell, J., and Benton, T. G. (2016). Miombo woodland under threat: Consequences for tree diversity and carbon storage. For. Ecol. Manag. 361, 144–153. doi:10.1016/j.foreco.2015.11.011
Kabulu, D. J.-P., Vranken, I., Bastin, J.-F., Malaisse, F., Nyembwe, N. S., Useni, S. Y., et al. (2018). “Approvisionnement en charbon de bois des ménages lushois: quantités, alternatives et conséquences,” in Anthropisation des paysages katangais. Editors J. Bogaert, G. Colinet, and G. Mahy (Liège, Belgique: Presses Universitaires de Liège), 297–311.
Kalaba, F. K. (2016). Barriers to policy implementation and implications for Zambia’s forest ecosystems. For. Policy Econ. 69, 40–44. doi:10.1016/j.forpol.2016.04.004
Kamnitzer, R. (2024). Meet the Miombo, the largest forest you’ve never heard of. Mongabay Environ. News. Available online at: https://news.mongabay.com/2024/09/meet-the-miombo-the-largest-forest-youve-never-heard-of/(Accessed December 12, 2024).
Khoji, M. H., Mpanda, M. M., Kipili, M. I., Malaisse, F., N’tambwe, N. D., Kasanda, M. N., et al. (2024). Protected area creation and its limited effect on deforestation: insights from the Kiziba-Baluba hunting domain (DR Congo). Trees, For. People 18, 100654. doi:10.1016/j.tfp.2024.100654
Khoji, M. H., N’Tambwe, D.-D., Malaisse, F., Waselin, S., Sambiéni, K. R., Cabala, K. S., et al. (2022). Quantification and simulation of landscape anthropization around the mining agglomerations of southeastern Katanga (DR Congo) between 1979 and 2090. Land 11, 850. doi:10.3390/land11060850
Khoji, M. H., N’Tambwe, N. D.-D., Mwamba, K. F., Strammer, H., Munyemba, K. F., Malaisse, F., et al. (2023). Mapping and quantification of miombo deforestation in the lubumbashi charcoal production basin (DR Congo): spatial extent and changes between 1990 and 2022. Land 12, 1852. doi:10.3390/land12101852
Krebber, D., and Marcon, E. (2023). Le rôle de la biodiversité dans la réponse des forêts tropicales au climat. Rome, Italy: FAO. Available online at: https://agris.fao.org/search/en/providers/122439/records/6582ec09de2dcdb4f674e2ee (Accessed December 19, 2024).
Kyalamakasa, J. M. K., Mulambi, M. M. M., Mukonzo, E. K. L., Shutcha, M. N., Tekeu, H., Nkombe, A. K., et al. (2021). Early selection of tree species for regeneration in degraded woodland of southeastern Congo basin. Forests 12, 117. doi:10.3390/f12020117
Lisboa, N. S., Grinand, C., Betbeder, J., Montfort, F., and Blanc, L. (2024). Disentangling the drivers of deforestation and forest degradation in the Miombo landscape: a case study from Mozambique. Int. J. Appl. Earth Observation Geoinformation 130, 103904. doi:10.1016/j.jag.2024.103904
Malaisse, F. (2010). How to live and survive in Zambezian open forest (Miombo ecoregion). Les Press. Agron. Gembloux Gembloux 23, 91–97. Available online at: https://hdl.handle.net/2268/220735
Masolele, R. N., Marcos, D., De Sy, V., Abu, I.-O., Verbesselt, J., Reiche, J., et al. (2024). Mapping the diversity of land uses following deforestation across Africa. Sci. Rep. 14, 1681. doi:10.1038/s41598-024-52138-9
McCarthy, J. (2022). 8 façons dont les villes peuvent aider à préserver notre planète. Glob. Citiz. Available online at: https://www.globalcitizen.org/fr/content/how-cities-are-protecting-the-environment/(Accessed December 31, 2024).
McGarigal, K. (2013). “Landscape pattern metrics,” in Encyclopedia of Environmetrics (John Wiley & Sons, Ltd). doi:10.1002/9780470057339.val006.pub2
McGarigal, K. (2015). FRAGSTATS help. Amherst, MA, USA: University of Massachusetts, 182. Available online at: http://www.umass.edu/landeco/research/fragstats/documents/fragstas.help.
McSweeney, C., New, M., Lizcano, G., and Lu, X. (2010). The UNDP climate change country profiles: improving the accessibility of observed and projected climate information for studies of climate change in developing countries. Bull. Am. Meteorological Soc. 91, 157–166. doi:10.1175/2009bams2826.1
Mgunda, T. (2023). Saving Africa’s miombo woodlands. Dialogue earth. Available online at: https://dialogue.earth/en/forests/saving-africas-miombo-forest/(Accessed April 20, 2025).
Montfort, F., Nourtier, M., Grinand, C., Maneau, S., Mercier, C., Roelens, J.-B., et al. (2021). Regeneration capacities of woody species biodiversity and soil properties in Miombo woodland after slash-and-burn agriculture in Mozambique. For. Ecol. Manag. 488, 119039. doi:10.1016/j.foreco.2021.119039
Mpanda, M. M., Khoji, M. H., N’Tambwe, N. D.-D., Sambiéni, K. R., Malaisse, F., Cabala, K. S., et al. (2022). Uncontrolled exploitation of pterocarpus tinctorius Welw. And associated landscape dynamics in the kasenga territory: case of the rural area of Kasomeno (DR Congo). Land 11, 1541. doi:10.3390/land11091541
Mwitwa, J., German, L., Muimba-Kankolongo, A., and Puntodewo, A. (2012). Governance and sustainability challenges in landscapes shaped by mining: mining-forestry linkages and impacts in the Copper Belt of Zambia and the DR Congo. For. Policy Econ. 25, 19–30. doi:10.1016/j.forpol.2012.08.001
Nduwarugira, D., Mpawenayo, B., and Roisin, Y. (2017). The role of high termitaria in the composition and structure of the termite assemblage in Miombo woodlands of southern Burundi. Insect Conservation Divers. 10, 120–128. doi:10.1111/icad.12207
Nelson, M. D., Garner, J. D., Tavernia, B. G., Stehman, S. V., Riemann, R. I., Lister, A. J., et al. (2021). Assessing map accuracy from a suite of site-specific, non-site specific, and spatial distribution approaches. Remote Sens. Environ. 260, 112442. doi:10.1016/j.rse.2021.112442
Nkengurutse, J., Khalid, A., Mzabri, I., Kakunze, A. C., Masharabu, T., and Berrichi, A. (2016). Germination optimization study of five indigenous fabaceae tree species from Burundi miombo woodlands. J. Mater. Environ. Sci. 7, 4391–4402.
N’tambwe, N. D., Khoji, M. H., Salomon, W., Cuma, M. F., Malaisse, F., Ponette, Q., et al. (2024). Floristic diversity and natural regeneration of miombo woodlands in the rural area of lubumbashi, D.R. Congo. Diversity 16, 405. doi:10.3390/d16070405
Nzunda, E. F., and Midtgaard, F. (2019). Deforestation and loss of bushland and grassland primarily due to expansion of cultivation in mainland Tanzania (1995–2010). J. Sustain. For. 38, 509–525. doi:10.1080/10549811.2019.1598437
Olander, L. P., Gibbs, H. K., Steininger, M., Swenson, J. J., and Murray, B. C. (2008). Reference scenarios for deforestation and forest degradation in support of REDD: a review of data and methods. Environ. Res. Lett. 3, 025011. doi:10.1088/1748-9326/3/2/025011
Olofsson, P., Foody, G. M., Herold, M., Stehman, S. V., Woodcock, C. E., and Wulder, M. A. (2014). Good practices for estimating area and assessing accuracy of land change. Remote Sens. Environ. 148, 42–57. doi:10.1016/j.rse.2014.02.015
Olofsson, P., Foody, G. M., Stehman, S. V., and Woodcock, C. E. (2013). Making better use of accuracy data in land change studies: estimating accuracy and area and quantifying uncertainty using stratified estimation. Remote Sens. Environ. 129, 122–131. doi:10.1016/j.rse.2012.10.031
Pacheco, P., Mo, K., Dudley, N., Shapiro, A., Aguilar-Amuchastegui, N., Ling, P. Y., et al. (2021). Deforestation fronts: drivers and responses in a changing world. Gland, Switzerland: WWF. Available online at: https://files.worldwildlife.org/wwfcmsprod/files/Publication/file/ocuoxmdil_Deforestation_fronts___drivers_and_responses_in_a_changing_world___full_report__1_.pdf.
Pangapanga-Phiri, I., Ngoma, H., and Thierfelder, C. (2024). Understanding sustained adoption of conservation agriculture among smallholder farmers: insights from a sentinel site in Malawi. Renew. Agric. Food Syst. 39, e10. doi:10.1017/S1742170524000061
Paradis, E. (2021). Forest gains and losses in Southeast Asia over 27 years: the slow convergence towards reforestation. For. Policy Econ. 122, 102332. doi:10.1016/j.forpol.2020.102332
Parmar, A., Katariya, R., and Patel, V. (2019). “A review on random forest: an ensemble classifier,” in International conference on intelligent data communication technologies and internet of things (ICICI) 2018. Editors J. Hemanth, X. Fernando, P. Lafata, and Z. Baig (Cham: Springer International Publishing), 758–763. doi:10.1007/978-3-030-03146-6_86
Phan, T. N., Kuch, V., and Lehnert, L. W. (2020). Land cover classification using Google Earth engine and random forest classifier—the role of image composition. Remote Sens. 12, 2411. doi:10.3390/rs12152411
Phiri, D., Morgenroth, J., and Xu, C. (2019). Four decades of land cover and forest connectivity study in Zambia—an object-based image analysis approach. Int. J. Appl. Earth Observation Geoinformation 79, 97–109. doi:10.1016/j.jag.2019.03.001
Planet Protected (2024). Discover the world’s protected and conserved areas. Available online at: https://www.protectedplanet.net/en (Accessed December 16, 2024).
Polisi, A., Jumaine, H., Agostini, P., Migraine, J. B., Vaislic, M. D. H., Ntahorwaymiye, A. C., et al. (2017). Burundi–Country environmental analysis: understanding the environment within the dynamics of a complex world: Linkages to Fragility, conflict, and climate change. Washington, DC, USA: World Bank Group. Available online at: https://policycommons.net/artifacts/1429496/burundi-country-environmental-analysis/2045273/(Accessed November 28, 2024).
Ponce, P., Del Río-Rama, M. de la C., Álvarez-García, J., and Oliveira, C. (2021). Forest conservation and renewable energy consumption: an ARDL approach. Forests 12, 255. doi:10.3390/f12020255
Pontius, R. G., and Millones, M. (2011). Death to Kappa: birth of quantity disagreement and allocation disagreement for accuracy assessment. Int. J. Remote Sens. 32, 4407–4429. doi:10.1080/01431161.2011.552923
Potapov, P., Hansen, M. C., Pickens, A., Hernandez-Serna, A., Tyukavina, A., Turubanova, S., et al. (2022). The global 2000-2020 land cover and land use change dataset derived from the Landsat archive: first results. Front. Remote Sens. 3, 1–22. doi:10.3389/frsen.2022.856903
Potapov, P. V., Turubanova, S. A., Hansen, M. C., Adusei, B., Broich, M., Altstatt, A., et al. (2012). Quantifying forest cover loss in Democratic Republic of the Congo, 2000–2010, with Landsat ETM+ data. Remote Sens. Environ. 122, 106–116. doi:10.1016/j.rse.2011.08.027
Probst, P., Wright, M. N., and Boulesteix, A.-L. (2019). Hyperparameters and tuning strategies for random forest. WIREs Data Min. Knowl. Discov. 9, e1301. doi:10.1002/widm.1301
PROFOR (2016). Get forest Smart: PROFOR 2016 annual report | profor. Washington, DC: World Bank. Available online at: http://www.profor.info/sites/profor.info/files/PROFOR_AR2016_CRA_webFinal.pdf (Accessed December 31, 2024).
Reij, C., and Garrity, D. (2016). Scaling up farmer-managed natural regeneration in Africa to restore degraded landscapes. Biotropica 48, 834–843. doi:10.1111/btp.12390
Ribeiro, N. S., Katerere, Y., Chirwa, P. W., and Grundy, I. M. (2020). Miombo woodlands in a changing environment: Securing the resilience and sustainability of people and woodlands. Springer Nature.
Ribeiro, N. S., Syampungani, S., Matakala, N. M., Nangoma, D., and Ribeiro-Barros, A. I. (2015). “Miombo woodlands research towards the sustainable use of ecosystem services in southern Africa,” in Biodiversity in ecosystems - linking structure and function. Editors Y.-H. Lo, J. A. Blanco, and S. Roy (Rijeka, Croatie: InTech), 475–491. doi:10.5772/59288
Ryan, C. M., Pritchard, R., McNicol, I., Owen, M., Fisher, J. A., and Lehmann, C. (2016). Ecosystem services from southern African woodlands and their future under global change. Philosophical Trans. R. Soc. B Biol. Sci. 371, 20150312. doi:10.1098/rstb.2015.0312
SADC (2002). Protocole sur la Foresterie. Afr. Reg. Bodies · South. Afr. Dev. Community (SADC). Available online at: https://africanlii.org/akn/aa-sadc/act/protocol/2002/forestry/fra%402002-10-03?utm_source=chatgpt.com (Accessed December 23, 2024).
SADC (2010). SADC forestry Strategy 2010 - 2020: making forests work for the economic development of the region. Available online at: https://www.sadc.int/sites/default/files/2021-11/SADC_Forestry_Strategy_2010-2020-English.pdf.
SADC (2022). Maputo declaration on sustainable and integrated management of miombo woodlands. Available online at: https://mta.gov.mz/wp-content/uploads/2022/08/Miombo-Declaration_Maputo.pdf.
SADC (2023). Sadc countries commit to preservation of vast dryland forest. Chron. Available online at: https://www.chronicle.co.zw/sadc-countries-commit-to-preservation-of-vast-dryland-forest/(Accessed December 12, 2024).
Sarre, A. (2020). Global forest resources assessment 2020. Rome, Italy: Food and Agriculture Organization of the United Nations FAO. doi:10.4060/ca8753en
Timberlake, J., and Chidumayo, E. N. (2011). Miombo ecoregion vision report 2001 (rev. August 2011). Available online at: https://library.wur.nl/ojs/index.php/Botswana_documents/article/view/15975 (Accessed December 8, 2023).
UNDP (2022). Keeping our forests alive and thriving. Zimbabwe: UNDP. Available online at: https://www.undp.org/zimbabwe/news/keeping-our-forests-alive-and-thriving (Accessed October 11, 2024).
Useni, S. Y., Cabala, K. S., Halleux, J. M., Bogaert, J., and Munyemba, K. F. (2018). Caractérisation de la croissance spatiale urbaine de la ville de Lubumbashi (Haut-Katanga, R.D. Congo) entre 1 989 et 201 4. Tropicultura 36, 99–108. Available online at: https://hdl.handle.net/2268/223010.
Useni, S. Y., Khoji, M. H., and Bogaert, J. (2020). Miombo woodland, an ecosystem at risk of disappearance in the Lufira Biosphere Reserve (Upper Katanga, DR Congo)? A 39-years analysis based on Landsat images. Glob. Ecol. Conservation 24, 1–15. doi:10.1016/j.gecco.2020.e01333
Useni, S. Y., Kipili Mwenya, I., Khoji Muteya, H., Malaisse, F., Cabala, K. S., and Bogaert, J. (2024a). Anthropogenic pressures and spatio-temporal dynamics of forest ecosystems in the rural and border municipality of Kasenga (DRC). Landsc. Ecol. Eng. 20, 195–212. doi:10.1007/s11355-023-00589-z
Useni, S. Y., Malaisse, F., Cabala, K. S., Munyemba, K. F., and Bogaert, J. (2017). Le rayon de déforestation autour de la ville de Lubumbashi (HautKatanga, R.D. Congo): synthèse. Tropicultura 35, 215–221. doi:10.25518/2295-8010.1277
Useni, S. Y., Mpanda, M. M., Malaisse, F., and Bogaert, J. (2024b). Investigating of spatial urban growth pattern and associated landscape dynamics in Congolese mining cities bordering Zambia from 1990 to 2023. Resources 13, 107. doi:10.3390/resources13080107
Useni, S. Y., Mpanda, M. M., Malaisse, F., Kazaba, K. P., and Bogaert, J. (2023). The spatiotemporal changing dynamics of miombo deforestation and illegal human activities for forest fire in kundelungu national park, democratic republic of the Congo. Fire 6, 1–21. doi:10.3390/fire6050174
World Bank (2024). World Bank open data. World Bank. Open Data. Available online at: https://data.worldbank.org (Accessed December 16, 2024).
Wulder, M. A., Roy, D. P., Radeloff, V. C., Loveland, T. R., Anderson, M. C., Johnson, D. M., et al. (2022). Fifty years of Landsat science and impacts. Remote Sens. Environ. 280, 113195. doi:10.1016/j.rse.2022.113195
Keywords: Miombo woodlands, ecosystem disturbance, land-use change, forest management, Environmental restoration
Citation: Khoji Muteya H, N’tambwe Nghonda D-d, Malaisse F, Bogaert J and Useni Sikuzani Y (2025) Mapping and quantifying deforestation in the Zambezi ecoregion of Central-Southern Africa: extent and spatial structure. Front. Remote Sens. 6:1590591. doi: 10.3389/frsen.2025.1590591
Received: 09 March 2025; Accepted: 23 April 2025;
Published: 09 May 2025.
Edited by:
Jean-Pierre Wigneron, Institut National de recherche pour l’agriculture, l’alimentation et l’environnement (INRAE), FranceReviewed by:
Ruyin Cao, University of Electronic Science and Technology of China, ChinaValentine Sollier, INRAE Nouvelle-Aquitaine Bordeaux, France
Copyright © 2025 Khoji Muteya, N’tambwe Nghonda, Malaisse, Bogaert and Useni Sikuzani. This is an open-access article distributed under the terms of the Creative Commons Attribution License (CC BY). The use, distribution or reproduction in other forums is permitted, provided the original author(s) and the copyright owner(s) are credited and that the original publication in this journal is cited, in accordance with accepted academic practice. No use, distribution or reproduction is permitted which does not comply with these terms.
*Correspondence: Héritier Khoji Muteya, a2hvamkubXV0ZXlhQHVuaWx1LmFjLmNk