 Junjie Hu1,2,3
 Bo Gao1,2,3*
 Hao Ma4Huili Gong1,2,3*Yuanyuan Liu5*Jiahao Liu1,2,3Yinchuan Feng1,2,3Heping Lin1,2,3Ziteng Wang1,2,3
- 1Key Laboratory of Land Subsidence Mechanism and Mitigation, Ministry of Education, Capital Normal University, Beijing, China
- 2College of Resource Environment and Tourism, Capital Normal University, Beijing, China
- 3Beijing Laboratory of Water Resources Security, Capital Normal University, Beijing, China
- 4Northwest Surveying and Planning Institute of National Forestry and Grassland Administration, Xi’an, China
- 5Comprehensive Survey Command Center for Natural Resources, China Geological Survey, Beijing, China
Introduction: To address the spatiotemporal discontinuities in Moderate Resolution Imaging Spectroradiometer (MODIS) surface reflectance time series caused by cloud contamination, snow cover, and sensor limitations, this study proposes an an optimized RTLSR inversion strategy with dynamiclly adjusted of multi-surface parameters.
Methods: The method specifically aims to improve surface reflectance reconstruction accuracy in seasonally snow-covered regions and regions with significant vegetation phenological changes. To enhance the quality control of input data, the conventional NDVI threshold-based snow masking approach was replaced with the more rigorous “Internal Snow Mask” from the MOD09GA product. Additionally, vegetation indices exhibiting higher saturation resistance—namely the Enhanced Vegetation Index (EVI) and Leaf Area Index (LAI)—were adopted in place of NDVI to better characterize surface reflectance variations during significant phenological transitions.
Results: Experiments conducted in East and South Asia show that in seasonally snow-covered regions (e.g., eastern Tibetan Plateau and parts of northern Asia), RMSE reductions of 5.8%–7.1% are achieved in visible bands (Band1, Band3, Band4). Across the entire study area, the average RMSE across all MODIS bands (Band1–7) is reduced by 4.5%, with notable improvements in vegetation-sensitive near-infrared bands: Band2 and Band5 exhibit RMSE decreases of 14.3% and 6.3%, respectively. Compared with the MCD43A1 product, the proposed method demonstrates superior spatiotemporal continuity in mid- to low-latitude monsoon regions during summer and autumn, achieving a 9.77% increase in annual data availability.
Discussion: These results indicate that the improved approach effectively fills gaps in surface reflectance time series in persistently cloudy regions and offers a reliable complementary solution to existing MODIS products.
1 Introduction
In the face of increasingly severe global climate change and ecological challenges, there is an urgent need for more frequent and accurate quantitative monitoring of the Earth’s surface to assess the impacts of climate change and dynamic changes in ecosystems (Running et al., 1999; Huete et al., 2011). In this context, remote sensing technology provides an efficient and extensively scalable tool, enabling long-term and continuous observation of the Earth’s surface on a global scale (Wu and Zhang, 2017). Surface reflectance data represent key parameters in remote sensing for characterizing land surface features and directly influence the quantification of various land surface variables (Xiao et al., 2015). Over the past 2 decades, NASA’s MODIS has generated one of the most comprehensive global remote sensing datasets for land monitoring, providing near-daily global coverage at spatial resolutions of 250 m, 500 m, and 1 km (Justice et al., 2002). Among these, MODIS surface reflectance data have been widely applied in regional and global land surface change monitoring due to their high temporal resolution, long time series, and extensive coverage (Liang et al., 2024). However, limitations associated with sensor performance, as well as interference from clouds, aerosols, and snow, result in extensive data gaps in optical remote sensing products. These gaps not only prevent complete spatial and temporal coverage in specific regions or periods but also lead to discontinuities when utilizing these data (Cihlar et al., 1997; Li et al., 2009; Lin et al., 2014; Shen et al., 2015). Consequently, developing effective techniques for reconstructing missing information in remote sensing data can enhance data continuity and provide more accurate and complete inputs for subsequent analyses, thereby meeting multidisciplinary research needs.
In recent years, image processing-based methods have been extensively employed to reconstruct missing information in remote sensing imagery from sensors such as Landsat and MODIS. These approaches typically restore missing data by exploiting spatial similarity or temporal autocorrelation within the images and have achieved significant success (Yu et al., 2011; Zhu et al., 2012; Lin et al., 2014; Cao et al., 2020; Wang et al., 2024). However, most of these methods primarily rely on statistical patterns and struggle to incorporate the underlying physical processes governing surface reflectance. Consequently, they often have limitations in terms of physical consistency and interpretability.
In contrast, semi-empirical kernel-driven models based on surface bidirectional reflectance offer clearer physical interpretations. In practical applications, the MODIS team developed an algorithm to derive the Bidirectional Reflectance Distribution Function (BRDF). This algorithm effectively fills data gaps by utilizing sun-view geometry information from cloud-free observations. Centered on the semi-empirical RossThick-LiSparse Reciprocal (RTLSR) kernel-driven model, this method estimates pixel-level BRDF parameters (Schaaf et al., 2002). Over the past 2 decades, this approach has facilitated the generation of global BRDF parameter products characterized by strong representativeness and continuity (Bright and Astrup, 2019; Tang et al., 2020). However, in persistently cloudy regions—such as the monsoon-affected areas of South and Southeast Asia—the limited number of available cloud-free observations often prevents the RTLSR-based method from performing optimally. These limitations are also evident in the MODIS BRDF products (Schaaf, 2021).
Building upon the semi-empirical kernel-driven model’s characterization of BRDF physical mechanisms, (Vermote et al., 2009) proposed an algorithm that utilizes NDVI to represent variations in BRDF shape. Although early studies on the Anisotropy Flatness Index (AFX) indicated that NDVI does not reliably reflect the anisotropic characteristics of surface reflectance under all conditions (Jiao et al., 2014; Zhang et al., 2016; Zhang et al., 2018), Franch et al. (2014) demonstrated that NDVI could still function effectively as a normalized intermediate parameter within kernel-driven models, enabling the successful derivation of albedo across different temporal and spatial resolutions.
Building upon this foundation, researchers integrated soil moisture (SM) and NDVI into the RTLSR framework, proposing a multi-parameter dynamically adjusted RTLSR model (hereafter RTLSR_MP) to mitigate limitations of the original approach (Gao et al., 2020). Within the RTLSR architecture, RTLSR_MP dynamically incorporates NDVI and SM to derive time-varying BRDF parameters. This enhances the model’s capacity to capture anisotropic reflectance variations induced by surface changes—particularly under persistent cloud cover—while improving the spatiotemporal continuity of surface reflectance data through high-quality driving datasets. Studies demonstrate that the RTLSR_MP-based retrieval method achieves relatively high accuracy across East and South Asia, with a root mean square error percentage (RMSE%) of 9.8%.
Although the RTLSR_MP-based surface reflectance retrieval method has yielded promising results, its performance requires further improvement in seasonally snow-covered regions (Yoon et al., 2022) and areas experiencing significant vegetation phenological changes. In snow-affected areas, the model lacks rigorous snow masking protocols, failing to adequately control snow contamination in input data. Instead, it relies on simplistic NDVI thresholds (NDVI <0) to exclude snow-contaminated pixels (Hall et al., 1995)—an operationally convenient but accuracy-limited approach requiring further validation. In regions with significant vegetation phenological changes, particularly within near-infrared bands, the model exhibits limited capacity to dynamically track surface reflectance variations. This constraint likely stems from NDVI saturation effects under dense vegetation conditions (Tang and Min, 1998; Huete et al., 2002; Wang et al., 2003; Li et al., 2007; Li et al., 2010; Gao et al., 2023), potentially introducing parameter biases that compromise retrieval accuracy.
To address the aforementioned limitations, this study conducts MODIS time series reconstruction experiments across East and South Asia and proposes targeted optimization strategies. First, to enhance retrieval accuracy in seasonally snow-covered regions, we implement rigorous snow masking using the “Internal Snow Mask” bitmask from MOD09GA—replacing the original NDVI threshold approach—to achieve precise control of snow contamination. The efficacy of this enhanced masking is systematically evaluated against the baseline method. Second, to address inaccuracies arising from NDVI saturation in regions with significant vegetation phenological changes, we adopt the Enhanced Vegetation Index (EVI)—which demonstrates higher saturation resistance (Wang et al., 2003)—and the Leaf Area Index (LAI)—which directly quantifies biophysical properties including canopy structure and leaf area (Fu et al., 2017)—as replacements for NDVI within the RTLSR_MP framework.
To systematically elaborate on the theoretical basis and practical effectiveness of the proposed optimization strategies, the structure of this paper is arranged as follows: Section 2 introduces the RTLSR model and the RTLSR_MP model adopted in this study, along with the experimental workflow for filling daily surface reflectance gaps based on the model. Section 3 describes the study areas and the datasets used. Section 4 presents the experimental results of the improved RTLSR_MP model over East and South Asia, with a particular focus on evaluating the performance of optimization strategies in seasonally snow-covered regions and areas with significant vegetation phenological variation. The optimal reconstruction results are also compared with the MCD43A1 product for validation. Section 5 discusses the practical contributions of the proposed optimization methods.Finally, Section 6 summarizes the main findings, outlines the current limitations, and provides perspectives for future research.
2 Theory and experiments
2.1 RTLSR model
The RTLSR model is the core algorithm used for generating the MODIS BRDF/Albedo products. The principle for retrieving BRDF parameters is as follows: for each pixel, multi-angle valid observations acquired within a 16-day moving window are used to fit a linear combination of three kernel functions—an isotropic kernel, the Ross_Thick volumetric scattering kernel, and the Li_Sparse-Reciprocal geometric-optical kernel—using the least squares method. This fitting process enables the estimation of directional reflectance parameters for the pixel (Li and Strahler, 1986; Roujean et al., 1992; Schaaf and Strahler, 1993). The mathematical formulation of this process is expressed as:
In Equation 1,
The Ross_Thick kernel is a semi-empirical kernel used in BRDF models to describe the volumetric scattering component of surface reflectance (Roujean et al., 1992). It characterizes the volumetric scattering effect caused by multiple scattering within dense vegetation canopies. Its mathematical expression is as follows:
In Equations 2, 3,
The Li_Sparse Reciprocal kernel is another key component in semi-empirical kernel-driven BRDF models, used to characterize the geometric-optical scattering effects of sparse vegetation or surface structures (Li et al., 1992; Wanner et al., 1995). It is derived from the proportion of illuminated to shaded areas in a scene consisting of randomly placed ellipsoidal tree crowns, where the tree crown shape is defined by the crown height h and the ratio of the vertical to horizontal crown b/r. Its mathematical expression is as follows:
In Equation 4, the MODIS BRDF Albedo algorithm, the tree crown center height is assumed to be 2b, and the horizontal crown radius is b. The angles
2.2 RTLSR_MP model
Ideally, BRDF modeling of the surface should be based on multi-angle satellite observations of the same target pixel at the same moment in time. However, in practical applications, the RTLSR model approximates this ideal observation condition by utilizing multi-temporal observations of the same pixel within a given time window from the MODIS sensor. This approach has two main limitations: first, it assumes that the structural and optical properties of the land surface target remain unchanged within the inversion time period; second, to obtain sufficient bidirectional observations for inverting BRDF kernel coefficients, multiple high-quality observations must be accumulated within a relatively short period (Vermote et al., 2009). Vermote’s study found that the normalized BRDF kernel coefficients can be linearly related to NDVI (Vermote et al., 2009), and later, Franch et al. validated the empirical relationship between spectral reflectance and NDVI (Franch et al., 2019). Based on this, Gao et al. further integrated soil moisture (SM) and NDVI into the RTLSR model, proposing the RTLSR_MP model.The formula is expressed as follows:
In Equation 5, the formula,
Compared with the approach of Franch et al. (2014), who used NDVI and the normalized forms of
2.3 Experimental procedure
For the improved method, the RTLSR_MP model is used to fill daily surface reflectance gaps. The specific workflow (see Figure 1) is as follows.
1. Data Quality Control: Using quality control bands from MODIS observation data (e.g., the “Internal Snow Mask” bitmask in MOD09GA data), preprocess the surface reflectance bands into daily cloud-free, snow-free surface reflectance data and input these into the RTLSR_MP model.
2. Kernel Calculation: Based on the solar observation geometry information provided by MODIS, calculate the volume scattering kernel and geometric-optical kernel values for each pixel according to Equations 2–4, and input them into the model. (Note: no angular filtering was performed on the data.)
3. Kernel Coefficient Modeling: According to Equation 6, express the volume scattering kernel coefficient and geometric-optical kernel coefficient as linear functions of soil moisture (SM) data and vegetation parameters (NDVI, EVI, or LAI), then input these into the model.
4. Parameter Estimation: For the pixels to be filled, when the number of coincident input data within the inversion period (1 year is uniformly adopted as the inversion period in this study to cover complete phenological variation) is greater than or equal to 10, run the model inversion to solve for the model parameters a0, a1, a2 and a3.
5. Surface Reflectance Filling: Finally, based on Equation 5, the daily gap-filled surface reflectance is reconstructed using the derived model parameters together with SM data and vegetation parameters.
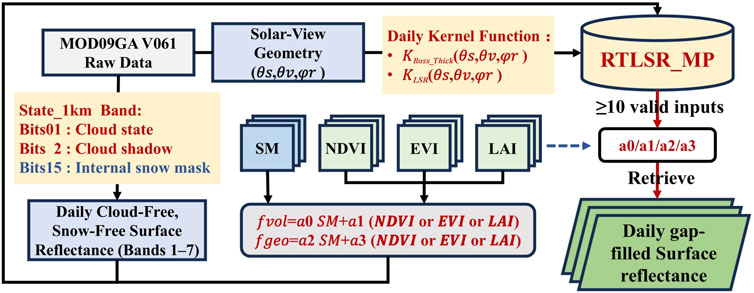
Figure 1. Technical workflow diagram.
For comparative analysis, the snow pixel removal method based on the NDVI threshold (NDVI <0) and the improved method incorporating the “Internal Snow Mask” snow mask are denoted as RTLSR_MP(NDVI) and RTLSR_MP*(NDVI), respectively. Correspondingly, the two improved models driven by EVI and LAI are denoted as RTLSR_MP*(EVI) and RTLSR_MP*(LAI).
3 Study area and data
3.1 Study area
The study area covers parts of East Asia and South Asia, spanning longitudes 73.05°E to 136.00°E and latitudes 15.05°N to 50.00°N, as shown in Figure 2. This region experiences significant seasonal climate variations, characterized by cold and dry winters and hot, humid summers, strongly influenced by the East Asian monsoon. The land cover types are diverse and complex, mainly including deciduous broadleaf forests, evergreen broadleaf forests, mixed forests, grasslands, sparse savannas, croplands, and areas of seasonal snow cover, with pronounced phenological changes and distinct snow seasons. Due to the frequent changes in land surface conditions and the significant influence of clouds, snow, and phenology on remote sensing observations, this region provides favorable experimental conditions for evaluating the adaptability of BRDF inversion models and optimization strategies.
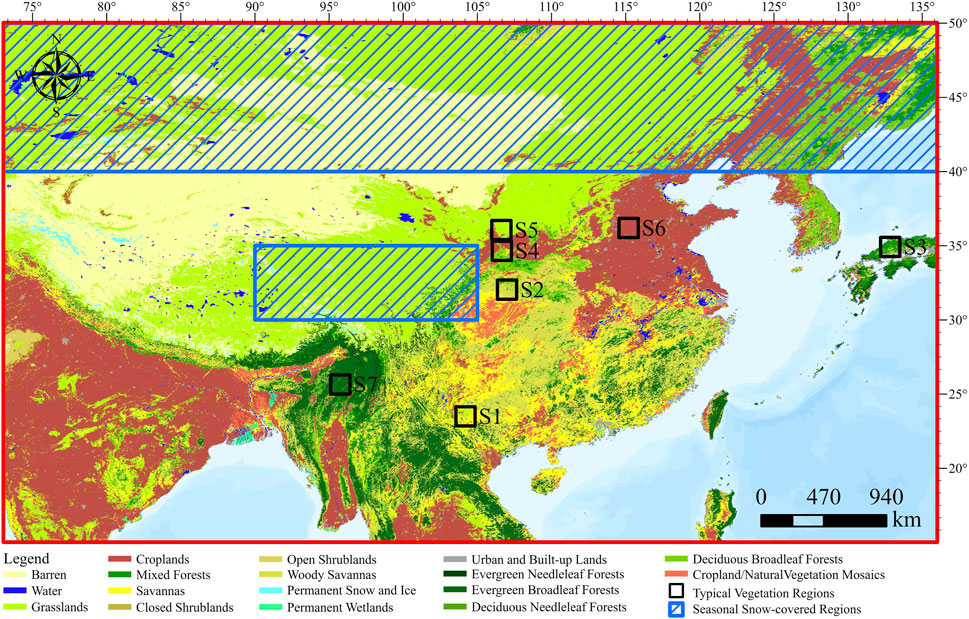
Figure 2. Study area.
To enhance the comparative analysis of the experimental results, in addition to evaluating the overall model inversion performance across the entire study area, this paper also selects representative sample plots of major vegetation types and two typical seasonal snow-covered regions within the area as key objects of analysis. The basic information of the seven representative vegetation sample plots is shown in Table 1.
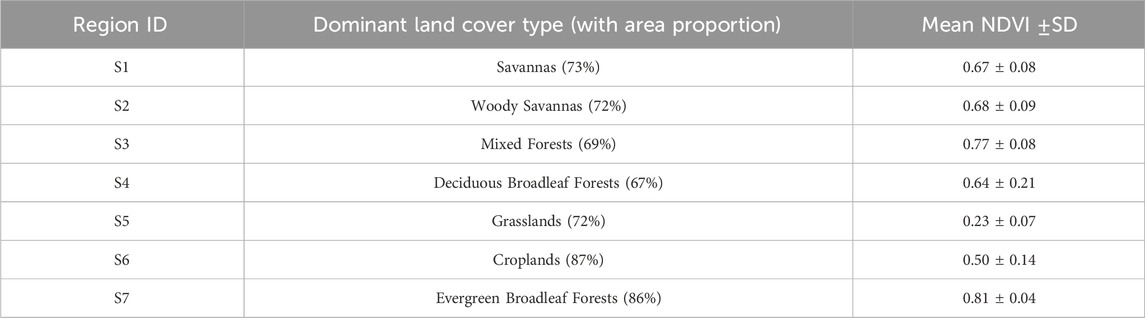
Table 1. Basic information about the seven typical vegetation regions (including region ID, dominant vegetation types and their proportions, as well as the mean and standard deviation of NDVI in 2020).
3.2 Data
To enable spatiotemporally continuous MODIS surface reflectance inversion across RTLSR_MP variants, input driving data with robust spatiotemporal continuity are essential. For efficient construction of continuous vegetation parameters (NDVI/EVI/LAI), this study employs the HANTS-GEE scalable software package (Zhou et al., 2023) on Google Earth Engine. Using MOD13Q1, MYD13Q1, and MOD15A3H products, harmonic analysis was applied to generate daily 2020 NDVI/EVI/LAI datasets. Their reconstruction efficacy has been validated in prior studies (Zhou et al., 2021; Zhou et al., 2023). Soil moisture data were sourced from the GRNN-based product developed by Cui et al. (2019), which integrates multi-source remote sensing data (MOD11C1, MOD13C1, 30-m SRTM DEM, and ECV soil moisture).
To standardize data scales and minimize errors from heterogeneous coordinate systems, all input datasets underwent uniform preprocessing. Specifically, data were projected to the WGS84 geographic coordinate system and resampled to a consistent 0.01-degree spatial resolution. Details of the input data specifications are summarized in Table 2.
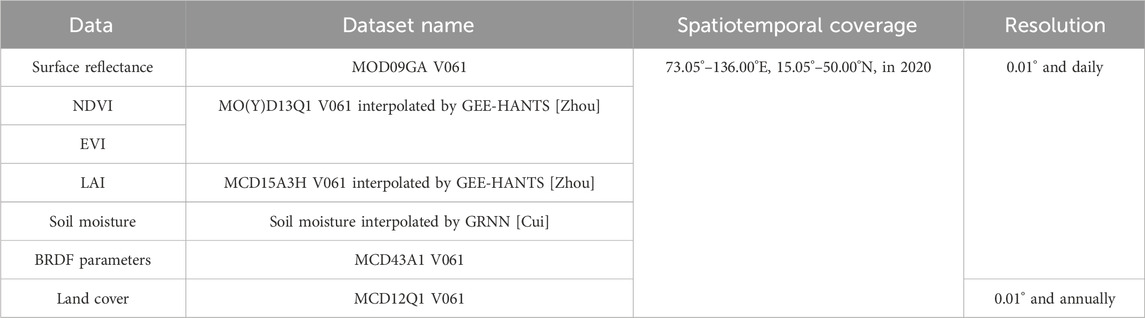
Table 2. Experimental data.
4 Result
4.1 Evaluation of reconstruction efficiency
In this study, the Root Mean Square Error (RMSE) serves as the primary metric for evaluating model accuracy. The formula is as follows:
In Equation 7, n represents the number of samples, i.e., the number of pixels within the selected area. Pi denotes the surface reflectance value retrieved by the model, while Oi represents the actual valid observed surface reflectance value from MOD09GA. RMSE provides a measure of the overall error between the inversion results and the actual valid observations. A smaller RMSE value indicates that the inversion results are closer to the true observations and that the accuracy is higher. To ensure the stability of RMSE and avoid bias caused by insufficient valid observations, the RMSE for a given day is excluded if the proportion of valid MOD09GA observation pixels meeting the conditions of “cloud-free, shadow-free, snow-free, and good quality” is less than 2% of the total pixels.
Considering that different gap-filling methods may not be applicable to all pixels in practical applications, this study introduces the metric of “filling rate” to evaluate the reconstruction efficiency of each method. The filling rate is defined as the ratio of the number of valid pixels successfully simulated by the model to the total number of pixels in the study area. The calculation formula is as follows:
In Equation 8,
4.2 Improved RTLSR_MP in seasonally snow-covered regions
To evaluate the impact of the enhanced snow masking strategy on surface reflectance retrieval accuracy, this study implemented both the baseline RTLSR_MP(NDVI) method and the improved RTLSR_MP*(NDVI) method incorporating MODIS Internal Snow Mask for reconstructing MODIS band 1-7 surface reflectance throughout 2020. Figure 3 displays the spatial distribution of RMSE results for visible bands (Band1, Band3, and Band4).
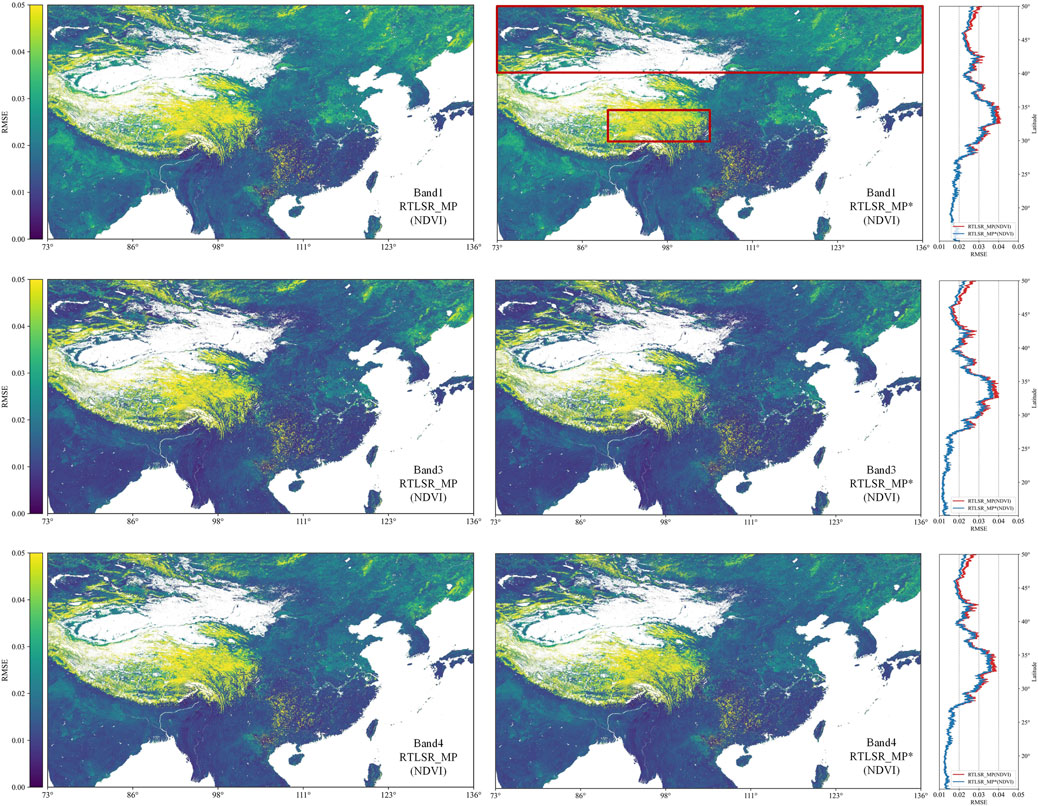
Figure 3. Spatial distribution and latitude profiles of RMSE in visible bands (Band1, Band3, Band4) for RTLSR_MP(NDVI) and RTLSR_MP*(NDVI) methods.
By comparing the results shown in Figure 3, we found that both the RTLSR_MP (NDVI) and RTLSR_MP* (NDVI) methods exhibited an overall “low-high-low” trend in RMSE values across the study area as latitude increased. The regions with relatively higher RMSE were mainly concentrated on the Qinghai-Tibet Plateau and mid-to-high latitude seasonally snow-covered regions. Compared to the RTLSR_MP (NDVI) method, the RTLSR_MP* (NDVI) method achieved lower RMSE values in the mid-to-high latitude seasonally snow-covered regions, while both methods showed similar accuracy in low latitude regions. This indicates that stricter data quality control can effectively improve the accuracy of surface reflectance retrieval in seasonally snow-covered regions.
After presenting the spatial distribution characteristics of RMSE for the two methods, this study further quantitatively compared the fitting accuracy of surface reflectance for MODIS bands 1–7 between the RTLSR_MP (NDVI) and RTLSR_MP* (NDVI) methods over the entire study area and within seasonally snow-covered regions (see Table 3). The results show that RTLSR_MP* (NDVI) outperformed RTLSR_MP (NDVI) at both scales.
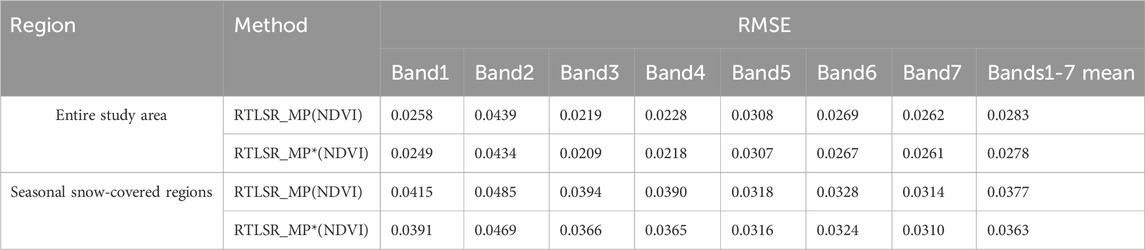
Table 3. RMSE and mean RMSE statistics for MODIS Bands 1–7 using RTLSR_MP(NDVI) and RTLSR_MP(NDVI) methods in the entire study area and seasonal snow-covered regions.
Across the entire study area, the RTLSR_MP* (NDVI) method achieved slightly lower RMSE values in all bands compared to RTLSR_MP (NDVI), with the average RMSE for bands Band1–Band7 decreasing from 0.0283 to 0.0278, representing a 1.77% reduction. This indicates that, even in the absence of explicit snow mask information, the quality control strategy based on NDVI thresholding for snow pixel removal still has some applicability under an overall acceptable error margin.
In the seasonally snow-covered regions, the advantage of the improved model was more pronounced. The average RMSE of RTLSR_MP* (NDVI) decreased from 0.0377 to 0.0363, a reduction of 3.71%. Notably, in the visible bands (Band1, Band3, and Band4), the accuracy improvements were even more significant: RMSE reductions of 3.5%, 4.6%, and 4.4% respectively across the full study area, and 5.8%, 7.1%, and 6.4% within the snow-covered regions. This demonstrates that the RTLSR_MP* (NDVI) model, constructed by integrating MOD09GA snow mask information, effectively enhances model stability and accuracy in areas strongly affected by snow dynamics.
However, these results also reflect limitations of the RTLSR_MP (NDVI) method when dealing with complex snow conditions. For example, when snow cover is thin or vegetation protrudes through the snow layer, vegetation’s near-infrared reflectance significantly raises the pixel’s NIR value, causing NDVI to increase and possibly approach zero or even become positive (Klein et al., 1998). Additionally, the coarse spatial resolution of MODIS imagery means that a single pixel may be a mixture of snow, vegetation, and bare soil, further causing shifts and uncertainty in NDVI values (Salomonson and Appel, 2004). Under such circumstances, relying solely on NDVI-based snow pixel removal for quality control is limited and may fail to accurately identify and exclude snow interference, thereby impacting model inversion accuracy.
4.3 Improved RTLSR_MP in regions with significant vegetation phenological changes
To address the limited inversion accuracy of previous methods in regions with significant vegetation phenological changes, this study attempts to replace NDVI with EVI and LAI—vegetation parameters that better reflect phenological variations and are less affected by saturation effects—as the driving factors in the model. Table 4 presents the RMSE and average RMSE of the model for bands Band 1 through Band 7 under the three different vegetation parameter drivers.
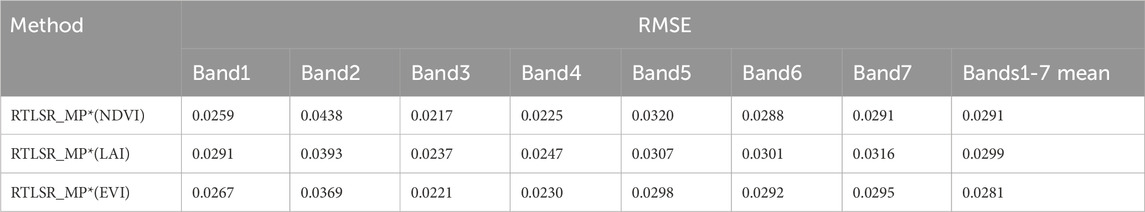
Table 4. RMSE and mean RMSE statistics for MODIS Bands 1–7 using RTLSR_MP*(NDVI) 、RTLSR_MP*(LAI) and RTLSR_MP*(EVI) methods.
The results show that among the three parameters, the RTLSR_MP* (EVI) method driven by EVI achieves the lowest average RMSE, which is approximately 3.43% lower than the average RMSE of the NDVI-driven model (0.0291). Conversely, the LAI-driven model exhibits a higher average RMSE than the NDVI-driven one, with an increase of about 3.1%. Examining performance across individual bands, the EVI-driven model shows slightly higher RMSE in the non-near-infrared bands compared to the NDVI-driven model, but in the near-infrared bands (Band2 and Band5), which are more sensitive to vegetation changes, the RMSE decreases by 15.8% and 6.9%, respectively, demonstrating a clear advantage. The LAI-driven model also shows RMSE reductions of 10.3% and 4.1% in bands Band 2 and Band 5, respectively. Although its overall RMSE is slightly higher than the NDVI-driven model, it similarly displays better adaptability in the near-infrared bands. These results indicate that in spectral bands with high vegetation sensitivity, EVI and LAI can provide more accurate driving information as vegetation parameters, while in bands with lower vegetation sensitivity, the NDVI-driven model still holds certain advantages.
It is noteworthy that although both EVI and LAI can mitigate the saturation effect of NDVI to some extent, the EVI-driven model performs better overall. This is mainly attributed to EVI’s higher sensitivity and signal-to-noise ratio in areas of dense vegetation. The calculation of EVI relies on blue, red, and near-infrared reflectance from MODIS’s high-quality atmospheric correction products, which ensures good consistency and stability (Didan, 2021). In contrast, although LAI has a clear biophysical meaning, its retrieval depends on complex processes involving multi-band radiative transfer models and lookup tables (LUTs), including multivariate inputs, structure type identification, and fitting discrimination (Myneni et al., 2021) This makes LAI more susceptible to surface heterogeneity and observation conditions, resulting in higher uncertainty. Moreover, the original LAI time series usually exhibit strong fluctuations before HANTS interpolation, with limited usable data points. Consequently, the interpolation may fail to accurately restore phenological trends (Zhou et al., 2023), thereby affecting its stability as a driving factor and the model’s accuracy.
The above statistical results reflect the overall accuracy differences among the models driven by different vegetation parameters. To further explore how these differences distribute across vegetation types, this study presents the spatial distribution of RMSE for the RTLSR_MP model driven by the three parameters in the near-infrared band (Band2), and summarizes the overall accuracy differences across seven typical vegetation types in the study area, as shown in Figure 4.
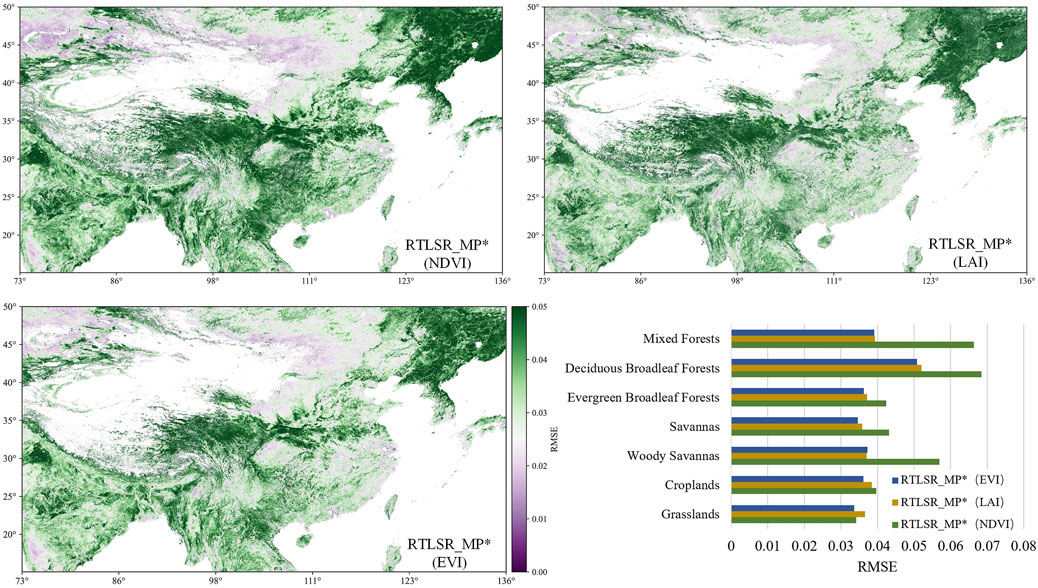
Figure 4. Spatial distribution of RMSE in MODIS Band2 and accuracy statistics across seven typical vegetation types for RTLSR_MP*(NDVI), RTLSR_MP*(LAI), and RTLSR_MP*(EVI) methods.
From the overall spatial distribution, the RTLSR_MP* (EVI) method shows relatively lower inversion accuracy mainly concentrated in regions with dense vegetation cover, such as the Indian Peninsula, Southeast Asia, and southern and northeastern China. Both RTLSR_MP* (EVI) and RTLSR_MP* (LAI) methods exhibit superior inversion performance in these areas.
According to the accuracy statistics for different typical vegetation types, the RTLSR_MP* (EVI) and RTLSR_MP* (LAI) methods show notable advantages in vegetation types with significant phenological changes. Specifically, these two methods exhibit significantly lower RMSE values than RTLSR_MP* (NDVI) in mixed forests, deciduous broadleaf forests, and woody savannas. In evergreen broadleaf forests, savannas, and croplands, their RMSEs are slightly lower than that of the NDVI-driven method. For grasslands, the RMSE values of all three methods are relatively close.
To further validate the above statistical results, this study conducted a time series and spatial distribution analysis of surface reflectance reconstruction accuracy for the three models across seven typical vegetation sample regions (S1–S7).
As shown in Figure 5, in spectral bands with low vegetation sensitivity (e.g., Band1), the RMSE time series of the three methods exhibit relatively stable performance across all sample areas, with no significant differences. However, in spectral bands with high vegetation sensitivity (e.g., Band2), the NDVI-driven model shows significantly greater fluctuations in RMSE time series compared to the EVI- and LAI-driven models in sample areas such as S1 (savanna), S2 (woody savanna), S3 (mixed forest), and S4 (deciduous broadleaf forest). In contrast, in S5 (grassland), S6 (cropland), and S7 (evergreen broadleaf forest), the time series accuracy of the three methods is relatively consistent. Overall, these results are consistent with the preceding statistical analysis.
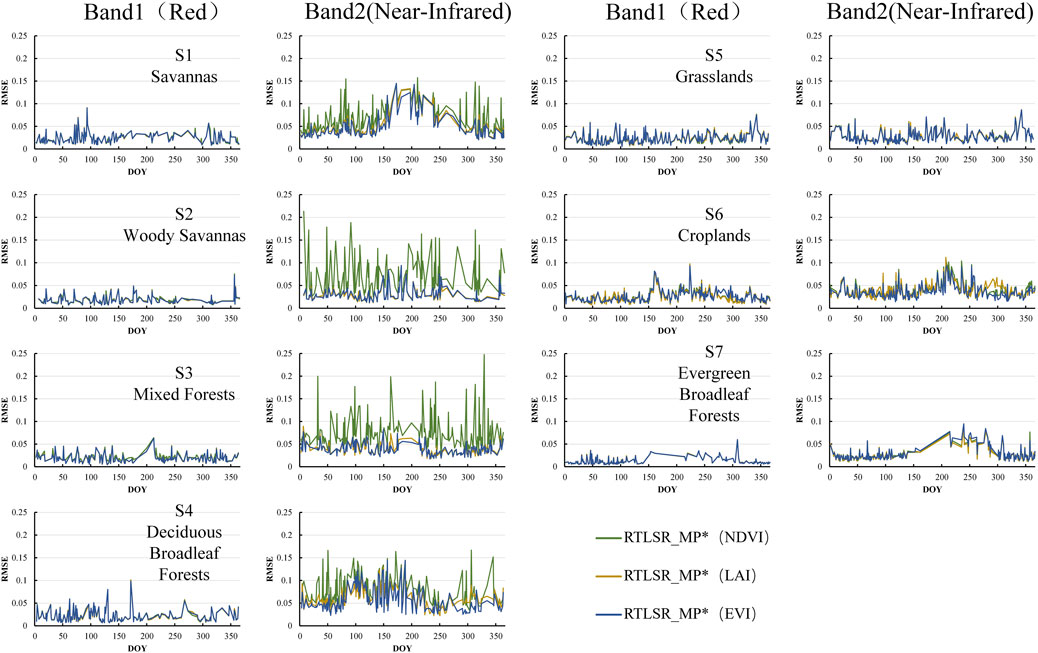
Figure 5. Time series of RMSE in MODIS Band1 and Band2 for RTLSR_MP(NDVI), RTLSR_MP(LAI), and RTLSR_MP*(EVI) methods across seven typical vegetation regions.
It should be noted that although regions S6 (cropland) and S7 (evergreen broadleaf forest) may also be affected by NDVI saturation, the three models still exhibit comparable reconstruction accuracy in these areas. This may be attributed to the following reasons: in cropland region, NDVI saturation typically occurs during the peak growing season, which is relatively short in duration and often coincides with periods of high cloud cover. As a result, the saturated observations contribute less weight to the inversion process. In the case of evergreen broadleaf forests, although the vegetation coverage is high, intra-annual variation is minimal (as shown in Table 1, the annual NDVI standard deviation is only 0.04, less than one-fifth of that in deciduous broadleaf forests), making the impact of NDVI saturation relatively weak in this vegetation type.
Figure 6 further illustrates that in typical vegetation sample regions such as S1–S4, the EVI- and LAI-driven models significantly outperform the NDVI-driven model in Band2, while in regions S5–S6, the differences among the three models are not significant (Note: The gaps observed in the RTLSR_MP*(LAI) results are caused by the failure of interpolation due to an insufficient number of valid data points in the LAI time series available for the HANTS algorithm). This further verifies, from a spatial perspective, the limitation of the NDVI-driven RTLSR_MP model in regions with significant vegetation phenological changes, where it is prone to saturation effects.
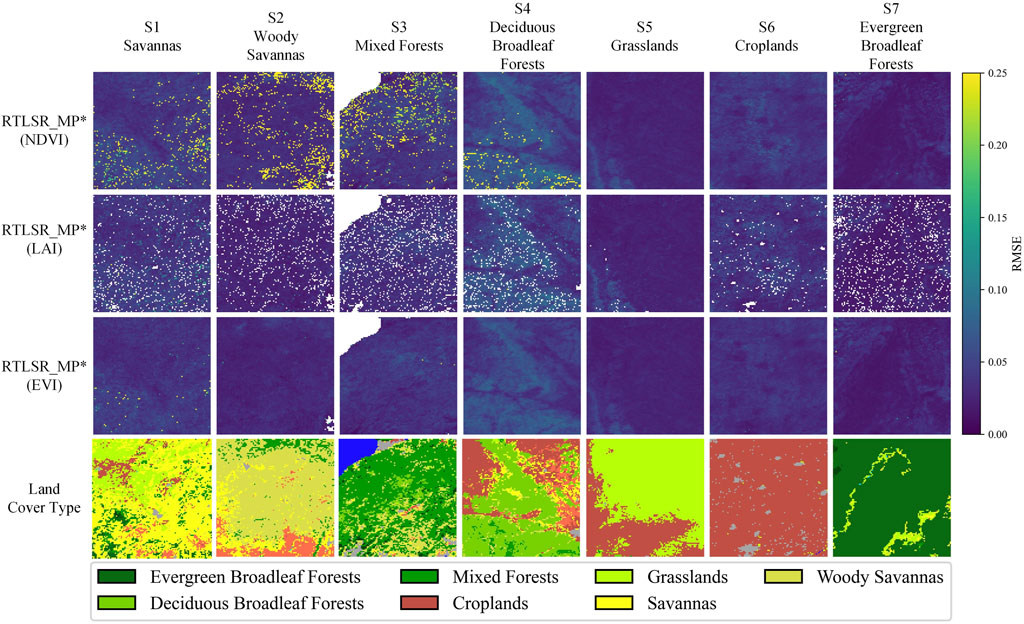
Figure 6. Spatial distribution of RMSE in MODIS Band2 for RTLSR_MP*(NDVI), RTLSR_MP*(LAI), and RTLSR_MP*(EVI) methods and land cover types of the seven typical vegetation regions.
4.4 MODIS surface reflectance reconstruction performance
Through the work presented in Sections 4.2, 4.3, the improvements in seasonally snow-covered regions and regions with significant vegetation phenological changes have been preliminarily established. Building on this, we will further evaluate the differences between the RTLSR_MP*(EVI) method, the original RTLSR_MP(NDVI) method, and the MODIS surface reflectance derived from MCD43A1 BRDF parameters.
First, an example of reconstruction performance across different seasons is shown in Figure 7. It can be observed that in southern China and the South Asia region (including the South Asian subcontinent and Southeast Asia), cloud cover dominates the imagery throughout the year. The surface reflectance derived from the MCD43A1 Full inversions parameter (Schaaf, 2021), which is based on the RTLSR model, demonstrates certain gap-filling capability in high-latitude regions but exhibits a large number of invalid pixels in mid-to low-latitude areas. The alternative MCD43A1 Magnitude inversions parameter (Strugnell and Lucht, 2001) partially complements these gaps in mid-to low-latitude regions, yet substantial data voids remain in southern China and South Asia. In contrast, both the improved RTLSR_MP*(EVI) and the original RTLSR_MP(NDVI) methods show considerable data gaps in high-latitude regions during spring and winter but outperform the MCD43A1 products in gap-filling ability at mid-to low-latitudes. Notably, in summer and autumn, the reconstruction quality of RTLSR_MP*(EVI) and RTLSR_MP(NDVI) further improves, demonstrating superior surface reflectance retrieval in these seasons.
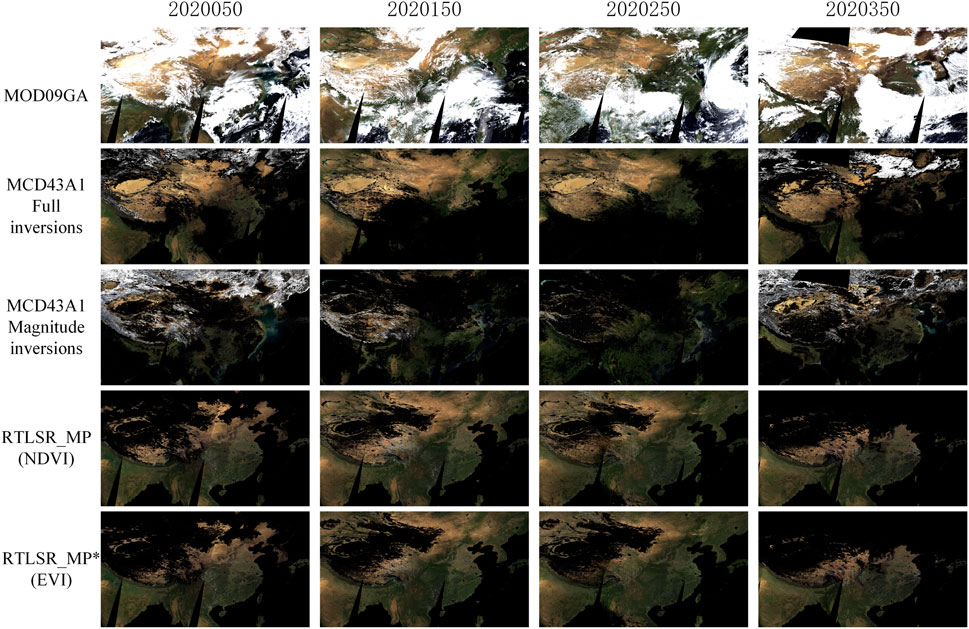
Figure 7. True-color composites (R: Band1, G: Band4, B: Band3) for different seasons in 2020 synthesized using four reconstruction methods.
As shown in Figure 8, we further quantified the time series of the fill rates in 2020 for MODIS surface reflectance reconstructed by the RTLSR_MP*(EVI) method, the original RTLSR_MP(NDVI) method, and the MCD43A1 products. The results indicate that throughout 2020, the daily filling rates of RTLSR_MP*(EVI) and RTLSR_MP(NDVI) were generally higher than those of the MCD43A1 Full inversions and MCD43A1 Magnitude inversions parameters. At the beginning and end of the year, due to the influence of snow, all four models showed relatively low filling rates (Cui et al., 2019; Schaaf, 2021). During the middle of the year, between day 125 and day 315, the filling rates of RTLSR_MP and RTLSR_MP* ranged between 70% and 80%, whereas the filling rate of the MCD43A1 Full inversions parameter significantly declined, reaching its minimum of around 40% near day 200. The filling rate of the MCD43A1 Magnitude inversions parameter fluctuated between 20% and 40% for nearly the entire year.
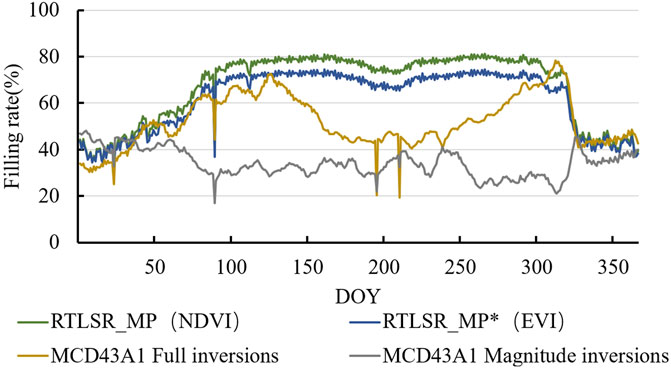
Figure 8. Time series of filling rate over seven bands under four reconstruction methods.
The MCD43A1 Full inversions parameter is derived from the RTLSR model applied over a 16-day period. Consequently, in high-latitude regions with relatively low cloud cover, sufficient valid observations (≥7) are usually available within the 16-day window to successfully drive the inversion model. However, in mid-to low-latitude regions with heavier cloud cover or during summer and autumn, the number of valid observations within 16 days often falls below this threshold (<7), resulting in missing data for the MCD43A1 Full inversions product. In such cases, valid observations fewer than 7 days can be utilized to construct the MCD43A1 Magnitude inversions parameter, which dynamically adjusts based on a prior database to partially compensate for data gaps. Nevertheless, when no valid observations are available within the 16-day period, the model cannot perform any form of inversion, leading to complete data loss for the corresponding pixels during that time interval.
Compared with the MCD43A1-based gap-filling methods, the RTLSR_MP(NDVI) and RTLSR_MP*(EVI) approaches incorporate multi-source surface parameters with stronger spatiotemporal continuity, which to some extent reduces the RTLSR model’s dependence on the number of valid observations. This relaxation of the inversion requirements allows the model to function effectively even in persistently cloudy regions or periods with fewer observations, provided the inversion window is relatively long, thereby improving the spatial coverage (Gao et al., 2020).
However, the effectiveness of this approach strongly depends on the spatiotemporal completeness and quality of the external driving parameters. When the input parameters contain substantial gaps or poor-quality data, model inversion may still fail. For example, due to widespread missing soil moisture (SM) data in high-latitude regions during winter, both RTLSR_MP*(EVI) and RTLSR_MP(NDVI) failed to perform inversions in northern parts of the study area. Similarly, in arid and desert regions of northwestern China, vegetation parameters (such as EVI or NDVI) still exhibit long periods of missing data even after interpolation using the HANTS algorithm, making inversion in these regions difficult.
Finally, to evaluate reconstruction accuracy, we used the MCD43A1 Full inversions parameter as the reference for comparing the performance of RTLSR_MP*(EVI) and RTLSR_MP(NDVI) due to its relatively high quality, consistent input data, and model similarity. The results are presented in Table 5.
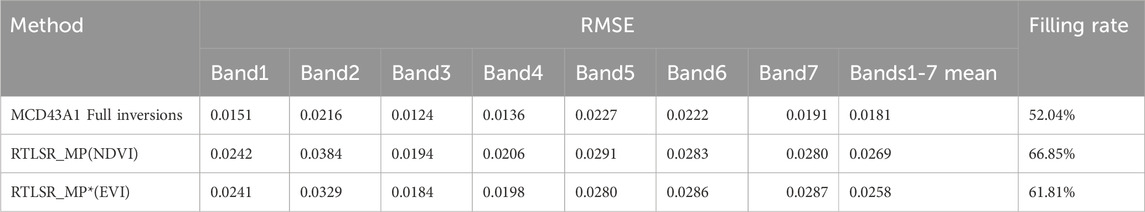
Table 5. RMSE and mean RMSE statistics for MODIS Bands 1–7 of the RTLSR_MP(NDVI), RTLSR_MP*(EVI) methods, and MCD43A1 Full inversions parameters.
The results indicate that the improved RTLSR_MP*(EVI) method achieves higher accuracy, with RMSE values across all spectral bands more closely aligned with those of the MCD43A1 Full inversions parameter. Specifically, the RTLSR_MP*(EVI) method yields an average RMSE that is 0.012 lower than that of the original RTLSR_MP(NDVI) method, representing an improvement of approximately 4.5%. The enhancements are particularly notable in vegetation-sensitive bands Band2 and Band5, where the RMSE is reduced by 0.055 (approximately 14.3%) and 0.017 (approximately 6.3%), respectively.
5 Discussion
This study targets two key regions—seasonally snow-covered areas and regions with significant vegetation phenological changes—and proposes specific improvements to the RTLSR_MP model. The reconstruction performance of the model before and after optimization is systematically evaluated. In seasonally snow-covered regions, a more stringent bitmask was introduced to exclude snow-covered pixels. Compared with the conventional NDVI threshold-based snow removal approach, the improved RTLSR_MP* method demonstrates enhanced reconstruction accuracy in the visible bands (Band1, Band3, and Band4), as evidenced by both spatial distribution and quantitative assessments. Improvements in other spectral bands were relatively limited. These results also validate the feasibility of using NDVI as a proxy indicator for snow detection in the absence of reliable snow flags. In regions with significant vegetation phenological changes, EVI and LAI were introduced as alternative driving factors to NDVI to assess their performance within the RTLSR_MP model. The results indicate that models driven by EVI and LAI exhibit a stronger response to phenological changes and better resistance to saturation effects in the near-infrared bands (Band2 and Band5). Spatiotemporal analyses of representative vegetation types and sample regions further reveal the limitations of NDVI in such areas. Although LAI outperforms NDVI in fitting near-infrared reflectance, it generally produces slightly higher RMSE values than EVI and NDVI and suffers from a greater number of missing values. This suggests that in phenologically dynamic regions, EVI is the preferred driving factor for near-infrared reflectance reconstruction, offering a favorable balance between data availability and its ability to capture seasonal variations in surface reflectance.
Compared to the traditional RTLSR approach that relies on short-period inversions, RTLSR_MP overcomes the limitations of requiring dense short-term observations and assuming static surface properties. By introducing an approximate characterization of BRDF shape variation mechanisms, the method embeds empirical representations of surface structural and phenological dynamics into the modeling framework. The core idea is to utilize the temporal dynamics of surface parameters and their linear relationship with the RTLSR model coefficients to indirectly reflect changes in surface structural properties. This enables the dynamic description of BRDF parameters under evolving vegetation conditions. In this framework, the weights of the volumetric scattering term (Kross-thick) and the geometric-optical term (KLSP) capture not only the variations in BRDF shape but also the trends in BRDF magnitude (Jiao et al., 2014; Zhang et al., 2016). The isotropic term (fiso), as a constant adjustment factor, reflects the baseline reflectance level and approximates the surface reflectance at a specific moment within the inversion period under a dual-view zenith configuration. Although this approach relaxes some of the physical assumptions required by short-term inversions, the linear kernel combination architecture of the RTLSR model and the capability of remote sensing parameters—such as vegetation indices and soil moisture—to characterize the kernel coefficients allow it to produce reliable results, as demonstrated in ESAisa experiments. Furthermore, with improved snow detection and enhanced vegetation parameter inputs, this study shows that the RTLSR_MP method maintains stable and reliable reconstruction accuracy across various long-period inversion scenarios, confirming the method’s practical applicability.
Finally, this study evaluated the practical application performance of the improved model in MODIS surface reflectance reconstruction at the regional scale. Compared to the Full Inversion and Magnitude Inversion parameters from the MCD43A1 product, the improved method demonstrated higher fill rates in mid-to low-latitude regions, showing particularly notable advantages in areas with frequent seasonal cloud cover such as South Asia and Southeast Asia. Although the method still encounters data gaps in high-latitude regions during winter and spring due to its dependence on input parameters, it significantly expands the spatial availability of MODIS surface reflectance in mid-to low-latitude areas. The results suggest that, while maintaining reconstruction accuracy within an acceptable range, the model can serve as an effective complementary approach when MCD43A1 parameters are missing.
6 Conclusion
This study proposed an optimized RTLSR_MP-based approach targeting two critical regions: seasonally snow-covered areas and regions with significant vegetation phenological changes. The method effectively improved the gap-filling accuracy of surface reflectance, with an average RMSE reduction of approximately 4.5% across bands Band1–Band7 (as shown in Table 5), and more notable improvements in vegetation-sensitive bands Band2 and B5, with reductions of about 14.3% and 6.3%, respectively. The results indicate that the quality control method based on NDVI thresholding for snow pixel removal remains practical within an acceptable error margin (Hall et al., 1995; Gao et al., 2020), although snow mask labeling offers higher precision. Among the various driving factors tested, EVI showed the best performance in capturing the seasonal dynamics of near-infrared reflectance. Regional-scale evaluation further demonstrates that, compared to the MCD43A1 product, the improved method significantly enhances the spatiotemporal availability of MODIS surface reflectance in seasonally cloudy regions such as South and Southeast Asia.
It should be noted that the current approach still relies on the spatiotemporal continuity of driving data, such as vegetation indices and soil moisture. Future work may focus on developing strategies to enhance model robustness and gap-filling capacity while reducing dependency on external inputs. Overall, the improved method effectively fills parameter gaps in long-term cloud-covered regions of MODIS data while maintaining reconstruction accuracy, offering a practical and feasible solution for the robust reconstruction of surface reflectance time series.
Data availability statement
The raw data supporting the conclusions of this article will be made available by the authors, without undue reservation.
Author contributions
JH: Data curation, Methodology, Project administration, Software, Validation, Visualization, Writing – original draft, Writing – review and editing. BG: Methodology, Project administration, Resources, Writing – review and editing, Writing – original draft. HM: Methodology, Project administration, Resources, Data curation, Validation, Writing – review and editing. HG: Conceptualization, Methodology, Project administration, Writing – review and editing. YL: Formal Analysis, Supervision, Writing – review and editing, Writing – original draft. JL: Formal Analysis, Visualization, Investigation, Writing – original draft. YF: Visualization, Writing – review and editing. HL: Investigation, Methodology, Writing – original draft. ZW: Software, Validation, Writing – original draft.
Funding
The author(s) declare that financial support was received for the research and/or publication of this article. The National Natural Science Foundation of China (Nos 42371081 and U24A20433), Self-initiated Scientific and Technological Innovation Project of the Northwest Investigation and Planning Institute of the National Forestry and Grassland Administration (No. XBY-KJCX-2024-10) and the National Natural Science Foundation of China (Nos 41501380/D0106, 41930109/D010702, 42171371, 42371089, and 42201081).
Acknowledgments
We gratefully acknowledge all team members for their valuable contributions to this work. Thanks Yaokui Cui for supporting daily soil moisture product. Special thanks are due to the editors and reviewers whose constructive criticism and expert suggestions substantially improved the manuscript’s quality and clarity.
Conflict of interest
The authors declare that the research was conducted in the absence of any commercial or financial relationships that could be construed as a potential conflict of interest.
Generative AI statement
The author(s) declare that no Generative AI was used in the creation of this manuscript.
Publisher’s note
All claims expressed in this article are solely those of the authors and do not necessarily represent those of their affiliated organizations, or those of the publisher, the editors and the reviewers. Any product that may be evaluated in this article, or claim that may be made by its manufacturer, is not guaranteed or endorsed by the publisher.
References
Bright, R. M., and Astrup, R. (2019). Combining MODIS and national land resource products to model land cover-dependent surface albedo for Norway. Remote Sens. 11 (7), 871. doi:10.3390/rs11070871
Cao, R., Chen, Y., Chen, J., Zhu, X., and Shen, M. (2020). Thick cloud removal in Landsat images based on autoregression of Landsat time-series data. Remote Sens. Environ. 249 (2020), 112001. doi:10.1016/j.rse.2020.112001
Cihlar, J., Ly, H., Li, Z., Chen, J., Pokrant, H., and Huang, F. (1997). Multitemporal, multichannel AVHRR data sets for land biosphere studies—artifacts and corrections. Remote Sens. Environ. 60 (1), 35–57. doi:10.1016/S0034-4257(96)00137-X
Cui, Y., Zeng, C., Zhou, J., Xie, H., Wan, W., Hu, L., et al. (2019). A spatio-temporal continuous soil moisture dataset over the Tibet Plateau from 2002 to 2015. Sci. Data. 6 (1), 247. doi:10.1038/s41597-019-0228-x
Didan, K. (2021). MODIS/Terra vegetation indices 16-day L3 global 250m SIN grid V061. doi:10.5067/MODIS/MOD13Q1.061
Franch, B., Vermote, E., Skakun, S., Roger, J.-C., Masek, J., Ju, J., et al. (2019). A method for Landsat and sentinel 2 (HLS) BRDF normalization. Remote Sens. 11 (6), 632. doi:10.3390/rs11060632
Franch, B., Vermote, E. F., Sobrino, J. A., Julien, Y. J. I. T. o.G., and Sensing, R. (2014). Retrieval of surface albedo on a daily basis: application to MODIS data. IEEE Trans. Geosci. Electron. 52 (12), 7549–7558. doi:10.1109/TGRS.2014.2313842
Fu, L., Qu, Y., and Wang, J. (2017). Bias analysis and validation method of the MODIS LAI product. Nat. Remote Sens. Bull. 21 (2), 206–217. doi:10.11834/jrs.20175336
Gao, B., Gong, H., Zhou, J., Wang, T., Liu, Y., and Cui, Y. (2020). Reconstruction of spatiotemporally continuous MODIS-band reflectance in East and South Asia from 2012 to 2015. Remote Sens. 12 (21), 3674. doi:10.3390/rs12213674
Gao, S., Zhong, R., Yan, K., Ma, X., Chen, X., Pu, J., et al. (2023). Evaluating the saturation effect of vegetation indices in forests using 3D radiative transfer simulations and satellite observations. Remote Sens. Environ. 295 (2023), 113665. doi:10.1016/j.rse.2023.113665
Hall, D. K., Riggs, G. A., and Salomonson, V. V. (1995). Development of methods for mapping global snow cover using moderate resolution imaging spectroradiometer data. Remote Sens. Environ. 54 (2), 127–140. doi:10.1016/0034-4257(95)00137-P
Huete, A., Didan, K., Miura, T., Rodriguez, E. P., Gao, X., and Ferreira, L. G. (2002). Overview of the radiometric and biophysical performance of the MODIS vegetation indices. Remote Sens. Environ. 83 (1), 195–213. doi:10.1016/S0034-4257(02)00096-2
Huete, A., Didan, K., van Leeuwen, W., Miura, T., and Glenn, E. (2011). “MODIS vegetation indices,” in Land remote sensing and global environmental change: NASA's Earth observing system and the science of ASTER and MODIS. Editors B. Ramachandran, C. O. Justice, and M. J. Abrams (New York: Springer), 579–602.
Jiao, Z., Hill, M. J., Schaaf, C. B., Zhang, H., Wang, Z., and Li, X. (2014). An anisotropic flat index (AFX) to derive BRDF archetypes from MODIS. Remote Sens. Environ. 141 (2014), 168–187. doi:10.1016/j.rse.2013.10.017
Justice, C. O., Townshend, J. R. G., Vermote, E. F., Masuoka, E., Wolfe, R. E., Saleous, N., et al. (2002). An overview of MODIS Land data processing and product status. Remote Sens. Environ. 83 (1), 3–15. doi:10.1016/S0034-4257(02)00084-6
Klein, A. G., Hall, D. K., and Riggs, G. A. (1998). Improving snow cover mapping in forests through the use of a canopy reflectance model. Hydrol. Process. 12 (10-11), 1723–1744. doi:10.1002/(sici)1099-1085(199808/09)12:10/11<1723::aid-hyp691>3.0.co;2-2
Li, H., Zheng, L., Lei, Y., Li, C., and Zhou, K. (2007). Comparison of NDVI and EVI based on EOS/MODIS data. Prog. Geogr. 26 (1), 26–32. doi:10.11820/dlkxjz.2007.01.003
Li, R., Zhang, X., Liu, B., and Zhang, B. (2009). Review on methods of remote sensing time-series data reconstruction. Nat. Remote Sens. Bull. 13 (2), 335–341. doi:10.11834/jrs.20090257
Li, W., Qin, Z., Li, W., and Yang, Q. (2010). Comparison and analysis of MODIS NDVI and MODIS EVI. Remote Sens. Inf. 32 (6), 73–78. doi:10.3969/j.issn.1000-3177.2010.06.016
Li, X., and Strahler, A. H. (1986). Geometric-optical bidirectional reflectance modeling of a conifer forest canopy. IEEE Trans. Geosci. Electron. GE- 24 (6), 906–919. doi:10.1109/TGRS.1986.289706
Li, X., Strahler, A. H. J. I. t.o.G., and Sensing, R. (1992). Geometric-optical bidirectional reflectance modeling of the discrete crown vegetation canopy: effect of crown shape and mutual shadowing. IEEE Trans. Geosci. Electron. 30 (2), 276–292. doi:10.1109/36.134078
Liang, X., Liu, Q., Wang, J., Chen, S., and Gong, P. (2024). Global 500 m seamless dataset (2000–2022) of land surface reflectance generated from MODIS products. Earth Syst. Sci. Data 16 (1), 177–200. doi:10.5194/essd-16-177-2024
Lin, C. H., Lai, K. H., Chen, Z. B., and Chen, J. Y. (2014). Patch-based information reconstruction of cloud-contaminated multitemporal images. IEEE Trans. Geosci. Electron. 52 (1), 163–174. doi:10.1109/TGRS.2012.2237408
Myneni, R., Knyazikhin, Y., and Park, T. (2021). MODIS/Terra+Aqua leaf area index/FPAR 4-day L4 global 500m SIN grid V061. doi:10.5067/MODIS/MCD15A3H.061
Roujean, J.-L., Leroy, M., and Deschamps, P.-Y. (1992). A bidirectional reflectance model of the Earth's surface for the correction of remote sensing data. J. Geophys. Res.:Atmos. 97 (D18), 20455–20468. doi:10.1029/92JD01411
Running, S. W., Baldocchi, D. D., Turner, D. P., Gower, S. T., Bakwin, P. S., and Hibbard, K. A. (1999). A global terrestrial monitoring network integrating tower fluxes, flask sampling, ecosystem modeling and EOS satellite data. Remote Sens. Environ. 70 (1), 108–127. doi:10.1016/S0034-4257(99)00061-9
Salomonson, V. V., and Appel, I. (2004). Estimating fractional snow cover from MODIS using the normalized difference snow index. Remote Sens. Environ. 89 (3), 351–360. doi:10.1016/j.rse.2003.10.016
Schaaf, C. a.W. Z. (2021). MODIS/Terra+Aqua BRDF/albedo model parameters daily L3 global - 500m V061. doi:10.5067/MODIS/MCD43A1.061
Schaaf, C. B., Gao, F., Strahler, A. H., Lucht, W., Li, X., Tsang, T., et al. (2002). First operational BRDF, albedo nadir reflectance products from MODIS. Remote Sens. Environ. 83 (1), 135–148. doi:10.1016/S0034-4257(02)00091-3
Schaaf, C. B., and Strahler, A. H. (1993). Solar zenith angle effects on forest canopy hemispherical reflectances calculated with a geometric-optical bidirectional reflectance model. IEEE Trans. Geosci. Electron. 31 (4), 921–927. doi:10.1109/36.239916
Shen, H., Li, X., Cheng, Q., Zeng, C., Yang, G., Li, H., et al. (2015). Missing information reconstruction of remote sensing data: a technical review. IEEE Geosci. Remote Sens. Mag. 3 (3), 61–85. doi:10.1109/MGRS.2015.2441912
Strugnell, N. C., and Lucht, W. J. J. o.C. (2001). An algorithm to infer continental-scale albedo from AVHRR data, land cover class, and field observations of typical BRDFs. J. Clim. 14 (7), 1360–1376. doi:10.1175/1520-0442(2001)014<1360:aatics>2.0.co;2
Tang, X., Bullock, E. L., Olofsson, P., and Woodcock, C. E. (2020). Can VIIRS continue the legacy of MODIS for near real-time monitoring of tropical forest disturbance? Remote Sens. Environ. 249 (2020), 112024. doi:10.1016/j.rse.2020.112024
Tang, X. j., and Min, X. j. (1998). Progress in vegetation index research. Adv. Earth Sci. 13 (4), 327–333. doi:10.3321/j.issn:1001-8166.1998.04.002
Vermote, E., Justice, C. O., and Breon, F. M. (2009). Towards a generalized approach for correction of the BRDF effect in MODIS directional reflectances. IEEE Trans. Geosci. Electron. 47 (3), 898–908. doi:10.1109/TGRS.2008.2005977
Wang, Y., Shen, H., and Li, Z. (2024). L1 regularization based temporal reconstruction method for MODIS surface reflectance data. Remote Sens. Technol. Appl. 39 (03), 603–611. doi:10.11873/j.issn.1004-0323.2024.3.0603
Wang, Z., Liu, C., and Alfredo, H. (2003). Progress in vegetation index research: from AVHRR-NDVI to MODIS-EVI. Acta Ecol. Sin. 23 (5), 979–987. doi:10.3321/j.issn:1000-0933.2003.05.020
Wanner, W., Li, X., and Strahler, A. J. J. o.G. R. A. (1995). On the derivation of kernels for kernel-driven models of bidirectional reflectance. J. Geophys. Res.:Atmos. 100 (D10), 21077–21089. doi:10.1029/95JD02371
Wu, B., and Zhang, M. (2017). Remote sensing: observations to data products. Acta Geogr. Sin. 72 (11), 2093–2111. doi:10.11821/dlxb201711013
Xiao, Z., Liang, S., Wang, T., and Liu, Q. (2015). Reconstruction of satellite-retrieved land-surface reflectance based on temporally-continuous vegetation indices. Remote Sens. 7 (8), 9844–9864. doi:10.3390/rs70809844
Yoon, Y., Kemp, E. M., Kumar, S. V., Wegiel, J. W., Vuyovich, C. M., and Peters-Lidard, C. (2022). Development of a global operational snow analysis: the US air force snow and ice analysis. Remote Sens. Environ. 278 (2022), 113080. doi:10.1016/j.rse.2022.113080
Yu, C., Chen, L., Su, L., Fan, M., and Li, S. (2011). “Kriging interpolation method and its application in retrieval of MODIS aerosol optical depth,” in 2011 19th international conference on geoinformatics, 1–6. doi:10.1109/GeoInformatics.2011.5981052
Zhang, H., Jiao, Z., Chen, L., Dong, Y., Zhang, X., Lian, Y., et al. (2018). Quantifying the reflectance Anisotropy effect on albedo retrieval from remotely sensed observations using archetypal BRDFs. Remote Sens. 10 (10), 1628. doi:10.3390/rs10101628
Zhang, H., Jiao, Z., Dong, Y., Du, P., Li, Y., Lian, Y., et al. (2016). Analysis of extracting prior BRDF from MODIS BRDF data. Remote Sens. 8 (12), 1004. doi:10.3390/rs8121004
Zhou, J., Jia, L., Menenti, M., and Liu, X. J. R. S. (2021). Optimal estimate of global biome—specific parameter settings to reconstruct NDVI time series with the harmonic analysis of time series (HANTS) method. Remote Sens. (Basel). 13 (21), 4251. doi:10.3390/rs13214251
Zhou, J., Massimo, M., Li, J., Bo, G., Feng, Z., Yilin, C., et al. (2023). A scalable software package for time series reconstruction of remote sensing datasets on the Google Earth Engine platform. Int. J. Digit. Earth 16 (1), 988–1007. doi:10.1080/17538947.2023.2192004
Keywords: surface reflectance reconstruction, MODIS, BRDF, RTLSR model, East and South Asia
Citation: Hu J, Gao B, Ma H, Gong H, Liu Y, Liu J, Feng Y, Lin H and Wang Z (2025) MODIS surface reflectance reconstruction based on an RTLSR inversion strategy with dynamically adjusted multi-surface parameters. Front. Remote Sens. 6:1611517. doi: 10.3389/frsen.2025.1611517
Received: 14 April 2025; Accepted: 27 June 2025;
Published: 09 July 2025.
Edited by:
Taifeng Dong, Agriculture and Agri-Food Canada (AAFC), CanadaReviewed by:
Lijuang Wang, Jiangsu Normal University, ChinaHaiying Jiang, Harbin Engineering University, China
Copyright © 2025 Hu, Gao, Ma, Gong, Liu, Liu, Feng, Lin and Wang. This is an open-access article distributed under the terms of the Creative Commons Attribution License (CC BY). The use, distribution or reproduction in other forums is permitted, provided the original author(s) and the copyright owner(s) are credited and that the original publication in this journal is cited, in accordance with accepted academic practice. No use, distribution or reproduction is permitted which does not comply with these terms.
*Correspondence: Bo Gao, Z2FvYm9AY251LmVkdS5jbg==; Huili Gong, NDAzOUBjbnUuZWR1LmNu Yuanyuan Liu, bHl1YW55dWFuQG1haWwuY2dzLmdvdi5jbg==