 Ming-Yi Chen
 Hwa Chien
 Wen-Hao Yeh
 Li-Ching Lin
 Yu-Fu Liou
- 1Institute of Hydrological and Oceanic Sciences, National Central University, Taoyuan, Taiwan
- 2Center for Space and Remote Sensing Research, National Central University, Taoyuan, Taiwan
- 3Taiwan Space Agency, Hsinchu, Taiwan
- 4Advanced Research Center for Earth Sciences, National Central University, Taoyuan, Taiwan
TRITON is a newly launched GNSS-Reflectometry (GNSS-R) satellite mission by Taiwan, designed to enhance global sea surface wind monitoring. Among its scientific objectives, TRITON delivers high-resolution Delay Doppler Map (DDM) observations that enable novel investigations into the physical mechanisms shaping GNSS-R signal structures. In this study, we highlight the critical yet often overlooked role of transmitter–receiver relative velocity (Vrel) in influencing DDM morphology within the bistatic measurement geometry. Traditional geophysical model function (GMF) retrieval methods, which rely primarily on surface scattering assumptions, often neglect this orbital dynamic factor. Leveraging a deep learning-based framework, we empirically demonstrate that unaccounted-for Vrel can introduce systematic misinterpretations of surface roughness, likely due to DDM distortion. By explicitly incorporating Vrel as an input feature, our retrieval model achieves improved wind speed estimation accuracy from TRITON data, reducing root-mean-square error (RMSE) by over 11%. These results underscore the importance of orbital dynamics in GNSS-R applications and position TRITON as a valuable platform for advancing ocean remote sensing capabilities.
1 Introduction
Global Navigation Satellite System Reflectometry (GNSS-R) is an emerging passive remote sensing technique that leverages signals from GNSS satellites, such as GPS, reflected from the Earth’s surface to infer environmental conditions. It has shown promise in retrieving geophysical parameters including ocean surface roughness, soil moisture, sea surface rainfall, oil slick and ice coverage (Valencia et al., 2013; Bu et al., 2022; Roberts et al., 2022). Unlike traditional active radar systems, GNSS-R operates in a bistatic configuration and does not require a dedicated transmitter, offering energy efficiency and cost-effective scalability for global observation (Gleason et al., 2016).
The core observable in GNSS-R systems is the Delay Doppler Map (DDM), which captures the reflected signal energy across delay and Doppler frequency bins (Clarizia et al., 2009). Traditionally, DDM features, such as Doppler width, peak power, and delay spread, are interpreted as direct responses to surface scattering mechanisms, particularly wind-driven roughness over ocean surfaces (Zavorotny and Voronovich, 2000; Giangregorio et al., 2016). These interpretations are typically embedded within empirical or semi-empirical geophysical model functions (GMFs) used for environmental retrievals (Gleason et al., 2016).
However, recent theoretical and simulation-based studies suggest that DDM structure is also modulated by satellite motion (Clarizia et al., 2009; Chen et al., 2024), especially the relative velocity (Vrel) between the GNSS transmitter and the receiver. An increase in Vrel leads to faster changes in signal path length during observation, therefore producing Doppler broadening and flattening, even under identical surface conditions. Such satellite-motion-induced distortions can closely resemble those caused by high winds, thereby confusing retrieval algorithms that lack geometric awareness (Asgarimehr et al., 2022a). Electromagnetic simulations have confirmed that geometric effects, referring specifically to observation geometry parameters such as the relative position and velocity or angle between the transmitter and receiver, can rival surface scattering in their impact on DDM features (Wang et al., 2025). Despite this, most operational GNSS-R models either ignore relative motion or assume that its effects are implicitly encoded in the DDM. This simplification becomes problematic for low Earth orbit (LEO) missions like TRITON and CYGNSS, where orbital dynamics causes Vrel to vary significantly across time and geographic location.
In the TRITON satellite mission, which passively receives L1-band GNSS signals, the relative velocity between the receiver and transmitting satellites typically ranges from 4.8 to 5.3 km/s. In TRITON orbit design, the angles of the Tx-Rx velocity vectors show limited variability and minimal impact on DDM morphology. Therefore, in this study, we focus on Vrel as the dominant factor influencing DDM structure.
We propose an orbit-dynamic-informed deep learning framework to explicitly model and compensate for the influence of satellite motion in GNSS-R signal interpretation. Unlike black-box regressors, our approach embeds relative velocity as one of the features into a hybrid Convolutional Neural Network - Long Short-Term Memory (CNN-LSTM) architecture (Arabi et al., 2023; Lu et al., 2023). We use high-resolution DDMs from TRITON to test whether incorporating Vrel improves retrieval accuracy and signal interpretability. The data source is described in Section 2, the results and discussions are arranged in Section 3 and 4, respectively. Conclusions will be summarized in Section 5.
2 Materials and methods
2.1 Data source and preprocessing
2.1.1 GNSS-R observations from TRITON
The dataset used in this study was obtained from the TRITON satellite mission, which was developed by the Taiwan Space Agency (TASA) and launched in 2023 (Juang et al., 2024). Operating in a highly dynamic low Earth orbit (LEO), TRITON is equipped with a passive Global Navigation Satellite System Reflectometry (GNSS-R) payload that captures reflections of L1-band GPS signals. Unlike CYGNSS, which provides cropped-resolution DDMs (17 delay bins × 11 Doppler bins), TRITON captures full-resolution L1-band DDMs with 128 delay bins × 64 Doppler bins, corresponding to a delay resolution of 0.0625 chips and a Doppler resolution of 125 Hz. This represents approximately four times the spatial and delay-Doppler domain resolution compared to CYGNSS. Such high-resolution DDMs enable finer characterization finer characterization of Doppler structures (Wang and Juang, 2020). TRITON operates at an altitude of approximately 600 km in a sun-synchronous orbit with an inclination of 98°, completing 14 orbits per day. This orbital configuration results in variability in transmitter-receiver across latitudes and times of day (Tsai et al., 2021).
This analysis focuses on TRITON GNSS-R data collected over a 6-month period from May to November 2024. The geographic coverage mainly includes three ocean basins characterized by diverse atmospheric and orbital configurations: the northwestern Pacific Ocean (spanning 105°E to 180°E and 0° to 30°N), the North Atlantic Ocean (from −100°W to −10°W and 0° to 40°N), and the northern Indian Ocean (covering 45°E to 112°E and −10° to 30°N) (Juang et al., 2024).
A total of approximately 2.3 million quality-controlled DDM records were retained for analysis after applying filtering criteria to the original dataset. To ensure data reliability, we retained only GNSS-R observations that passed all internal quality control checks. Specifically, samples were excluded if the reflection point was located on or near land, if the DDM maximum fell outside the expected delay-Doppler window, or if anomalies such as telemetry corruption, low signal-to-noise ratio, instrumental temperature errors, or spike-like noise were detected. This strict filtering process ensures that only physically meaningful and valid observations were included in model training. The spatial coverage and QC statistics are summarized in Figure 1, which illustrates spatial distribution and a temporal summary of quality control statistics of TRITON GNSS-R observations. Top panel is global coverage of GNSS-R data collected from May to November 2024, primarily across the northwestern Pacific, northern Indian Ocean, and North Atlantic Ocean. Bottom panel shows daily counts of observations, separated into those that passed (blue) and failed (red) quality control. A total of approximately 2.3 million QC-passed Delay Doppler Map (DDM) records were retained for analysis.
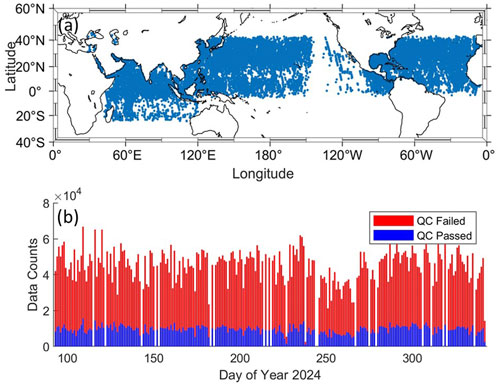
Figure 1. Spatial and temporal distribution of TRITON data. (a) Global coverage of TRITON data collected from May to November 2024, primarily across the northwestern Pacific, northern Indian Ocean, and North Atlantic Ocean. (b) Daily counts of observations, separated into those that passed (blue) and failed (red) quality control. A total of approximately 2.3 million QC-passed Delay Doppler Map (DDM) records were retained for analysis.
For each recorded DDM sample, both the transmitting GNSS satellite and the TRITON receiver’s positions and velocities were recorded in Earth-Centered Earth-Fixed (ECEF) coordinates. This auxiliary metadata enables the derivation of key physical parameters such as relative velocity and incidence angle, which are essential for analyzing the changing effects on DDM structure. The inclusion of these variables allows for a more comprehensive investigation into the impact of observation configuration on GNSS-R signal interpretation.
2.1.2 Environmental reference labels
Surface wind speed at a height of 10 m was derived from the ERA5 re-analysis dataset provided by the European Centre for Medium-Range Weather Forecasts (ECMWF). ERA5 offers comprehensive global atmospheric data with a spatial resolution of 0.25 degrees and hourly temporal granularity, making it a reliable reference for geophysical studies. For the purpose of model supervision, the ERA5 wind speed fields were bilinearly interpolated both spatially and temporally to match the exact geographic coordinates and timestamp of each GNSS-R Delay Doppler Map (DDM) observation acquired by TRITON. These interpolated values served as the ground truth labels for training and evaluating the deep learning models. Although in situ buoy measurements (e.g., from the NDBC) are generally preferred for validation, such datasets were not sufficiently available within the TRITON observation swath or at the temporal scale required for deep learning (i.e., millions of matched samples). Therefore, ERA5 was adopted as the sole reference source in this study. We acknowledge this limitation and propose to incorporate buoy-based validation in future follow-up studies. Although this study utilizes ERA5 wind speed solely as a reference for assessing model performance and correction fidelity, rather than being optimized for maximizing predictive accuracy, it remains a crucial component in validating the physical interpretability of the proposed Vrel -aware retrieval framework.
2.2 Feature engineering
The following input features were constructed for model training: (i) Bistatic Radar Cross-Section (BRCS): Extracted directly from the raw DDM, retaining both relative orbital motion and scattering information. No normalization (e.g., NBRCS) is applied to preserve physical distortions. (ii) Relative Velocity (Vrel) defined as
where
2.3 Deep learning model
2.3.1 Architecture design
We implemented a hybrid deep learning model that integrates a Residual Convolutional Neural Network (ResNet) with Long Short-Term Memory (LSTM) units, as illustrated in Figure 2. The architecture consists of two parallel branches: the BRCS Delay Doppler Maps (DDMs) are processed through a ResNet-based CNN branch for spatial feature extraction, while auxiliary parameters are fed into a parallel dense branch. The two feature vectors are concatenated and passed through a Bi-LSTM network for sample-wise encoding before predicting surface wind speed (U10) via a fully connected regression layer (Arabi et al., 2023; Bu et al., 2023; Lu et al., 2023).
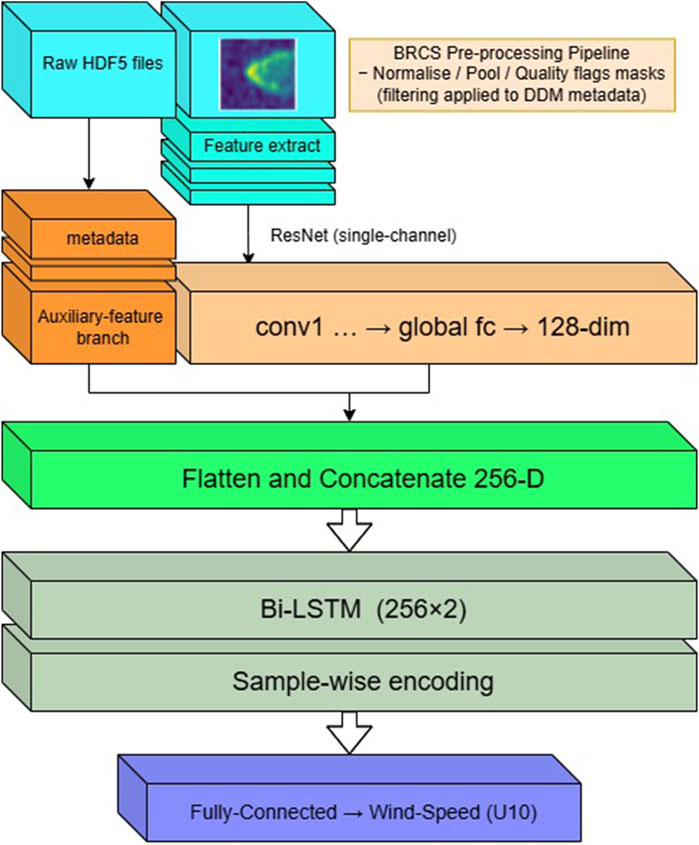
Figure 2. Hybrid CNN-LSTM architecture for GNSS-R wind speed retrieval The input Delay Doppler Maps (DDMs) and auxiliary metadata (e.g., relative velocity, incidence angle) are first processed separately, DDMs through a ResNet-based convolutional branch for spatial feature extraction, and metadata through a parallel dense encoding path. The resulting feature vectors are then concatenated and passed to a bidirectional LSTM (Bi-LSTM) module to model sample-wise structural variations. The final surface wind speed (U10) prediction is generated via a fully connected regression layer.
The CNN branch processes the bistatic radar cross-section (BRCS) Delay Doppler Maps (DDMs) as 2D images, extracting localized spatial patterns such as Doppler spread, peak sharpness, and asymmetry. The extracted feature maps are flattened and then fused with auxiliary inputs, specifically, the relative velocity (Vrel) and incidence angle through a dense fusion layer (Wang et al., 2022; Xiao et al., 2023).
This combined feature representation is passed to a bidirectional LSTM (Bi-LSTM) module, which models structural variations across samples arising from satellite motion dynamics. The Bi-LSTM effectively learns spatially coherent distortions by treating similar DDM samples within a mini-batch as pseudo-sequences. This allows the model to encode latent trends, such as the Doppler asymmetry and broadening patterns, which are not easily captured by conventional CNNs. The final output is generated through a fully connected regression layer to predict surface wind speed (U10, in m/s). Alternative non-sequential encoders, such as attention-based modules, may offer complementary capabilities and are identified as promising directions for future model design (see Section 4.2).
The final regression output is a scalar surface wind speed prediction (U10), generated based on both DDM features and geometric inputs. While the Bi-LSTM is not used for time series modeling, it effectively captures sample-level structural variation by treating spatially adjacent DDMs with similar features as pseudo-sequences. The bidirectional structure allows the model to learn relationships among features. This usage of Bi-LSTM is thus intended to exploit spatial deformation continuity, even when the input batches are randomly shuffled during training.
2.3.2 Model variants
We developed and trained two distinct model variants to systematically investigate the impact of explicitly incorporating information, specifically, relative velocity on GNSS-R signal interpretation and wind retrieval performance. The first variant, referred to as the baseline model, utilizes only the bistatic radar cross-section (BRCS) component of the DDMs as its primary input feature, deliberately excluding relative velocity. Although commonly referred to as a “BRCS-only” model, this configuration also includes secondary auxiliary inputs such as antenna temperature, PRN identifier, and incidence angle to maintain input consistency across variants.
The inclusion of these secondary features while not central to the analysis is intentional. These variables are known to introduce minor variability in observed DDM patterns due to thermal noise, transmitter characteristics, or angular observation geometry. By incorporating them into both model variants, we minimize confounding effects from alternative sources of measurement uncertainty. This ensures that any observed performance gain in the Vrel -aware model can be more confidently attributed to the inclusion of relative velocity (Vrel), rather than to uncontrolled error factors in the input space.
In contrast, the second variant, termed the Vrel -aware model (BRCS + Vrel), explicitly incorporates relative velocity as a key input. This allows the model to directly account for distortions in the observed DDM patterns, particularly Doppler spreading effects driven by satellite motion, which are otherwise confounded with surface roughness characteristics. By embedding Vrel as a physically meaningful parameter, the Vrel -aware model aims to disambiguate surface-induced and motion-induced signal variations, thereby enhancing both retrieval accuracy and interpretability.
Together, these two configurations enable a controlled assessment of the benefits of incorporating observation geometry, specifically Vrel into the retrieval process. While features such as incidence angle, antenna temperature, and PRN are included for completeness, they are not considered primary explanatory variables due to their relatively minor influence on DDM morphology compared to relative velocity.
2.3.3 Training strategy
The model training followed a standardized setup involving optimizer selection, learning rate, loss function, and validation scheme. The training configuration for model development is summarized as follows. The AdamW optimizer was employed with a learning rate of 0.0001, and the loss function was set to Smooth L1 Loss to balance robustness to outliers with regression accuracy. The dataset was divided into 70% for training, 15% for validation, and 15% for testing. A batch size of 1,024 was used during training. An early stopping criterion was applied, terminating training if no improvement in validation loss was observed over 1,000 consecutive epochs. No data augmentation was applied, as the original dataset already captured sufficient variation across environmental and satellite-geometric scenarios (Bu et al., 2025; Wang et al., 2025). Detailed metadata and distribution statistics of the training dataset can be found in the Supplementary Table S1.
3 Results
3.1 Vrel -aware vs. agnostic performance
To evaluate the effect of incorporating relative velocity into the model design, we compare two configurations: a Vrel -agnostic model that uses only the bistatic radar cross-section (BRCS) as input, and a Vrel -aware model that integrates BRCS with relative velocity (Vrel) as an additional geometric feature. Both models incorporate auxiliary input features including incidence angle, antenna temperature, and PRN code, in addition to their respective main inputs. Both models are trained under identical hyperparameter settings and tested on a held-out dataset covering diverse sea surface conditions and satellite geometries. The evaluation metrics include Root Mean Squared Error (RMSE) and Bias, with respect to the ERA5 wind speed reference.
In addition to numerical evaluation, we visualize the predictive performance through scatter plots of model-predicted wind speeds against the ERA5 reference (Figure 3). As illustrated in Figure 3, both panels represent bivariate density plots comparing predicted wind speed (vertical axis) to ERA5 reference wind speed (horizontal axis), based on a total of 50,575 test samples. The colorbar indicates data density. In the baseline model (Figure 3a), the predicted values exhibit greater scatter and deviate from the identity line, reflected by a higher RMSE of 2.08 m/s and bias of 0.06 m/s. In contrast, the Vrel-aware model (Figure 3b) produces tighter alignment with the ERA5 reference, with improved RMSE (1.88 m/s) and reduced bias (0.04 m/s). It achieves a RMSE reduction of approximately 11.4%, and its bias is closer to zero, indicating improved calibration against the true wind field. The Vrel -aware model exhibits tighter clustering along the 1:1 diagonal, indicating more consistent and unbiased predictions across varying observation conditions.
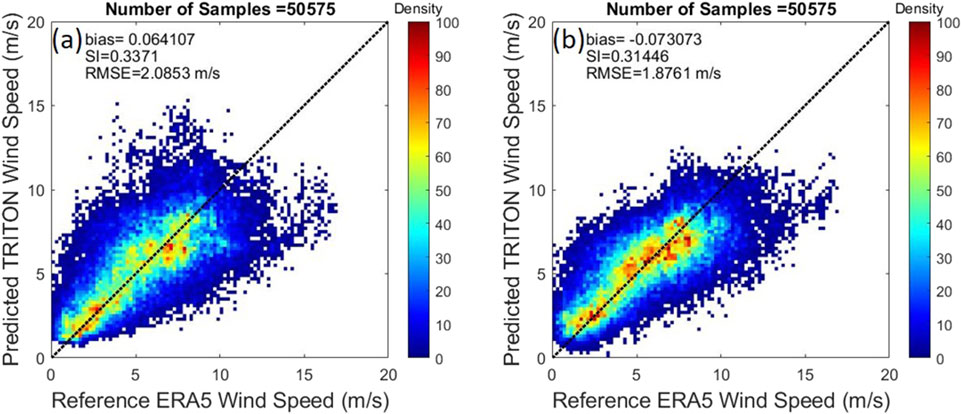
Figure 3. Scatter plots of model-predicted wind speeds against the ERA5 reference. (a) In the baseline model, the predicted values exhibit greater scatter and deviate from the identity line, reflected by a higher RMSE of 2.08 m/s and bias of 0.06 m/s. (b) The V rel -aware model produces tighter alignment with the ERA5 reference, with improved RMSE (1.88 m/s) and reduced bias (0.04 m/s). Both panels represent bivariate density plots comparing predicted wind speed (vertical axis) to ERA5 reference wind speed (horizontal axis), based on a total of 50,575 test samples. The colorbar indicates data density.
These results highlight the non-redundant informational value of relative velocity in interpreting Delay Doppler Map (DDM) patterns, especially under dynamic orbital conditions. This performance gain suggests that the inclusion of physically-informed geometric variables enables the model to better disambiguate signal variations caused by satellite motion from those induced by ocean surface dynamics. As a result, the Vrel -aware model exhibits enhanced robustness and generalization, critical for GNSS-R missions operating in low Earth orbit (LEO) with high-velocity variations.
3.2 Model explainability via integrated gradients
To assess the interpretability of the Vrel -aware CNN-LSTM model, we apply the Integrated Gradients (IG) method to visualize feature attributions over the input Delay Doppler Maps (DDMs). IG is a gradient-based attribution method that quantifies the contribution of each input pixel (Sundararajan et al., 2017) by integrating gradients along a linear path from a baseline to the actual input. In this study, we set the all-zero DDM as the baseline and compute attributions with respect to the predicted surface wind speed.
Figure 4 shows a representative average input DDM alongside its corresponding IG attribution map. The black contours delineate the typical crescent-shaped backscatter pattern under nominal conditions, while the red overlay shows the IG-derived attribution heatmap. Higher red intensity indicates regions that contribute more strongly to the model’s surface wind speed prediction. The spatial alignment reveals that attribution is concentrated within the glistening zone, an area sensitive to both surface roughness and Doppler-delay distortions, supporting the hypothesis that variations in relative velocity modulate the DDM structure exploited by the model.
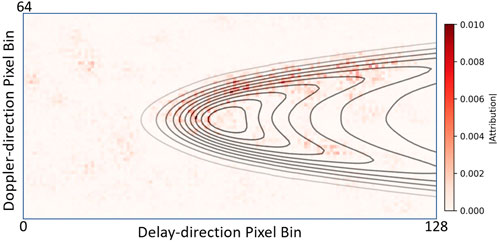
Figure 4. Integrated Gradients(IG) attribution map Representative average input DDM alongside its corresponding IG attribution map. The black contours delineate the typical crescent-shaped backscatter pattern under nominal conditions, while the red overlay shows the IG-derived attribution heatmap. Higher red intensity indicates regions that contribute more strongly to the model’s surface wind speed prediction. The spatial alignment reveals that attribution is concentrated within the glistening zone, an area sensitive to both surface roughness and Doppler-delay distortions, supporting the hypothesis that variations in relative velocity modulate the DDM structure exploited by the model.
The alignment between high-attribution zones and physically meaningful regions validates the model’s ability to learn relevant spatial features. Moreover, attribution strength appears concentrated in the outer edges of the crescent, where Doppler and delay gradients are most pronounced. This suggests that the CNN component of the model extracts information from signal deformation patterns, while the LSTM component encodes geometric modulation effects over cross-sample variations. Importantly, the attribution results confirm that the inclusion of relative velocity does not distract the model from learning meaningful scattering structures; rather, it enhances the model’s ability to correctly interpret DDM deformation in context. This supports the argument that Vrel -aware modeling improves not only accuracy but also remains interpretability.
3.3 Geophysical validation via spatial visualization
In addition to internal attribution analysis, it is equally important to verify whether the model’s outputs exhibit spatial consistency with established physical references. To this end, we visualize the spatial distribution of predicted wind speeds overlaid on ERA5 background fields across a representative region on December 1, 2024. Figure 5 overlays the spatial distribution of TRITON GNSS-R retrieved wind speeds (represented as colored circles) on a background ERA5 wind speed field (color map) over the tropical and subtropical North Atlantic Ocean. This region on the date was diverse wind regimes and ample TRITON coverage. The figure demonstrates that the model successfully reproduces spatial gradients and patterns in surface wind speeds, consistent with the large-scale ERA5 reference fields. Areas of increased wind activity are clearly identifiable and align well with the ERA5 structure. This visual evidence further supports the physical interpretability and retrieval accuracy of the proposed deep learning framework.
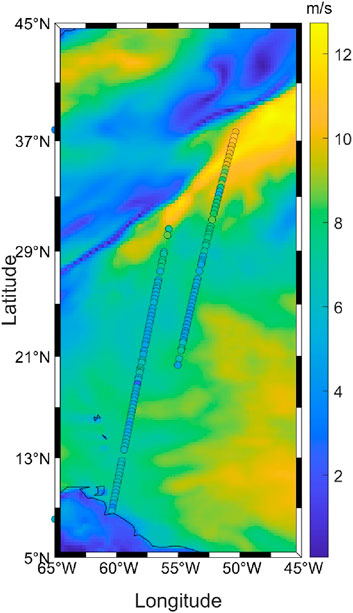
Figure 5. Comparison of TRITON GNSS-R and ERA5 wind speeds on 1 December 2024. TRITON GNSS-R retrieved wind speeds (represented as colored circles) on a background ERA5 wind speed field (color map) over the tropical and subtropical North Atlantic Ocean. This region on the date December 1, 2024, was diverse wind regimes and ample TRITON coverage. The figure demonstrates that the model successfully reproduces spatial gradients and patterns in surface wind speeds, consistent with the large-scale ERA5 reference fields.
4 Discussion
4.1 Physical interpretation of relative velocity effects on GNSS-R signal characteristics
The experimental results presented in this study provide evidence that the relative velocity (Vrel) between GNSS transmitters and receivers significantly influences the DDM structures observed in GNSS-R. Historically, variations observed in DDMs have predominantly been attributed to changes in surface roughness conditions, such as wind-induced wave patterns. However, our analysis demonstrates that geometric factors particularly the relative satellite velocity are likely to introduce systematic distortions to the DDMs, independent of actual surface wind conditions. Specifically, increased Vrel causes rapid fluctuations in the signal propagation path lengths, directly leading to pronounced Doppler broadening in the reflected signal. These findings align closely with theoretical expectations and prior simulation-based studies. Crucially, these Vrel -induced DDM distortions closely mimic patterns traditionally interpreted as indicators of increased surface roughness or higher wind speeds such as broadening of the Doppler and reduction in peak sharpness. As a result, retrieval models that rely solely on scattering-based interpretations risk systematic bias when applied to observations collected under high-dynamic orbital configurations.
To further investigate how the model responds to such effects, we applied the Integrated Gradients (IG) method to interpret the internal behavior of our trained Vrel -aware model. The IG-based attribution maps consistently reveal that the model places its greatest attention in the crescent-shaped high-power region of the DDM, also referred to as the glistening zone. This region is known to be most sensitive to both surface roughness and satellite-induced Doppler distortions. The IG results thus provide strong support for a mechanistic explanation: the model learns to associate subtle DDM deformations in this physically meaningful region with variations in Vrel, enabling more accurate disambiguation of motion-induced vs. surface-induced signal patterns.
This interpretable outcome validates our hypothesis that the performance gain from incorporating Vrel is not incidental. It stems directly from the model’s enhanced ability to detect and compensate for geometric distortions in the DDM structure, particularly within the glistening zone. These findings suggest that future GNSS-R modeling efforts must rigorously account for satellite geometry condition and relative motion. Further investigations into additional geometric parameters would facilitate the development of comprehensive geometry correction frameworks. That is, correction models aimed specifically at compensating for distortions in the GNSS-R signal caused by observation geometry, such as transmitter-receiver relative motion, incidence angle, and antenna beam direction. These corrections would improve the reliability of GNSS-R retrievals across diverse orbital and observational scenarios.
4.2 Implications for future GNSS-R signal processing frameworks and model generalization
The insights obtained from this study have implications for advancing GNSS-R signal processing methodologies. Conventional geophysical model functions (GMFs) employed in GNSS-R retrievals typically rely upon static empirical mappings between DDM features and surface environmental conditions. While sufficient under static or slowly varying geometry, such assumptions become increasingly untenable for modern GNSS-R satellite missions operating in dynamic low Earth orbit configurations. As satellite constellations diversify and proliferate, accurate retrieval of environmental parameters demands signal processing algorithms explicitly conditioned upon observation geometry.
The Vrel-aware deep learning architecture introduced here represents an effective pathway towards addressing this need. By incorporating physically derived geometric variables such as relative velocity directly into the retrieval algorithm, this approach enables explicit correction of Vrel-induced distortions, thus enhancing retrieval robustness and accuracy. A distinct advantage of using geometric parameters, as opposed to environmental variables alone, is their inherent spatial-temporal predictability. Unlike environmental factors, such as wind speeds, which exhibit high degrees of randomness, geometric effects induced by satellite motion follows deterministic orbital mechanics. Consequently, Vrel -informed retrieval models inherently possess enhanced transferability and generalization capability, potentially extending their validity across different geographic regions, seasonal variations, and even across diverse GNSS constellations.
Nevertheless, broader validation is warranted to confirm these generalization benefits across multiple satellite missions, such as comparisons with data from the CYGNSS constellation or other GNSS-R platforms (Gleason et al., 2016; Alshaye et al., 2020; Bu et al., 2025). Additionally, future studies should leverage advanced interpretable artificial intelligence methods to further quantify feature attribution and model transparency. Such interpretability enhancements would significantly increase the credibility and acceptance of GNSS-R machine learning approaches within the broader remote sensing and oceanographic research communities (Lu et al., 2023; Bu et al., 2024). Recent works have also explored the use of attention-based or graph-structured deep learning models in GNSS-R wind retrieval. For instance, a CNN-Transformer-based architecture (Qiao et al., 2025), or residual fully connected network (RFCN) (Du et al., 2024). These architectures have shown promising performance gains.
5 Conclusion
The proposed Vrel -aware CNN-LSTM model demonstrates clear and consistent improvements in GNSS-R wind retrieval accuracy when compared to baseline models that do not account for satellite-receiver relative velocity (Vrel). Across the TRITON dataset, the incorporation of Vrel led to an average RMSE reduction of 11.4% in surface wind speed estimates. The results confirm that unmodeled geometric effects can significantly degrade retrieval performance, even under stable surface conditions, and must be addressed for reliable GNSS-R interpretation.
Vrel-agnostic models tend to remain larger uncertainty, whereas the Vrel -aware model successfully decouples DDM shape distortions caused by motion from those caused by surface roughness. This leads to more physically consistent retrieval outputs and helps avoid systematic biases in regions where high Vrel could otherwise lead to misinterpretation.
Beyond mere wind speed estimation, the success of the proposed Vrel -informed learning architecture suggests broader potential for GNSS-R applications. Since satellite geometry evolves deterministically, models conditioned on geometric variables may generalize more effectively across time, region, and even satellite con-stellations. This opens possibilities for transferring the approach to other retrieval tasks such as swell height (Bu et al., 2022), rainfall intensity (Asgarimehr et al., 2022b), and sea surface roughness over ice (Liu et al., 2022), where current algorithms still struggle under dynamic observational conditions. TRITON’s comprehensive and geometrically diverse dataset provides a strong foundation for testing such generalization potential in future studies.
Data availability statement
The original contributions presented in the study are included in the article/Supplementary Material, further inquiries can be directed to the corresponding author.
Author contributions
M-YC: Software, Writing – original draft, Data curation, Conceptualization, Investigation, Visualization, Methodology, Validation, Formal Analysis. HC: Supervision, Writing – review and editing, Funding acquisition, Resources, Investigation, Project administration, Validation, Conceptualization. W-HY: Writing – review and editing, Supervision, Investigation, Resources, Validation. L-CL: Writing – review and editing. Y-FL: Writing – review and editing, Software, Data curation.
Funding
The author(s) declare that financial support was received for the research and/or publication of this article. This research was supported by the National Science and Technology Council (NSTC), Taiwan, under the Oceanography Research Program. 113-2119-M-008-012.
Conflict of interest
The authors declare that the research was conducted in the absence of any commercial or financial relationships that could be construed as a potential conflict of interest.
Generative AI statement
The author(s) declare that Generative AI was used in the creation of this manuscript. During the preparation of this manuscript, the author(s) used OpenAI’s GPT-4 model for language refinement and editorial suggestions. The authors have reviewed and edited the output and take full responsibility for the content of this publication.
Publisher’s note
All claims expressed in this article are solely those of the authors and do not necessarily represent those of their affiliated organizations, or those of the publisher, the editors and the reviewers. Any product that may be evaluated in this article, or claim that may be made by its manufacturer, is not guaranteed or endorsed by the publisher.
Supplementary material
The Supplementary Material for this article can be found online at: https://www.frontiersin.org/articles/10.3389/frsen.2025.1657576/full#supplementary-material
References
Alshaye, M., Alawwad, F., and Elshafiey, I. (2020). Hurricane tracking using Multi-GNSS-R and deep learning. In: 2020 3rd international conference on computer applications and information security (ICCAIS); 2020 March 19–21; Riyadh, Saudi Arabia: IEEE. p. 1–4. doi:10.1109/ICCAIS48893.2020.9096717
Arabi, S., Asgarimehr, M., Kada, M., and Wickert, J. (2023). Hybrid CNN-LSTM deep learning for track-wise GNSS-R ocean wind speed retrieval. Remote Sens. 15, 4169. doi:10.3390/rs15174169
Asgarimehr, M., Arnold, C., Weigel, T., Ruf, C., and Wickert, J. (2022a). GNSS reflectometry global ocean wind speed using deep learning: development and assessment of CyGNSSnet. Remote Sens. Environ. 269, 112801. doi:10.1016/j.rse.2021.112801
Asgarimehr, M., Hoseini, M., Semmling, M., Ramatschi, M., Camps, A., Nahavandchi, H., et al. (2022b). Remote sensing of precipitation using reflected GNSS signals: response analysis of polarimetric observations. IEEE Trans. Geosci. Remote Sens. 60, 1–12. doi:10.1109/TGRS.2021.3062492
Bu, J., Li, H., Yu, K., Huang, W., Wang, Q., Ji, C., et al. (2025). Machine learning methods for Earth observation and remote sensing using spaceborne GNSS reflectometry: current status, challenges, and future prospects. IEEE Geosci. Remote Sens. Mag., 2–66. doi:10.1109/MGRS.2025.3539983
Bu, J., Wang, Q., and Ni, J. (2024). Estimating sea surface swell height using a hybrid model combining CNN, ConvLSTM, and FCN based on spaceborne GNSS-R data from the CYGNSS mission. GPS Solut. 28, 133. doi:10.1007/s10291-024-01671-1
Bu, J., Yu, K., Park, H., Huang, W., Han, S., Yan, Q., et al. (2022). Estimation of swell height using spaceborne GNSS-R data from eight CYGNSS satellites. Remote Sens. 14, 4634. doi:10.3390/rs14184634
Bu, J., Yu, K., Zuo, X., Ni, J., Li, Y., and Huang, W. (2023). GloWS-Net: a deep learning framework for retrieving global sea surface wind speed using spaceborne GNSS-R data. Remote Sens. 15, 590. doi:10.3390/rs15030590
Chen, M., Yang, P.-J., and Wu, R. (2024). Modeling and analysis of delay doppler maps for spaceborne GNSS-R signal scattered from sea surface. PIER M. 130, 139–153. doi:10.2528/PIERM24090802
Clarizia, M. P., Gommenginger, C. P., Gleason, S. T., Srokosz, M. A., Galdi, C., and Di Bisceglie, M. (2009). Analysis of GNSS-R delay-doppler maps from the UK-DMC satellite over the ocean. Geophys. Res. Lett. 36, 2008GL036292. doi:10.1029/2008GL036292
Du, H., Li, W., Cardellach, E., Ribó, S., Rius, A., and Nan, Y. (2024). Deep residual fully connected network for GNSS-R wind speed retrieval and its interpretation. Remote Sens. Environ. 313, 114375. doi:10.1016/j.rse.2024.114375
Giangregorio, G., Di Bisceglie, M., Addabbo, P., Beltramonte, T., D’Addio, S., and Galdi, C. (2016). Stochastic modeling and simulation of delay–doppler maps in GNSS-R over the ocean. IEEE Trans. Geosci. Remote Sens. 54, 2056–2069. doi:10.1109/TGRS.2015.2495115
Gleason, S., Ruf, C. S., Clarizia, M. P., and O’Brien, A. J. (2016). Calibration and unwrapping of the normalized scattering cross section for the cyclone global navigation satellite system. IEEE Trans. Geosci. Remote Sens. 54, 2495–2509. doi:10.1109/TGRS.2015.2502245
Juang, J.-C., Tsai, Y.-F., and Lin, C.-T. (2024). TRITON GNSS-R mission: preliminary results and perspectives. In: IGARSS 2024 - 2024 IEEE international geoscience and remote sensing symposium; Athens, Greece: IEEE. p. 6725–6728. doi:10.1109/igarss53475.2024.10642499
Liu, S., Lin, W., and Lu, Y. (2022). Inherent error and temporal-spatial characteristics of GYGNSS sea surface wind speed. kjkxxb 42, 1029. doi:10.11728/cjss2022.05.211101110
Lu, C., Wang, Z., Wu, Z., Zheng, Y., and Liu, Y. (2023). Global ocean wind speed retrieval from GNSS reflectometry using CNN-LSTM network. IEEE Trans. Geosci. Remote Sens. 61, 1–12. doi:10.1109/TGRS.2023.3276173
Qiao, X., Yan, Q., and Huang, W. (2025). Hybrid CNN-transformer network with a weighted MSE loss for global sea surface wind speed retrieval from GNSS-R data. IEEE Trans. Geosci. Remote Sens. 63, 1–13. doi:10.1109/tgrs.2025.3574129
Roberts, T. M., Colwell, I., Chew, C., Lowe, S., and Shah, R. (2022). A deep-learning approach to soil moisture estimation with GNSS-R. Remote Sens. 14, 3299. doi:10.3390/rs14143299
Sundararajan, M., Taly, A., and Yan, Q. (2017). Axiomatic attribution for deep networks. arxiv (Preprint). doi:10.48550/ARXIV.1703.01365
Tsai, Y. F., Lin, C. T., Juang, J. C., Yeh, W. H., Lo, S. H., and Zhang, L. (2021). Triton – GNSS reflectometry mission in Taiwan. In: Ocean remote sensing technologies: high frequency, marine and GNSS-Based radar. Stevenage, UK: Institution of Engineering and Technology. p. 593–613. doi:10.1049/sbra537e_ch23
Valencia, E., Camps, A., Rodriguez-Alvarez, N., Park, H., and Ramos-Perez, I. (2013). Using GNSS-R imaging of the ocean surface for oil slick detection. IEEE J. Sel. Top. Appl. Earth Obs. Remote Sens. 6, 217–223. doi:10.1109/JSTARS.2012.2210392
Wang, C., Yu, K., Qu, F., Bu, J., Han, S., and Zhang, K. (2022). Spaceborne GNSS-R wind speed retrieval using machine learning methods. Remote Sens. 14, 3507. doi:10.3390/rs14143507
Wang, H.-Y., and Juang, J.-C. (2020). Retrieval of ocean wind speed using super-resolution delay-doppler maps. Remote Sens. 12, 916. doi:10.3390/rs12060916
Wang, Z., Lu, C., Zheng, Y., Tan, Y., Zhang, X., Wang, Q., et al. (2025). STG-DNN: a spatiotemporal graph deep neural network for GNSS-R ocean wind speed retrieval. IEEE Trans. Geosci. Remote Sens. 63, 1–18. doi:10.1109/TGRS.2025.3567595
Xiao, T., Asgarimehr, M., Arnold, C., Zhao, D., Mou, L., and Wickert, J. (2023). Deep learning in spaceborne GNSS-R for ocean remote sensing: first insights from the AI4GNSSR project. Vienna, Austria: EGU General Assembly. doi:10.5194/egusphere-egu23-14532
Keywords: GNSS reflectometry, delay Doppler map, satellite relative velocity in bistatic mode, wind speed retrieval, deep learning, TRITON satellite, bistatic radar cross-section
Citation: Chen M-Y, Chien H, Yeh W-H, Lin L-C and Liou Y-F (2025) Evaluation of the effect of satellite motion on GNSS-R wind speed retrieval: insights from TRITON. Front. Remote Sens. 6:1657576. doi: 10.3389/frsen.2025.1657576
Received: 01 July 2025; Accepted: 21 July 2025;
Published: 30 July 2025.
Edited by:
Weimin Huang, Memorial University of Newfoundland, CanadaReviewed by:
Xin Qiao, Memorial University of Newfoundland, CanadaChangyang Wang, China University of Mining and Technology, China
Copyright © 2025 Chen, Chien, Yeh, Lin and Liou. This is an open-access article distributed under the terms of the Creative Commons Attribution License (CC BY). The use, distribution or reproduction in other forums is permitted, provided the original author(s) and the copyright owner(s) are credited and that the original publication in this journal is cited, in accordance with accepted academic practice. No use, distribution or reproduction is permitted which does not comply with these terms.
*Correspondence: Hwa Chien, aGNoaWVuQG5jdS5lZHUudHc=