 Joseph L. Clary1
 Creighton S. France1Kara Lind1Runhua Shi2J.Steven Alexander1
 Jeffrey T. Richards3,4Rona S. Scott5,6Jian Wang6Xiao-Hong Lu7
 Lynn Harrison1*
- 1Department of Molecular and Cellular Physiology, Louisiana State University Health Sciences Center, Shreveport, LA, United States
- 2Department of Medicine and the Feist-Weiller Cancer Center, LSU Health Sciences Center, Shreveport, LA, United States
- 3NASA John F. Kennedy Space Center, Merritt Island, FL, United States
- 4LASSO Contract, Amentum, Inc, Germantown, MD, United States
- 5Department of Microbiology and Immunology, Louisiana State University Health Sciences Center, Shreveport, LA, United States
- 6Center of Applied Immunology and Pathological Processes, Bioinformatics Modeling Core, Louisiana State University Health Sciences Center, Shreveport, LA, United States
- 7Department of Pharmacology, Toxicology and Neuroscience, Louisiana State University Health Sciences Center, Shreveport, LA, United States
2D and 3D Clinostats are used to simulate microgravity on Earth. These machines continuously alter the sample’s orientation, so the acceleration vector changes faster than the biological endpoint being monitored. Two commercially available microgravity simulators are the Rotary Cell Culture System (Synthecon Inc.), which is a 2D clinostat, and the RPM 2.0 (Yuri), which is a 3D clinostat that can operate as a random positioning machine or in constant frame velocity mode. We have developed an inexpensive 3D clinostat that can be 3D printed and assembled easily. To determine the optimal combination of inner (I) and outer (O) frame velocities to simulate microgravity, two factors were considered: the time-averaged magnitude and the distribution of the acceleration vector. A computer model was developed to predict the acceleration vector for combinations of frame velocities between 0.125 revolutions per minute (rpm) and 4 rpm, and a combination of I = 1.5 rpm and O = 3.875 rpm was predicted to produce the best microgravity simulation. Two other frame velocity combinations were also used in further tests: I = 0.75 rpm and O = 3.625 rpm, and I = 2 rpm and O = 1.125 rpm. By operating the RPM 2.0 in constant velocity mode at these three velocity combinations, the RPM 2.0 algorithm data confirmed that these operating conditions simulated microgravity. Mycobacterium marinum was selected for biological comparison experiments as this bacterium can grow as a biofilm or a planktonic culture. Biofilm experiments revealed that the RPM 2.0 and the 3D clinostat with I = 1.5 rpm and O = 3.825 rpm produced similar structures in attached biofilm, and similar changes in transcriptome for the bacteria in suspension compared to the normal gravity transcriptome. Operating the 3D clinostat at I = 2 rpm and O = 1.125 rpm, and the Synthecon 2D clinostat in simulated microgravity orientation at 25 rpm resulted in the same decreased planktonic growth and increased rifampicin survival compared to normal gravity. This study validates the inexpensive 3D clinostat and demonstrates the importance of testing the operating conditions of lab-developed clinostats with biological experiments.
1 Introduction
The International Space Station (ISS) currently serves as the main platform for scientists to study the effects of microgravity. However, limitations such as high cost, availability of hardware, and crew time restrict access for many experiments. Microgravity simulators, therefore, provide a crucial role in providing the conditions for scientists to perform these experiments on Earth.
There are two types of microgravity simulations: short duration and long duration. Short duration simulations are produced from the drop tower, parabolic flights, and sounding rockets and use the mechanics of free fall to reduce or negate the effect of gravity (Kiss 2014). These simulators produce microgravity for seconds, as in the case of the drop tower (www1.grc.nasa.gov/facilities/zero-g/) and parabolic flights, or minutes for sounding rockets (Kiss 2014). Since biological processes often take longer than a few minutes to complete, most biological experiments require longer simulations to understand the effect of microgravity. Magnetic gravity compensation and rotation on a clinostat are two methods of producing long duration microgravity simulations (Nikolayev et al., 2011; Kiss 2014; Kiss et al., 2019).
Magnetic gravity compensation or levitation reduces the force of gravity at each point on an object (Nikolayev et al., 2011). For a biological sample such as a cell, this means not only is gravity reduced on the cell wall or membrane but also at all points inside the cell, including the organelles or nucleus and down to the molecular level (Herranz et al., 2022). This simulation requires the sample to be placed in a strong magnetic field. Biological samples predominantly consist of water, and hence a magnetic field can generate a diamagnetic force from the sample that is equivalent and in the opposite direction to the force of gravity (Herranz et al., 2022). This compensates for gravity and simulates weightlessness. Since this force acts at the molecular level and is not averaged over the sample, a good simulation of the effect of weightlessness is achieved. The major disadvantage is that strong magnetic fields could alter the physiology of an organism. This type of simulation also requires dedicated facilities (Nikolayev et al., 2011) and access is limited. Magnetic levitation is also expensive as it requires a lot of power, and the need for refrigeration limits the length of an experiment to a few hours (Herranz et al., 2022).
Clinostats simulate microgravity by continuously rotating a sample, either about one axis or two, preventing gravity acting on the sample in any one direction. Because the orientation of the sample is constantly changing, the magnitude of the sample’s gravitational vector approaches zero as time progresses (Kim et al., 2017).
2D clinostats rotate about one axis at a rotation rate that is dependent on the biological specimen being studied. For example, bacteria are often rotated at 25 rpm (Wilson et al., 2002; Abshire et al., 2016) while yeast are rotated at 30 rpm (Sheehan et al., 2007). When rotated perpendicular to the direction of gravity, the free-floating cells remain in a fixed position with respect to the surrounding liquid medium (Van Loon 2007). Specifically designed bioreactors, called High-Aspect-Ratio Vessel bioreactors (HARVs) provide a low-shear growth environment that is necessary for an effective microgravity simulation (Wilson et al., 2002). The Synthecon Rotary Cell Culture System (RCCS) is used in conjunction with HARVs, and has been used to study microorganisms (Abshire et al., 2016), single-cell mammalian cells (Mylabathula et al., 2022), mammalian cells attached to microcarriers (Zhao et al., 2021), and mammalian cells as spheroids (Constantini et al., 2019). This 2D clinostat has been used by many investigators, as is evident from 70 citations related to simulated microgravity from 1998 to 2022 (Web of Science, Clarivate Analytics, literature search used the term “rotary cell culture system”).
3D clinostats, which rotate about two axes, were originally developed out of concern that 2D clinostats could produce unwanted effects in some biological samples (Hoson et al., 1997; Kraft et al., 2000; Van Loon 2007). 3D clinostats are composed of two frames that independently rotate at slow speeds, at most 10 rpm (Borst and van Loon 2009; Damm et al., 2014). It has been shown that 3D clinostats are more effective at simulating microgravity than 2D clinostats, especially for larger samples (Kraft et al., 2000), and that 3D clinostats produce responses similar to microgravity found on the ISS (Infanger et al., 2006; Herranz et al., 2010; Pietsch et al., 2012). Additionally, 3D clinostats remove the need for microcarrier beads that are required in 2D clinostats to grow cells that usually attach to a surface (Hammond and Hammond 2001).
3D clinostats simulate microgravity by symmetrically distributing Earth’s gravity vector throughout the test sample. This can be accomplished either by randomly setting the velocities of each frame and altering those velocities at random time intervals (Borst and van Loon 2009), by rotating each frame at an equal, constant velocity and randomly changing the rotation at independent, random intervals (Wuest et al., 2014), or by rotating each frame at different, constant velocities that were predetermined to create a symmetric distribution (Kim et al., 2017). The random approaches provide the benefit of exposing the sample to an unpredictable motion environment, which could be relevant to some organisms that may adapt to a predictable motion pattern (Borst and van Loon 2009), while the constant velocity approach provides the benefit of a simple control algorithm and a predictable simulation. The RPM 2.0 was developed by DutchSpace Airbus (Leiden, Netherlands) and is commercially available from Yuri (Meckenbeuren, Germany). This benchtop 3D clinostat can operate as a random positioning machine or in constant velocity mode. The constant velocity mode allows the researcher to specify the velocities of the inner and outer frames. This device has been used in at least 69 published articles (https://www.yurigravity.com/rpm) with a variety of cell types and plants. The software allows for simulations from 0.9 g to microgravity and has specific software to simulate microgravity, Lunar and Martian gravity (Braveboy-Wagner and Lelkes 2022).
To evaluate the efficacy of a 3D clinostat’s microgravity simulation, two metrics are commonly used: the time-averaged magnitude of the acceleration vector, which should approach zero quickly (Kim et al., 2017), and the distribution of the acceleration vector in space, which should appear spherically symmetric (Borst and van Loon 2009; Damm et al., 2014).
The purpose of this study was to develop an inexpensive 3D clinostat designed to fit in a standard cell culture incubator and operate using the constant velocity approach. A computer model was developed to determine the time-averaged magnitude and distribution of the acceleration vector at inner and outer frame velocities varying from 0.125 to 4 rpm. To verify that the inexpensive 3D clinostat produced similar biological alterations as the RPM 2.0 and the Synthecon 2D clinostat, studies were performed with Mycobacterium marinum. M. marinum is a BSL2 pathogenic mycobacterium that is used as a model for human pathogenic mycobacteria such as Mycobacterium avium complex and Mycobacterium tuberculosis. M. avium and M. marinum form biofilms, and M. avium complex has been found in household and hospital water and plumbing systems (Falkinham 2021). M. marinum also exists in the environment (Falkinham 2021) and is a model for biofilm-forming mycobacteria. Since biofilm formation can be altered by low shear modeled microgravity (LSMMG, Castro et al., 2011; Wang et al., 2021; Cheng et al., 2014; Topolski et al., 2022), biofilm-forming bacteria are a concern for spaceflight due to the need to protect the crew’s potable water and water processing hardware. M. marinum was chosen as the test organism in this study as these bacteria can grow as a biofilm or as a planktonic culture. Three different operating conditions of the inexpensive 3D clinostat were tested to determine the effect on M. marinum growth, biofilm formation, transcriptome and rifampicin survival. These results were compared to experiments performed using the RPM 2.0, and the Synthecon 2D clinostat operating in the normal gravity or LSMMG orientation.
2 Materials and methods
2.1 Chemicals
Rifampicin (Sigma-Aldrich, MO) was dissolved in DMSO at 10 mg/ml and aliquots stored at −20°C. Cycloheximide (MP Biomedicals, CA) was dissolved at 10 mg/ml in water and stored at −20°C.
2.2 Design and construction of the 3D clinostat
The 3D clinostat was designed using Autodesk Fusion 360, a Computer Aided Design tool. The main components of the design are a stand, two interconnected frames, and a sample holder (Figure 1; Supplementary Figure S1), which were 3D printed using a Lulzbot Taz 6, Makerbot Replicator Z18, and a Creality Ender 5. Two Dynamixel MX-64T robotic actuators (Robotis, CA) were used to independently rotate the two frames. These actuators were chosen because of their high precision, and because the rotational velocity can be programmed in increments of 0.125 rpm. A slip ring (Taidcent, China) provided power and data connection to the inner rotating motor. The actuators were controlled using an ArbotiX-M microcontroller (Trossen Robotics, IL), which was programmed with a simple Arduino C program that set the velocities of each actuator (Supplementary Program S1). Bearings were used at the connection of the inner frame to the outer frame, and at the connection of the outer frame to the stand to provide smooth movement of the frames. Weights were added to the outer frame to counterbalance the motor mounted on the outer frame (Figure 1).
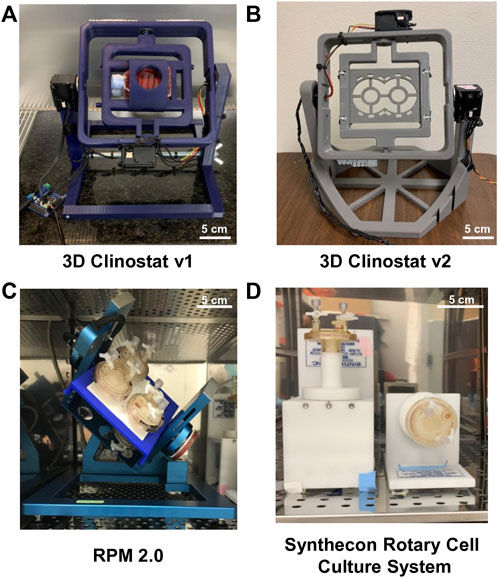
FIGURE 1. Microgravity Simulation Devices. 3D clinostats shown in A and B were produced in this study. The random positioning machine RPM 2.0 (Yuri) and the 2D clinostat Rotary Cell Culture System (Synthecon) are shown in (C) and (D), respectively. Version 1 of the 3D clinostat (A) was used in initial temperature and accelerometer tests. Version 2 (B) was used to perform all the biological experiments, as well as the accelerometer study comparing the clinostat’s operation with the operation of the RPM 2.0.
2.3 Accelerometer data collection
The Arduino UNO WiFi Rev 2’s onboard accelerometer was used to experimentally analyze the efficacy of the 3D clinostat’s microgravity simulation (Supplementary Program S2). The accelerometer recorded the x, y, and z components of the acceleration vector once per second. This was transmitted over WiFi to a nearby computer which collected and stored the data using a Java Processing program (Supplementary Program S3). Each trial lasted at least 2 h, which allowed for the time-averaged acceleration to stabilize. The Arduino was powered using a board-specific lithium-ion battery. The Arduino was aligned with the center of rotation along both rotational axes to minimize residual acceleration.
2.4 Computer model
A computer model was developed using Python to determine the optimal combination of inner and outer frame velocities to produce an effective microgravity simulation (Supplementary Program S4). The computer model was based on spherical coordinates Eq. 1, and analytically generated the acceleration vector at discrete time points for a set combination of frame velocities. The computer model analyzed combinations ranging from 0.125 rpm to 4 rpm in increments of 0.125 rpm for both frames, for a total of 1,024 combinations. This range was chosen based on hardware limitations and with the goal of minimizing residual accelerations.
2.5 Acceleration data analysis
Python programs were developed to analyze the magnitude of the time-averaged acceleration vector and the distribution of the acceleration vector in space using the acceleration data sourced either from the accelerometer, the RPM 2.0 data output, or the computer model (Supplementary Programs S5, S6). The RPM 2.0 data output is from software that provides the acceleration vector x, y, z values from the movement of the frames (Braveboy-Wagner and Lelkes 2022).
Because the time-averaged magnitude of the acceleration vector began at 1 g and rapidly decreased over time before stabilizing, the average time-averaged magnitude of the acceleration vector was calculated from data collected for 1,000 s between 2,000 and 3,000 s and between 5,000 and 6,000 s. The trace of the acceleration vector was graphed, and a Python program was developed to quantify each of these traces based on how distributed they were around the unit sphere (Supplementary Program S6, Supplementary Figure S2).
2.6 RPM 2.0 acceleration comparison
The Arduino UNO WiFi Rev 2 was attached to the sample plate of the RPM 2.0 and the 3D clinostat, and aligned so the onboard accelerometer was in the center of rotation and set to collect data. The RPM 2.0 was operated in constant velocity mode for at least two hours using the optimal velocity combinations determined by the computer model. The input for the RPM 2.0 is in degrees per second and only accepts numbers up to 2 decimal places. This limitation resulted in the RPM 2.0 outer frame operating at 0.008 rpm faster than used by the computer model for the inner and outer frame combinations of 1.5 rpm and 3.875 rpm, and 0.75 and 3.625 rpm, respectively. After each run, the acceleration data from the RPM 2.0 was downloaded and both the accelerometer data and RPM 2.0 data were processed using the programs to analyze the acceleration vector (Supplementary Programs S5, S6).
2.7 Bacterial growth
Mycobacterium marinum (strain 1218R; Pettersson et al., 2015) was previously obtained from Dr. Don G. Ennis (University of Louisiana at Lafayette) and grown in 7H9/ADC liquid medium [Middlebrook 7H9 broth (Difco, MI) supplemented with 10% (v/v) Middlebrook ADC Enrichment (BD Life Sciences), 0.5% (v/v) glycerol, 100 μg/ml cycloheximide and 0.2% (v/v) Tween 80] to promote planktonic growth. Colonies were grown on 7H10/ADS solid medium (Middlebrook 7H10 supplemented with 10% (v/v) ADS [5% (v/v) BSA Fraction V (Equitech-Bio, Inc., TX), 2% (w/v) Dextrose, 0.81% (w/v) NaCl], 0.5% (v/v) glycerol, and 100 μg/ml cycloheximide). Prior to diluting and plating cultures on solid medium, the culture was passed through a 27” gauge needle four times to disaggregate bacteria. Biofilm-promoting medium consisted of 7H9 broth containing 0.5% (v/v) glycerol, and 100 μg/ml cycloheximide.
To generate a red fluorescent protein (RFP)-expressing strain, the RFP expression cassette was removed with Aat II and Sac I from pDEAM2 (Abshire et al., 2016), and pJR172 (Jeremy Rock, Harvard School of Public Health, Boston MA) was linearized with Hind III. Klenow fragment was used to generate blunt-end DNA fragments that were ligated to form pJR172 RFP. This plasmid integrates into the mycobacterium genome using integrase-mediated site-specific recombination at the Giles mycobacteriophage integration site (Morris et al., 2008), which overlaps with the 3’ end of the MMAR_5505 gene encoding tRNAPro. The plasmid (100 ng) was electroporated (2,500 V, 1,000 Ω, 25 μF) into M. marinum strain 1218R and colonies selected on 7H10/ADS solid medium containing 50 μg/ml hygromycin B. Strain 44 was grown from a single colony.
Frozen stock aliquots were prepared from M. marinum or strain 44. The solid and liquid growth medium for strain 44 contained 30 μg/ml hygromycin B. A colony was used to inoculate a 4 ml 7H9/ADC culture in a tube and the culture was incubated at 30°C at 125 rpm in a rotating incubator until an optical density at 600 nm (OD600) of ∼1.5. This culture was diluted to generate 60 mls 7H9/ADC culture with an OD600 of 0.1. The culture was split between two plastic cell culture T150 flasks (150 cm2 with filtered caps) and grown flat without shaking at 30°C in a humidified incubator. After ∼48 h, the culture was mixed with 30 ml 87% (v/v) glycerol and 1 ml aliquots were frozen at -80°C. To initiate all M. marinum or strain 44 experiments, a 1 ml frozen stock was added to 24 ml 7H9/ADC in a T150 flask, and the culture grown without shaking at 30°C in a humidified incubator for ∼48 h. A 20 ml culture (OD600 0.05) was prepared from the 48 h culture and incubated at 30°C in a T75 flask (75 cm2 flask with filtered cap) for 24 h without shaking in a humidified incubator. This culture was used to prepare cultures for HARVs and flaskettes. Cultures of strain 44 included 30 μg/ml hygromycin B during the preparation of this starter culture.
2.8 Biofilm growth
Small pieces (∼0.5 cm × 1 cm) of polydimethylsiloxane (PDMS, 0.6 mm thickness, Interstate Speciality Products, MA) were attached to the slide inside a flaskette with Aqueon silicone sealant. Silicone earplugs were autoclaved in water, and a small amount pressed into the top of the cap of the flaskette. A syringe needle was pushed through the cap and silicone. To sterilize, the flaskettes and caps were individually sealed in plastic and irradiated with ∼900 Gy of gamma radiation from a137Cs source. The starter culture of strain 44 (RFP-expressing M. marinum) was centrifuged and the pellet resuspended in biofilm-promoting medium without hygromycin B to an OD600 of ∼0.2. This culture was loaded into the flaskettes and bubbles eliminated using the needle in the cap. The flaskettes were sealed, stored upside down and shipped to Kennedy Space Center overnight. The bacteria settled on the top of the flaskette during shipping and were resuspended from the plastic prior to mounting on the RPM 2.0 or the 3D clinostat. At least three independent cultures were prepared and shipped on different days. One experiment was performed at LSUHSC on the 3D clinostat, and the flaskettes were loaded and stored upside down overnight before the experiment. For the normal gravity (NG) control, the flaskette was placed with the slide and membrane positioned on the bottom of the flask in the same incubator as the 3D clinostat and RPM 2.0. The 3D clinostat was operated with a combination of I = 1.5 rpm and O = 3.875 rpm, and the partial gravity mode and 0 g file (p0b.txt) was selected on the RPM 2.0. This file programs the RPM 2.0 to perform random positioning to simulate microgravity.
The flaskettes were incubated at 31°C for 4 days. The bacteria in suspension were removed from the flaskette and used to prepare RNA according to Abshire et al. (2016). The PDMS membrane was washed with phosphate buffered saline (PBS) and the bacteria on the membrane fixed by incubating with 4% (w/v) paraformaldehyde in PBS (Santa Cruz Biotechnology, TX) for 30 min. Flaskettes were then washed in PBS, filled with PBS, stored at 4°C and transported to LSUHSC. To image the biofilm, the flaskette was removed from the slide and the membrane mounted with a coverslip. The red fluorescing bacteria were imaged using the Olympus CSU W1 Spinning Disk Confocal Microscope System at ×20 objective and stitched to a large-size image to cover all areas on the slide. Three representative areas per slide were randomly selected and further imaged using a NIKON Air Confocal microscope at ×40 oil objectives (numeric aperture: 1.3) in the TRITC channel with a z step size of 0.225 μm. All specimens were imaged under the same optical configurations in order to keep consistency among image data. Upon capture, the images were 3D-rendered and analyzed using the Surface Function of IMARIS 9.7.0 (Oxford Instruments) to identify separate cords of bacteria and calculate the volume of the cords. Maximum projected images were generated to get a detailed and accurate portrayal of samples. The structures for each image were analyzed by comparing the percentage of total surface volume for volumes between 0.5 and 9.99 μm3, 10–100 μm3, 101–500 μm3 and >500 μm3.
2.9 RNA-seq and bioinformatics analysis
RNA was quantitated with a Qubit RNA assay (ThermoFisher Scientific, MA) and RNA quality was determined with the Agilent TapeStation RNA assay (Agilent Technologies, CA). RIN was equal or greater than 7.4 for the samples. Libraries were prepared from 1 μg RNA from each sample with the Stranded Total RNA Prep, Ligation with Ribo-Zero Plus kit (Illumina, CA). The average library size was determined using an Agilent TapeStation D1000 assay (Agilent Technologies) and libraries were quantitated with qPCR (Bio-rad CFX96 Touch Real-Time PCR, NEB Library Quant Kit for Illumina). Libraries were normalized to 1 nM and pooled. The library pool was denatured and diluted to approximately 1.5 pM. A PhiX library was spiked in as an internal control. Paired-end 99 × 49 base pair sequencing was performed on an Illumina NextSeq 550 and samples had 28–32 million pair-end reads. Primary analysis, including base calling and quality scoring, was performed using NextSeq Control Software v2.1.0; RTA v2.4.11 and FASTQ files generated. FASTQ files were aligned to the M. marinum strain M (accession number CP000854) using STAR version 2.4.2a, as previously described in Abshire et al. (2016). RNA counts were quantified by RSEM 1.2.31 for transcript quantification. Differential expression analysis between samples for 3D clinostat and NG, RPM 2.0 and NG, and 3D clinostat and RPM 2.0 was performed with Bioconductor limma + Voom (Version: 3.48.3) and EdgeR (Version: 3.34.1) packages. Benjamini–Hochberg correction was used to obtain adjusted p-values. Statistically significant differentially expressed genes were filtered based on adjusted p < 0.05 and absolute log fold change≥1. Hierarchical clustering of the top 200 differentially expressed genes of each comparison was visualized as a heatmap using R package gplots (Version: 3.1.3).
2.10 Rifampicin treatment of M. marinum in HARVs
The M. marinum starter culture was diluted to produce 100 ml M marinum at OD600 0.04 or 0.0005 for 24 h or 4-day survival studies, respectively. The colony forming units (CFU) per mL was determined for the 100 ml culture by diluting and growing on solid 7H10/ADS medium. Two tubes containing 45 ml of this culture were treated with either DMSO (final concentration 0.05%) or rifampicin (0.8 μg/ml or 0.05 μg/ml for 24-h or 4-day experiments, respectively). The DMSO and rifampicin-treated cultures were used to load 10 ml HARVs and one HARV of each type of culture was loaded onto the 2D clinostat (Synthecon Inc., CA) in the normal gravity or LSMMG orientation, the RPM 2.0 (operated at the Microgravity Simulation Support Facility, MSSF, at Kennedy Space Center) and the 3D clinostat. The 2D clinostat was rotated at 25 rpm, the RPM 2.0 was operated in partial gravity mode using the 0 g file (p0b.txt), and the frame velocities of the 3D clinostat varied depending on the condition being tested. After the treatment, the culture was removed from the HARVs, and the OD600 measured. The cultures were also diluted and grown on solid 7H10/ADS medium at 31°C to determine the CFU/mL. Colonies from untreated or DMSO-treated cultures were counted after 8 days and colonies from rifampicin-treated cultures were counted after 9 days.
Survival was calculated:
Results are expressed as fold change compared to NG or LSMMG. To calculate the fold change, the average value for three experiments was calculated for the treatment being compared to, e.g. NG. Each individual experimental value for each treatment was divided by that average value to obtain a fold change. The average fold change and the standard deviation was calculated from the three values obtained from three experiments.
2.11 Statistical analysis
To determine whether the size of the biofilm volume was altered significantly by incubation on the 3D clinostat, the RPM 2.0 or under normal gravity, statistical analysis was performed using PRISM GraphPad 9. The percentage of the volume within each predefined category was analyzed using two-way ANOVA, with treatment (3D clinostat, RPM 2.0 or normal gravity) as a between-subject factor and the volume within each category as the within-subject factor. For other statistical analyses, analysis of variance was used to assess the effect of treatment with SAS for Windows 9.4 (SAS Institute Inc., Gary, NC). The Tukey Method was used to adjust the multiple comparisons. All p-values <0.05 were considered statistically significant.
3 Results
3.1 Design of the 3D clinostat
3D clinostats provide the most accurate simulation of microgravity for long duration biological experiments. The RPM 2.0 and the GRAVITE (Zhang et al., 2022) are two commercially available 3D clinostats that cost over $50,000. The SciSpinner (CoSE Instruments, https://cosecloud.com/product/scispinner-max-3d-clinostat/) is a fairly recent commercially available 3D printed 3D clinostat that has a lower cost ($5750) and will likely expand the number of researchers performing simulated microgravity experiments. Facilities such as NASA’s MSSF at Kennedy Space Center provides access to these machines (Zhang et al., 2022), but traveling and transporting experiments can be an expensive and complicated process. The 3D clinostat developed in this study was designed to be low cost (<$1,000), easily reproducible, and to fit in a standard cell culture incubator. The operating footprint of the clinostat is 35 cm (height) x 28 cm (width) x 29 cm (depth). 3D printing the structure greatly reduces the cost of manufacturing and allows researchers to easily build the 3D clinostat. The 3D clinostat costs less than $1,000 for materials, with the two motors representing ∼70% of that cost.
The initial design (Figure 1A) used a sample holder integrated within the inner frame and hence limited the type of vessel that could be mounted on the 3D clinostat. The second version (Figure 1B) removed this constraint by incorporating a sample holder that slots into the inner frame and is easy to exchange. Each sample holder is 3D printed with the indented footprint of the sample vessel (Supplementary Figure S1) and a series of holes surrounding the footprint where zip ties thread through to attach the sample to the clinostat. This provides greater versatility.
The 3D clinostat has to be able to operate at different temperatures and humidity within a cell culture incubator. If sample vessels, such as the HARVs, have membranes to allow gas exchange, the humidity needs to be high to prevent evaporation and bubble formation within the vessel. The microcontroller was connected by long wires to the motors, allowing the wires to pass beneath the incubator door, or through the access point at the back of the incubator, and the microcontroller was positioned outside the incubator. The motors on the 3D clinostat are the main parts that could be damaged by humidity. However, over the past year of operation, no rust or corrosion has formed and there has been no observable impact of temperature or humidity on the operation of the motors in the incubator.
Cell culture incubators often have a water jacket surrounding the chamber with ∼40 L of water to maintain a stable temperature within the incubator. If heat is generated inside the incubator by equipment it can take up to 24 h for the water jacket temperature to normalize to the correct temperature, especially when operating close to room temperature. From experience, we have determined that the Synthecon 2D clinostat can increase the temperature by ∼1°C and it is necessary to set the incubator at a lower temperature prior to the start of the experiment to prevent the incubator operating at an increased temperature during the first 24 h. Small changes in temperature can influence the growth of microorganisms. The 3D clinostat was tested in a cell culture incubator set at 37°C and the temperature was recorded over a 48-h period using a Raspberry Pi-based temperature probe. The temperature within the incubator was on average 0.5°C higher while the 3D clinostat was operating with the velocity combination of 0.625 rpm and 0.5 rpm on the inner and outer frame, respectively (Supplementary Figure S3). This increase is comparable to the Synthecon 2D clinostat.
3.2 Optimizing operating conditions
A computer model was developed (Supplementary Program S4) to determine which combination of inner and outer frame velocities produced the best microgravity simulation based on two metrics: the time-averaged magnitude of the acceleration vector and the acceleration vector distribution. The acceleration vector distribution was quantitated and expressed as a distribution score (Supplementary Figure S2). The higher the score, the more distributed the acceleration vector. The computer model iterated through every combination of velocities between 0.125 rpm and 4 rpm in increments of 0.125 rpm. The predicted time-averaged magnitude and distribution scores are displayed on heatmaps (Figure 2, Supplementary Data). Two different time periods of 1,000 s were considered to calculate the magnitude. The time-averaged magnitude decreased when calculations were performed with data collected between 5,000 and 6,000 s of operation compared to between 2,000 and 3,000 s (Supplementary Data). The distribution score was also calculated from two different time periods. This score slightly increased when data from 0 to 6,000 s was used to calculate the score instead of data from 0 to 3,000 s. However, changing the time period did not substantially change the ranking of the velocity combinations (Supplementary Data).
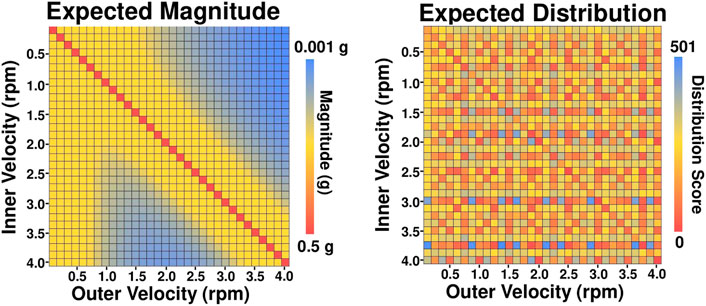
FIGURE 2. Heatmaps of the Predicted Magnitude and Distribution of the Acceleration Vector. The computer model simulated the operation of the 3D clinostat with inner and outer frame velocities of 0.125–4 rpm in increments of 0.125. Data from the computer model was used to calculate the time-averaged magnitude and the distribution of the acceleration vector for the combinations of rotational velocities. The heatmap for magnitude was generated from data for the 1,000 s time period between 2,000 and 3,000 s, while the heatmap for the distribution score considered data during operation between 0 and 3,000 s. For the numerical values see the supplement data excel file.
From the time-averaged magnitude heatmap, as the ratio between the inner and outer frame velocities approaches one, the predicted magnitude increases, and when the velocities are equal, the predicted magnitude dramatically increases to ∼0.5 g and the distribution score dramatically decreases. A test was performed using an accelerometer attached to the 3D clinostat v1 where the inner and outer frames were operated at 0.625 rpm. Using data collected from the accelerometer between 2,000 and 3,000 s, the magnitude was 0.485 g. The acceleration vector path was shaped like a figure eight and not spherically symmetric (data not shown). This supported the information from the computer model that the worst simulation was when the frames were operated at constant and equal velocity.
The combination of 1.5 rpm and 3.875 rpm for the inner (I) and outer (O) frame, respectively, was predicted to produce the most optimal simulation of microgravity because it had the lowest predicted time-averaged magnitude with the highest predicted distribution score (Supplementary Data). Additionally, the combinations of I: 0.75 rpm and O: 3.625 rpm, and I: 2 rpm and O: 1.125 rpm were chosen for further testing because they also had low predicted magnitudes and high predicted distribution scores, but also have lower rotational velocities, which reduces the effects of residual accelerations.
To verify that the computer model accurately modeled the dynamics of a 3D clinostat and that the optimal combinations determined by the computer model accurately simulated microgravity, the RPM 2.0 was operated at the three selected frame velocity combinations in constant velocity mode for 2 h. For all three velocity combinations, the computer model’s predictions agreed with the data output from the RPM 2.0 algorithm (Table 1). For the time period between 2,000 and 3,000 s, the computer model predicted magnitude differed from the RPM 2.0 by an average of 4 × 10⁻⁴ g across the combinations tested. The difference was less when data collected between 5,000 and 6,000 s was used for the calculations. Additionally, the acceleration vector paths predicted by the computer model appear to match the ones generated from the data output of the RPM 2.0 for all three combinations (Figure 3).
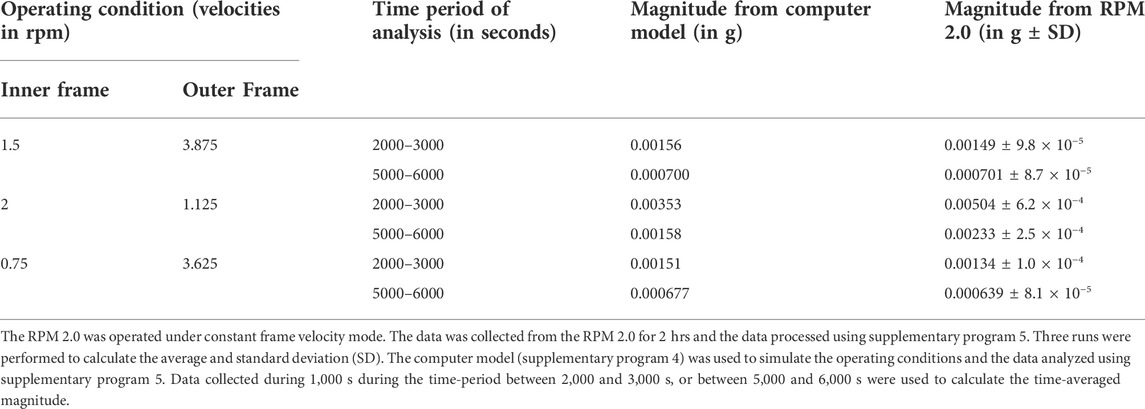
TABLE 1. Magnitude from the RPM 2.0 Data Output and predicted by the Computer Model.
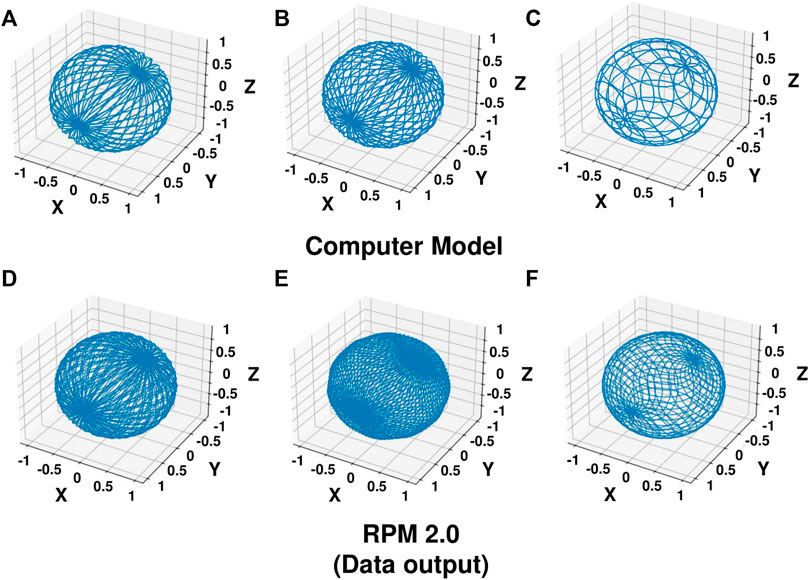
FIGURE 3. Acceleration Vector Path. The acceleration vector path was plotted on a sphere from the x, y, z values obtained by running the computer simulation model (A–C) or the RPM 2.0 in constant velocity mode (D–F) at inner frame (I) and outer frame (O) velocities of I = 0.75 rpm O = 3.625 rpm (A,D), I = 1.5 rpm O = 3.875 rpm (B,E), and I = 2.0 rpm O = 1.125 rpm (C,F). Data for 1,000 s from the time period between 2,000 and 3,000 s was used to show the pattern of the acceleration vector path. The RPM 2.0 generates the data from an algorithm as the machine operates.
To verify the distribution score predicted by the computer model, an accelerometer was placed on the 3D clinostat and the RPM 2.0. Both devices were operated at 1.5 rpm and 3.875 rpm for the inner and outer frames, respectively, and data collected for 2 h. The acceleration vector path recorded by the accelerometer on the 3D clinostat appears to match the path recorded by the accelerometer recorded on the RPM 2.0 and the path generated by the data output from the RPM 2.0 (Supplementary Figure S4). Similarly, the distribution score was consistent for all three data sets. The computer model predicted distribution score was always lower than the value calculated from the accelerometer data and the data output from the RPM 2.0. It is possible that the algorithm from the RPM 2.0 accounts for accelerations not incorporated in the computer model. It is also likely that the data from the accelerometer will include noise generated by vibrations or movement of the equipment, which could result in an increased distribution score. Since the optimal velocity combinations for the 3D clinostat were chosen from analysis of the data from the computer model, this lower score did not change the ranking of the velocity combinations.
3.3 Verification of the 3D clinostat operation by examining biological endpoints
The RPM 2.0 and the Synthecon 2D clinostat have been extensively used in ground-based studies of simulated microgravity. To validate the 3D clinostat and to establish operating conditions, experiments were performed to compare biological outcomes with the RPM 2.0 or the Synthecon 2D clinostat. M. marinum was chosen as a model organism to compare the effects of simulated microgravity because it has the capability of growing as a planktonic culture in suspension and as an attached or aggregate suspension of biofilm. Previous studies have already established that planktonic growth of M. marinum is reduced in LSMMG in HARVs using the Synthecon 2D clinostat (Abshire et al., 2016). Growth, biofilm and antibiotic resistance have been found to change in microbial isolates from the ISS (Yang et al., 2021) and in a variety of microbes in ground-based simulated microgravity studies (Kacena and Todd 1999; Kim et al., 2013). These biological endpoints are relevant to astronaut health, the maintenance of potable water and to NASA’s mission to develop strategies to enable humans to thrive in deep space. Planktonic growth, biofilm formation and transcriptome, and survival after rifampicin treatment were therefore the biological endpoints used to compare the simulated microgravity generated by the 3D clinostat, the RPM 2.0 and the Synthecon 2D clinostat.
3.3.1 Comparison of RFP-expressing M. marinum biofilm
Flaskettes containing RFP-expressing M. marinum in biofilm-promoting medium were attached to the RPM 2.0 and 3D clinostat in the same incubator. Flaskettes were also placed in the incubator with the slide side down to allow bacteria to attach to the PDMS membrane under normal gravity. The RPM 2.0 was operated by the 0 g file in the partial gravity mode, and the 3D clinostat was operated with an inner frame velocity of 1.5 rpm and outer frame velocity of 3.875 rpm, which was predicted by the computer model to simulate a time-averaged magnitude of microgravity (Table 1) with a high distribution of the acceleration vector path. After 4 days, the experiment was stopped and the bacteria in suspension in the flaskettes from the RPM 2.0 and the 3D clinostat were in a large mass, while the bacteria in the flaskettes exposed to normal gravity were in dispersed aggregates (Supplementary Figure S5). The mass of cells dispersed to smaller aggregates when the solution was removed from the flaskette.
The RFP-expressing M. marinum attached to PDMS membrane was imaged using fluorescence confocal microscopy. The distinctive cording of M. marinum was visualized in all samples (Figure 4 left panels, Hall-Stoodley et al., 2006; Abshire et al., 2016) and a similar total fluorescence intensity was measured from multiple images for all conditions (data not shown). Examination of the images suggested that the size of the cords in the normal gravity samples were smaller than in the 3D clinostat and RPM 2.0 images. Hence, the separate cords were identified using the IMARIS software surface function (Figure 4 right panel) and the volume of the cords determined by the program. A total of 11 images from three independent membranes were analyzed for normal gravity and RPM 2.0, and six images from two independent membranes were analyzed for the 3D clinostat. For each image, the percentage of the total volume was calculated for each cord volume category (0.5–9.99 μm3, 10–100 μm3, 101–500 μm3 and >500 μm3), and the average and standard deviation calculated from all the images (Figure 5). Analysis of variance indicated that the normal gravity biofilm consisted of a higher percentage of cords in the smaller categories compared to the biofilms from the 3D clinostat and RPM 2.0, which were not significantly different from each other. A two way ANOVA analysis was used to determine that there was also no significant difference in the way the RPM 2.0 and 3D clinostat growth conditions influenced the volume of the cords (F (3,60) = 0.8709, p = 0.4613), while there was a significant difference between the way growth under normal gravity influenced the size of the cords compared to the RPM 2.0 (F (3,80) = 6.961, p = 0.0003) and 3D clinostat (F (3,60) = 5.916, p = 0.0013).
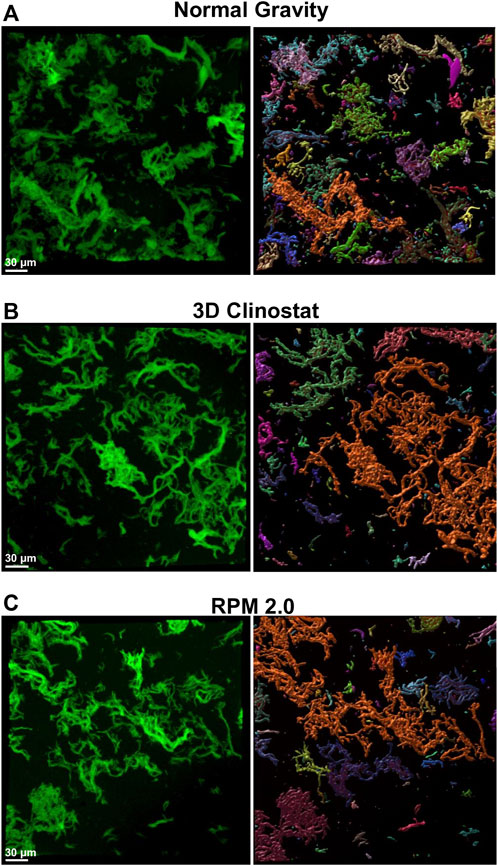
FIGURE 4. RFP-expressing M. marinum Biofilm. RFP- expressing M. marinum were grown in flaskettes and subjected to normal gravity ((A), NG) or simulated microgravity using the 3D clinostat ((B), I 1.5 rpm O 3.875 rpm) or RPM 2.0 (C) for 4 day at 31°C. The red fluorescing bacteria attached to the PDMS membrane were visualized using the TRITC channel of the NIKON Air Confocal fluorescence microscope. Three representative areas per slide were randomly selected and were imaged. Fluorescent bacteria were colorized green to increase the contrast of the M. marinum cords against the black background (left panel, white bar = 30 μm). The images were 3D-rendered and analyzed using the Surface Function of IMARIS 9.7.0 to identify separate cords of bacteria (right panel) and calculate the volume of the cords. A random color was assigned to each separate volume in the 3D-rendered images.
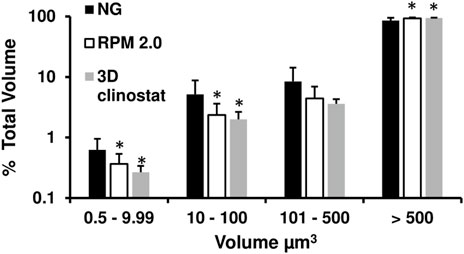
FIGURE 5. Volume analysis of RFP-expressing M. marinum biofilm cords. The volumes of the M. marinum cords attached to the PDMS membrane in Figure 4 were calculated by the IMARIS 9.7.0 software Surface function. A total of 11 images from three independent membranes were analyzed for the normal gravity (NG) and RPM 2.0, and six images from two independent membranes were analyzed for the 3D clinostat (I 1.5 rpm O 3.875 rpm). For each image, the percentage of the total volume was calculated for each size category 0.5–9.99 μm3, 10–100 μm3, 101–500 μm3 and >500 μm3, and the average and standard deviation calculated from all the images are shown graphically. * = p < 0.05 compared to NG within a volume category.
3.3.2 Comparison of transcriptome changes of M. marinum in biofilm-promoting medium
Total RNA was isolated from the bacteria in suspension from the flaskettes (Supplementary Figure S5) and triplicate independent samples were used for RNA-Seq analysis. M. marinum has 5569 genes (http://Mycobrowser.epfl.ch) and the rRNA genes were filtered from the data. Genes with low expression were also removed if the minimum count was less than 10 in approximately 70% of the samples, and the minimum total count for a gene to be included in the analysis had to equal at least 15 in all samples. This filtering resulted in transcript changes in 3071 genes being considered for the comparison between samples.
A principal component analysis was performed, and the plot (Figure 6) shows that the individual samples from the RPM 2.0 and the 3D clinostat cluster together, indicating the samples have high similarity. One 3D clinostat sample appears to be an outlier compared to the other samples from the RPM 2.0 and 3D clinostat. However, this outlier did not cluster with the normal gravity samples, and the normal gravity samples are different from the RPM 2.0 and 3D clinostat samples.
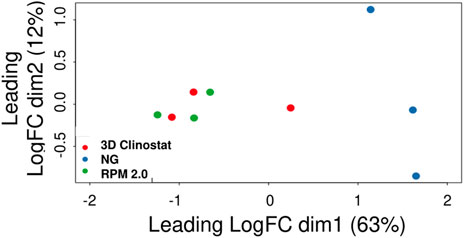
FIGURE 6. The Principal Component Analysis (PCA) Plot for RNA-Seq data from RFP-expressing M. marinum grown in Biofilm-Promoting Medium. Three independent RNA samples were isolated from bacteria in suspension in the flaskettes after 4 days of exposure to normal gravity (NG), or simulated microgravity in the RPM 2.0 or the 3D clinostat (I = 1.5 rpm O = 3.875 rpm). Ribosomal RNA (rRNA) was depleted and RNA-Seq performed. Sequences were assigned to M. marinum genes. After filtering to remove the reads for the residual rRNA in the samples and for genes with low expression, the data for 3071 genes for all the samples were subjected to a principal component analysis to determine the similarity between samples by the clustering of the individual samples.
A differential expression analysis for the 3071 genes was used to compare the RPM 2.0 and normal gravity samples, the 3D clinostat and normal gravity samples, and the 3D clinostat and RPM 2.0 samples (Figure 7, Supplementary Table S1A). Significant changes in gene expression were found when the normal gravity samples were compared with either the RPM 2.0 or the 3D clinostat samples. However, there were no significant changes in gene expression identified when the RPM 2.0 and the 3D clinostat samples were compared (Figure 7C). A Venn diagram was plotted showing the number of genes that had significant changes in transcript levels when the RPM 2.0 or the 3D clinostat samples were compared with the normal gravity samples (Supplementary Figure S6). There were 597 significant changes between the RPM 2.0 and normal gravity samples, 350 decreased and 247 increased, and 474 significant changes between the 3D clinostat and normal gravity samples, 292 decreased and 182 increased. Of these changes, there were 426 overlapping genes, and hence 80% of genes with alterations in transcript level were similar in the two comparisons. Again, this demonstrates the similarity between the samples from the RPM 2.0 and the 3D clinostat. Linkage between the samples subjected to simulated microgravity by the RPM 2.0 and the 3D clinostat was also demonstrated by examining hierarchical clustering of the top 200 differentially expressed genes of each comparison. This is visualized as a heatmap in Figure 8.
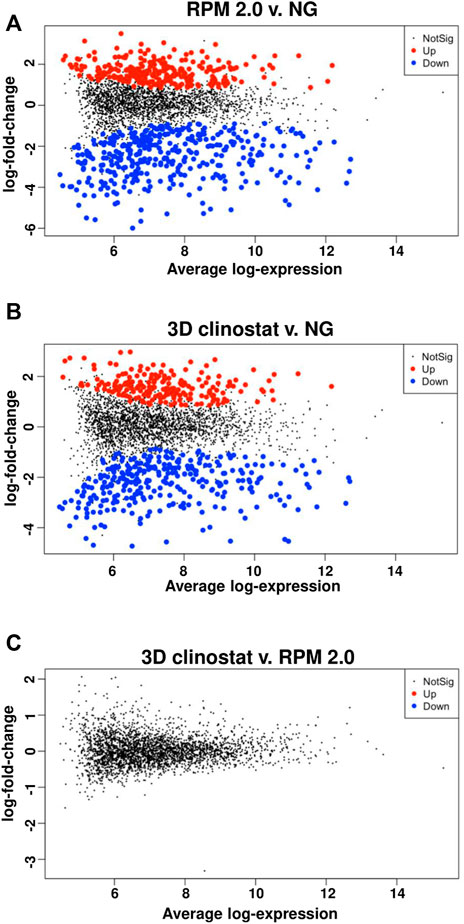
FIGURE 7. No Significant Changes in Gene Expression were Identified in RNA samples from RFP-expressing M. marinum Subjected to Simulated Microgravity using the RPM 2.0 and the 3D Clinostat. Differential expression analysis for 3071 genes was performed on RNA-Seq data from RNA isolated from RFP-expressing M. marinum grown in biofilm-promoting medium for 4 days under normal gravity (NG) or simulated microgravity in the RPM 2.0 or the 3D clinostat (I 1.5 rpm O 3.875 rpm). The plots are shown for RPM 2.0 versus NG (A), 3D clinostat versus NG (B) and 3D clinostat versus RPM 2.0 (C).
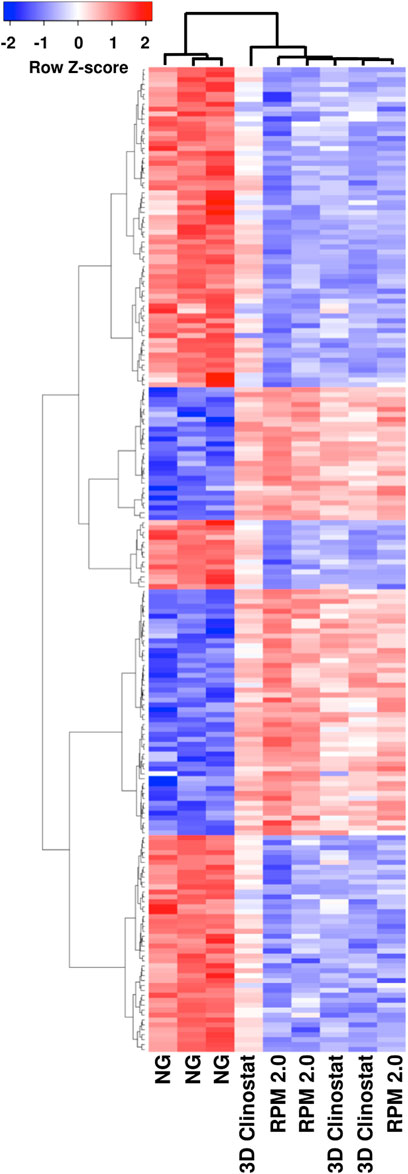
FIGURE 8. Hierarchical Clustering of the Top 200 Differentially Expressed Genes from the Comparison Analyses for RPM 2.0 versus NG, and 3D clinostat versus NG. The top 200 differentially expressed genes were identified from the RNA-Seq data analyses for RPM 2.0 versus NG, and 3D clinostat versus NG. The expression of these genes was examined in all the RNA samples and a heatmap generated. The heatmap is shown and demonstrates linkage between the samples from RFP-expressing M. marinum subjected to simulated microgravity using the RPM 2.0 and the 3D clinostat.
Since it was cost prohibitive to generate another RNA-Seq 3D clinostat sample, and to confirm that the 3D clinostat outlier sample was not skewing the data, the differential gene expression analyses were repeated without the outlier (Supplementary Table S1B). No genes were identified to have significantly different gene expression in the 3D clinostat and RPM 2.0 samples. Further analyses were performed reducing the stringency of the low expression count to 5, and with and without the 3D clinostat outlier (Supplementary Table S1C, D). This increased the number of genes examined for differential expression to 3925. Again no genes were identified to have significantly different gene expression in the 3D clinostat and RPM 2.0 samples. This procedure was also repeated including all the genes except the rRNA genes and pseudogenes. This resulted in gene expression in 5557 genes being examined, and no significant changes between the RPM 2.0 and 3D clinostat samples were found (Supplementary Table S1E). Therefore, the outlier sample and the filtering of the low expression genes did not prevent the identification of genes with significant changes in expression in the comparison of the 3D clinostat and RPM 2.0 samples.
3.3.3 Comparison of M. marinum planktonic growth and rifampicin survival
Planktonic mycobacterium growth medium differs from biofilm-promoting medium in that it contains 0.2% (v/v) Tween 80, which helps to reduce bacterial aggregation and allows for the quantitation of growth by CFU/mL. Hence, growth and survival were assessed using OD600 and CFU/mL. Rifampicin was chosen as the test antibiotic as it is used to treat M. tuberculosis and other mycobacterium infections such as M. avium complex and M. marinum (Alifano et al., 2015; Abulfathi et al., 2019). Rifampicin is soluble in dimethylsulfoxide (DMSO) and all control cultures (no rifampicin) contained 0.05% (v/v) DMSO. The control cultures were used to compare the growth of the M. marinum under the different conditions. Two different time-points and treatment regimens were examined and HARVs were used as the treatment vessel.
3.3.3.1 Twenty-four-hour treatment
Cultures were exposed to normal gravity using the Synthecon 2D clinostat at 25 rpm in the normal gravity orientation (Figure 1D, left image), or simulated microgravity using the RPM 2.0, the Synthecon 2D clinostat at 25 rpm in the microgravity orientation (Figure 1D, right image), and the 3D clinostat at inner and outer frame velocity combinations of 0.75 rpm and 3.625 rpm, and 1.5 rpm and 3.875 rpm, respectively. M. marinum at an OD600 of 0.04 with ± 0.8 μg/ml rifampicin were used to fill the HARVs, and this was equivalent to 2.72 × 10⁷ ± 0.75 × 10⁷ CFU/μg rifampicin. Experiments were performed at the MSSF at Kennedy Space Center comparing normal gravity, the RPM 2.0 and the 3D clinostat at inner and outer frame velocities of 1.5 rpm and 3.875 rpm, respectively (Figures 9A,C, Supplementary Figures S7A,C,E), and at LSUHSC comparing normal gravity, the Synthecon 2D clinostat LSMMG and the 3D clinostat at inner and outer frame velocities of 0.75 rpm and 3.625 rpm, respectively, (Figures 9B,D, Supplementary Figures S7B,D,F). The OD600, CFU/mL and percentage of rifampicin survival data is shown in Supplementary Figure S7. The CFU/mL data from the DMSO-treated cultures was converted to fold change compared to normal gravity to compare growth under the different experimental conditions (Figures 9A,B). There were no substantial differences in growth for normal gravity, 3D clinostat and RPM 2.0 control cultures after 24 h (Figures 9A,B). Only the 2D clinostat LSMMG culture had significantly decreased growth compared to normal gravity. The rifampicin survival data was also converted to fold change compared to normal gravity (Figures 9C,D) and there was no substantial difference in rifampicin survival between the normal gravity and any of the simulated microgravity cultures. The only statistical difference was between the 3D clinostat culture (I = 1.5 rpm and O = 3.875 rpm) and the RPM 2.0.
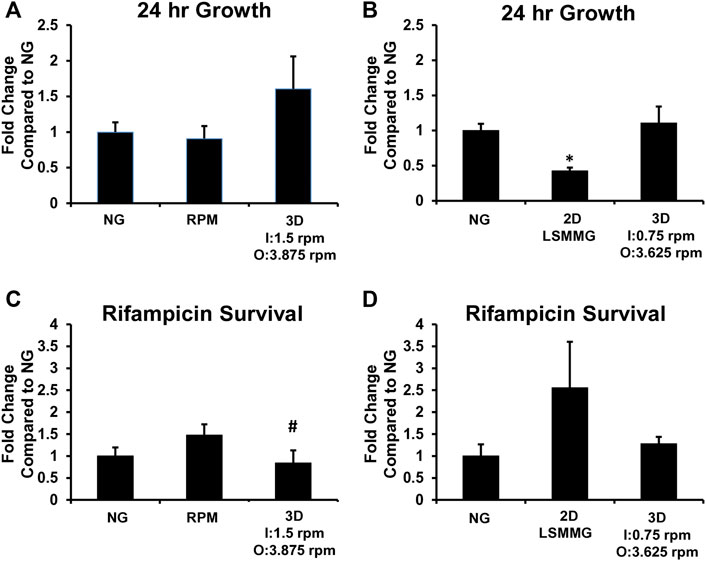
FIGURE 9. Twenty-Four-Hour M. marinum Growth and Rifampicin Survival. M. marinum were grown in 10 ml HARVs in medium to promote planktonic growth with or without 0.8 μg/ml rifampicin for 24 h at 31°C. The RPM 2.0 (RPM) was operated using the 0 g file, and the Synthecon 2D clinostat at 25 rpm was used for the normal gravity (NG) and LSMMG conditions. For the 3D clinostat, I = inner frame velocity in rpm and O = outer frame velocity in rpm. The CFU/mL from the cultures grown without rifampicin were used to calculate the fold change in CFU/mL for the cultures exposed to simulated microgravity compared to NG cultures (A,B). The percentage of M. marinum surviving the 24-h rifampicin treatment was used to calculate the fold change in rifampicin survival compared to the NG cultures (C,D). Work to generate data for A and C was performed at Kennedy Space Center and at LSUHSC for B and D. Experiments were performed three times and the average and standard deviation is shown. *p < 0.05 compared to NG, #p < 0.05 compared to RPM.
3.3.3.2 Four-day treatment
Since the doubling time for M. marinum in early exponential phase is 6–7 h (Abshire et al., 2016), a 4-day treatment was also examined for effects of simulated microgravity on growth and rifampicin survival. By comparing the CFU/mL at the start and the end of the experiments, 4 days allowed the bacteria to double at least 12 times under normal gravity, whereas only ∼4 doublings were achieved in the 24-h experiments (data not shown). Experiments were performed with the Synthecon 2D clinostat at 25 rpm in the normal gravity orientation and the LSMMG orientation, and the 3D clinostat operating at inner and outer frame velocity combinations of 0.75 rpm and 3.625 rpm, 1.5 rpm and 3.875 rpm, and 2 rpm and 1.125 rpm, respectively. M. marinum at an OD600 of 0.0005 with ± 0.05 μg/ml rifampicin were used to fill the HARVs, and this was equivalent to 4.34 × 10⁶ ± 1.42 × 10⁶ CFU/μg rifampicin. The OD600, CFU/mL and percentage of rifampicin survival data is shown in Supplementary Figure S8. The CFU/mL data (DMSO-treated cultures) and the percentage rifampicin survival data was converted to fold change compared to the 2D clinostat LSMMG culture, since this culture condition was common to all experiments (Figure 10).
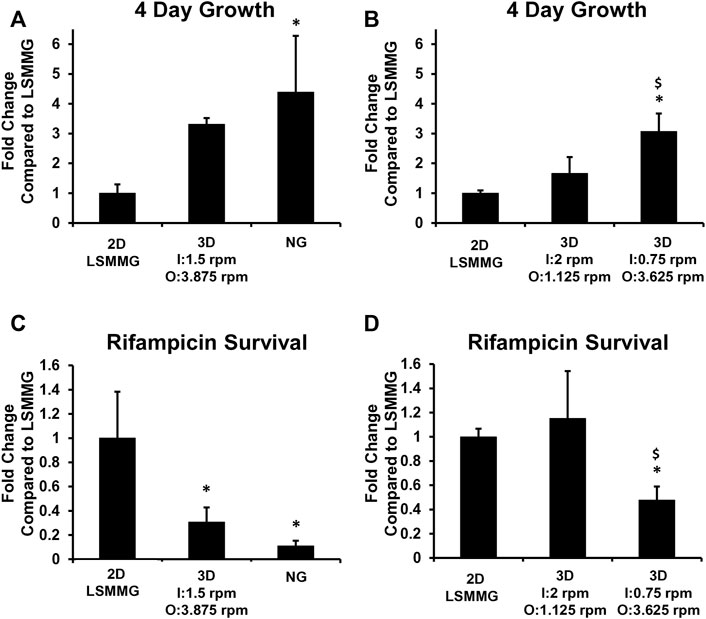
FIGURE 10. Four-Day M. marinum Growth and Rifampicin Survival. M. marinum were grown in 10 ml HARVs in medium to promote planktonic growth with or without 0.05 μg/ml rifampicin for 4 days at 31°C. The Synthecon 2D clinostat was operated at 25 rpm for the normal gravity (NG) and LSMMG conditions. For the 3D clinostat, I = inner frame velocity in rpm and O = outer frame velocity in rpm. All work was performed at LSUHSC. Experiments in A and C used the 4 unit Synthecon 2D clinostat for the NG and LSMMG cultures. Due to the size of the units, the 4 unit Synthecon 2D clinostat for NG and LSMMG cultures were operated in a different incubator to the 3D clinostat. Experiments in B and D used two single unit Synthecon 2D clinostats for LSMMG and the units were operated in the same incubator as the 3D clinostat. The CFU/mL from the cultures grown without rifampicin were used to calculate the fold change in CFU/mL for the cultures compared to the LSMMG cultures (A,B). The percentage of M. marinum surviving the 4-day rifampicin treatment was used to calculate the fold change in rifampicin survival compared to the LSMMG cultures (C,D). Experiments were performed three times and the average and standard deviation is shown. *p < 0.05 compared to LSMMG, $ p < 0.05 compared to (I) 2 rpm O: 1.125 rpm.
For growth, the normal gravity and the 3D clinostat operating at I = 0.75 rpm and O = 3.625 rpm grew significantly more than the 2D LSMMG culture (Figures 10A, B). When the 3D clinostat was operated at I = 1.5 rpm and O = 3.875 rpm, growth was approximately three times higher than the 2D LSMMG culture, although was not found to be statistically different. Growth in the 2D LSMMG culture and the 3D clinostat at I = 2 rpm and O = 1.125 rpm were very similar. To confirm that the growth in these cultures was not perturbed by DMSO, the growth study was repeated without DMSO using the single unit 2D Synthecon normal gravity, single unit 2D Synthecon LSMMG unit and the 3D clinostat at I: 2rpm O: 1.125 rpm in the same incubator. The growth of the culture from the 3D clinostat was very similar to the 2D LSMMG culture (Supplementary Figure S9).
For rifampicin survival (Figures 10C,D), the 2D LSMMG culture and the culture on the 3D clinostat at I: 2 rpm and O: 1.125 rpm were not significantly different and bacteria in these cultures survived 6–9 times more than the bacteria in the normal gravity culture. The bacteria in the cultures on the 3D clinostat at the higher frame velocities survived 2–3 times less than the 2D LSMMG culture.
4 Discussion
Currently, for a researcher to use a 3D clinostat, they have three options: visit a facility that has 3D clinostats, such as the MSSF at Kennedy Space Center, purchase a commercially available 3D clinostat, or design and build one. Visiting an external facility can be an expensive and complicated process, and purchasing an RPM 2.0 or GRAVITE can be cost prohibitive. The SciSpinner has provided a cheaper commercial option for investigators and is being tested in labs across the US. This is a new product so it will be interesting to see how different types of biological samples grow in the clinostat, and how the results compare to other 3D clinostats. Many researchers would benefit from being able to easily build their own clinostat without needing to design and verify the efficacy of its simulation. To assist researchers, we are providing the design files needed to 3D print the structure of the clinostat (see GitHub https://github.com/Joey-Clary/3D-Clinostat), and the computer programs needed to control the clinostat (Supplementary Material). A recent publication (Hasenstein 2022) also provides a blueprint for a 3D printed clinostat. The advantage of our 3D clinostat is that we have validated the operating conditions by comparing biological results with the RPM 2.0 and the Synthecon 2D clinostat.
4.1 3D clinostat design
3D clinostats can be large machines that do not fit in an incubator (Hoson et al., 1997); Wuest et al., 2014; Ikeda et al., 2016). The 3D clinostat designed by Wuest et al. (2014) overcame this problem by integrating a small incubator into the inner frame of the 3D clinostat. The inexpensive 3D clinostat described in our study is similar to the 3D clinostat developed by Kim et al. (2017) and the RPM 2.0 (Yuri), which have a small enough footprint to fit within a standard cell culture incubator.
The base design of our 3D clinostat with two rotating frames, a sample stage and a stand is the same as previously developed machines (Hoson et al., 1997; Van Loon 2007; Wuest et al., 2014; Kim et al., 2017); however, most 3D clinostats in the literature are made of metal. The structure of our new 3D clinostat is made of PLA plastic and designed to be 3D printed, as is the SciSpinner (CosE). This reduces the material costs and allows for quick and easy manufacturing. Additionally, this allows for future use in experiments involving ionizing radiation to analyze the combined effects of microgravity and exposure to radiation. Metallic structures scatter the radiation, altering the radiation field and the dose (Kinhikar et al., 2014; Toivonen et al., 2019) at the target. To overcome this, studies have irradiated the samples first and then subjected them to simulated microgravity (Pani et al., 2016; Ma et al., 2021), but samples are not exposed to the two stressors at the same time with this protocol. Californium-252 has been used to expose samples rotating on the RPM (developed by Airbus), but dosimetry although performed was not positioned at the sample (Beck et al., 2014). One group has designed and implemented a system where the samples on the rotating clinostat are irradiated with x-rays or carbon ions only when the sample is in the horizontal position and dosimetry was performed at the sample (Ikeda et al., 2016; Ikeda et al., 2017). This was designed to prevent a non-uniform radiation field and to align better with the static control sample, but it is not easy to replicate. Low dose-rate gamma and neutron irradiation rooms have been designed by researchers (Holden et al., 2021; Sadhukhan et al., 2021) to irradiate mice and could be adapted for irradiation of cells on a 3D clinostat made from PLA. The whole clinostat would be irradiated, and dosimetry performed at the sample holder during irradiation. This would ensure that control non-rotating samples could be irradiated with a similar dose.
4.2 Optimizing the 3D clinostat operating conditions
Algorithms control the velocity of the 3D clinostat’s motors, and they can be divided into two categories: random positioning and constant velocity. The aim of the algorithm is to symmetrically distribute the acceleration vector in space and to avoid a highly repetitive pattern of distribution so as the biological organism being tested is not able to adapt to the changes in the acceleration vector. An example of a highly repetitive distribution pattern can be seen in Supplementary Figure S2, which was generated from data from an accelerometer attached to our 3D clinostat v1, operating at an inner frame velocity of 0.625 rpm and an outer frame velocity of 0.5 rpm. Random positioning provides a simple solution to symmetrically distributing the sample’s acceleration vector in space; however, random positioning can be achieved by more than one type of frame motion. For example, while Hoson et al. (1997) vary the inner and outer frame velocities randomly over time, Wuest et al. (2014) sets both the inner and outer frame to the same velocity and at random time intervals inverts the direction of rotation. Because the algorithms used by the RPM 2.0 (Yuri) are proprietary, it is unclear what approach is used for the RPM 2.0; however, based on observation, it is likely similar to that used by Hoson et al. (1997). Our 3D clinostat and the 3D clinostats developed by Kim et al. (2017) and Ikeda et al. (2016), Ikeda et al. (2017) utilize a constant velocity algorithm where the inner and outer frames are rotated at different constant velocities. Although constant velocity algorithms are much simpler to implement, the high number of potential frame velocity combinations require a computer model to identify the optimal combination of constant frame velocities. For this work, a computer model was developed based around modeling the dynamics of the acceleration vector using spherical coordinates. Using the data generated by this computer model, the magnitude of the time-averaged acceleration vector and the distribution score of the acceleration vector were analyzed to determine the optimal operating conditions. Because the velocity of the 3D clinostat’s motors can be set in increments of 0.125 rpm, a range of combinations of inner and outer frame velocities were analyzed from 0.125 rpm to 4 rpm. The slower the velocities of the frames, the less likely residual accelerations will interfere with the microgravity simulation. Other researchers have optimized the frame velocities using a computer simulation (Wuest et al., 2014; Kim et al., 2017) but this is the first report describing the predicted time-averaged magnitudes and a quantitated distribution of the acceleration vector for different frame velocity combinations (Figure 2, Supplementary Data, Supplementary Figure S2, S4). The computer simulation very clearly demonstrates the worst velocity combinations are when the two frames are operated at equal constant velocity (Figure 2), and this agrees with a similar observation previously reported by Borst and van Loon (2009). However, our work also shows that as the ratio between inner and outer frame velocity approaches 1, the time-averaged magnitude increases steadily and then spikes to 0.5 g when the velocities are equal (Figure 2).
Previous published studies have only described one operating condition for their 3D clinostat (Ikeda et al., 2016; Ikeda et al., 2017; Kim et al., 2017) and have not compared the operation of the 3D clinostat with the RPM 2.0. We selected three inner and outer frame velocity combinations in rpm of I = 1.5 O = 3.875, I = 0.75 O = 3.625, and I = 2 O = 1.125 that satisfied the conditions of the lowest predicted time-averaged magnitude with the highest distribution score, and that generated a symmetrical distribution of the acceleration vector, as previously recommended (Borst and van Loon 2009). The latter two velocity combinations were also selected as they were slower velocity combinations, which reduces the potential for residual acceleration. These operating conditions were validated by operating the RPM 2.0 in constant velocity mode and analyzing the data output by the well-established RPM 2.0 algorithm. Distribution of the acceleration vector was also validated using an accelerometer mounted on the 3D clinostat and the RPM 2.0 for the operating condition of I = 1.5 rpm O = 3.875 rpm (Supplementary Figure S4). These tests confirmed the three frame velocity combinations simulate time-averaged microgravity.
4.3 Comparison of biological experiments performed with the 3D clinostat, the RPM 2.0 and the synthecon 2D clinostat
Published studies of researcher-designed 3D clinostats have examined biological endpoints but only at one operating condition, and results were not compared to results obtained using other clinostats. This study is novel as we have compared the results of biological experiments using the 3D clinostat at three different optimal operating velocities identified by the computer model, and two other clinostats: the RPM 2.0 or the Synthecon 2D clinostat. M. marinum was selected as the organism for the comparison experiments as it can form biofilms and grow attached to a surface, and can grow as a culture that is free-floating. Identical culture vessels and bacterial cultures were used for experiments, and where possible the clinostats were operated in the same incubator. The experiments performed to examine biofilm and rifampicin survival are also the first to be reported for M. marinum.
4.3.1 Growth of M. marinum in biofilm-promoting medium
When RFP-expressing M. marinum in a sealed flaskette were exposed for 4 days to normal gravity or simulated microgravity on the RPM 2.0 or the 3D clinostat operating at I = 1.5 rpm O = 3.875 rpm, the bacteria in suspension in cultures from the 3D clinostat and the RPM 2.0 formed a cluster or mass of bacteria. The normal gravity cultures had aggregates, but they were not clustered together. Aggregate formation is normal for M. marinum in biofilm-promoting medium as they tend to stick together in the absence of Tween 80 (Abshire et al., 2016), but the formation of a mass of cells is not usual. This enhanced clustering phenotype has previously been seen in cultures of Escherichia coli (Zea et al., 2017), Salmonella typhimurium (Wilson et al., 2007), and Candida albicans (Crabbe et al., 2013) in space and in Pseudomonas aeruginosa PA01 (Crabbe et al., 2008), and Staphylococcus aureus (Castro et al., 2011) cultures exposed to LSMMG in HARVs on the Synthecon 2D clinostat. These previous studies identified enhanced extracellular matrix and possible biofilm-formation as a possible reason for the cell clustering. Transcriptome studies were performed on the bacteria in suspension in our study. From the literature (Yamazaki et al., 2006; Lai et al., 2018; Hegde 2020) and by identifying M. marinum orthologues (Mycobrowser (epfl.ch) of M. avium and M. tuberculosis genes, we assembled a list of 64 genes involved in biofilm formation and eight involved in quorum sensing. From this list, 11 genes associated with biofilm formation and two associated with quorum sensing had significantly different transcript levels in the RPM 2.0 bacteria compared to normal gravity. Seven of these genes for biofilm formation and both of the genes involved in quorum sensing were also significantly altered in the 3D clinostat culture compared to normal gravity (data not shown). A full analysis of transcript changes is beyond the scope of this study, but since there were few significant changes in the expression genes related to biofilm formation, it is possible that the enhanced clustering of the M. marinum was due to the motion of the bacteria in the fluid under simulated microgravity resulting in the floating mass. The mass of M. marinum in the RPM 2.0 and 3D clinostat cultures did fall apart very easily.
The RFP-expressing bacteria attached to the PDMS membrane in all cultures formed the cording phenotype seen in M. marinum biofilms (Hall-Stoodley et al., 2006). However, the normal gravity biofilms attached to the PDMS had a greater percentage of smaller cord volumes than the biofilms from the 3D clinostat and RPM 2.0 cultures, which again were found not to be significantly different. Other researchers have also noted alterations to the structure of the biofilm for bacteria flown in space (Kim et al., 2013) and exposed to simulated microgravity on Earth (Cheng et al., 2014).
Other supporting evidence for the 3D clinostat producing the same biological effect as the RPM 2.0 is that there were no significant differences identified between the transcriptomes from the bacteria in suspension from the RPM 2.0 and the 3D clinostat. Significant differences in transcript levels were found for 597 genes between the normal gravity and the RPM 2.0 cultures, and for 474 genes between the normal gravity and the 3D clinostat cultures, and 426 genes were common to both comparisons.
4.3.2 M. marinum planktonic growth and rifampicin survival
It is well established that antibiotic resistance changes when bacteria are grown in space (Zea et al., 2017) and these changes can persist when bacteria return to Earth (Yang et al., 2021). Rifampicin is an antibiotic used to treat M. tuberculosis, M. avium complex and M. marinum infections (Alifano et al., 2015; Abulfathi et al., 2019) as well as other bacterial infections including methicillin-resistant Staphylococcus aureus (MRSA), Listeria spp., Neisseria gonorrhoeae, Haemophilus influenzae and Legionella pneumophila (Alifano et al., 2015). It is therefore an important antibiotic in the fight against human infection. Rifampicin survival was therefore a biological endpoint used to compare the 3D clinostat with the RPM 2.0 and the Synthecon 2D clinostat operated in normal gravity and LSMMG orientations.
Rifampicin is dissolved in DMSO and the cultures contain a final concentration of 0.05% (v/v) DMSO. The addition of DMSO did not alter the growth of M. marinum. The control cultures of the rifampicin survival experiments were therefore used to monitor cell density. Previous studies from our group have established that M. marinum does not reach as high a cell density when subjected to LSMMG (Abshire et al., 2016). This is likely because of reduced mass transport due to a lack of convection in fluid under microgravity (Klaus et al., 1997). In our previous study, the difference in growth between normal gravity and LSMMG was more evident after 4 days (Abshire et al., 2016), therefore growth and rifampicin survival were determined from 24-h and 4-day-treated cultures. After 24 h, there was no significant change in rifampicin survival and the only change in growth was in the LSMMG culture from the 2D clinostat. Four-day experiments were only performed with cultures grown on the 2D clinostat under normal gravity and LSMMG, and the 3D clinostat operated at the three optimal conditions identified by the computer model. Again, the LSMMG culture had reduced cell density compared to the normal gravity culture. One operating condition (I = 2 rpm O = 1.125 rpm) for the 3D clinostat resulted in the same cell density as the 2D clinostat LSMMG culture and the same elevated rifampicin survival as the LSMMG culture. These two cultures had about 6–9 times greater rifampicin survival than the normal gravity culture. Enhanced survival could be due to alterations in drug permeability or efflux mechanisms (Goldstein 2014). Rv1258c in M. tuberculosis encodes a drug efflux pump that increases resistance to rifampicin (Jia et al., 2022). The M. marinum orthologue is MMAR_4182 and the transcript level of this gene was found to increase 2-fold after long exposure, but not short exposure to LSMMG (Abshire et al., 2016). The cultures with greater rifampicin survival had lower cell densities, indicating a slower growth rate. Slower growth can result in availability of DnaA, which can protect RNA polymerase from the inhibitory effect of rifampicin (Flatten et al., 2009). The lack of convection and reduction in mass transport in simulated microgravity could also reduce bacterial exposure to the antibiotic (Zea et al., 2016). Further experiments will be needed to determine whether after growth under simulated microgravity the minimum inhibitory concentration of rifampicin increases, or whether mutations in the β subunit of RNA polymerase have occurred to promote resistance.
4.4 Recommendations for 3D clinostat operating conditions
From the experimental results, two operating conditions were identified: Operating at I = 1.5 rpm and O = 3.875 rpm reproduced the effect of the RPM 2.0 on the biofilm culture in a sealed flaskette, and operating at I = 2 rpm O = 1.125 rpm reproduced the 4-day planktonic growth and the rifampicin survival found for the HARV 2D LSMMG culture conditions. When comparing planktonic growth, the 3D clinostat operating at I = 1.5 rpm and O = 3.875 rpm or I = 0.75 rpm O = 0.625 rpm produced biological effects that were intermediate between the normal gravity and 2D LSMMG. An obvious difference between the two sets of experiments was the type of vessel used for the culture. A sealed vessel was used in the biofilm studies and a HARV with a gas exchange membrane was used for the planktonic growth and rifampicin survival studies. Operating the 3D clinostat at faster speeds could increase the airflow around the HARV and greater oxygenation could influence the bacterial growth rate and rifampicin survival.
Another major influence on bacterial growth and rifampicin survival under microgravity is the lack of density driven convection. Under microgravity, mixing within the vessel is mainly by diffusion. Under normal gravity, density driven convection increases mass transport, which increases the delivery of nutrients to the bacteria and removal of waste products from the bacteria. Both of which influence bacterial growth. Recent studies compared the density driven distribution of a dye in a HARV filled with water attached to the RPM 2.0 (operating using the 0 g file to simulate microgravity) and the Synthecon 2D clinostat operating at different speeds (Diaz et al., 2022). The low density dye mixed readily in the HARV on the RPM 2.0 and was fully dispersed in 20 min (Diaz et al., 2022). On the Synthecon 2D clinostat, the dye remained closer to the injection port at 20 min, which indicates lower mass transport as found under microgravity. In our 24 h study (Figure 9), the HARV culture on the 2D Synthecon under LSMMG grew less than the cultures under normal gravity, or simulated microgravity on the RPM 2.0 and the 3D clinostat operating at the two higher velocity combinations. In the 4-day experiment, the results from planktonic growth for the 2D LSMMG condition and the 3D clinostat operated at the lower velocity combination (I = 2 rpm and O = 1.125 rpm) were very similar. It is possible that the cultures on the RPM 2.0 and the higher velocity combinations on the 3D clinostat have higher mass transport than the cultures on the 3D clinostat operating at I = 2 rpm and O = 1.125 rpm and the Synthecon 2D LSMMG. This would suggest that for planktonic growth, the 3D clinostat should be set at I = 2 rpm and O = 1.125 rpm to produce an environment closer to microgravity for mass transport. However, for attached growth and in a sealed flask where cells are not suspended in the body of the solution, the higher velocity combination should be used (I = 1.5 rpm and O = 3.875 rpm) to mimic the conditions on the RPM 2.0.
5 Concluding remarks
We have developed an inexpensive 3D printed 3D clinostat, have optimized the operating conditions using a computer model, and compared biological experiments on the 3D clinostat with experiments done at the same time with the same bacterial cultures on the RPM 2.0 and the Synthecon 2D clinostat. The results of all these experiments demonstrate that the inexpensive 3D clinostat can produce comparable results to the RPM 2.0 and the Synthecon 2D clinostat. This validates the 3D clinostat and will allow researchers to build 3D clinostats and perform simulated microgravity experiments at their home institutes at low cost.
Data availability statement
Datasets are available on request: The raw data supporting the conclusions of this article will be made available by the authors, without undue reservation. The data relating to the RNASeq study is available at GENELAB Accession number: GLDS-528 DOI: 10.26030/r3re-fd65.
Author contributions
The 3D clinostat was designed, 3D printed, built and operated by JC. The computer programs and work on the optimization and validating the frame velocities was by JC. JC and CF developed the computer model. CF generated the RFP-expressing bacteria. KL grew the M. marinum and setup the biofilm cultures. RS performed statistical analyses. JA helped with 3D printing. JR operated the RPM 2.0 at Kennedy Space Center and advised on the RPM 2.0. RS and JW performed the bioinformatic analyses. XL helped with microscopy and statistics on the images. JC helped with biological experiments at Kennedy Space Center and performed microscopy image analysis. LH designed and performed all the biological experiments. JC and LH wrote the manuscript with input from other authors.
Funding
This work was funded by NASA grant number 80NSSC18K1467 (LH) and Louisiana Space Research Enhancement Award number PO-0000138470 (LH) and grant P20GM134974 (RS, JW) that funds the Bioinformatic and Modeling Core.
Acknowledgments
We would like to thank the Microgravity Simulation Support Facility at Kennedy Space Center, especially Ye Zhang, for access to the RPM 2.0, the LSU Shreveport Cyber Collaboratory for the use of 3D printers, and Kelsea Keys for microscopy work. Confocal images were generated using the instruments and services at the Microscopy Imaging Core at the Research Core Facility at LSU HSC Shreveport. RNA Sequencing was supported by the Research Core Facility Genomics Core at LSU HSC Shreveport.
Conflict of interest
Author JR is employed by LASSO Contract, Amentum, Inc.
The remaining authors declare that the research was conducted in the absence of any commercial or financial relationships that could be construed as a potential conflict of interest.
Publisher’s note
All claims expressed in this article are solely those of the authors and do not necessarily represent those of their affiliated organizations, or those of the publisher, the editors and the reviewers. Any product that may be evaluated in this article, or claim that may be made by its manufacturer, is not guaranteed or endorsed by the publisher.
Supplementary material
The Supplementary Material for this article can be found online at: https://www.frontiersin.org/articles/10.3389/frspt.2022.1032610/full#supplementary-material
Abbreviations
NG, normal gravity; LSMMG, low-shear-modeled microgravity; rpm, revolutions per minute; I, inner frame; O, outer frame; OD600, optical density at 600 nm; CFU, colony forming unit; MSSF, Microgravity Simulation Support Facility.
References
Abshire, C., Prasai, K., Soto, I., Shi, R., Concha, M., Baddoo, M., et al. (2016). The effects of low shear simulated microgravity on Mycobacterium marinum: Growth, survival and gene expression. npj Microgravity 2, 16038. doi:10.1038/npjmgrav.2016.38
Abulfathi, A. A., Decloedt, E. H., Svensson, E. M., Diacon, A. H., Donald, P., and Reuter, H. (2019). Clinical pharmacokinetics and pharmacodynamics of rifampicin in human tuberculosis. Clin. Pharmacokinet. 58, 1103–1129. doi:10.1007/s40262-019-00764-2
Alifano, P., Palumbo, C., Pasanisi, D., and Tala, A. (2015). Rifampicin-resistance, rpoB polymorphism and RNA polymerase genetic engineering. J. Biotechnol. 202, 60–77. doi:10.1016/j.jbiotec.2014.11.024
Beck, M., Moreels, M., Quintens, R., Abou-El-Ardat, K., El-Saghire, H., Tabury, K., et al. (2014). Chronic exposure to simulated space conditions predominantly affects cytoskeleton remodeling and oxidative stress response in mouse fetal fibroblasts. Int. J. Mol. Med. 34, 606–615. doi:10.3892/ijmm.2014.1785
Borst, A. G., and van Loon, J. J. W. A. (2009). Technology and developments for the random positioning machine, RPM. Microgravity Sci. Technol. 21, 287–292. doi:10.1007/s12217-008-9043-2
Braveboy-Wagner, J., and Lelkes, P. I. (2022). Impairment of 7F2 osteoblast function by simulated partial gravity in a random positioning machine. NPJ Microgravity 8, 20. doi:10.1038/s41526-022-00202-x
Castro, S. L., Nelman-Gonzalez, M., Nickerson, C. A., and Ott, M. (2011). Induction of attachment-independent biofilm formation and repression of Hfq expression by low-fluid-shear culture of Staphylococcus aureus. Appl. Environ. Microbiol. 77, 6368–6378. doi:10.1128/aem.00175-11
Cheng, X., Xu, X., Chen, J., Zhou, X., Cheng, L., Li, M., et al. (2014). Effects of simulated microgravity on Streptococcus mutans physiology and biofilm structure. FEMS Microbiol. Lett. 359, 94–101. doi:10.1111/1574-6968.12573
Costantini, D., Overi, D., Casadei, L., Cardinale, V., Nevi, L., Carpino, G., et al. (2019). Simulated microgravity promotes the formation of tridimensional cultures and stimulates pluripotency and a glycolytic metabolism in human hepatic and biliary tree stem/progenitor cells. Sci. Rep. 9, 5559. doi:10.1038/s41598-019-41908-5
Crabbe, A., De Boever, P., Van Houdt, R., Moors, H., Mergeay, M., and Cornelis, P. (2008). Use of the rotating wall vessel technology to study the effect of shear stress on growth behaviour of Pseudomonas aeruginosa PA01. Environ. Microbiol. 10, 2098–2110. doi:10.1111/j.1462-2920.2008.01631.x
Crabbe, A., Nielsen-Preiss, S. M., Woolley, C. M., Barrila, J., Buchanan, K., McCracken, J., et al. (2013). Spaceflight enhances cell aggregation and random budding in Candida albicans. PLoS ONE 8, e80677. doi:10.1371/journal.pone.0080677
Damm, T. B., Walther, I., Wuest, S. L., Sekler, J., and Egli, M. (2014). Cell cultivation under different gravitational loads using a novel random positioning incubator. Biotechnol. Bioeng. 111, 1180–1190. doi:10.1002/bit.25179
Diaz, A. M., Li, W., Irwin, T., O’Rourke, A., Khodadad, C., Hummerick, M., et al. (2022). “Investigation into simulated microgravity techniques used to study biofilm growth,” in Proceedings of the 51st International Conference on Environmental Systems, St. Paul, MN, July 10–14, 2022 Available at: https://hdl.handle.net/2346/89753.
Falkinham, J. O. (2021). Ecology of nontuberculous mycobacteria. Microorganisms 9, 2262. doi:10.3390/microorganisms9112262
Flatten, I., Morigen , , and Skarstad, K. (2009). DnaA protein interacts with RNA polymerase and partially protects it from the effect of rifampicin. Mol. Microbiol. 71, 1018–1030. doi:10.1111/j.1365-2958.2008.06585.x
Goldstein, B. P. (2014). Resistance to rifampicin: A review. J. Antibiot. (Tokyo). 67, 625–630. doi:10.1038/ja.2014.107
Hall-Stoodley, L., Brun, O. S., Polshyna, G., and Barker, L. P. (2006). Mycobacterium marinum biofilm formation reveals cording morphology. FEMS Microbiol. Lett. 257, 43–49. doi:10.1111/j.1574-6968.2006.00143.x
Hammond, T. G., and Hammond, J. M. (2001). Optimized suspension culture: The rotating wall vessel. Am. J. Physiology-Renal Physiology 281, F12–F25. doi:10.1152/ajprenal.2001.281.1.f12
Hasenstein, K. H. (2022). Blueprints for constructing microgravity analogs. Methods Mol. Biol. 2368, 215–232. doi:10.1007/978-1-0716-1677-2_14
Hegde, S. (2020). Computational identification of the proteins associated with quorum sensing and biofilm formation in Mycobacterium tuberculosis. Front. Microbiol. 10, 3011. doi:10.3389/fmicb.2019.03011
Herranz, R., Benguria, A., Lavan, D. A., Lopez-Vidriero, I., Gasset, G., Medina, F. J., et al. (2010). Spaceflight-related suboptimal conditions can accentuate the altered gravity response of Drosophila transcriptome. Mol. Ecol. 19, 4255–4264. doi:10.1111/j.1365-294x.2010.04795.x
Herranz, R., Valbuena, M. A., Manzano, A., Kamal, K. Y., Villacampa, A., Ciska, M., et al. (2022). Use of reduced gravity simulators for plant biological studies. Methods Mol. Biol. 2368, 241–265. doi:10.1007/978-1-0716-1677-2_16
Holden, S., Perez, R., Hall, R., Fallgren, C. M., Ponnaiya, B., Garty, G., et al. (2021). Effects of acute and chronic exposure to a mixed field of neutrons and photons and single or fractionated simulated galactic cosmic ray exposure on behavioral and cognitive performance in mice. Radiat. Res. 196, 31–39. doi:10.1667/RADE-20-00228.1
Hoson, T., Kamisaka, S., Masuda, Y., Yamashita, M., and Buchen, B. (1997). Evaluation of the three-dimensional clinostat as a simulator of weightlessness. Planta 203, 187–197. doi:10.1007/pl00008108
Ikeda, H., Souda, H., Puspitasari, A., Held, K. D., Hidema, J., Nikawa, T., et al. (2016). A new system for three-dimensional clinostat synchronized X-irradiation with a high speed shutter for space radiation research. Biol. Sci. Space 30, 8–16. doi:10.2187/bss.30.8
Ikeda, H., Souda, H., Puspitasari, A., Held, K. D., Hidema, J., Nikawa, T., et al. (2017). Development and performance evaluation of a three-dimensional clinostat synchronized heavy-ion irradiation system. Life Sci. Space Res. 12, 51–60. doi:10.1016/j.lssr.2017.01.003
Infanger, M., Kossmehl, P., Shakibaei, M., Bauer, J., Kossmehl-Zorn, S., Cogoli, A., et al. (2006). Simulated weightlessness changes the cytoskeleton and extracellular matrix proteins in papillary thyroid carcinoma cells. Cell Tissue Res. 324, 267–277. doi:10.1007/s00441-005-0142-8
Jia, H., Chu, H., Dai, G., Cao, T., and Sun, Z. (2022). Rv1258c acts as a drug efflux pump and growth controlling factor in Mycobacterium tuberculosis. Tuberculosis 133, 102172. doi:10.1016/j.tube.2022.102172
Kacena, M. A., and Todd, P. (1999). Gentamicin: Effect on E. coli in space. Microgravity Sci. Technol. 12, 135–137.
Kim, W., Tengra, F. K., Young, Z., Shong, J., Marchand, N., Chan, H. K., et al. (2013). Spaceflight promotes biofilm formation by Pseudomonas aeruginosa. PLoS ONE 8, e62437. doi:10.1371/journal.pone.0062437
Kim, Y. J., Jeong, A. J., Kim, M., Lee, C., Ye, s.-K., and Kim, S. (2017). Time-averaged simulated microgravity (taSMG) inhibits proliferation of lymphoma cells, L-540 and HDLM-2, using a 3D clinostat. Biomed. Eng. OnLine 16, 48. doi:10.1186/s12938-017-0337-8
Kinhikar, R. A., Tambe, C. M., Patil, K., Mandavkar, M., Deshpande, D. D., Gujjalanavar, R., et al. (2014). Estimation of dose enhancement to soft tissue due to backscatter radiation near metal interfaces during head and neck radiotherapy–A phantom dosimetric study with radiochromic film. Journal Medical Physics 39, 40–43.
Kiss, J. Z. (2014). Plant biology in reduced gravity on the Moon and Mars. Plant Biol. (Stuttg). 16 (1), 12–17. doi:10.1111/plb.12031
Kiss, J. Z., Wolverton, C., Wyatt, S. E., Hasenstein, K. H., and van Loon, J. J. W. A. (2019). Comparison of Microgravity Analogs to spaceflight in studies of plant growth and development. Front. Plant Sci. 10, 1577. doi:10.3389/fpls.2019.01577
Klaus, D., Simske, S., Todd, P., and Stodieck, L. (1997). Investigation of space flight effects on Escherichia coli and a proposed model of underlying physical mechanisms. Microbiology 143, 449–455. doi:10.1099/00221287-143-2-449
Kraft, T. F. B., van Loon, J. J. W. A., and Kiss, J. Z. (2000). Plastid position in Arabidopsis columella cells is similar in microgravity and on a random-positioning machine. Planta 211, 415–422. doi:10.1007/s004250000302
Lai, L.-Y., Lin, T.-L., Chen, Y.-Y., Hsieh, P.-F., and Wang, J.-T. (2018). Role of the Mycobacterium marinum ESX-1 secretion system in sliding motility and biofilm formation. Front. Microbiol. 9, 1160. doi:10.3389/fmicb.2018.01160
Ma, L., Kong, F., Gong, Y., Wang, Q., Liu, J., and Sui, L. (2021). Combined effects of proton radiation and simulated microgravity on the cell viability and ALP activity of murine osteoblast cells. Front. Public Health 9, 759236. doi:10.3389/fpubh.2021.759236
Morris, P., Marinelli, L. J., Jacobs-Sera, D., Hendrix, R. W., and Hatfull, G. F. (2008). Genomic characterization of mycobacteriophage Giles: Evidence for phage acquisition of host DNA by illegitimate recombination. J. Bacteriol. 190, 2172–2182. doi:10.1128/jb.01657-07
Mylabathula, P. L., Diak, D. M., Baker, F. L., Niemiro, G. M., Markofski, M. M., Crucian, B. E., et al. (2022). IL-2 and zoledronic acid therapy restores the in vivo anti-leukemic activity of human lymphocytes pre-exposed to simulated microgravity. Front. Biosci. 27, 215. doi:10.31083/j.fbl2707215
Nikolayev, V. S., Chatain, D., Beysens, D., and Pichavant, G. (2011). Magnetic gravity compensation. Microgravity Sci. Technol. 23, 113–122. doi:10.1007/s12217-010-9217-6
Pani, G., Verslegers, M., Quintens, R., Samari, N., de Saint-Georges, L., van Oostveldt, P., et al. (2016). Combined exposure to simulated microgravity and acute or chronic radiation reduces neuronal network integrity and survival. PLoS ONE 11, e0155260. doi:10.1371/journal.pone.0155260
Pettersson, B. M. F., Das, S., Behra, P. R. K., Jordan, H. R., Ramesh, M., Mallick, A., et al. (2015). Comparative sigma factor-mRNA levels in Mycobacterium marinum under stress conditions and during host infection. PLoS ONE 10, e0139823. doi:10.1371/journal.pone.0139823
Pietsch, J., Sickmann, A., Weber, G., Bauer, J., Egli, M., Wildgruber, R., et al. (2012). Metabolic enzyme diversity in different human thyroid cell lines and their sensitivity to gravitational forces. Proteomics 12, 2539–2546. doi:10.1002/pmic.201200070
Sadhukhan, R., Majumdar, D., Garg, S., Landes, R. D., McHargue, V., Pawar, S. A., et al. (2021). Simultaneous exposure to chronic irradiation and simulated microgravity differentially alters immune cell phenotype in mouse thymus and spleen. Life Sci. Space Res. (Amst). 28, 66–73. doi:10.1016/j.lssr.2020.09.004
Sheehan, K. B., McInnerney, K., Purevdorj-Gage, B., Altenburg, S. D., and Hyman, L. E. (2007). Yeast genomic expression patterns in response to low-shear modeled microgravity. BMC Genomics 8, 3. doi:10.1186/1471-2164-8-3
Toivonen, J., Bjorkqvist, M., Minn, H., Vallittu, P. K., and Rekola, J. (2019). Scattering of therapeutic radiation in the presence of craniofacial bone reconstruction materials. J. Appl. Clin. Med. Phys. 20 (12), 119–126.
Topolski, C., Divo, E., Li, X., Hicks, J., Chavez, A., and Castillo, H. (2022). Phenotypic and transcriptional changes in Escherichia coli K12 in response to simulated microgravity on the EagleStat, a new 2D microgravity analog for bacterial studies. Life Sci. Space Res. (Amst). 34, 1–8. doi:10.1016/j.lssr.2022.04.003
Van Loon, J. J. W. A. (2007). Some history and use of the random positioning machine, RPM, in gravity related research. Adv. Space Res. 39, 1161–1165. doi:10.1016/j.asr.2007.02.016
Wang, D., Bai, P., Zhang, B., Su, X., Jiang, X., Fang, T., et al. (2021). Decreased biofilm formation in Proteus mirabilis after short term exposure to a simulated microgravity environment. Braz. J. Microbiol. 52, 2021–2030. doi:10.1007/s42770-021-00588-y
Wilson, J. W., Ott, C. M., zu Bentrup, K. H., Ramamurthy, R., Quick, L., Porwollik, S., et al. (2007). Space flight alters bacterial gene expression and virulence and reveals a role for global regulator Hfq. Proc. Natl. Acad. Sci. U. S. A. 104, 16299–16304. doi:10.1073/pnas.0707155104
Wilson, J. W., Ramamurthy, R., Porwollik, S., McClelland, M., Hammond, T., Allen, P., et al. (2002). Microarray analysis identifies Salmonella genes belonging to the low-shear modeled microgravity regulon. Proc. Natl. Acad. Sci. U. S. A. 99, 13807–13812. doi:10.1073/pnas.212387899
Wuest, S. L., Richard, S., Walther, I., Furrer, R., Anderegg, R., Sekler, J., et al. (2014). A novel microgravity simulator applicable for three-dimensional cell culturing. Microgravity Sci. Technol. 26, 77–88. doi:10.1007/s12217-014-9364-2
Yamazaki, Y., Danelishvili, L., Wu, M., and MacNabBermudez, L. E. (2006). Mycobacterium avium genes associated with the ability to form a biofilm. Appl. Environ. Microbiol. 72, 819–825. doi:10.1128/aem.72.1.819-825.2006
Yang, J., Barrila, J., Ott, C. M., King, O., Bruce, R., McLean, R. J. C., et al. (2021). Longitudinal characterization of multispecies microbial populations recovered from spaceflight potable water. NPJ Biofilms Microbiomes 7, 70. doi:10.1038/s41522-021-00240-5
Zea, L., Larsen, M., Estante, F., Qvortrup, K., Moeller, R., de Oliveira, S. D., et al. (2017). Phenotypic changes exhibited by E. coli cultured in space. Front. Microbiol. 8, 1598. doi:10.3389/fmicb.2017.01598
Zea, L., Prasad, N., Levy, S. E., Stodieck, L., Jones, A., Shrestha, S., et al. (2016). A molecular genetic basis explaining altered bacterial behavior in Space. PLoS ONE 11, e0164359. doi:10.1371/journal.pone.0164359
Zhang, Y., Richards, J. T., Hellein, J. L., Johnson, C. M., Woodall, J., Sorenson, T., et al. (2022). NASA’s ground-based microgravity simulation facility. Methods Mol. Biol. 2368, 281–299. doi:10.1007/978-1-0716-1677-2_18
Keywords: 3D clinostat, 3D printed, time-averaged microgravity, Mycobacterium marinum, biofilm, rifampicin
Citation: Clary JL, France CS, Lind K, Shi R, Alexander JS, Richards JT, Scott RS, Wang J, Lu X-H and Harrison L (2022) Development of an inexpensive 3D clinostat and comparison with other microgravity simulators using Mycobacterium marinum. Front. Space Technol. 3:1032610. doi: 10.3389/frspt.2022.1032610
Received: 31 August 2022; Accepted: 05 October 2022;
Published: 28 October 2022.
Edited by:
Timothy Grant Hammond, Duke University, United StatesReviewed by:
Raul Herranz, Margarita Salas Center for Biological Research (CSIC), SpainJohn Z. Kiss, University of North Carolina at Greensboro, United States
Copyright © 2022 Clary, France, Lind, Shi, Alexander, Richards, Scott, Wang, Lu and Harrison. This is an open-access article distributed under the terms of the Creative Commons Attribution License (CC BY). The use, distribution or reproduction in other forums is permitted, provided the original author(s) and the copyright owner(s) are credited and that the original publication in this journal is cited, in accordance with accepted academic practice. No use, distribution or reproduction is permitted which does not comply with these terms.
*Correspondence: Lynn Harrison, bHlubi5jbGFyeUBsc3Vocy5lZHU=