 Rieke Freer
 Victoria Pesch
 Paul Zabel
- Synergetic Material Utilization, Department of System Analysis Space Segment, Institute of Space Systems, German Aerospace Center, Bremen, Germany
The establishment of a permanent lunar base is the goal of several space missions, such as NASA’s Artemis program. The feasibility of a lunar base is highly dependent on the supply of clean water, which can be recycled within the life support system or extracted in-situ on the Moon. Contamination of the water by lunar dust is an unavoidable problem due to the fact that lunar dust covers the entire surface and has adhesive properties as well as a very fine particle size. It is therefore important to study and characterise water contaminated by lunar dust in order to develop a safe water supply system. We combined existing studies on the dissolution behaviour of lunar regolith in aqueous solutions and performed dissolution experiments ourselves. We conducted dissolution experiments using the Lunar Highland Dust simulant from Exolith Lab (Orlando, United States), which resembles the Apollo 16 regolith and thus the terrain of the suspected Artemis landing sites. Our dissolution experiments investigate the effects of the dust to solution ratio, the aqueous solution used (ultrapure water and 5.5 buffer), the short exposure time (2 min up to 72 h), the dissolved oxygen in the solutions and the particle size of the simulant. As a result, this study provides a characterisation of lunar dust contaminated water and compares the results with the World Health Organization (WHO) and NASA requirements for drinking water. For all test batches, the lunar dust contaminated water exceeds the requirements for pH, turbidity and Al concentration.
1 Introduction
In future lunar habitats, the contact between lunar dust and water in its liquid form will be unavoidable, as described in the In-Situ Resource Utilization (ISRU) Gap Assessment Report (ISRU Gap Assessment Team, 2021) and the Dust Mitigation Gap Assessment Report (Dust Mitigation Gap Assessment Team, 2016). On the one hand, lunar dust with its adhesive properties and very fine particle sizes [about 20 wt% of the bulk regolith is
Keller and Huang (1971) studied the ion release of an Apollo 12 (mare area) sample into deionised water, carbon dioxide CO2-charged water, 0.01 M acetic acid and 0.01 M salicylic acid. These different solutions were used to determine the reaction of lunar material with solutions related to weathering processes on Earth. In parallel, experiments were carried out with powdered basalt and tektite (of approximately the same grain size as the Apollo 12 sample) to compare the results with the Apollo 12 dissolution experiments. The pH, as well as Si, Al, Fe, Mg, Ca, Na, K, Mn, Ti, Cr, Zn, Cu, Sr, and Ba, were analysed over a period of up to 81 days. Rapid ion release was observed within the first 3 days, and after 81 days the dissolution of the Apollo samples, basalt and tektite all approached equilibrium (except for tektite in CO2-charged water, acetic and salicylic acid, and Si from basalt dissolving in acetic acid). All dissolution experiments show a parabolic curve for dissolved ions over time. The ion release from the lunar dust was much higher in organic acids than in deionised water, with the following order of major dissolved elements Si
Eick et al. (1996a) investigated the effects of pH (3, 5, and 7) and citric and oxalic acids on the dissolution kinetics of a synthetic lunar basaltic glass. In addition, Eick et al. (1996b) conducted similar dissolution experiments by using a lunar Mare simulant MLS-1 (Minnesota Lunar Simulant, similar to Apollo 11 Mare soil) and demonstrated the influence of the mineral composition on the ion release. The dissolution of Si, Al, Fe, Mn, Ca, Mg, Ti, and Cr ions was studied over a period of up to 365 days for the glass simulant and 172 days for MLS-1. Both the glass simulant and MLS-1 showed an increase in ion release with decreasing pH. The order of ions released from the glass simulant at pH 3 and 5 was Al
Cooper et al. (2011) tested the effect of fluid on lunar regolith by conducting experiments using Apollo 14 (highland area) samples and water, isopropanol and pH 4 buffer. The mixtures were analysed for dissolved Si, Ca, Al, Mg, Fe, S, Ti and it was found that of all the ions analysed, Ca was released the most in all solutions. The dissolution experiments showed that the major elements of plagioclase particles were the most affected by dissolution in water, and only negligibly dissolved by isopropanol. In water, the order of elements released from the Apollo 14 sample is Ca
The experiments described show that ion release depends on the simulant/Apollo sample composition and on the aqueous solutions. On the one hand, the order of ion release in the studies was dominated by the bulk composition of the samples, i.e., the solubility of the mineral components, and on the other hand, the concentration of the released ions was influenced by the aqueous solutions used (e.g., pH, organic acids). The complexity of the dissolution processes does not allow a general statement about the ion concentration present in regolith-contaminated water. For this reason, we conducted dissolution experiments with the Lunar Highland Dust simulant from Exolith Lab (Orlando, United States), which is similar to the Apollo 16 regolith. The Apollo 16 terrain is described as similar to that considered for the Artemis landing sites, a feldspathic highland terrain, and thus a possible region for future lunar habitats (Kumari et al., 2022). For the treatment of water contaminated with lunar dust in lunar habitats, even short contact times are relevant. Our experiments therefore focused on short contamination times ranging from 2 min to 72 h. For the aqueous solution, we used ultrapure water, because in ultrapure water the influence of other ions present in the solution can be excluded, and a buffer solution of pH 5.5 to compare experiments without considering the effect of pH. We also investigated the effect of dissolved oxygen in the solution, which is unavoidable in terrestrial conditions. Therefore, experiments were run in a nitrogen glove box with O2 outgassed solutions. As contamination by very fine particles is expected, the effect of the particle size of the simulant used was also investigated. In summary, we investigate the effect of exposure time, the aqueous solution used (ultrapure water vs. buffer solution), the simulant to solution ratio, dissolved oxygen in the solutions, and the particle size of the lunar simulant on the dissolution behaviour. Additionally, this work combines the results of existing studies on the dissolution behaviour of lunar regolith in aqueous solutions with our own dissolution experiments. We compare our results with those of Cooper et al. (2011) using a real Apollo lunar highland sample. The study concludes with a characterisation of lunar dust-contaminated water in terms of possible water purification steps.
2 Material and methods
2.1 Solid materials
In this study we used the Lunar Highland Dust Simulant (LHS-1D) and the Lunar Highlands Simulant (LHS-1) from Exolith Lab (Orlando, United States) because of their similarity to the main chemical components of the average Apollo 16 regolith (Stockstill-Cahill et al., 2021). Tables 1, 2 show the composition of the LHS-1D and LHS-1 simulants. They have the same chemical and mineral composition as reported in the January 2021 Exolith Lab datasheets.
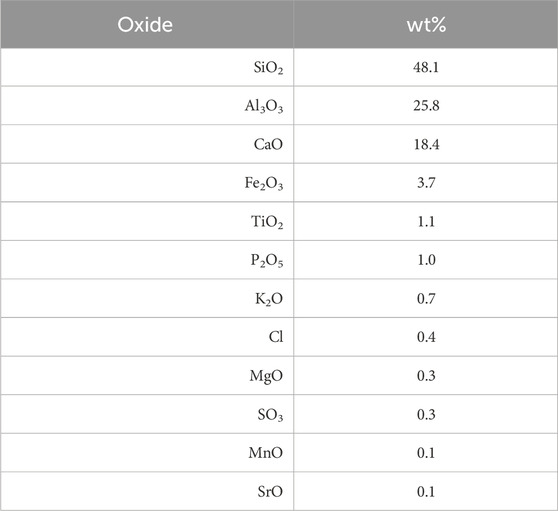
Table 1. Chemical composition of LHS-1D and LHS-1 simulant.
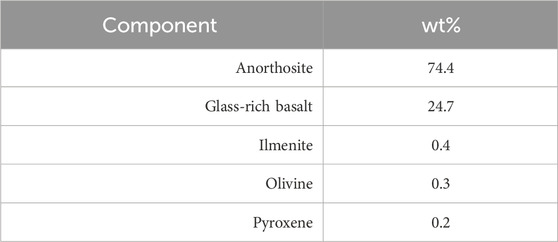
Table 2. Mineral composition of LHS-1D and LHS-1 simulant.
The LHS-1D simulant has a mean particle size of 7 µm with a range of
2.2 Aqueous solutions
The experiments were conducted with two different aqueous solutions, ultrapure water and a buffer solution. We used ultrapure water with a resistivity of 18 MΩcm (ROTISOLV HPLC Gradient Grade). The initial pH of the ultrapure water after contact with the laboratory atmosphere was 5.5–5.7 due to the dissolved CO2 from the air, which forms carbonic acid. The buffer solution with a pH of 5.5 ± 0.1 was prepared by separately dissolving 2.86 µL of acetic acid (C2H4O2, 100% Suprapur, Millipore) and 26.978 g of ammonium acetate (NH4CH3COO, reagent-grade, Honeywell) in 1 L of ultrapure water and finally mixed to produce 2 L of pH 5.5 ± 0.1 buffer solution.
2.3 Experimental procedure
First, 250 mL of the aqueous solution were filled into high-density Polyethylene (HDPE) wide-mouth bottles. The regolith simulant was then weighed, added to the aqueous solution and placed directly on an overhead shaker. Simultaneously, the time measurement and the overhead shaker were started, by mixing at 20 RPM. After specific times, 2 min, 15 min, 30 min, 1 h, 12 h, 24 h, and 72 h, the over-head shaker was stopped and approximately 10 mL sample was taken with a graduated pipette and centrifuged at 6000 RPM for 10 min. A sub-sample was taken for pH measurements before the sample was filtered with a polytetrafluorethylene 0.45 µm syringe filter to prepare for the elemental concentration analysis. In a final step, the elemental concentrations of the following nine elements were measured by inductively coupled plasma optical emission spectrometry: Al, Ca, Fe, K, Mg, Mn, S, Si, and Ti. Table 3 summarises the different parameters of the test batches. In addition to the use of two different simulants and aqueous solutions, two ratios of simulant dry weight in grams to solution volume in millilitres were tested (1:100 and 1:500). All test batches with LHS-1D were conducted firstly under 20°C and Earth atmosphere and secondly in a nitrogen glove box with oxygen degassed solutions to mimic the lack of an oxygen-containing atmosphere on the Moon. For quality assurance, all test batches were run in duplicate and a blank of each solution was analysed. The experimental procedure is based on the guidelines of Kerschmann et al. (2020) and Stewart et al. (2013).
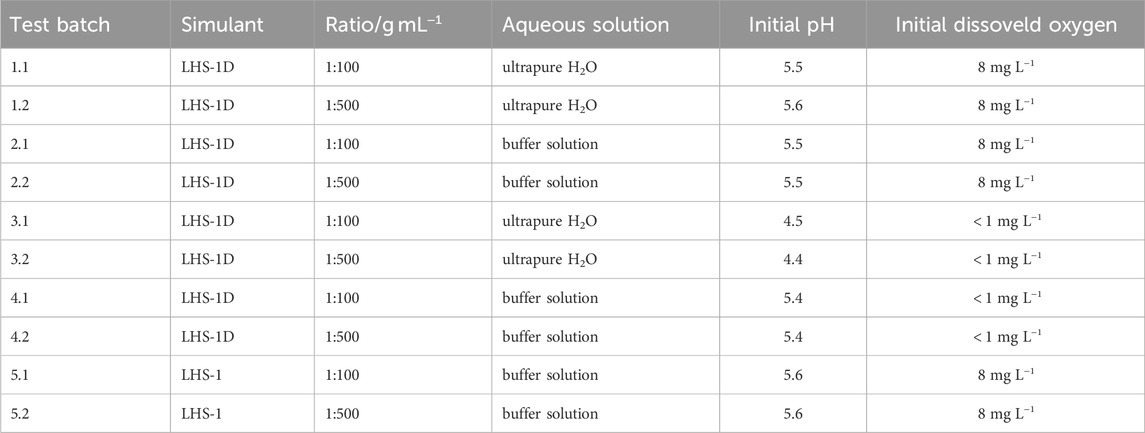
Table 3. Test batch parameters of lunar regolith dissolution experiments.
2.4 ICP-OES and ICP-MS analysis
The elemental concentrations of the following elements were determined by inductively coupled plasma optical emission spectrometer (ICP-OES, Perkin Elmer, Optima 8300 DV): Al (analytical wavelength: 396.153 nm), Ca (317.933 nm), Fe (238.204 nm), K (766.490 nm), Mg (285.213 nm), Mn (257.610 nm), S (181.975 nm), Si (251.611 nm), and Ti (334.940 nm). Each sample was measured three times to check the reproducibility of the analysis. The ion concentrations of Fe, Mn, and Ti of test batches 2.1, 2.2, 3.1, 3.2, 4.1, and 4.2 were also determined using inductively coupled plasma mass spectrometry (ICP-MS, Perkin Elmer, NexION 300 D) due to its low concentration. For both techniques, concentrations were determined via external calibration against standards with known concentrations and checked for accuracy by quality control standards with known certified concentrations. The ICP-OES and ICP-MS analysis were performed by the Central Laboratory TUHH, Hamburg, Germany. Test batches 1.1 and 1.2 were measured by ICP-OES in the laboratory of the Geochemistry and Hydrogeology Group, Faculty of Geosciences, University of Bremen.
2.5 Turbidity measurements
Turbidity, a measure of relative liquid clarity, of test batches 1.1, 1.2, 5.1, and 5.2 was measured after 72 h mixing time using a TB 211IR turbidimeter (Tintometer). The turbidimeter measures the extent to which light is either absorbed or scattered by suspended particles in the solution. For each turbidity measurement 11 mL was taken directly from the 250 mL wide-mouth bottles. If the turbidity was above the measuring range, a 1:11 dilution was made. The measuring range of the turbidimeter is 0.01–1100 NTU.
3 Results
3.1 Ion concentration
The measured ion concentrations in mg L−1 and the pH for each test batch are given in tabular and graphical form in the Supplementary Material.
All experiments dissolving the LHS-1D simulant showed a parabolic release of Si, Al, Ca, Mg, and K within 12 h. After 12 h, the release of ions decreased and approach constant values. Using a buffer solution, the release of Fe and Mn also showed a parabolic behaviour within 12 h. For all test batches, no statement can be made about the release of Ti ions, as more than 50% of the samples are below the detection limit of 10 μg L−1. The same applies to the dissolved Fe ions in ultrapure water with a detection limit of 20 μg L−1. The results of the experiments performed in the nitrogen glove box and in ultrapure water differ from those performed under terrestrial atmosphere. No Al was detected in test batches 3.1 and 3.2, because the samples were not acidified and stored for more than 4 weeks before being analysed by ICP-OES, causing Al to precipitate in the solution. In addition, the parabolic release described above was also observed for Mn in test batches 3.1 and 3.2, which was additionally analysed by ICP-MS, which has a lower detection limit. In the case of a measurable release of S (test batches 1.1, 3.1, and 4.1), the values remained approximately constant.
For the dissolution of LHS-1D in buffer solution, the order of ions in the solution is Ca
Using the LHS-1 simulant, the released Ca ions showed a parabolic behaviour within 12 h and then a constant value. In test batch 5.1 the released Al ions also showed a parabolic behaviour, but over 72 h without reaching a constant value. The order of ion concentrations in the solution is Ca
3.2 pH of solution
The rapid release of ions during the first 2 minutes to 1 hour is also shown by the increase in the pH of the solution (Figure 1). The comparison of the pH values of the two different ratios shows that the pH value of the 1:100 ratio is on average 0.5 higher than the pH value of the 1:500 ratio, due to the higher ion concentration at a ratio of 1:100. The initial pH of the O2 degassed ultrapure water is 4.4 and 4.5, rising to 6.2 after 2 min. The pH after 72 h is 7.0 (1:100) and 6.7 (1:500).
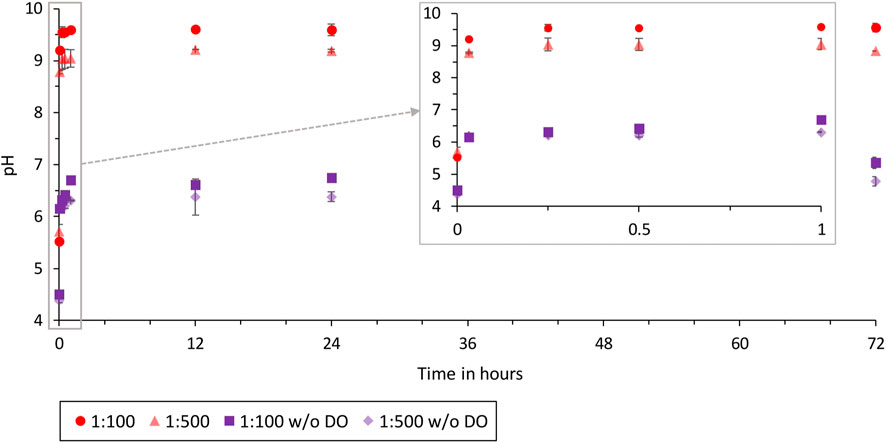
Figure 1. pH over time for the ratios 1:500 and 1:100 LHS-1D in ultrapure water with and without dissolved oxygen (test batches 1.1, 1.2, 3.1, and 3.2).
3.3 Turbidity of the solution
The turbidity caused by LHS-1D (test batch 1.1 and 1.2) is higher than by LHS-1 (test batch 5.1 and 5.2) in ultrapure water. The ratio, 1:100 results in a higher turbidity than 1:500. The turbidity in NTU of LHS-1D and LHS-1 are given in Table 4.
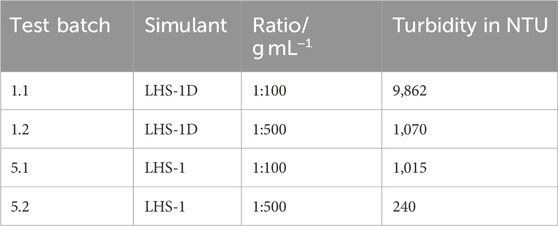
Table 4. Turbidity of LHS-1D and LHS-1 in ultrapure water.
Photographs of the turbidity samples in the cuvettes of the turbidimeter are shown in Figure 2. The samples are arranged from left to right in order of decreasing turbidity.
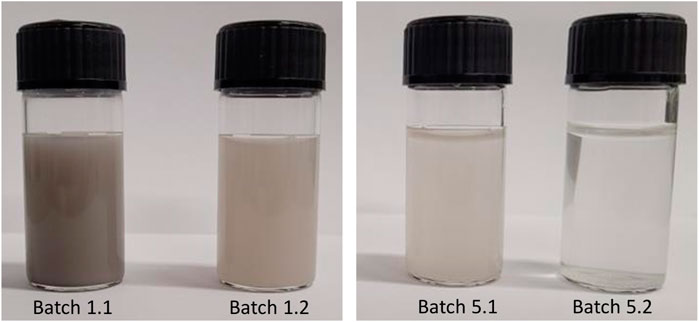
Figure 2. Turbidity samples, from left to right: LHS-1D 1:100, LHS-1D 1:500, LHS-1 1:100, and LHS-1 1:500.
4 Discussion
4.1 Interpretation of results
The detected ion concentrations in milligrams per litre (mg L−1) were converted to the release of ions from the simulant into the solution per gram of solid material/simulant (mg g−1solid). This conversion allows the comparison of test batches with different simulant to solution ratios. The elements for which 50% of the measured concentrations are below the detection limit are not included in the graphs. For clarity, the ion release of the elements is split into two plots so that the points of released ions do not overlap and a zoom to the first hour is also provided within the graphs.
4.1.1 Comparison of 1:100 and 1:500 simulant weight to solution volume ratios
The following plots (Figures 3, 4), compare the 1:500 and 1:100 ion release from the LHS-1D simulant into ultrapure water and buffer solution.
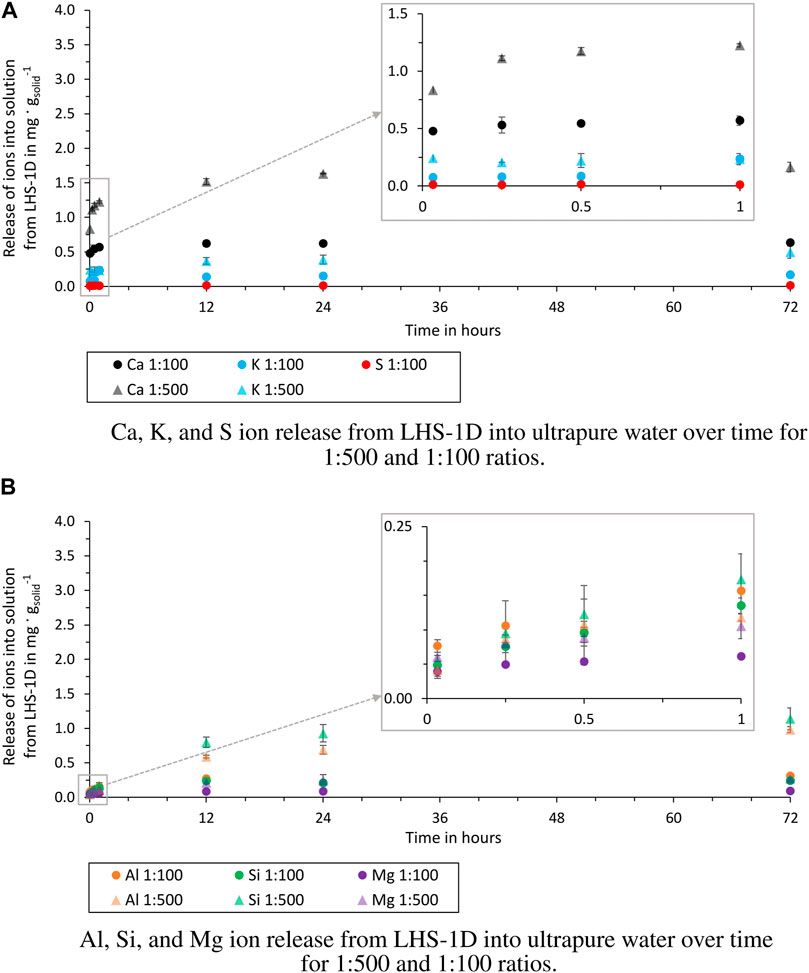
Figure 3. Release of ions from LHS-1D into ultrapure water over time for 1:500 and 1:100 ratios (test batch 1.1 and 1.2). (A) Release of Ca, K, and S ions. (B) Release of Al, Si, and Mg ions.
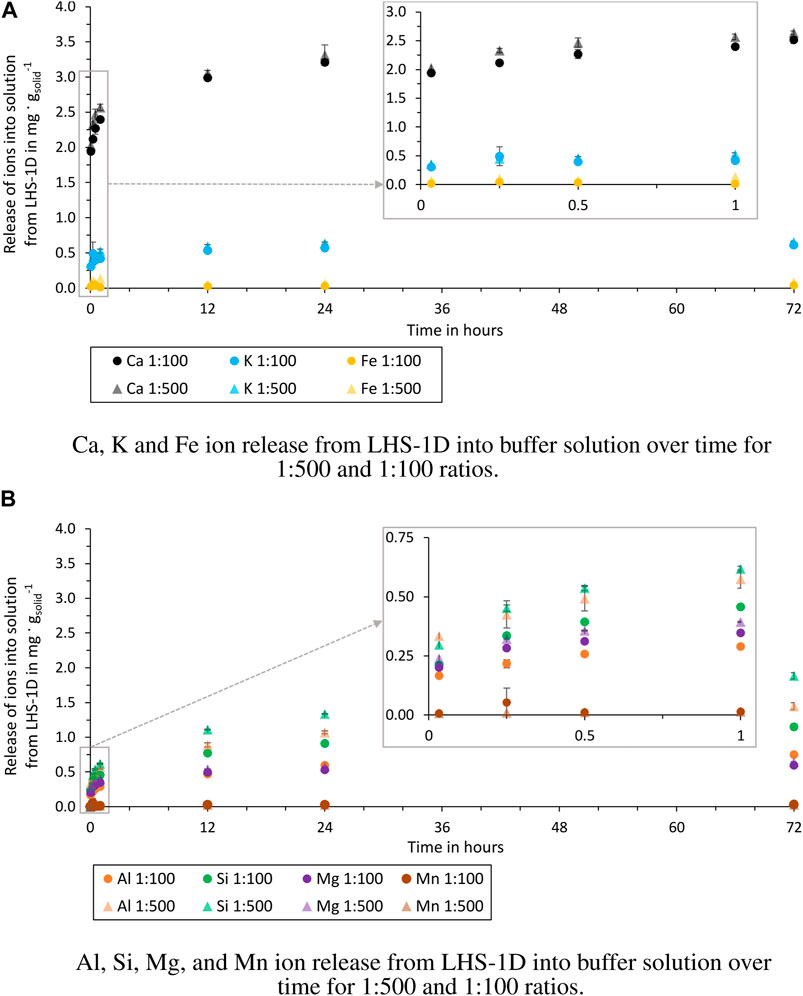
Figure 4. Release of ions from LHS-1D into buffer solution over time for 1:500 and 1:100 ratios (test batch 2.1 and 2.2). (A) Release of Ca, K and Fe ions. (B) Release of Al, Si, Mg, and Mn ions.
For all elements detected, the release of ions into ultrapure water (Figure 3) was higher at the 1:500 ratio. As no statement can be made about the release of S for the 1:500 ratio, a comparison of the two ratios is not possible.
The release of ions in the buffer solution (Figure 4) of the two ratios can be considered equal, except for the elements Al and Si. The experiment with the 1:500 ratio shows after 72 h a release of Al and Si ions of 0.7 mg g−1solid higher than for the 1:100 ratio.
In all four test batches, the most released ions from the simulant are Ca, Al, and Si. These are also the elements that are present in anorthosite and glass-rich basalt, the main components of the simulant. Also the experiments of Cooper et al. (2011), using a sample from Apollo 14, showed that the ion that is released the most from the sample is Ca. A noticeable difference between the ratios can only be observed in ultrapure water. The more solution is used per simulant, the more ions are dissolved per gram of simulant. These can be attributed to saturation effects of the solution inhibiting dissolution reactions on the grains. When the pH is kept constant by using a buffer solution, this difference is not observed (except for Al and Si). This suggests that the release of Al and Si ions is more dependent on the other ions already dissolved in the solution. The experiments in buffer solution show that in an acidic solution (pH = 5.5) the ion release of the individual elements is higher than in the ultrapure water, which is also the result of Eick et al. (1996a,b) and Cooper et al. (2011). The order of the dissolved elements is not changed by the use of the buffer solution, but Fe and Mn ions are dissolved, which could not be detected in ultrapure water.
4.1.2 Effect of dissolved oxygen
Only the comparison between the O2 degassed and non-degassed buffer solution is shown in Figures 5, 6, as the use of the buffer solution negates the effect of the different initial pH of the solutions. Figure 1 shows the different initial and final pH values of O2 degassed and non-degassed ultrapure water. The solutions have been degassed with CO2 and therefore more carbonic acid is formed in the degassed solution, reducing the pH.
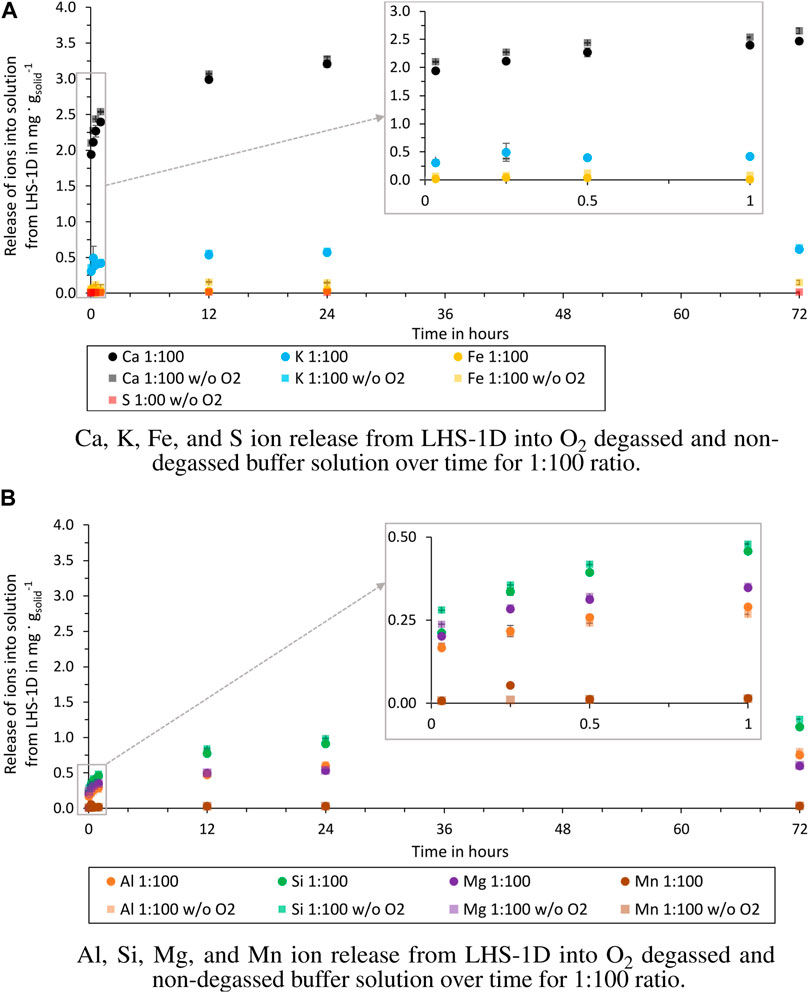
Figure 5. Release of ions from LHS-1D into O2 degassed and non-degassed buffer solution over time for 1:100 ratio (test batch 2.1 and 4.1). (A) Release of Ca, K, Fe, and S ions. (B) Release of Al, Si, Mg, and Mn ions.
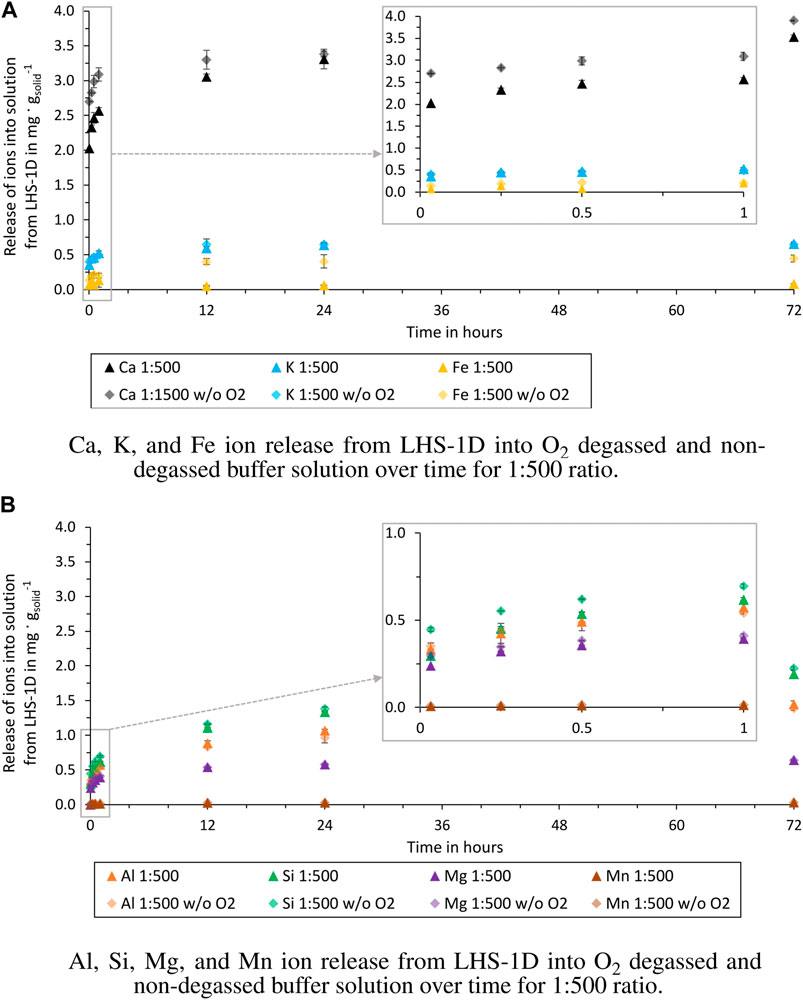
Figure 6. Release of ions from LHS-1D into O2 degassed and non-degassed buffer solution over time for 1:500 ratio (test batch 2.2 and 4.2). (A) Ca, K, and Fe ion release. (B) Al, Si, Mg, and Mn ion release.
The comparison between the test batches shows that a O2 degassed buffer solution effects the release of Ca and Fe ions. After 72 h the released Ca ions into the degassed buffer solution are 0.14 mg g−1solid (1:100) and 0.23 mg g−1solid (1:500) higher than into a non-degassed buffer solution and the released Fe ions are 0.11 mg g−1solid (1:100) and 0.37 mg g−1solid (1:500) higher. The differences between the other ions released are negligible, as can be seen in Figures 5A, B. At this stage, these observations cannot be attributed to a specific dissolution mechanism, as no other studies are available. Due to the higher release of Fe and Ca in O2 degassed water, these concentrations must be critically questioned in experiments conducted under terrestrial conditions. Especially, if the results are used for water purification tests within the ISRU process chain. In-situ extracted water will not contain dissolved oxygen as in the Earth’s atmosphere. For life support systems, these results can be neglected if the water treatment will take place in an oxygenated lunar habitat atmosphere.
4.1.3 Effect of particle size
Figure 7 compares the release of ions from the LHS-1D and the LHS-1 simulant into the buffer solution. For comparison the results of the 1:100 ratio and buffer solution is used, as for this ratio the most elements where detectable and the effect of a changing pH can be neglected.
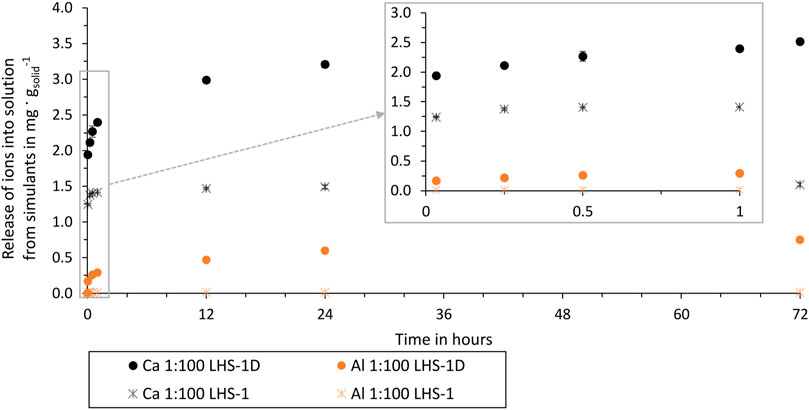
Figure 7. Al and Ca release from LHS-1D (mean particle size = 7 µm) and LHS-1 (mean particle size = 60 µm) in ultrapure water over time of test batch 2.1 and 5.1.
LHS-1 and LHS-1D have the same bulk composition but a different mean particle size. By comparing ion release in buffer solution and the same ratio, the only changing parameter is the particle size. Using LHS-1 in buffer solution results in no dissolved Fe, K, Mg, Mn, S, Si, and Ti ions, while using LHS-1D these elements are present in the buffer solution from the first extraction time. Figure 7 shows that the use of LHS-1D results in a higher release of Ca and Al ions with an increasing difference over time. The percentage difference after 72 h of LHS-1D and LHS-1 Ca release is 79% and Al release is 193%. This proves that particle size and ion release are related. As smaller particle sizes expose more surface area to the aqueous solution, more ions are released from the lunar regolith particles into the aqueous solution over time.
These results are consistent with the findings of Eick et al. (1996a), where rapid ion release is also explained by the “higher free energy” of fine grains, i.e., a high surface area. All our test batches showed the fastest release of ions within the first hour, which can also be explained by the fact that the fine grains of the simulant dissolve first, before the dissolution decreases, and can be described as more linear, typical of a surface controlled reaction.
4.2 Experiment-based assumptions for water purification
Water in future space habitats is more likely to be contaminated by fine regolith particles than by larger particles. In addition, the comparison between the LHS-1D and LHS-1 simulants showed that more ions are released at finer particle sizes, making the LHS-1D experiments the worst case. For this reason, only the LHS-1D simulant experiments are discussed below. When comparing the ion concentrations in mg L−1 after 72 h, test batch 1.2 (1:500, ultrapure water) represents the best case, i.e., low ion concentration in the solution, and test batch 2.2 (1:100, buffer solution) the worst case. These two cases are compared in Table 5 with the limits given in the World Health Organization (WHO) Guideline for Drinking Water Quality (World Health Organization, 2018), the NASA Human Integration Design Handbook (HIDH) (NASA, 2014), and the NASA Advanced Life Support Requirements Document (NASA, 2003).
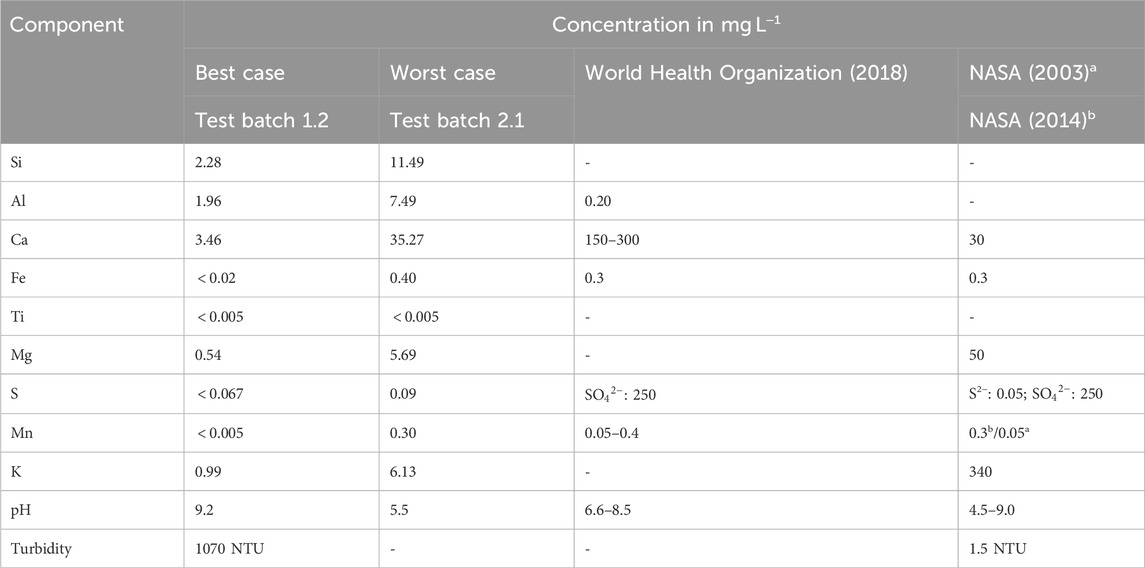
Table 5. Comparison of released ion concentration, pH, and turbidity with WHO and NASA requirements for potable water.
Test batch 1.2, the best case, does not meet the requirements for Al concentration, pH, and turbidity. In the worst case batch 2.1, Ca, Fe and Mn are also exceeded. For batch 2.1 it can also be assumed that turbidity will be above 1,000 NTU, even if not measured in buffer solution (cf. batch 1.1 with 9,862 NTU). It is not possible to say whether the limits for sulphur have been exceeded as the total S concentration was measured by ICP-OES and not the specific compounds. Both the best and worst cases exceed WHO and/or NASA requirements and will need to be treated. The first step is to remove the particles to meet the turbidity limits. Possible methods include filtration and sedimentation/flotation. Then, in both cases, the Al concentration needs to be reduced. That the release of Al from lunar regolith into water causes problems, is also shown by Paul et al. (2022). In their experiment, they grew plants in Apollo lunar regolith and showed that the plants expressed genes related to aluminium toxicity. The worst case test batch 2.1 showed that Ca, Fe and Mn also need to be removed. In conclusion, treatment steps are necessary to remove ions, e.g., distillation, reverse osmosis or ion exchange.
Another use of water in a space habitat is to split it into O2 and H2 by electrolysis. The feed water for electrolysers is usually Type I or Type II water according to the American Society for Testing and Materials (ASTM) ASTM (2017). The conductivity of Type I is defined as
In summary, the experiments showed that water contaminated with lunar dust contains dissolved ions from the LHS-1D simulant within a few minutes, that the pH of ultrapure water increases immediately, and that turbidity increases up to 1000 NTU. Even at a ratio of 1:500, the limits of WHO and NASA guidelines are exceeded. It is also difficult to predict the concentration of the released ions in the water, as this is highly dependent on the water matrix, the pH, the particle size, and the amount of lunar dust dissolved in the water. Since the simulant used in these experiments resembles the terrain of possible future lunar habitats, the results can be used as a basis for development and testing of water purification processes for ISRU and life support applications, as well as experiments on plant growth and habitat construction.
4.3 Outlook
For a better characterisation of lunar dust contaminated water extracted in-situ on the Moon, the volatiles measured by the LCROSS mission (Colaprete et al., 2010) should be taken into account. Volatiles present in the aqueous solution will alter the pH and therefore the dissolution behaviour of the lunar regolith. In addition to improving the dissolution experiments, the simulant used can also be refined by adding nanophase (3–33 nm) Fe0 particles. These nanophase Fe0 are embedded in a thin rim of SiO2-rich glass (Loftus et al., 2010) and can alter the dissolution behaviour. An indication of this is provided by the study of Wallace et al. (2010), which shows an increasing production of hydroxyl radicals in correlation with the presence of nanophase Fe0 in the solution. For analysis of the dissolution experiments, the water samples should be tested for a wider range of ions and also for compounds. It is recommended to determine the concentration of S2− compounds, which is specified in the NASA Advanced Life Support Requirements Document as 0.05 mg L−1, and to analyse Cl, SiO2 and Na, as these are requirements for electrolysis feed water set by ASTM.
Data availability statement
The original contributions presented in the study are included in the article and Supplementary Material, further inquiries can be directed to the corresponding author.
Author contributions
RF: Writing–original draft, Writing–review and editing. VP: Writing–original draft. PZ: Funding acquisition, Supervision, Writing–review and editing.
Funding
The author(s) declare financial support was received for the research, authorship, and/or publication of this article. The laboratory equipment for performing the lunar dust dissolution experiments and all related expenses were funded by the DLR internal funding sources.
Acknowledgments
I am very grateful to Kristina Beblo-Vranesevic from the Institute of Aerospace Medicine, DLR Cologne, for enabling and supporting the nitrogen glove box experiments. I am also thankful for the entire Radiation Biology Department of that institute for providing the nitrogen glove box with all the necessary equipment and for their expertise. Many thanks to Bo-Magnus Elfers of the TUHH Central Laboratory, Hamburg for the inspiring discussions on the interpretation of the results and the best choice of analytical methods. I also thank the laboratory of the Geochemistry and Hydrogeology Group, Faculty of Geosciences, University Bremen for their support at the beginning of the experiments and for providing detailed insights into the ICP-OES measurement method.
Conflict of interest
The authors declare that the research was conducted in the absence of any commercial or financial relationships that could be construed as a potential conflict of interest.
Publisher’s note
All claims expressed in this article are solely those of the authors and do not necessarily represent those of their affiliated organizations, or those of the publisher, the editors and the reviewers. Any product that may be evaluated in this article, or claim that may be made by its manufacturer, is not guaranteed or endorsed by the publisher.
Supplementary material
The Supplementary Material for this article can be found online at: https://www.frontiersin.org/articles/10.3389/frspt.2024.1366591/full#supplementary-material
References
ASTM (2017). Standard specification for reagent water, 11. American Society for Testing and Materials, 01. doi:10.1520/D1193-99E01
Colaprete, A., Schultz, P., Heldmann, J., Wooden, D., Shirley, M., Ennico, K., et al. (2010). Detection of water in the LCROSS ejecta plume. Science 330, 463–468. doi:10.1126/science.1186986
Cooper, B., McKay, D., Wallace, W., and Gonzalez, C. (2011). Fluids and their effect on measurements of lunar soil particle size distribution. Tech. rep., NASA.
Crotts, A. (2011). Water on the Moon, I. Historical overview. Astron. Rev. 6, 4–20. doi:10.1080/21672857.2011.11519687
Dust Mitigation Gap Assessment Team (2016). Dust mitigation Gap assessment Report. International Agency Working Group. Available at: https://www.globalspaceexploration.org/wordpress/docs/Dust%20Mitigation%20Gap%20Assessment%20Report.pdf (Tech. rep).
Eick, M., Grossl, P., Golden, D., Sparks, D., and Ming, D. (1996a). Dissolution kinetics of a lunar glass simulant at 25 °C: the effect of pH and organic acids. Geochimica Cosmochimica Acta 60, 157–170. doi:10.1016/0016-7037(95)00377-0
Eick, M., Grossl, P., Golden, D., Sparks, D., and Ming, D. (1996b). Dissolution of a lunar basalt simulant as affected by pH and organic anions. Geoderma 74, 139–160. doi:10.1016/s0016-7061(96)00055-9
ISRU Gap Assessment Team (2021). In-situ resource utilization Gap assessment Report. International Space Exploration Coordination Group. Available at: https://www.globalspaceexploration.org/wordpress/wp-content/uploads/2021/04/ISECG-ISRU-Technology-Gap-Assessment-Report-Apr-2021.pdf (Tech. rep).
Keller, W. D., and Huang, W. H. (1971). Response of Apollo 12 lunar dust to reagents simulative of those in the weathering environment of Earth. Lunar Sci. Conf. 1, 973–981.
Kerschmann, R., Winterhalter, D., Scheiderich, K., Damby, D. E., and Loftus, D. J. (2020). Profiling lunar dust dissolution in aqueous environments: the design concept. Acta Astronaut. 178, 308–313. doi:10.1016/j.actaastro.2020.08.032
Kumari, N., Bretzfelder, J. M., Ganesh, I., Lang, A., and Kring, D. A. (2022). Surface conditions and resource accessibility at potential Artemis landing sites 007 and 011. Planet. Sci. J. 3, 224. doi:10.3847/PSJ/ac88c2
Liu, Y., and Taylor, L. (2008). Lunar dust: chemistry and physical properties and implications for toxicity. Knoxville: LPI Contributions.
Loftus, D. J., Rask, J. C., McCrossin, C. G., and Tranfield, E. M. (2010). The chemical reactivity of lunar dust: from toxicity to astrobiology. Earth, Moon, Planets 107, 95–105. doi:10.1007/s11038-010-9376-x
Paul, A.-L., Elardo, S. M., and Ferl, R. (2022). Plants grown in Apollo lunar regolith present stress-associated transcriptomes that inform prospects for lunar exploration. Commun. Biol. 5, 382. doi:10.1038/s42003-022-03334-8
Stewart, C., Horwell, C., Plumlee, G., Cronin, S., Delmelle, P., Baxter, P., et al. (2013). Protocol for analysis of volcanic ash samples for assessment of hazards from leachable elements. Int. Volcanic Health Hazards Network Publ.
Stockstill-Cahill, K., Blewett, D. T., Bussey, D. B. J., Cahill, J. T. S., Clyde, B., Denevi, B. W., et al. (2021). JHU-APL lsii report: 2021 lunar simulant assessment. Maryland: Johns Hopkins Applied Physics Laboratory. Tech. rep.
Wallace, W. T., Phillips, C. J., Jeevarajan, A. S., Chen, B., and Taylor, L. A. (2010). Nanophase iron-enhanced chemical reactivity of ground lunar soil. Earth Planet. Sci. Lett. 295, 571–577. doi:10.1016/j.epsl.2010.04.042
Keywords: lunar dust, lunar dust solubility, lunar dust dissolution experiments, lunar raw water, ISRU water treatment
Citation: Freer R, Pesch V and Zabel P (2024) Experimental study to characterize water contaminated by lunar dust. Front. Space Technol. 5:1366591. doi: 10.3389/frspt.2024.1366591
Received: 06 January 2024; Accepted: 22 March 2024;
Published: 12 April 2024.
Edited by:
Antonio Mattia Grande, Polytechnic University of Milan, ItalyReviewed by:
Philipp Zanon, Swinburne University of Technology, AustraliaAaron Noell, NASA Jet Propulsion Laboratory (JPL), United States
Akos Kereszturi, Hungarian Academy of Sciences (MTA), Hungary
Copyright © 2024 Freer, Pesch and Zabel. This is an open-access article distributed under the terms of the Creative Commons Attribution License (CC BY). The use, distribution or reproduction in other forums is permitted, provided the original author(s) and the copyright owner(s) are credited and that the original publication in this journal is cited, in accordance with accepted academic practice. No use, distribution or reproduction is permitted which does not comply with these terms.
*Correspondence: Rieke Freer, ZnJlZXJyaWVrZUBnbWFpbC5jb20=