 Xiaoling Wang
 Nadja Grobe
 Barbara Franchin2
 Paolo Cravedi
 Peter Kotanko
- 1Basic and Applied Laboratory Sciences, Renal Research Institute, New York, NY, United States
- 2Translational Transplant Research Center (TTRC), Department of Medicine, Icahn School of Medicine at Mount Sinai, New York, NY, United States
- 3Division of Gastroenterology and Hepatology, Comprehensive Transplant Center, Northwestern University Feinberg School of Medicine, Chicago, IL, United States
Background: Renal dysfunction is a common and serious complication in patients with end-stage liver diseases. While some patients recover renal function after liver transplantation (LT), others do not. Additionally, patients with normal kidney function (Normal-KF) before LT may develop post-transplant renal dysfunction. Early identification of patients at risk for impaired kidney function (Impaired-KF) post-LT is critical to improving outcomes. This study integrated metabolomic and proteomic analyses to investigate molecular profiles distinguishing Normal-KF from Impaired-KF post-LT.
Methods: Nine LT recipients were classified into Normal-KF (n = 5) and Impaired-KF (n = 4) groups. One additional recipient with pre-transplant renal function impairment who recovered renal function after LT, was analyzed separately. Serum samples were collected at 2- and 5-weeks post-LT. The metabolomic and proteomic profiles were assessed by untargeted liquid chromatography-tandem mass spectrometry.
Results: Metabolomic analysis identified 29 significantly altered metabolites between Normal-KF and Impaired-KF (fold change > 2, p < 0.05). Proteomic analysis revealed 45 differentially expressed proteins (fold change > 1.25, p < 0.05). For the recovered patient, the metabolomic profile closely resembled Normal-KF, whereas the proteomic profile remained aligned with Impaired-KF at both 14- and 35-days post-LT. From week 2 to week 5, both the metabolomic and proteomic profiles of the recovered patient showed trends toward the Normal-KF.
Conclusion: This study revealed distinct metabolomic and proteomic signatures associated with renal dysfunction post-LT. Proteomic profiles indicated a delayed recovery compared to metabolomic profiles, suggesting a dynamic and muti-layered renal recovery process. Further research is warranted to elucidate the functional implications of the differential proteins and metabolites for improved monitoring and therapeutic strategies.
Introduction
Liver transplantation (LT) is a life-saving intervention for patients with end-stage liver disease. However, renal dysfunction remains a common and serious complication that can occur both before and after LT (1–3). While some patients with kidney impairment prior to LT may recover their renal function post LT alone, others do not. Additionally, patients with normal kidney function (Normal-KF) before LT can develop post-transplant renal dysfunction, significantly impacting their long-term survival (4). Early identification of patients at risk for impaired kidney function (Impaired-KF) post-LT and the implementation of nephroprotective strategies are, therefore, critical to improving clinical outcomes in this vulnerable population (5).
Currently, the glomerular filtration rate (GFR), estimated using serum creatinine, is a widely used method in clinical practice for assessing renal function post-LT (6, 7). Although serum creatinine measurement is simple and cost-effective, it frequently overestimates kidney function in patients with liver disease, leading to delays in the diagnosis of renal dysfunction (2). This overestimation is likely due to decreased creatinine production and measurement interference from elevated bilirubin (3). Moreover, a single creatinine measurement provides only a limited perspective on renal function, overlooking its dynamic complexity and potentially obscuring the underlying causes of kidney injury.
To this extent, previous investigations have evaluated several proteins, such as Cystatin c (8), neutrophil gelatinase-associated lipocalin (NGAL) (9), beta-2-microglobulin (β2M) (10), tissue inhibitor of metalloproteinases 1 (TIMP-1) and osteopontin (OPN) (11, 12), as potential biomarkers for screening, diagnosing, and monitoring kidney function (13). In this study, we conducted an integrated metabolomics and proteomics analysis to gain deeper insight into kidney function in patients post-LT. By comparing patients with normal and impaired KF post-LT, we aimed to identify significant alterations in metabolites, proteins and their associated biological pathways. Additionally, we analyzed the molecular profile of a patient with recovered renal function to explore the timely changes associated with renal recovery.
Methods
Patients and samples
Ten patients from the multicenter, prospective study, NIAID CTOT14 (National Institute of Allergy and Infectious Diseases Clinical Trials in Organ Transplantation 14; NCT01672164) were included (14). Informed consent was obtained from all participants in accordance with IRB-approved protocols. All ten patients received LT. Two serum samples were collected from each patient at 2 weeks (mean 17 ± 4 days; range 13–24 days) and 5 weeks (mean 36 ± 15 days, range 20–66 days) post-LT. All samples were stored at −80°C until analysis.
Metabolomics analysis
Sample preparation
Fifty microliter of serum were mixed with 11 µl of isotope-labeled metabolites from the QRess Kit (Cambridge Isotope Laboratories, MA, USA, catalog #MSK-QRESS-KIT, reconstituted per manufacturer's instructions). Metabolites were extracted with cold methanol at a final concentration of 72%. The mixture was vortexed and centrifuged at 4,303 × g for 15 min at 4°C. Seventy-five microliter of supernatants were transferred to a 96-well plate and dried using a cold-trap vacuum drier (Labconco®, MO, USA). The dried extracts were stored at −80°C and reconstituted on the day of analysis.
Chromatographic conditions
Five microliter of each reconstituted sample were injected into a reversed-phase liquid chromatography (LC) column (Phenomenex Luna C18, Part Number 00F-4114-E0), employing 0.01% formic acid and 1 mM ammonium formate in water as Solvent A and in methanol as Solvent B, with a flow rate of 0.75 ml/min. The initial condition was set at 1% B. The gradient was as follows: 0–0.5 min: 1% B; 0.5–7 min: linear gradient from 1% to 40% B; 7–8.5 min: linear gradient from 40% to 90% B; 8.5–12 min: linear gradient from 90% to 100% B; 12–12.5 min: 100% B; 12.5–13 min: linear gradient from 100% to 1% B; followed by equilibration at 1% B for 3 min.
Mass spectrometry (MS) and MS/MS data acquisition
MS data were acquired on Agilent Q-TOF 6546 equipped with a JetStream ElectroSpray Ionization source in both positive and negative ionization modes. Ion source conditions for positive mode were as follows: gas temperature 350°C, drying gas flow 12 L/min, nebulizer 35 psi, fragmentor 125 V, skimmer 65 V, and capillary voltage 4,000 V. For negative mode, ion source conditions were the same except fragmentor 51 V and capillary voltage −2,000 V. In addition to single injections of reconstituted sample, a pooled sample of all reconstituted extracts underwent the same LC procedure as described earlier. Following separation, MS/MS data of the pooled sample were acquired using iterative MS/MS.
Metabolites identification and quantification
MS/MS data were analyzed with MassHunter Qualitative Analysis software, matching results against both an in-house metabolite library (703 compounds with spectra and retention times) and the MassHunter METLIN library (Agilent Technologies, Santa Clara, CA). Metabolites identified via the in-house library were assigned ID confidence level 1, while those identified through the METLIN library, lacking retention time matches, were assigned ID confidence level 2 (15). The precursor ion of the identified metabolites and their corresponding retention times were compiled into a target list, which was used in Agilent Profinder to quantify the signal intensity of each metabolite across all LC-MS data from all samples.
Metabolomic data quantification criteria
A pooled sample of all reconstituted extracts was used as the quality control (QC). QC injections were performed at the start, after every 5 samples, and at the end of the sample injection. For each metabolite, the coefficient of variation (CV) was calculated based on 5 QCs. QC were also injected at 2-, 4-, 8-, and 16-fold dilutions, and R2 was determined by linear regression. Intensity data for each metabolite were filtered based on following criteria, including signal-to-noise ratio > 5, CV < 30% for QC, QC to QC-4-fold dilution ratio > 1.44, and R2 > 0.8 for the series-diluted QC.
Metabolomic statistical data analysis
The average peak intensities of each metabolite (measured at two time points from the same patient) were used. Identified drug compounds were excluded from the list. Data were Log2-transformed prior to analysis. Differential metabolites were identified using a Welch's t-test, with significance defined as a p-value < 0.05 and a fold change > 2. Principal component analysis (PCA) and hierarchical clustering heatmap were performed using web-based platform MetaboAnalyst 6.0 (https://www.metaboanalyst.ca/) (16).
Proteomics analysis
Sample preparation
For each serum sample, 1.2 µl were processed using an EasyPep™ MS Sample Prep Kit (Thermo Fisher A40006) and resuspended in 80 µl of 0.1% formic acid. Additionally, 1 µl of each serum were pooled, treated with HSA/Immunoglobulin Depletion Columns (Thermo Fisher A36365), and processed using the same MS sample preparation protocol as the individual serum samples.
Chromatographic conditions
Each processed sample was separated by a reversed-phase LC column (Agilent AdvanceBio peptide mapping, Part Number 653750-902), employing 0.1% formic acid as Solvent A and 0.1% formic acid in acetonitrile as Solvent B, with a flow rate at 0.4 ml/min for a duration of 51 min. The gradient used for separation was as follows: 0–1 min: 3% B; 1–41 min: linear gradient from 3% to 45% of B; 41–44 min: linear gradient from 45% to 95% of B; 44–47 min: 95% B; 47–49 min: linear gradient from 95% to 3% B; 49–51 min: 3% B.
MS and MS/MS data acquisition
Following separation, LC-MS data were acquired on Agilent Q-TOF 6546 using auto MS mode. Ion source conditions were as follows: gas temperature 325°C, drying gas 12 L/min, nebulizer 35 psi, fragmentor 175 V, skimmer 65 V and capillary voltage 4,000 V.
Additionally, LC-MS/MS data was acquired from the pooled, HSA/Immunoglobulin-depleted sample using iterative MS/MS modes.
Peptide identification and quantification
The LC-MS/MS data were analyzed by Spectrum Mill software. The spectral data were searched against the reviewed proteins in the UniProt database. The identified peptides and their corresponding retention times were compiled into a target list, which was used in Agilent Profinder to quantify the signal intensity of each peptide across all LC-MS data.
Proteomic data quantification criteria
Pooled peptides from all samples were used as QC, with QC injections and analysis performed similarly to the metabolomic workflow. Quantification criteria were also identical, with the additional requirements of an MS score > 75 in Profinder and an MS2 score > 9 in Spectrum Mill.
Proteomic statistical data analysis
The average peak intensities of each peptide (measured at two time points from the same patient) were used. Statistical analysis was conducted at the protein level. For proteins with a single identified peptide meeting the quantification criteria, that peptide was used to represent the protein. For proteins with multiple identified peptides, a p-value (t-test) and fold change were calculated for each peptide. The median p-value and median fold change were then used to represent the protein. Significant proteins were defined as a p-value < 0.05 and a fold change > 1.25. For clustering analysis, each peptide intensity was normalized to its median intensity across all samples. For proteins with multiple peptides, the median normalized intensity was used to represent the protein. PCA and hierarchical clustering were performed using MetaboAnalyst 6.0.
Results
Study group
Ten patients with end-stage liver disease (numbered from 1 to 10) who underwent successful LT were included in this study (Table 1). GFR was estimated using the creatinine-based Chronic Kidney Disease Epidemiology Collaboration (CKD-EPI) formula (17). Of these, 5 patients (No. 1–5) with an eGFR greater than 60 ml/min/1.73 m2 both before and 2 weeks after LT were classified into the Normal-KF group. Four patients (No. 7–10) with eGFR less than 45 ml/min/1.73 m2 both before and 2 weeks after LT were assigned to Impaired-KF group. The baseline characteristics of patients at the time of LT were comparable between the two groups, and no significant differences in liver function were observed 2 weeks post-LT. The remaining patient (No. 6), with an eGFR of 23 ml/min/1.73 m2 before LT, showed an increase in eGFR to 76 ml/min/1.73 m2 14 days post-LT and to 102 ml/min/1.73 m2 35 days post-LT. This patient was designated as a recovered case.
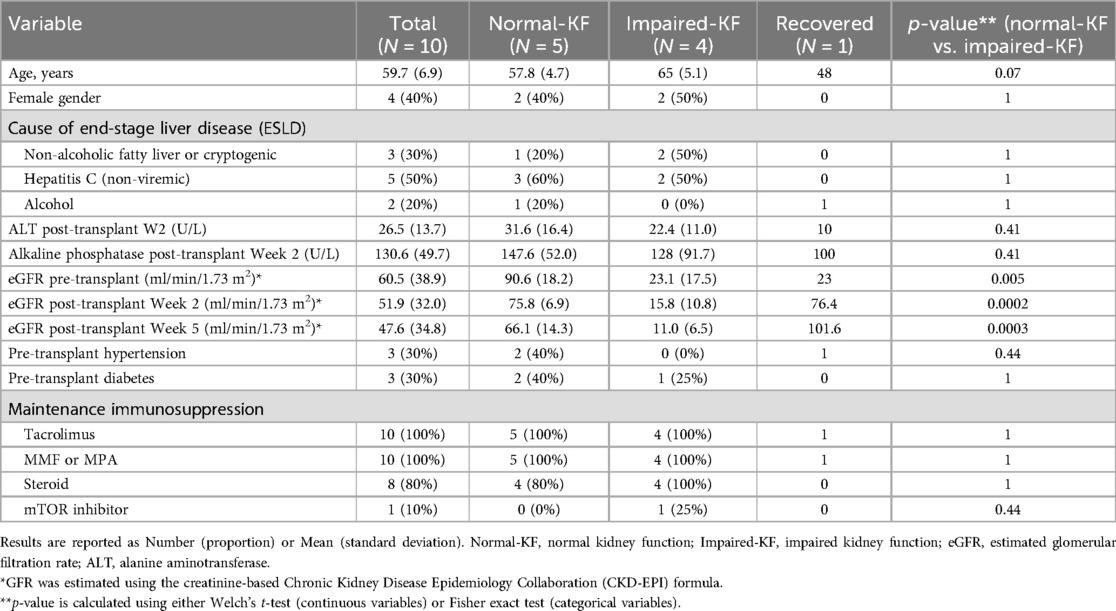
Table 1. Patient characteristics.
Metabolomic analysis
A total of 138 identified compounds met the quantification criteria. Of these, 30 compounds were medications, such as Tylenol, Ganciclovir, etc. in use by the patients. They were excluded from further analysis. The remaining 108 metabolites were subjected to statistical analysis. Welch's t-test identified 29 metabolites that exhibited significant difference between the Normal-KF and Impaired-KF groups (Fold change > 2, p < 0.05). Among these, 9 metabolites were enriched in Normal-KF, and 20 were enriched in Impaired-KF.
Table 2 listed these 29 metabolites along with their p-value and fold changes between Normal-KF and Impaired-KF. As expected, creatinine was one of the enriched metabolites in Impaired-KF. Additionally, each metabolite's Pearson correlation coefficient with creatinine, calculated using MS signals from individual samples, was included in Table 2. Supplementary Figure 1 presents box whisker plot comparisons of these metabolites between the Normal-KF and Impaired-KF groups, arranged by ascending p-value.
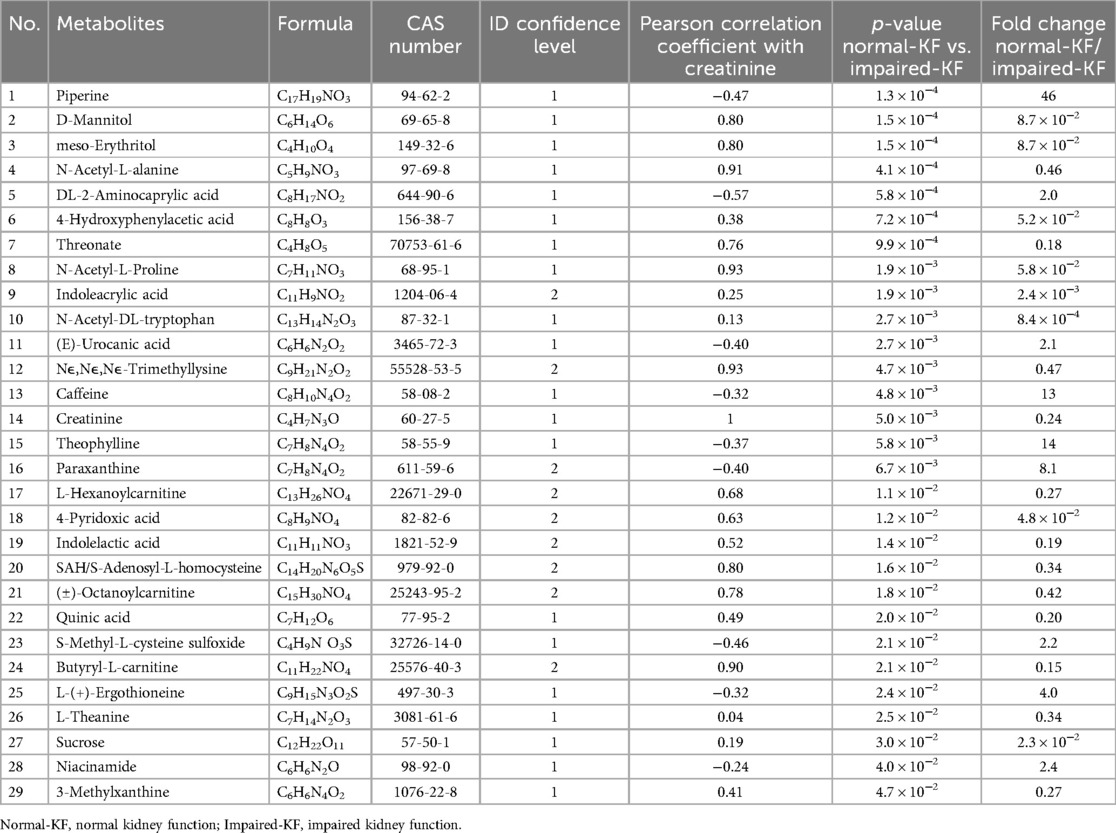
Table 2. List of differential metabolites, arranged by p-value.
Furthermore, PCA revealed clear separation between the Normal-KF and Impaired-KF groups (Figure 1A). Samples from the recovered patient (No. 6) on day 14 and day 35 were positioned near the Normal-KF group, with the day-35 sample trending even closer (Figure 1A). Using the average signal from two samples of the same patients, hierarchical clustering similarly grouped the recovered patient (No. 6) with the Normal-KF group, showing a closer relationship to patient No. 4, consistent with the PCA results (Figure 1B).
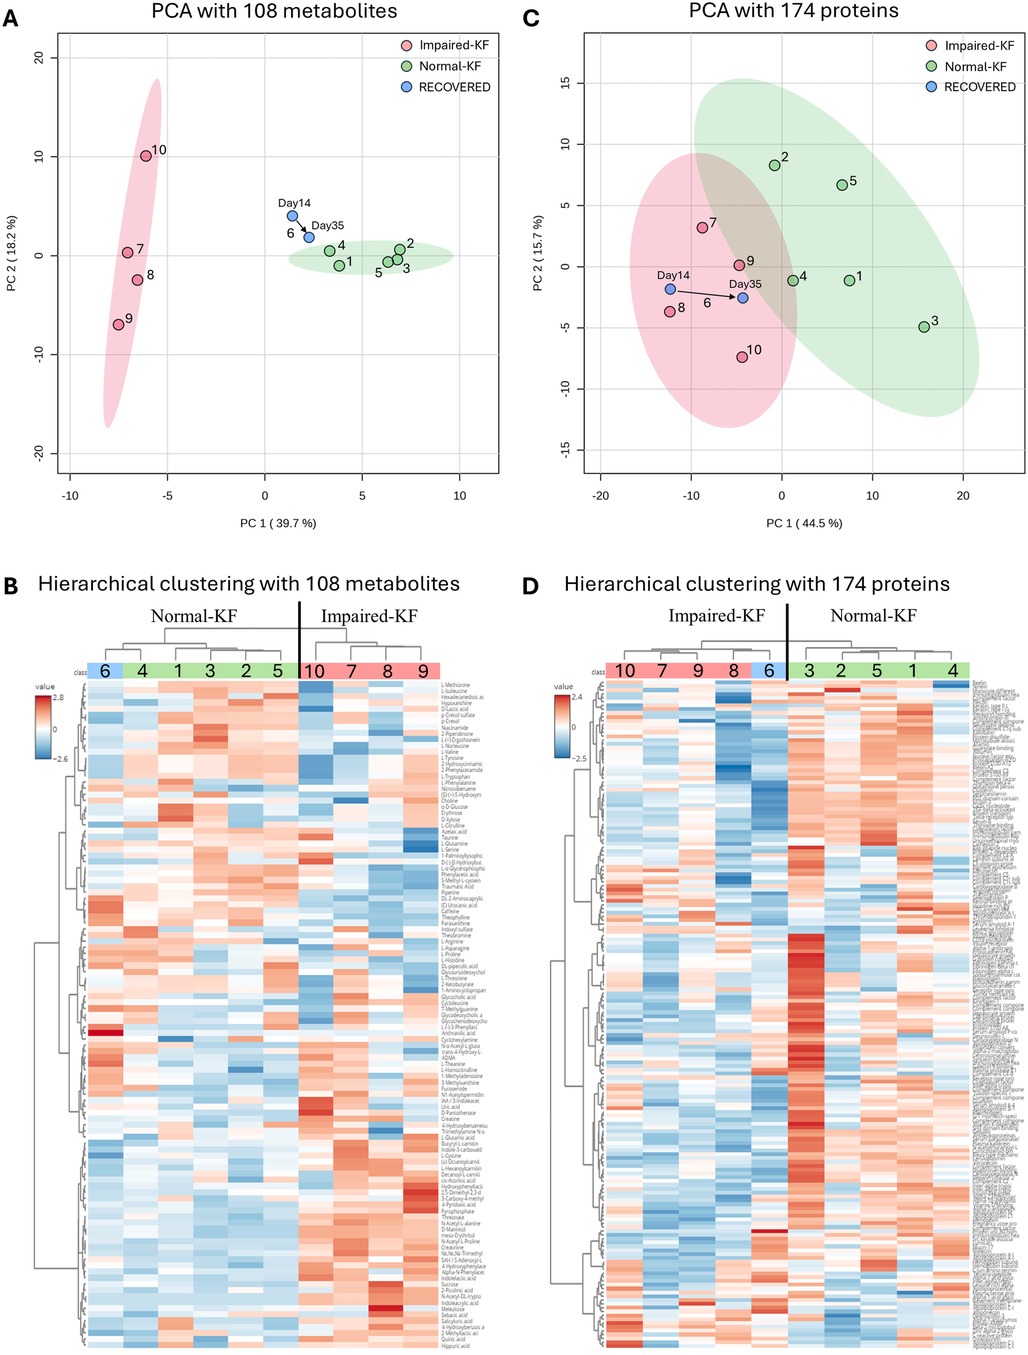
Figure 1. Clustering analysis of metabolites and proteins. (A,C) Principal component analysis (PCA) with 108 metabolites (A) or 174 proteins (C), with colored regions representing 95% confidence intervals. (B,D) Hierarchical clustering analysis with 108 metabolites (B) or 174 proteins (D). Normal-KF, normal kidney function; Impaired-KF, impaired kidney function.
Proteomic analysis
A total of 1,493 unique peptides met the quantification criteria, corresponding to 174 proteins, each represented by 1–193 peptides. Welch's t-test identified 45 proteins showing significant difference between the Normal-KF and Impaired-KF groups (Fold change > 1.25, p < 0.05). Among these, 43 proteins exhibited higher expression in the Normal-KF group, while only 2 proteins showed higher expression in the Impaired-KF group: β2M and protein AMBP (alpha-1-microglobulin/bikunin precursor) (Table 3). These 45 proteins were analyzed for pathway enrichment using Reactome v90 (https://www.reactome.org) (18, 19). Table 4 presents ten biological pathways potentially affected by impaired kidney function post-LT (False discovery Rate < 0.01). Proteins associated with these ten pathways are indicated in Table 3.
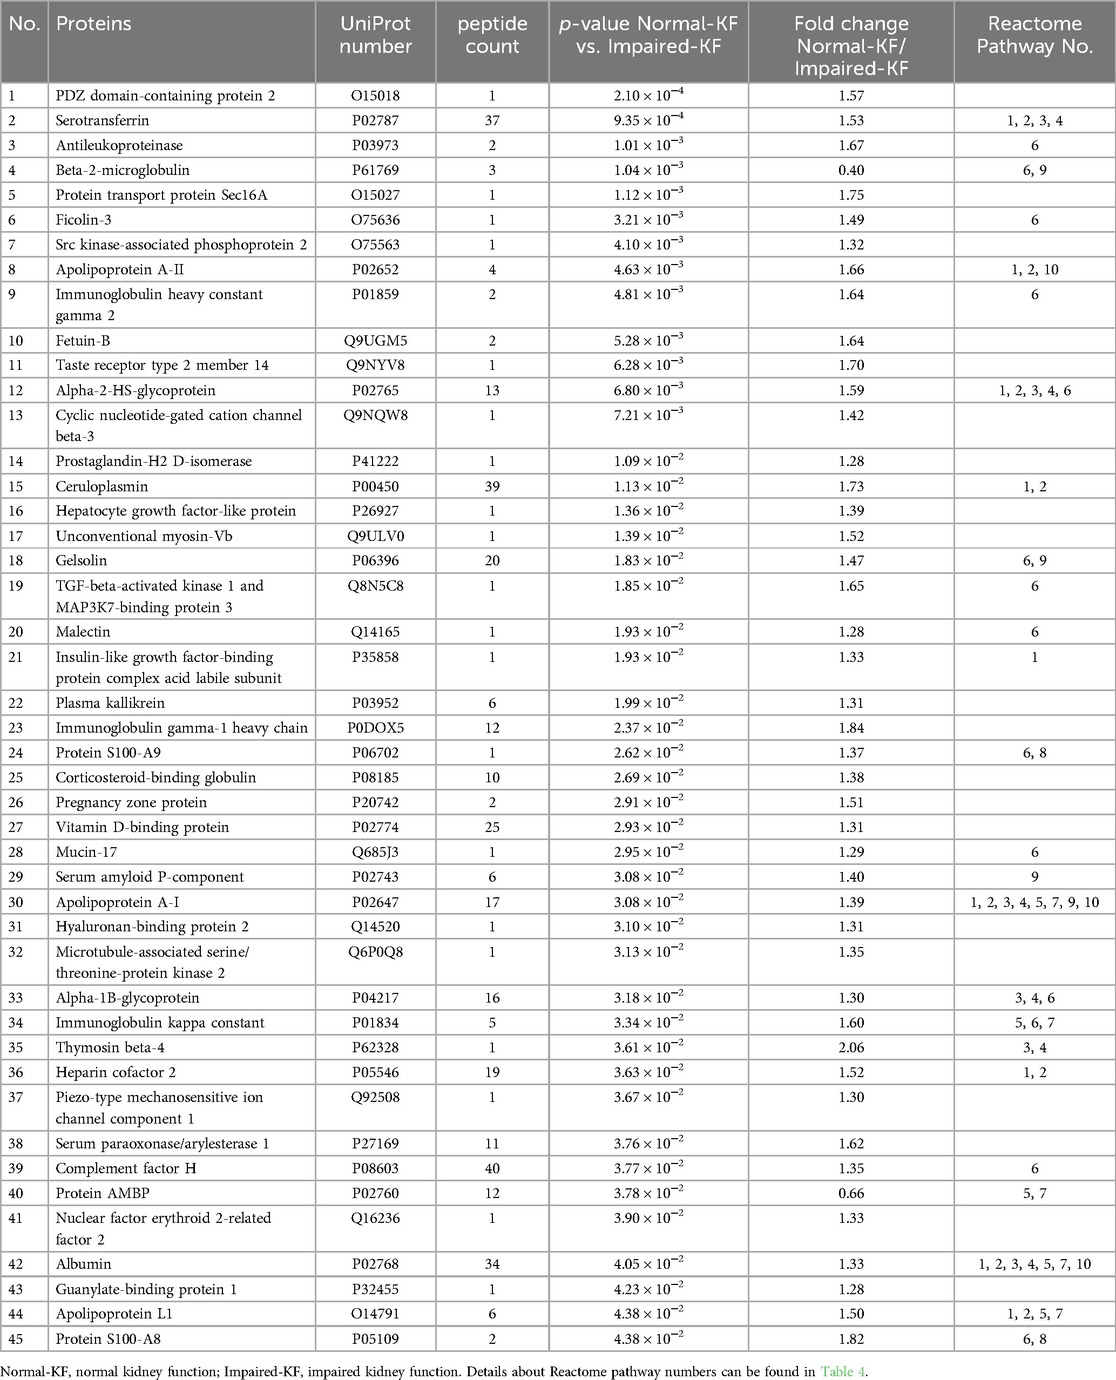
Table 3. List of differential proteins, arranged by p-value.
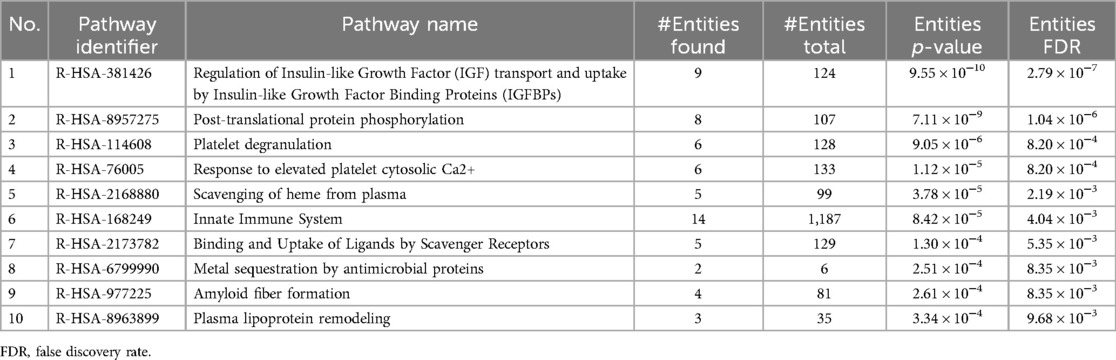
Table 4. Reactome pathway analysis of differential proteins.
Similar to the metabolomic analysis, we performed protein cluster analysis using all 174 proteins. PCA revealed a separation between the Normal-KF and Impaired-KF groups (Figure 1C), although this separation was less distinct than what was observed for metabolites. Interestingly, for the recovered patient (No. 6), both samples clustered closely with the Impaired-KF group, with the day 35 sample trending towards the Normal-KF group (Figure 1C). In hierarchical clustering, this patient was grouped with the Impaired-KF group, contrasting with the results from metabolomics profiling (Figure 1D).
Discussion
Our findings revealed distinct metabolomic and proteomic signatures associated with kidney impairment post-LT. Specifically, for the patient whose eGFR returned to normal after LT, the metabolomic profile closely resembled that of patients with Normal-KF, suggesting recovery at the metabolic level. However, the proteomic profile remained aligned with the Impaired-KF group, indicating that underlying changes in protein expression may persist longer despite improved renal filtration. This discrepancy highlights the complex and multi-layered nature of kidney recovery and suggests that metabolic and proteomic pathways may recover at different rates post-LT.
Given these findings, reliance solely on serum creatinine-based eGFR may not provide an accurate and complete picture of kidney recovery or ongoing dysfunction in LT recipients. Incorporating additional measures into routine post-transplant monitoring could provide a more comprehensive assessment of kidney health and enable timely intervention to prevent renal dysfunction progression. Moreover, proteomic analysis may uncover lingering inflammation or structural changes within the kidney that persist despite improved filtration markers, providing insights into long-term recovery trajectories.
Due to the nature of the untargeted LC-MS/MS methodology, the proteins identified in our analysis tend to be abundant in the bloodstream. While many proteins could be of interest, such as NGAL and TIMP-1, their low abundance limited our ability to detect or quantify them in this study. Despite these limitations, our analysis identified 45 differentially expressed proteins, with β2M and alpha-1-microglobulin (encoded by protein AMBP) being enriched in the Impaired-KF group. Both proteins are known to be elevated in patients with kidney disease (20). In contrast, the remaining 43 differential proteins were enriched in the Normal-KF group. These proteins are involved in various biological pathways, including Insulin-like growth factor regulation, post-translational protein phosphorylation, and the innate immune system. Further investigation into these proteins could deepen our understanding of the molecular mechanisms underlying kidney injury and recovery following LT.
Besides creatinine, we identified 28 metabolites that differ significantly between Normal-KF and Impaired-KF. Among these, several metabolites showed a strong positive correlation with creatinine (correlation coefficient > 0.9), such as N-acetyl-alanine, N-acetyl-proline, trimethyl-lysine, and butyryl-carnitine. These metabolites, either individually or in combination with creatinine, may serve as important components of the metabolomic signature associated with Impaired-KF. Their elevated levels could reflect altered metabolic processes such as amino acid metabolism, mitochondrial dysfunction, and disruptions in carnitine-related energy production, which are commonly observed in kidney impairment.
In contrast, some metabolites exhibited a negative correlation with creatinine, suggesting they may play a protective role in kidney health. For instance, compounds such as piperine, ergothioneine, and S-methyl-cysteine-sulfoxide were identified, all of which are recognized for their antioxidant properties and potential health benefits (21–23). Among them, piperine emerged as the most significant metabolite, showing the highest fold change and the smallest p-value in our analysis. Previous studies have demonstrated the protective effects of piperine in kidney injury models, including ischemia-reperfusion-induced damage and lead acetate-induced nephrotoxicity (24, 25). Additionally, we observed an enrichment of caffeine and its downstream metabolites, paraxanthine and theophylline, in the Normal-KF group. This finding aligns with research indicating that coffee consumption is associated with a reduced risk of both acute and chronic kidney diseases (26, 27). Future studies focusing on their mechanisms of action, pharmacological effects, and clinical applications could provide valuable insights into novel strategies for kidney injury prevention and treatment.
A key limitation of our study is the small patient cohort. Despite this, our findings reveal distinct metabolomic and proteomic signatures associated with kidney impairment post-LT. Interestingly, for the patient with recovered eGFR, the metabolomic profile aligned closely with the Normal-KF group, whereas the proteomic profile remained closer to the Impaired-KF group. This divergence underscores the importance of a multifaceted approach to post-LT kidney function monitoring. Another limitation of this study is its correlative nature, which prevents us from establishing causality between the identified metabolites, proteins, and kidney function. Given this, our study should be viewed as hypothesis-generating, laying the groundwork for further research to elucidate the roles and functional implications of the differential proteins and metabolites identified in this study.
Data availability statement
The mass spectrometry data have been deposited to the ProteomeXchange Consortium via the PRIDE (28) partner repository with the dataset identifier PXD062924. Other original contributions presented in the study are included in the article/Supplementary Material. Further inquiries can be directed to the corresponding author.
Ethics statement
The studies involving humans were approved by Northwestern University, Feinberg School of Medicine. The studies were conducted in accordance with the local legislation and institutional requirements. The participants provided their written informed consent to participate in this study.
Author contributions
XW: Data curation, Formal analysis, Methodology, Writing – original draft, Writing – review & editing. NG: Methodology, Project administration, Supervision, Writing – review & editing. BF: Investigation, Writing – review & editing. JL: Resources, Writing – review & editing. PC: Conceptualization, Data curation, Writing – review & editing. PK: Conceptualization, Funding acquisition, Visualization, Writing – review & editing.
Funding
The author(s) declare that financial support was received for the research and/or publication of this article. This work was funded by the Renal Research Institute, a wholly owned subsidiary of Fresenius Medical Care.
In memoriam
The group wishes to dedicate this work to the loving memory of Dr. Josh Levitsky. His friendship, and unwavering passion for discovery will leave a lasting legacy.
Conflict of interest
XW, NG, and PK are employees of the Renal Research Institute, a wholly owned subsidiary of Fresenius Medical Care. PK holds stock in Fresenius Medical Care. XW, NG, and PK are inventors on patents in the kidney space.
The remaining authors declare that the research was conducted in the absence of any commercial or financial relationships that could be construed as a potential conflict of interest.
PC and PK declared that they were an editorial board member of Frontiers, at the time of submission. This had no impact on the peer review process and the final decision.
Generative AI statement
The author(s) declare that no Generative AI was used in the creation of this manuscript.
Publisher's note
All claims expressed in this article are solely those of the authors and do not necessarily represent those of their affiliated organizations, or those of the publisher, the editors and the reviewers. Any product that may be evaluated in this article, or claim that may be made by its manufacturer, is not guaranteed or endorsed by the publisher.
Supplementary material
The Supplementary Material for this article can be found online at: https://www.frontiersin.org/articles/10.3389/frtra.2025.1572852/full#supplementary-material
Abbreviations
AMBP, alpha-1-microglobulin/bikunin precursor; β2M, beta-2-microglobulin; CV, coefficient of variation; FDR, false discovery rate; GFR, glomerular filtration rate; Impaired-KF, impaired kidney function; LC, liquid chromatography; LT, liver transplantation; MS, mass spectrometry; NGAL, neutrophil gelatinase-associated lipocalin; Normal-KF, normal kidney function; OPN, osteopontin; PCA, principal component analysis; QC, quality control; TIMP-1, tissue inhibitor of metalloproteinases 1.
References
1. Ginès P, Schrier RW. Renal failure in cirrhosis. N Engl J Med. (2009) 361(13):1279–90. doi: 10.1056/NEJMra0809139
2. Regner KR, Singbartl K. Kidney injury in liver disease. Crit Care Clin. (2016) 32(3):343–55. doi: 10.1016/j.ccc.2016.03.005
3. Kanduri SR, Velez JCQ. Kidney dysfunction in the setting of liver failure: core curriculum 2024. Am J Kidney Dis. (2024) 83(3):386–401. doi: 10.1053/j.ajkd.2023.08.013
4. Fisher NC, Nightingale PG, Gunson BK, Lipkin GW, Neuberger JM. Chronic renal failure following liver transplantation: a retrospective analysis. Transplantation. (1998) 66(1):59–66. doi: 10.1097/00007890-199807150-00010
5. Bahirwani R, Reddy KR. Outcomes after liver transplantation: chronic kidney disease. Liver Transpl. (2009) 15(S2):S70–4. doi: 10.1002/lt.21900
6. Stevens PE, Ahmed SB, Carrero JJ, Foster B, Francis A, Hall RK, et al. KDIGO 2024 clinical practice guideline for the evaluation and management of chronic kidney disease. Kidney Int. (2024) 105(4):S117–314. doi: 10.1016/j.kint.2023.10.018
7. Beben T, Rifkin DE. GFR estimating equations and liver disease. Adv Chronic Kidney Dis. (2015) 22(5):337–42. doi: 10.1053/j.ackd.2015.05.003
8. Allen AM, Kim WR, Larson JJ, Colby C, Therneau TM, Rule AD. Serum cystatin C as an indicator of renal function and mortality in liver transplant recipients. Transplantation. (2015) 99(7):1431–5. doi: 10.1097/TP.0000000000000552
9. Lima C, de Paiva Haddad LB, de Melo PDV, Malbouisson LM, do Carmo LPF, D’Albuquerque LAC, et al. Early detection of acute kidney injury in the perioperative period of liver transplant with neutrophil gelatinase-associated lipocalin. BMC Nephrol. (2019) 20:367. doi: 10.1186/s12882-019-1566-9
10. Levitsky J, Salomon DR, Abecassis M, Langfelder P, Horvath S, Friedewald J, et al. Clinical and plasma proteomic markers correlating with chronic kidney disease after liver transplantation. Am J Transplant. (2011) 11(9):1972–8. doi: 10.1111/j.1600-6143.2011.03669.x
11. Levitsky J, Baker TB, Jie C, Ahya S, Levin M, Friedewald J, et al. Plasma protein biomarkers enhance the clinical prediction of kidney injury recovery in patients undergoing liver transplantation. Hepatology. (2014) 60(6):2017–26. doi: 10.1002/hep.27346
12. Levitsky J, Asrani SK, Abecassis M, Ruiz R, Jennings LW, Klintmalm G. External validation of a pretransplant biomarker model (REVERSE) predictive of renal recovery after liver transplantation. Hepatology. (2019) 70(4):1349–59. doi: 10.1002/hep.30667
13. Asrani SK, Shankar N, da Graca B, Nadim MK, Cardenas A. Role of novel kidney biomarkers in patients with cirrhosis and after liver transplantation. Liver Transpl. (2022) 28(3):466. doi: 10.1002/lt.26344
14. Goerlich N, Kim-Schulze S, Kotanko P, Grobe N, Wang X, Samans B, et al. Kidney function after liver transplantation: the contrasting roles of inflammation and tubular repair. Front Transplant. (2024) 3:1480383. doi: 10.3389/frtra.2024.1480383
15. Sumner LW, Amberg A, Barrett D, Beale MH, Beger R, Daykin CA, et al. Proposed minimum reporting standards for chemical analysis chemical analysis working group (CAWG) metabolomics standards initiative (MSI). Metabolomics. (2007) 3(3):211–21. doi: 10.1007/s11306-007-0082-2
16. Pang Z, Lu Y, Zhou G, Hui F, Xu L, Viau C, et al. Metaboanalyst 6.0: towards a unified platform for metabolomics data processing, analysis and interpretation. Nucleic Acids Res. (2024) 52(W1):W398–406. doi: 10.1093/nar/gkae253
17. Inker LA, Eneanya ND, Coresh J, Tighiouart H, Wang D, Sang Y, et al. New creatinine- and cystatin C–based equations to estimate GFR without race. N Engl J Med. (2021) 385(19):1737–49. doi: 10.1056/NEJMoa2102953
18. Fabregat A, Sidiropoulos K, Viteri G, Forner O, Marin-Garcia P, Arnau V, et al. Reactome pathway analysis: a high-performance in-memory approach. BMC Bioinformatics. (2017) 18(1):142. doi: 10.1186/s12859-017-1559-2
19. Gillespie M, Jassal B, Stephan R, Milacic M, Rothfels K, Senff-Ribeiro A, et al. The reactome pathway knowledgebase 2022. Nucleic Acids Res. (2022) 50(D1):D687–92. doi: 10.1093/nar/gkab1028
20. Duranton F, Cohen G, De Smet R, Rodriguez M, Jankowski J, Vanholder R, et al. Normal and pathologic concentrations of uremic toxins. J Am Soc Nephrol. (2012) 23(7):1258–70. doi: 10.1681/ASN.2011121175
21. Haq I, Imran M, Nadeem M, Tufail T, Gondal TA, Mubarak MS. Piperine: a review of its biological effects. Phytother Res. (2021) 35(2):680–700. doi: 10.1002/ptr.6855
22. Borodina I, Kenny LC, McCarthy CM, Paramasivan K, Pretorius E, Roberts TJ, et al. The biology of ergothioneine, an antioxidant nutraceutical. Nutr Res Rev (2020) 33(2):190–217. doi: 10.1017/S0954422419000301
23. Hill CR, Haoci Liu A, McCahon L, Zhong L, Shafaei A, Balmer L, et al. S-methyl cysteine sulfoxide and its potential role in human health: a scoping review. Crit Rev Food Sci Nutr (2025) 65(1):87–100. doi: 10.1080/10408398.2023.2267133
24. Mohammadi M, Najafi H, Mohamadi Yarijani Z, Vaezi G, Hojati V. Protective effect of piperine in ischemia-reperfusion induced acute kidney injury through inhibition of inflammation and oxidative stress. J Tradit Complement Med. (2019) 10(6):570–6. doi: 10.1016/j.jtcme.2019.07.002
25. Sudjarwo SA, Eraiko K, Sudjarwo GW, Koerniasari . Protective effects of piperine on lead acetate induced-nephrotoxicity in rats. Iran J Basic Med Sci. (2017) 20(11):1227–31. doi: 10.22038/IJBMS.2017.9487
26. Hu EA, Selvin E, Grams ME, Steffen LM, Coresh J, Rebholz CM. Coffee consumption and incident kidney disease: results from the atherosclerosis risk in communities (ARIC) study. Am J Kidney Dis. (2018) 72(2):214–22. doi: 10.1053/j.ajkd.2018.01.030
27. Tommerdahl KL, Hu EA, Selvin E, Steffen LM, Coresh J, Grams ME, et al. Coffee consumption may mitigate the risk for acute kidney injury: results from the atherosclerosis risk in communities study. Kidney Int Rep. (2022) 7(7):1665–72. doi: 10.1016/j.ekir.2022.04.091
Keywords: liver transplantation, renal dysfunction, metabolomics, proteomics, mass spectrometry
Citation: Wang X, Grobe N, Franchin B, Levitsky J, Cravedi P and Kotanko P (2025) Metabolomic and proteomic analyses of renal function after liver transplantation. Front. Transplant. 4:1572852. doi: 10.3389/frtra.2025.1572852
Received: 7 February 2025; Accepted: 7 April 2025;
Published: 29 April 2025.
Edited by:
Michael Kueht, University of Texas Medical Branch at Galveston, United StatesCopyright: © 2025 Wang, Grobe, Franchin, Levitsky, Cravedi and Kotanko. This is an open-access article distributed under the terms of the Creative Commons Attribution License (CC BY). The use, distribution or reproduction in other forums is permitted, provided the original author(s) and the copyright owner(s) are credited and that the original publication in this journal is cited, in accordance with accepted academic practice. No use, distribution or reproduction is permitted which does not comply with these terms.
*Correspondence: Xiaoling Wang, eGlhb2xpbmcud2FuZ0BycmlueS5jb20=
†Deceased