 Stefanie B. Wirth
 Damien Bouffard
 Jakob Zopfi
- 1Centre for Hydrogeology and Geothermics, University of Neuchâtel, Neuchâtel, Switzerland
- 2Eawag, Swiss Federal Institute of Aquatic Science and Technology, Surface Waters - Research and Management, Kastanienbaum, Switzerland
- 3Aquatic and Stable Isotope Biogeochemistry, Department of Environmental Sciences, University of Basel, Basel, Switzerland
Pockmarks are circular depressions on the floor of oceans and lakes and constitute potential hot spots of gas ebullition and/or groundwater discharge. Marine pockmarks are well-studied, whereas lacustrine pockmarks are virtually unexplored. In Lake Neuchatel (Switzerland) four giant pockmarks of 80 to 150 m in diameter are located along the northern shore and adjacent to the karst system of the Jura Mountains. Two pockmarks have a ~60 m-deep chimney filled with mud; two are funnel-shaped 12 and 29 m deep holes. We present evidence for the presence of groundwater in the pockmark chimneys and active lacustrine groundwater discharge (LGD) at both pockmark types. Temperature, electrical conductivity and calcium concentrations of the pore water in the chimneys show values typical for karst water (maximal sampling and profiling depth: 41 m into the pockmark) and contrast strongly with the properties of the lake water. TOC and TIC indicate that the chimney mud is homogenized and composed of liquefied sediments from the entire deglacial to Holocene lacustrine sediment succession. Mini mud volcanoes apparent on the suspension surface imaged with a remotely operated vehicle (ROV) localize the groundwater exit points and confirm LGD. LGD is further corroborated by electrical conductivity anomalies detected above the lutoclines and within a funnel-shaped pockmark during the ROV survey. We conclude that the giant pockmarks in Lake Neuchatel represent a type of subaquatic springs that connect the water body of the lake with the karst system. A next essential research step will be to quantify LGD via the pockmarks in order to assess their lake-wide relevance. This study underlines the existing need for research on the connectivity of lakes and oceans with groundwater systems for completing our understanding of the hydrological cycle.
Introduction
Pockmarks are crater-like depressions that occur on muddy sea- and lakebeds worldwide with diameters from <1 to hundreds of meters (King and Maclean, 1970; Hovland et al., 2002). They form where focused fluids migrate through unconsolidated sediments toward the sediment surface. In the marine realm, pockmarks are common morphological features and seabed fluid flow (gas seepage, submarine groundwater discharge, hydrothermal vents) is considered to contribute significantly to the oceans' hydrological and geochemical budgets (Judd and Hovland, 2007). The same is supposedly true for lakes but the role of lacustrine pockmarks in this respect is virtually unexplored.
During the last 10–15 years pockmarks have been intensively studied e.g., around Norway (Inner Oslofjord, Barents Sea, North Sea, Svalbard; Hammer and Webb, 2010; Nickel et al., 2012; Pau et al., 2014; Mazzini et al., 2016; Roy et al., 2016) and off the coast of Maine, United States (Ussler Iii et al., 2003). The primary goals were to assess the present-day activity and to reconstruct the reason for initial pockmark formation. The majority of those studies showed, however, that pockmarks are presently dormant. The likely reason is that pockmark formation is primarily related to the end of the last glaciation. Glacial melting induced a pressure release enabling gas hydrate decomposition, upwards migration of pore fluids, or increased circulation of fluids via tectonic faults. Yet, in one study active fluid flow was observed: low-salinity pore water and a disturbed stratigraphy found in 8 m-long piston cores from the Oslofjord was interpreted as evidence for groundwater seepage (Hammer and Webb, 2010).
Lacustrine pockmarks are far less well-investigated compared to their marine counterparts, principally due to a lack of high-resolution swath bathymetric data needed for localizing pockmarks. Nonetheless, important gas seeps were described in Lake Baikal (Granin and Granina, 2002), and in Lake Constance about 500 pockmarks were detected near the mouth of the Rhine River (Wessels et al., 2010). About 24% of these pockmarks continuously release biogenic methane into the water column (Bussmann et al., 2011). Organic-rich allochthonous material transported into the lake by the Rhine River constitutes the energy source for methane formation. Lacustrine groundwater discharge (LGD) linked to sediment fluidization is known from various basins of Lake Banyoles, a lake of karstic-tectonic origin in NE Spain (Casamitjana and Roget, 1993). In the different basins sediments may be permanently suspended or sediment fluidization is activated through groundwater jets as a consequence of heavy rainfall (Colomer et al., 1998, 2002).
The above literature review highlights that the majority of the investigated marine and lacustrine pockmarks are characterized by gas seepage and that pockmark formation through groundwater discharge is less frequent. Nevertheless, pockmarks represent high-potential locations for groundwater discharge. In particular along coasts and lake shores characterized by karst systems it is crucial to better assess the potentially important role of groundwater discharge (including also other sources than pockmarks such as subaquatic springs) for the hydrological and chemical (nutrient) budgets (Fleury et al., 2007; Oehler et al., 2017; Foley, 2018). In the marine realm, total SGD has been estimated at 0.01–10% (Church, 1996) and 0.3–16% (Burnett et al., 2003) of the global riverine water input. Uncertainties are large because knowledge about “hydraulic gradients and transmission coefficients along the world's coasts” (Church, 1996) is limited. Groundwater discharge has also been observed in lakes but quantification studies are still scarce (e.g., Colomer et al., 1998; Del Don et al., 2001; Bonhomme et al., 2011; Lewandowski et al., 2015; Rosenberry et al., 2015).
In Lake Neuchatel, numerous pockmarks were discovered in 2012 during acquisition of high-resolution swath bathymetric data (Reusch et al., 2015, 2016; Reusch, 2016). Most prominent are four “giant” pockmarks (“giant” at the lacustrine scale) with diameters from 80 to 150 m located along the northern lakeshore (Figures 1, 2; Table 1).
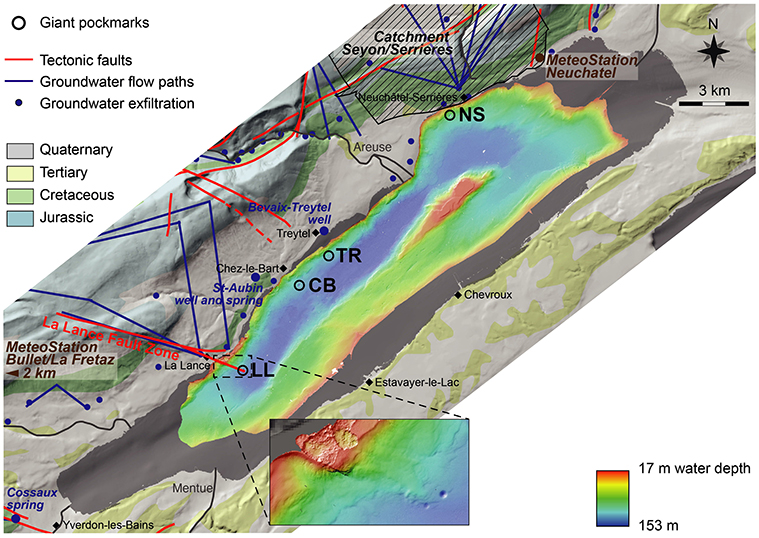
Figure 1. Lake Neuchatel with Swath bathymetry below 17 m water depth (Reusch, 2016), as well as with the locations of the four giant pockmarks along the northern shore (LL, CB, TR, NS) and of springs and wells used as comparison for water parameters. The main geological units, tectonic faults, and some well-known groundwater flow paths and groundwater infiltration points are also shown (Swisstopo, 2014).
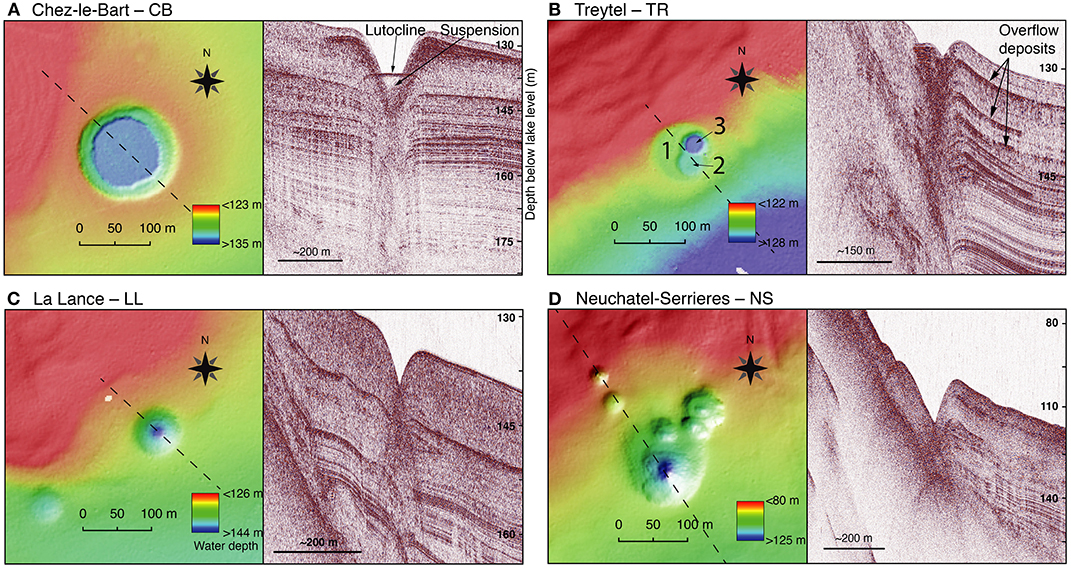
Figure 2. Morphological details and reflection seismic profiles (3.5 kHz pinger) of the four giant pockmarks. Dashed lines show position of seismic profiles. (A) Chez-le-Bart CB and (B) Treytel TR are pockmarks with chimneys filled with a sediment suspension; (C) La Lance LL and (D) Neuchatel-Serrieres NS are funnel-shaped pockmarks without sediment suspension. For (A) the interface between the sediment suspension and the lake water is highlighted (i.e., the lutocline), for (B) the overflow deposits that mark expulsion events in the past, as discussed in Loher et al. (2016) and Reusch (2016), are exemplarily marked. Also note the three generations of circular depressions that characterize the (B) TR pockmark (TR3, TR2, TR1). Data courtesy: Reusch (2016).
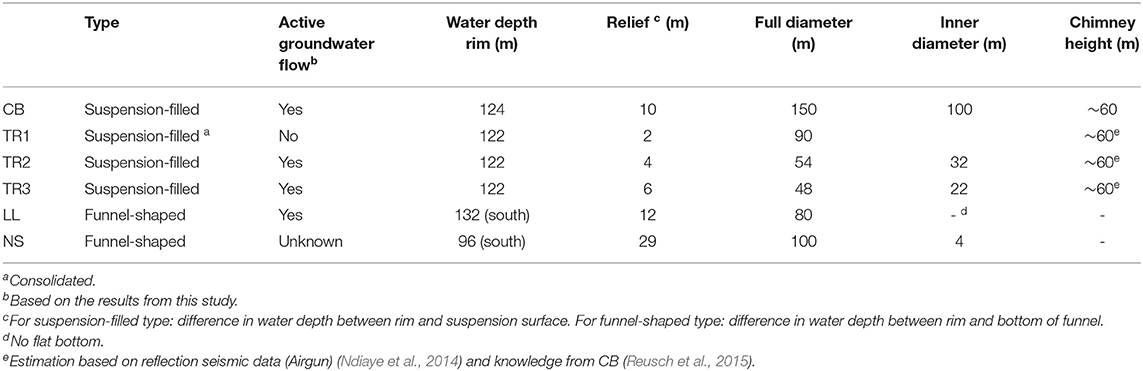
Table 1. Summarizing information and current state of interpretation of activity for the four giant pockmarks in Lake Neuchatel.
For the largest of the giant pockmarks (Chez-le-Bart CB, 150 m in diameter, Figure 2A) Reusch et al. (2015) showed that the water inside the ~60 m deep pockmark chimney that is filled with suspended sediment derives from the karst system of the Jura Mountains. Evidence is based on a higher temperature and a more depleted oxygen isotopic composition of the water inside the chimney as compared to the lake's bottom water. In addition, the depth of the chimney corresponds to the thickness of Quaternary (glacial, deglacial, and Holocene) deposits overlying the bedrock at the pockmark location (Ndiaye et al., 2014). Accordingly, Reusch et al. (2015) interpreted these hydrochemical and sedimentary data as evidence for “groundwater entering the lake.” However, this data basis provides certainly evidence for a groundwater-filled chimney but not necessarily for active LGD. If the groundwater head does not exceed the hydrostatic pressure of the lake's water column and of the chimney, a scenario is possible where groundwater is stagnant in the chimney and no discharge into the lake occurs.
Active groundwater flow into the lake was also postulated for the Treytel (TR) pockmark but solely based on the morphological similarity with the CB pockmark and an amplitude anomaly in the reflection seismic data in the water column above the TR pockmark (Reusch et al., 2015; Loher et al., 2016). The Treytel (TR) pockmark shows—as CB—a flat sedimentary surface in the interior of the depression but is special in the sense that it consists of three generations of presently or formerly active zones (TR1, TR2, TR3; Figure 2B).
The two funnel-shaped pockmarks La Lance (LL) and Neuchatel-Serrieres (NS) without a mud-filled chimney represent the second type of giant pockmarks (Figures 2C,D; Table 1). However, no data except reflection seismic profiles and swath bathymetry has been recorded so far, thus no evidence has been produced in favor or against present fluid-flow activity.
The above outline of previous results highlights the existing knowledge gap for understanding the functioning and the importance of the giant pockmarks for the system of Lake Neuchatel. Altogether, there exists an important research need concerning the connectivity of lakes (and oceans) and groundwater systems for completing our understanding of the hydrological cycle. In this regard, Lake Neuchatel with detailed bathymetric information and the well-documented karst system in the Jura Mountains represents an ideal model site for exploring the quantitative importance, dynamics and biogeochemistry of lacustrine pockmarks and LGD.
The present study has three central objectives:
• Examine which of the four giant pockmarks are currently hydraulically connected to the karst system.
• Investigate at which pockmarks LGD is presently active.
• Study the chimney sediments for learning about the flow dynamics therein and about the operating mode of the pockmarks.
Study Area
The surface of Lake Neuchatel is located at 429 m asl and has an area of 215 km2; the catchment area covers 2672 km2 with a maximal and an average elevation of 1680 m asl and 780 m asl; and the maximal and average water depth is 153 and 64.2 m (Schwalb et al., 1994). The theoretical residence time of the water is 8.25 years (Schwalb et al., 1994).
The lake fills an overdeepened trough in the Molasse bedrock that was carved by the Rhone Glacier during multiple Quaternary glaciations (Preusser et al., 2010) (Figure 1; Supplementary Information). Airgun reflection seismic data revealed the interface between the glacial deposits and the bedrock and the profiles indicate a maximal late Quaternary sediment thickness of ~200 m (glacial, deglacial and Holocene deposits) (Gorin et al., 2003; Ndiaye et al., 2014). The thickness of the Holocene sediments varies between ~6–15 m depending on the location in the basin (Schwalb et al., 1994). At the positions of the giant pockmarks the thickness of the lacustrine sediment sequence (deglacial and Holocene sediments) is estimated at ~60 m deduced from the Airgun reflection seismic data (Ndiaye et al., 2014) and Cone Penetration Tests in the CB pockmark chimney (Reusch et al., 2015). The present sedimentary regime in Lake Neuchatel is dominated by authigenic carbonate precipitation during summer (Schwalb, 1992; Lambert, 1999). Sedimentation of clastic particles, in contrast, is largely restricted to the areas of river mouths. The sedimentary regime was more clastic during the first half of the Holocene when the Aar River that drains a high-alpine area at least intermittently flowed into Lake Neuchatel (Schwalb et al., 1994). This influence of the Aar River ended around 5000 cal yr BP (Schwalb et al., 1994).
Regarding the hydrogeological setting, the northern shore that is oriented parallel to the foot of the southernmost fold of the Jura Mountains is strongly influenced by the karst system of the Jura Mountains. Major karst springs onshore (blue points in Figure 1) represent the collection points of several groundwater flow paths with infiltration areas on top of the southernmost fold of the Jura Mountains (~1450 m asl) as well as on the slope down to the lake (Pasquier et al., 1999, 2006). The water infiltrates into Jurassic and Cretaceous karstified bedrock. This pattern is valid for springs located at the lake shore in the western part of the lake and in particular at the La Lance fault (Figure 1). In Bevaix-Treytel and in St-Aubin (locations in Figure 1) a 300 and a 383 m-deep well provide drinking water (Pasquier et al., 1999; Centre d'hydrogéologie, 2000). The main water volume is pumped from the important Malm (Portlandian) aquifer. In case of the catchment of the Serrières spring and the Seyon River (northeastern lake shore), the water originates from deeper in the Jura Mountains, between the first and second Jura fold, indicated by the hatched area in Figure 1.
The climate regime is humid continental dominated by a predominantly Atlantic moisture source bringing cool air in summer but warm air in winter to the lowlands of the Swiss Molasse basin (Meteoswiss, 2018). In the city of Neuchatel (station Neuchatel, 485 m asl, Figure 1; Meteoswiss, 2018) located at the shore of Lake Neuchatel average air temperature is 10.6°C and annual precipitation 959 mm (average 1988–2017). On top of the most southern tectonic fold of the Jura Mountains (station Bullet/La Fretat, 1205 m asl, Figure 1; Meteoswiss, 2018), representing the higher realm of the catchment area of Lake Neuchatel, average air temperature is 6.3°C and annual precipitation 1304 mm (average 1988–2017).
Methods
A Remotely Operated Vehicle (ROV; RB600, Eprons Latvia) was deployed on March 10, 2017, to survey the giant pockmarks. The ROV was equipped with a 360° sonar (SeaPrince, Tritech) and registered video material in VHS and HD quality. In addition, we mounted a light CTD probe (DCX-22-CTD, Keller Switzerland) on the ROV that continuously logged (2s interval) the temperature and the electrical conductivity of the water, as well as the pressure that was later transformed into water depth.
CTD profiles through the water column and into the pockmark chimneys were realized on Oct 17, 2017, using a RBR™ probe equipped with additional weight underneath (15 kg as Pb cubes).
The pockmark mud, i.e., suspended sediment in the chimney, was sampled with a 5 l Niskin bottle (Hydro-Bios, Kiel) that was lowered from the boat on June 15, 2017, and on September 21, 2017, at four depths within the chimney. For this we attached 20 kg of additional weight below the Niskin bottle and used two GoDevil messengers (2 ×870 g; General Oceanics, Miami FL) to activate the closing mechanism of the bottle in the mud. The CTD probe that we used during the ROV survey was attached to the additional weight and lowered each time together with the Niskin bottle. On June 15 we used an electrical winch that precisely indicated the length of the unrolled rope. This allowed a precise tracking of the depth of the sampling device and with that the transformation of the pressure data into density for the pockmark mud.
The pockmark mud was collected in 5 l plastic containers on the boat. In June, samples for stable water isotopes (8 ml vials) and major cations and anions (20 ml vials) were taken in the laboratory the next day from the supernatant water. Samples were filtered (0.45 μm pore size) and for cation analysis additionally acidified with two drops of 10% HNO3. In September, dissolved oxygen and pH were measured on the boat with a handheld probe (HQ40D, HACH Switzerland) immediately after the transfer of the mud to the containers. Rhizon samplers (type MOM 10 cm long porous part, pore size 0.58–0.65 μm) (Rhizosphere Research Products, Wageningen The Netherlands) were inserted into the fresh mud to extract pore water for the chemical characterization. About 10 ml of pore water was sucked directly into separate evacuated 120 ml serum flasks containing 0.1–0.2 ml of 10% HNO3 for cations, 1 ml of 5M HCl for ferrous iron, and 0.25 ml of 20% w/v zinc acetate for dissolved sulfide. Samples for stable water isotope and anion analysis were, similarly as in June, taken in the laboratory but this time by centrifuging the mud followed by filtering (0.45 μm).
The stable water isotope composition was measured with a Picarro L2130-i using the high-precision mode (9 injections per sample, 10 min per injection) and was calibrated against internal laboratory standards. Mean standard deviation of δ18O analyses is 0.02%0 (n=13). Major cations and anions were analyzed by ion chromatography on a Dionex DX-120 and Dionex ICS-1600, respectively, and calibrated against internal laboratory standards. Dissolved ferrous iron (Fe2+) was analyzed photometrically using Ferrozine (Stookey, 1970) and dissolved sulfide (i.e., H2S + HS− + S2−) was quantified by the colorimetric methylene-blue method (Cline, 1969).
Sediment samples for grain-size, carbon, and 137Cs analysis were taken after the June sampling in the laboratory. The mud was subsampled after thorough stirring and samples were freeze-dried and homogenized, the latter only for carbon and 137Cs analysis. Before grain-size analysis, we added 1 g of dry sample to a 50 ml centrifuge tube and oxidized the organic fraction using 15 ml 35% H2O2 during 3 h at 50°C. After this treatment we let the remaining solution evaporate and rinsed the samples twice with deionized water with centrifugation in between. Afterwards, samples were dispersed in 25 ml aqueous Na-pyrophosphate solution (5 g/l Na4P2O7) and placed on a shaker for 12 h. Grain-size analysis was realized with a MasterSizer 2000 (Malvern) instrument at the Geographical Institute of the University of Bern using an in-house standard protocol established for soil and sediment samples based on Ryzak and Bieganowski (2011): no ultrasound dispersion (as Na-pyrophosphate is used), stirring velocity 2800 RPM, obscuration range 10–25% (on average it was 22%), and 3 replicate measurements of 25 s each. We transferred the samples into the machine after thorough stirring using a pipette. For total carbon (TC) analysis, we weighed the homogenized samples into tin capsules. For total organic carbon (TOC) analysis, we weighed samples into silver capsules, covered the sample with milliQ H2O and decarbonized with the fumigation method in a desiccator (6 h, ~10 ml of 37% HCl) (e.g., Komada et al., 2008). Carbon analyses were realized with a Flash 2000 CHN-O Analyzer (ThermoFisher Scientific) instrument. Total inorganic carbon (TIC) was calculated as TIC = TC - TOC. For 137Cs activity measurements (at Eawag, Dübendorf, Switzerland) 4 to 5 g of homogenized sediment was filled into 10 ml tubes.
Results
Precipitation Prior to Field Campaigns
The Jura karst system reacts within days on heavy precipitation. For instance, the pressure in the Bevaix-Treytel well lags the peak discharge of the superficial riverine discharge (Orbe River) by 7 to 14 days (Muralt, 1999, section ROV Survey). For interpreting the ROV survey and the hydrochemical and sedimentological data from the pockmark chimney we therefore considered the amount of precipitation that fell and was partly fed into the karst system during the 14 days preceding the field campaigns. Figure 3 shows the daily precipitation in 2017 at the closest available meteorological station Bullet/La Fretaz (distance to pockmarks: 15 to 20 km). Conditions were wet during the 14 days preceding the ROV survey, with 85 mm of rain representing 8% of the annual precipitation. Before the sampling campaigns in June and September rain conditions were similar with 41 mm and 37 mm corresponding to 3.6 and 3.9% of the annual precipitation. Before the CTD profiles in October conditions were dry with 6 mm or 0.6% of the annual precipitation.
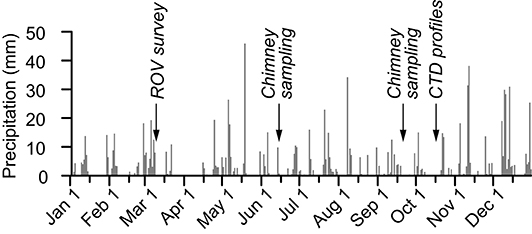
Figure 3. Daily precipitation at the meteorological station Bullet/La Fretaz at 1205 m asl in the Jura Mountains (see Figure 1) during 2017 (Meteoswiss, 2018) and timing of the giant-pockmark field campaigns.
ROV Survey
We visited three (CB, TR, LL) of the four giant pockmarks during the ROV survey. NS was not investigated due to time constraints. The goal was to document the structure of the sediment surface inside and outside of the pockmarks (Figure 4) with the aim to find signs of present fluid-flow activity. In addition, the CTD probe mounted on the ROV would detect groundwater exiting the pockmarks. The 360° sonar imaged not only structural features of the lake floor in greater detail than the bathymetric data but served also for orientation since the circular depressions on the lake floor are well-represented on the sonar images. Per pockmark, the ROV cruised for about 1 h, the most interesting 25 min of these cruises are shown in Figure 5 in form of the CTD probe data.
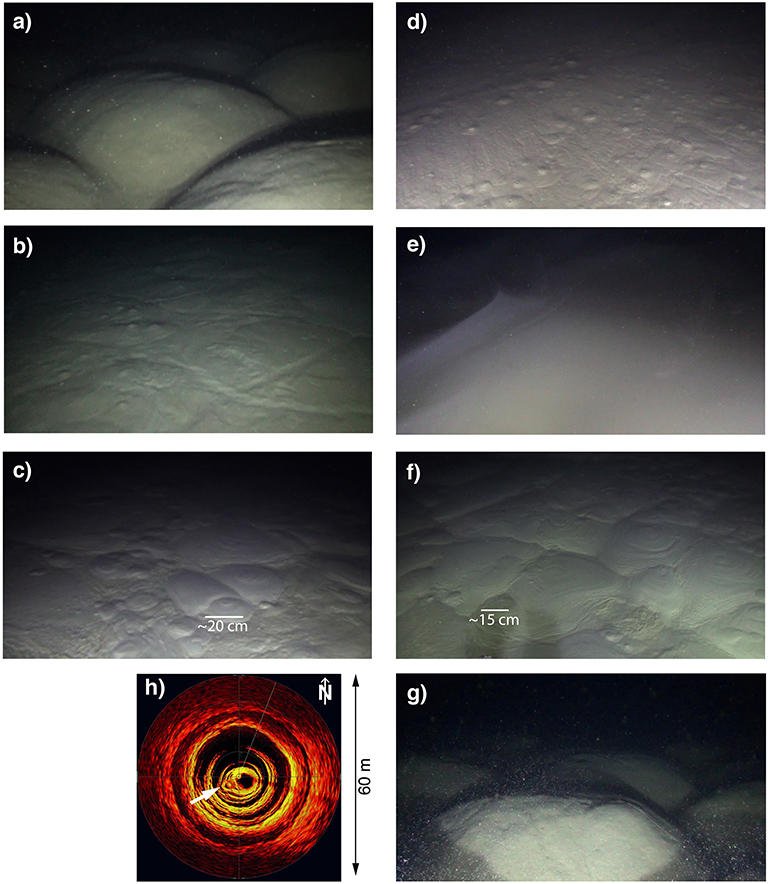
Figure 4. Pictures and 360° sonar scan recorded during the ROV survey illustrating the lake-floor morphology outside and inside of the pockmarks. (a) Sediment pillow structures outside of the CB pockmark, representing the normal lake floor; (b) appearance of mini mud volcanoes at the surface of the sediment suspension as well as fish tracks between the outer and inner rim of CB; (c) mini mud volcanoes in the center of CB; (d) same as (b) but for TR3; (e) center of TR3 characterized by a high turbidity and a not detectable sediment surface; (f) same as (c) but for TR2; (g) pillows inside of TR1; and (h) 360° sonar scan recorded when the ROV was located in the funnel of LL highlighting the anomaly in the pockmark wall (white arrow) where groundwater presently possibly enters the lake.
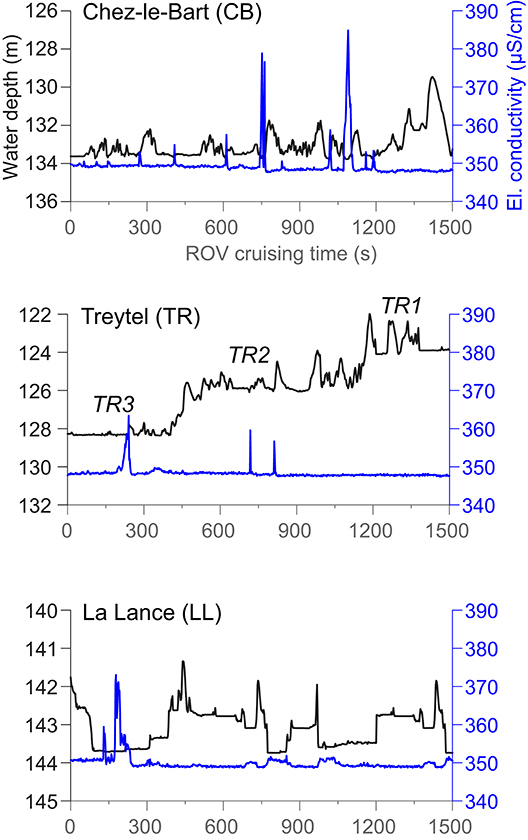
Figure 5. Data of the CTD probe that was mounted on the ROV during the survey for the CB, TR, and LL pockmarks. The x-axis corresponds to the cruising time of the ROV, shown are the most interesting 25 min (1500 s); the y-axes show the depth of the ROV in the water and the electrical conductivity of the water.
At CB, the ROV landed on the northern rim and traveled a transect through the pockmark toward the southern rim. Outside of the pockmark, thus on the normal lake floor, regular pillow structures (pillow diameter: 0.5 to 1 m) are present (Figure 4a). During the transition from the outer to the inner rim we observed a smooth floor with lineaments on the sediment surface that could possibly be produced by burbots (Lota lota L.). When approaching the central part of the pockmark “mini mud volcanoes” started to appear (Figure 4b) and became more expressed toward the center of the pockmark (Figure 4c). These structures looked very similar as in Pralle et al. (2003) although that study used gas bubbles in their experiments. The mini mud volcanoes thus characterize the suspension surface and we interpret them as the result of a rising fluid dragging sediment particles through the lutocline. The mini mud volcanoes show a gray color that is characteristic for the clayey sediments deposited during the first half of the Holocene (before 5000 cal yr BP, see section Study Area Study site) and during deglaciation (Schwalb et al., 1994; Loher et al., 2016; Reusch et al., 2016), while the beige color between the structures probably represents settled modern authigenic calcite (Figures 4c,f; Supplementary Video at 02:04). When touching the sediment surface with the ROV the lutocline started moving and a high turbidity as well as sediment avalanches formed immediately (Supplementary Video at 01:49). When the ROV was closest to the lutocline (i.e., largest water depth in Figure 5), the CTD probe registered various spikes of increased electrical conductivity (Figure 5). Values abruptly rose from 348 μS/cm to over 380 μS/cm.
At TR, we deployed the ROV on the northeastern rim of the pockmark and then first visited TR3. When approaching the center of TR3 mini mud volcanoes started to appear after an initial interval characterized by a smooth sediment surface (Figure 4d). Thus, until there the structure of the sediment surface was similar as in CB. However, when the ROV was in the center of TR3 no sediment surface (i.e., lutocline) could be recognized, neither with the camera nor with the sonar. The environment was characterized by a strong turbidity as shown in Figure 4e. In the center of TR2 the sediment surface was characterized by mini mud volcanoes, thus showing the same characteristics as in CB (Figure 4f). In contrast, the sediments in TR1 showed a pillow structure comparable to the lake-floor structure observed outside CB (Figures 4a,g), indicating that sediments have recently not been liquefied. Consistent with the lake-floor morphology spikes in electrical conductivity were detected in TR3 and TR2 (increasing from 348 to maximally 364 μS/cm) but not in TR1 (Figure 5).
At LL, the ROV traveled an E-W profile and dived into the funnel during this transect. As expected from the bathymetric data we did not encounter a suspension surface. Nonetheless, four interesting features were observed: (i) the CTD probe registered conductivity spikes when the ROV was deep in the funnel (increasing from 348 to maximally 373 μS/cm) (Figure 5); (ii) on the 360° sonar image that was recorded when the ROV was positioned deep in the funnel a circular anomaly in the wall structure is visible (Figure 4h, white arrow); (iii) the ROV was not able to approach this anomaly due to a current; and (iv) the video footage shows mostly turbid waters but intermittently also a very clear blue field of vision (Supplementary Video at 04:29). Together, these four features suggest the presence of a lacustrine groundwater spring located in the SW section of the funnel. Moreover, the LL pockmark lies in the extension of the La Lance fault zone (Figure 1), suggesting that the groundwater flow is directed from NW to SE.
Vertical CTD Profiles
Figure 7 shows the CTD profiles recorded at CB, TR, and LL from 100 m depth in the water column down to the maximal penetration depth in the pockmark chimney.
At CB, the probe could be lowered to ~176 m, i.e., ~44 m into the chimney (Figure 6). We estimated the depth below the lutocline (at 132 m in the CTD data) by visually monitoring the length of the lowered rope with markers and by transforming the pressure data into depth, assuming an average density of the pockmark mud of 1.5 g/cm3 (for calibration of density see below). At TR3, the probe could be lowered ~25 m into the pockmark chimney (Figure 6). Here, no calibration of the mud density is available and the estimation is only based on the visual observation of the length of the rope lowered into the chimney. At TR2, the probe penetrated only ~5 m into the pockmark (Figure 6).
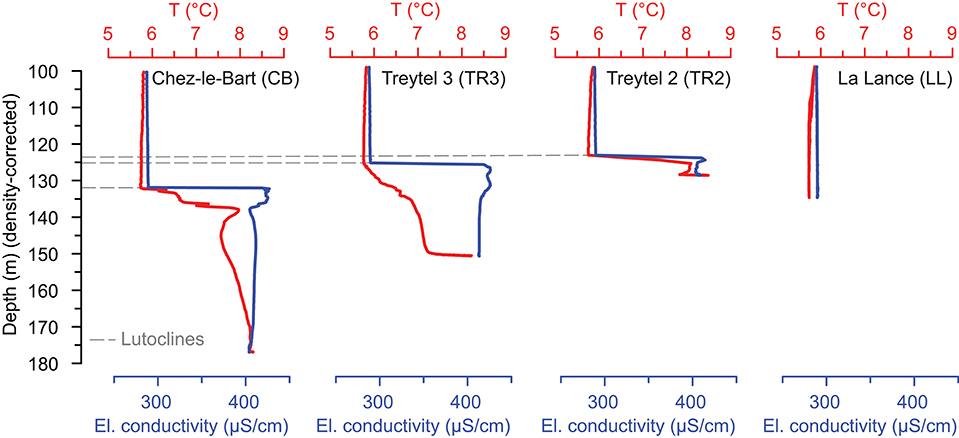
Figure 6. CTD profiles at the locations of the CB, TR3, TR2, and LL pockmarks. Horizontal gray dashed lines mark the depth of the suspension surface at CB, TR3, and TR2 in the bathymetric data (see also Table 1).
When the CTD probe passed the lutocline at CB, TR3, and TR2 (Figure 6), electrical conductivity abruptly increased from 288 to about 400 μS/cm (404 μS/cm at CB; 413 μS/cm at TR3; 406 μS/cm at TR2). Temperature shows also an increase, from 5.7°C in the water column to about 8.5°C at the bottom of the recorded profiles. Interestingly, the rise of the temperature shows a more irregular pattern compared to the abrupt increase of the electrical conductivity (Figure 6). This could be related to the molecular diffusivity being larger for temperature than for conductivity. In the case of TR3 the temperature only passed the 8°C limit once the probe could not further penetrate into the sediment (Figure 6).
Reached profiling depths at TR3 and TR2 were with 25 m and 5 m low compared to CB (Figure 6). This was surprising, at least for TR3 where a high turbidity was observed but no bottom/suspension surface was recognizable during the ROV survey. The high amount of precipitation that fell during the 14 days prior to the ROV survey might have increased the fluid-flow activity at TR3 and produced the observed high turbidity (Figures 3, 4e). In contrast, conditions were dry prior to the CTD profiling campaign. Another scenario for explaining the limited profiling depths in pockmarks TR3 and TR2 may be that the CTD profiles are not positioned in the pockmark centers since the active diameters measure 32 and 22 m only (Table 1). Even though conditions on the lake were windless, the water depth of 128 and 126 m at the pockmarks may allow the CTD probe drifting away from the position of the boat while being lowered.
At the funnel-shaped LL pockmark neither electrical conductivity nor temperature varied while the probe was lowered to 137 m water depth (Figure 6). Here it has to be considered that (i) we probably did not reach the bottom of the funnel (144 m depth) due to a not totally centered position of the profile above the pockmark, and that (ii) the CTD profile represents only a line measurement. It is therefore possible that we missed the spot(s) where LGD occurs. We thus do not consider the CTD profile as contradicting the positive evidence for LGD found during the ROV survey at LL. ROV surveys are more efficient than boat-based profiling for investigating small and funnel-shaped pockmarks in particular.
Hydrochemical and Sedimentological Properties of the CB Chimney
In June, the water column was sampled at 100, 129, and 133 m water depth, and the mud in the pockmark chimney at a total depth of about 136, 146, 160, and 175 m, i.e., at about 2, 12, 26, and 41 m depth in the chimney (Figure 7A). In September, the water column was sampled at 100, 132, and 133 m water depth, the mud in the pockmark at a total depth of about 138, 160, and 175 m, i.e., at about 4, 26, and 41 m in the pockmark chimney. We tried to sample deeper in the chimney, but tension on the rope decreased and we were not able to close the Niskin bottle anymore. This likely indicates that the mud becomes too dense below about 40 m in the chimney for sampling with a Niskin bottle.
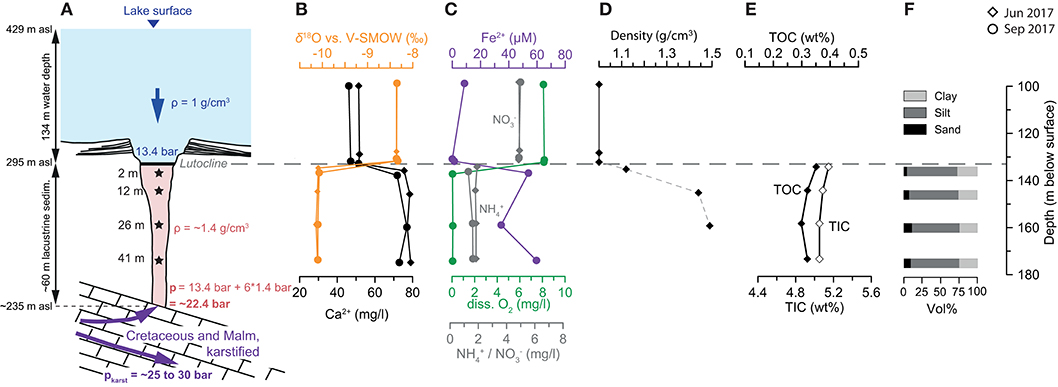
Figure 7. (A) Conceptual model of the CB pockmark showing the chimney with a depth of ~60 m, the positions of the samples taken in the chimney and the (hypothesized) direct contact between the chimney and the Mesozoic units and thus the karst system. Also shown are estimations for the hydrostatic pressure at the base of the chimney and the hydraulic pressure in the karst system. (B) δ18O composition and Ca2+ concentration in the lake water and in the pore water of the chimney mud; (C) concentrations of Fe2+, , and dissolved oxygen. (D) Density of the pockmark mud estimated via pressure data and exact depth control from the electrical winch. (E) TOC and TIC content in the particulate fraction of the pockmark mud. (F) Grain-size volume fractions of the pockmark mud.
The hydrochemical parameters show a prominent and abrupt change between the deepest sample in the water column and the first sample from the mud (Figure 7). Nearly no variation of the measured parameters was observed within the group of the water-column samples and neither among the mud samples. In addition, for all analyzed water parameters values found in June and in September are nearly identical. The concentrations of the major cations Ca2+ and Mg2+ importantly increase at the lutocline (Figure 7B and Supplementary Figure 2). Ca2+ for instance increased from 45–50 to 75 mg/l. Detectable ammonium () concentrations were found only in the mud (~2 mg/l), while nitrate () was only present in the water column (~5 mg/l) (Figure 7C). Ferrous iron (Fe2+) rose from a concentration close to zero above the lutocline to 35 to 60 μM in the mud (Figure 7C). Dissolved sulfide (H2S; not shown) was absent in the water column and barely reached 1 μM in the pockmark mud. Dissolved oxygen concentrations decreased from 8 mg/l in the water column to zero in the mud (Figure 7C). Chloride (Cl−) and sodium (Na+) showed higher concentrations in the water column (10 and 6.5 mg/l) than in the mud (5 and 4.5 mg/l) (Supplementary Figure 2). pH remained virtually constant with values of 7.7 in the water column and 7.4 in the mud (Supplementary Figure 2).
The oxygen isotopic composition (δ18O) of the water was −8.35 ± 0.01%0 (n = 6) in the lake and −10.10 ± 0.02%0 (n = 7) in the chimney mud (Figure 7B). Values from June and September were quasi identical. Comparison of the lake and pockmark data with the local meteoric water line (LMWL) in Bern (distance 45 km; GNIP data) revealed that the chimney data plot on the line, while the water column samples plot below the line indicating evaporation (Figure 8). A LMWL from the Jura Mountains would be more favorable for a comparison, however, no suitable data set containing both hydrogen and oxygen measurements is available (e.g., Pearson et al., 1991, p. 85). In return, the altitude effect on the stable water isotope composition has been well-established for the Jura Mountains (Pearson et al., 1991; Muralt, 1999), providing the following relationship between δ18O and altitude: −0.31%0/100 m (Equation 1) and −0.18%0/100 m (Equation 2).
This proposes an altitude of infiltration of 1016 and 822 m asl, respectively, for the water in the chimney mud. The relief between the lake surface (429 m asl) and the highest point on the fold of the Jura Mountains adjacent to the lake (1450 m asl) is 1021 m, thus yielding an average elevation of 940 m asl. Hence, the estimation of the altitude of infiltration based on equations from the literature is close to the average elevation on the slope from the top of the Jura fold down to the lake.
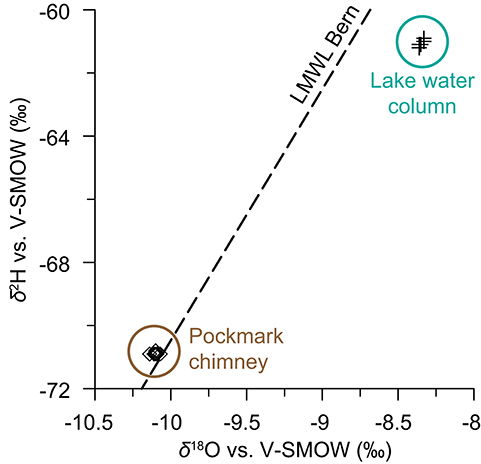
Figure 8. δ18O vs. δ2H plot for lake-water and pore-water samples from the CB chimney compared to the LMWL of Bern (GNIP data). In contrast to the lake-water samples the plot indicates no evaporation for the pockmark samples, what underlines the groundwater character of the pockmark samples.
The sedimentological properties of the mud were analyzed on the samples taken in June. The density of the mud 2 m below the lutocline is estimated at 1.12 g/cm3 (Figure 7D). It follows an important increase to about 1.44 and 1.49 g/cm3 for the samples at 12 and 26 m depth in the chimney. Pressure exceeded the limit of the probe below 160 m, no density information is thus available for the sample at 41 m depth in the chimney. TOC and TIC values show little variation in the chimney (Figure 7E), the average TOC and TIC content of the dry sediment fraction is 0.3 and 5.1 wt%, respectively. The carbonate content (primarily calcite) of the dry sediment is thus estimated at 42 wt%. The grain-size distribution is dominated by silt (66 ± 1.6 vol%; n = 4); clay contributes on average 26 ± 1.3 vol% and sand 8 ± 2.9 vol% (Figure 7F). Importantly, the sand fraction increased from 4 vol% at 2 m depth in the chimney to 11 and 9 vol% at 26 and 41 m depth. At the same time, the silt fraction decreased while clay values remained constant. The four samples measured for 137Cs activity showed zero activity. Furthermore, the sediment was investigated for rests of organisms (diatoms and other phytoplankton, crustaceans, terrestrial organisms) (analysis by F. Straub, PhycoEco, La Chaux-de-Fonds, Switzerland). No organisms or rests of them were found. It is possible though that (i) the Holocene sediments, i.e., the sediments of the biologically productive period, in the pockmark mud is heavily diluted by the glacio-lacustrine clay, and that (ii) the opal of the diatoms was dissolved, a process previously observed in Lake Neuchatel (Straub, 1993).
Discussion
Previous studies identified suspension-filled and funnel-shaped giant pockmarks along the northern shore of Lake Neuchatel adjacent to the karst system, however, proof for active LGD has been missing (Reusch et al., 2015; Loher et al., 2016). The objectives of this study were therefore to examine if all pockmarks are hydraulically connected to the karst system and if LGD via the pockmarks is currently active. Additionally, we studied the chimney sediments for learning about the operating mode of the suspension-filled pockmarks.
Evidence for Groundwater in the Pockmark Chimneys
The abrupt change in the hydrophysical and -chemical parameters at the lutocline is intriguing and we interpret this as a clear sign for different water sources for the lake and the CB and TR chimneys (Figures 6, 7). In fact, the electrical conductivity, temperature, ion concentrations and stable isotopic composition of the chimney water are in line with values typical for waters from the Jura Mountains karst system.
Typical electrical conductivity values for the karst groundwater in wells located at the northern lake shore and springs in the catchments of the Seyon and Serrières rivers lie between 400 and 600 μS/cm (locations in Figure 1). Springs of the Seyon/Serrières catchment: 400–600 μS/cm (Mathey, 1976); water pumped from the Malm (90%, Portlandian), and Cretaceous in the Bevaix-Treytel well: ~400 μS/cm (Muralt, 1999); water pumped from the Malm (96%, Portlandian) and Cretaceous (Valanginian) in the St-Aubin wells: 465–505 μS/cm (Centre d'hydrogéologie, 2000). Overall, these values agree with the 404 to 413 μS/cm measured in the chimneys of the CB, TR3, and TR2 pockmarks (Figure 6).
Water temperature in the St-Aubin well and in a karst spring nearby is 11–14°C (Centre d'hydrogéologie, 2000), and in the Bevaix-Treytel well it is 9–14°C (Muralt, 1999). The maximal water temperature in the chimneys of 8–8.5°C lies thus slightly below the cited ranges (Figure 6). A possible explanation for these lower values is that the karst water is cooling during the rise through the chimney. Thus, the development of the temperature pattern might be related to the rising velocity of the water and the diffusive heat exchange with the lake's bottom water. Yet, this is subject of further research. Still, water temperatures in the chimney are clearly warmer as compared to the lake's bottom water, especially toward the bottom. We interpret this as strong evidence for two different water sources.
Ca2+ concentrations in a karst spring in Yverdon-les-Bains (Cossaux spring; Figure 1) lie between 67–77 mg/l (Muralt, 1999), thus very close to the concentrations measured in the CB chimney (Figure 7B). Ca2+ concentrations are not available for the wells at Bevaix-Treytel and St-Aubin. Mg2+ in the same karst spring lies at 14–17.5 mg/l, thus a bit lower than in the pockmark chimney (20–22 mg/l) but still significantly higher than in the lake water (~6 mg/l) (Supplementary Figure 2). concentrations in the spring water are 5–11 mg/l and diss. O2 concentrations 3.5–6.5 mg/l. This demonstrates a discrepancy with the chimney water where and diss. O2 is zero but ~2 mg/l was measured. The presence of but the absence of is typical for anoxic groundwaters where the decomposition of organic matter has consumed all O2 and and where is released from N-containing organic matter or produced by the dissimilatory reduction of to ammonium. Anoxic conditions in the pockmark mud are also indicated by comparatively high Fe2+ concentrations (Figure 7C). Hence, we suggest that the originally oxygenated karst groundwater was depleted of oxygen once it entered the chimney and mixed with the lacustrine sediments. Lacustrine and marine sediments are often characterized by anoxic conditions as it has been documented before (e.g., Schaller and Wehrli, 1997; Tribovillard et al., 2006).
The isotopic composition of the Bevaix-Treytel well water (δ18O = −10.22%0 ± 0.14; Muralt, 1999) stands in good agreement with the −10.10%0 ± 0.02 of the chimney water (Figure 7B). Groundwaters are not exposed to evaporation and recondensation, therefore, these quasi-identical values provide robust evidence for the same water source in the well and in the pockmark chimney. Also, the calculated infiltration altitude of 1016 and 822 m asl (using Equations 1, 2) corresponds to the average elevation of 940 m asl between the lake surface (429 m asl) and the highest point on the southernmost fold of the Jura Mountains at the extent of the lake (1450 m asl). This suggests that the water in the karst system that is feeding the CB pockmark infiltrates along the full relief between the lake level and the highest elevation of the adjacent Jura fold. Overall, this agrees with known groundwater flow paths showing that karst springs at the level of LL, CB, and TR are fed by precipitation infiltrating on this southernmost Jura flank (Pasquier et al., 1999, 2006).
Evidence for Vertical Upward Flow in the Pockmark Chimneys
Evidence for a vertical upward flow in the CB chimney is given primarily by sedimentological data. The increase of the mud density and of the sand fraction with depth in the chimney demonstrates that the sediment would settle according to gravitation (Figures 7D,F). However, the sediment is kept in suspension as indicated by the successful sampling of the mud with the Niskin bottle as well as the ROV video material demonstrating liquefied sediments. Hence, this non-consolidated fluid-mud system presents strong evidence for a vertical upward flow in the chimney, which is also supported by the mini mud volcanoes observed on the sediment-suspension surfaces at CB and TR. Based on three observations we currently hypothesize that this flow happens quite slowly, possibly in the range of centimeters per hour. (i) In the CTD profiles (Figure 6) temperature is, in contrast to electrical conductivity, not constant in the chimneys but shows an irregular cooling toward the surface. This may indicate that there is sufficient time for the groundwater to adapt to the lake-bottom temperature during its migration through the chimney and agrees with the much higher diffusivity of heat compared to salt. (ii) When the ROV circulated above the suspension surface a groundwater signal could only be caught when the vehicle nearly touched or really touched the sediment (Figure 5). This indicates a fast mixing of the chimney water with the large body of the lake water, i.e., a low flow rate of the chimney water through the lutocline. (iii) The beige sectors on the suspension surface indicate deposition of modern authigenic calcite (best visible in Supplementary Video at 02:04). This suggests that the mini mud volcanoes are relatively stable features over the duration of at least months if not years. We thus hypothesize that if the flow rate was higher the mini mud volcanoes and thus probably also the suspension surface would be more dynamic. As a consequence, we propose that processes inside the pockmark, such as the formation of the observed temperature and electrical-conductivity profiles, are not as tightly linked to precipitation as the discharge in the karst system (7–14 days, see section Precipitation Prior to Field Campaigns). Exceptions could be particularly strong events that heavily increase the hydraulic pressure in the karst triggering a sediment expulsion event as it happened in the past (Reusch et al., 2016). Overall, however, further research is required regarding these processes.
Noteworthy when discussing evidence for upward flow is also the TOC and TIC signature of the chimney sediments as well as the absence of modern 137Cs activity (in Switzerland due to nuclear bomb peak in 1963 and the Chernobyl nuclear accident in 1986 (e.g., Wirth et al., 2011) and of rests of aquatic and terrestrial organisms. The TOC and TIC contents of 0.3 and 5.1 wt% closely correspond to the values found for the overflow deposits in the sedimentary succession surrounding the pockmarks (Loher et al., 2016; Reusch et al., 2016; Figure 2). Lithology LT4 describing these overflow deposits in Loher et al. (2016) is characterized by TOC and TIC values of 0.2–1.1 and 4.5–6.8 wt%, thus very similar to the pockmark mud. Importantly, these values much better correspond to the rather clastic-dominated early Holocene sediments (TOC = 0.2–1.1 wt%, TIC = 4.5–7.5 wt%) than to the carbonate-dominated late Holocene sediments (TOC = 0.6–2.1 wt%, TIC = 5.7–9.6 wt%; both Loher et al., 2016). The found TOC and TIC signature is probably also representative for clastic-dominated deglaciation sediments, since a similar composition as for the clastic-dominated early Holocene sediments is likely. Yet, no reference values exist for the deglaciation sediments as they are located beyond the depth of common lake-coring systems. Importantly, also the uppermost sample at 2 m depth in the chimney shows the same signature as the three deeper samples. This suggests that the sediments have been well-mixed within the chimney, otherwise the uppermost sample would possibly carry a late Holocene, thus carbonate-dominated, signature. The gray color that is characteristic for deglaciation and early Holocene sediments in Lake Neuchatel dominates the interior of the mini mud volcanoes and thus underlines this interpretation. Based on the TOC and TIC content of the chimney sediments, together with the zero 137Cs activity, we therefore conclude that the pockmark mud consists of liquefied sediments from the entire sediment column, i.e., of clastic-dominated deglaciation and early Holocene sediments (~54 m thick) as well as to a small fraction of carbonate-dominated late Holocene sediments (~6 m thick; Reusch et al., 2016).
Evidence for LGD at CB, TR, and LL
Evidence that LGD via the giant pockmarks is hydraulically possible is provided by the artesian pressure in the 300 m deep drinking water well Bevaix-Treytel (Pasquier et al., 1999) (Figure 1). Horizontal distance to the TR pockmark is 1500 m. In the well, water is captured from the Valanginian (Cretaceous) aquifer located at 330–290 m asl (i.e., at 120–160 m depth in the well; 200 l/min) and the Portlandian (Malm) aquifer at 270–170 m asl (i.e., at 180–280 m depth in the well; total of 4600 l/min i.e., 96%). Artesian pressure monitored at the surface fluctuates with precipitation between about 6 and 10 bar (surface level at 450 m asl; Matthey, 1997; Eli10, public water supply). Hence, hydraulic pressure in the Malm aquifer is estimated at 26–30 bar: 6–10 bar plus a conservatively estimated hydrostatic pressure of ~20 bar (i.e., 200 m depth). This is a conservative estimation because we assume that most of the water volume captured from the Portlandian derives from its upper part (at ~200 m depth in the well). For enabling LGD, the hydraulic pressure in the karst has to exceed the hydrostatic pressure of the lake's water column (13.4 bar for 134 m water depth at CB) and of the chimney (~9 bar: 60 m chimney height with an average density of ~1.5 g/cm3) estimated at ~22.4 bar (Figure 6). The largest uncertainty in this calculation is the density estimation of the pockmark mud. However, even if we use 1.7 g/cm3 for the pockmark mud in case the density strongly increases below our sampling depths, i.e., below 41 m, the hydrostatic pressure (~23.6 bar) would still be smaller than the conservatively estimated hydraulic pressure.
This pressure estimation corroborates our other evidences for LGD via the suspension-filled pockmarks CB and TR. Continuing this reasoning, LGD might even be stronger at the funnel-shaped pockmarks LL and NS since the absence of the sediment suspension reduces the hydrostatic pressure that has to be overcome, provided that the hydraulic pressure in the karst system is similar at all pockmark locations. In addition, the prominent fault zone at LL (e.g., Ibele, 2011) might, combined with the absence of a sediment suspension, enable a more important LGD than at CB and TR.
Conclusions
Lacustrine and marine pockmarks are potential hot spots of subaquatic groundwater discharge. They are often overlooked and are difficult to investigate due to their hidden nature but possibly represent an important element of the water cycle. We found that at least three (CB, TR, LL) of the four giant pockmarks are hydraulically connected to the karst system and that LGD is active. Closer investigations on the fourth giant pockmark (NS) still have to be realized but based on the present results we hypothesize that LGD is also active at NS. The pore water of the mud in the chimneys shows properties characteristic for karst water from the Jura Mountains (parameters: temperature, electric conductivity, major ion concentrations, stable water isotopic composition) clearly contrasting to the lake water. Evidence for groundwater-filled chimneys does not necessarily mean that LGD is happening. Yet, when cruising with a ROV just above the lutoclines of the suspension-filled pockmarks (CB, TR) and within the funnel-shaped pockmark (LL) positive anomalies in electrical conductivity typical for karst water were recorded. Furthermore, the suspension surface is characterized by mini mud volcanoes, corroborating an upward flow of water through the lutocline into the lake. The increase with depth of the density of the mud and of the sand fraction in the best-investigated CB chimney (sampled to a depth of 41 m) demonstrates that the sediment would settle according to gravitation but that a flow from below keeps it in suspension. Furthermore, the mineralogical and organic signature of the chimney sediments is very uniform at all sampled depths in the chimney (2–41 m) and is characteristic for the clastic-dominated sediments of the early Holocene and the glacio-lacustrine clays of the deglaciation sequence. This indicates that the entire sediment column has been mobilized and well mixed. Finally, the hydraulic pressure in the main aquifer of the Jura Mountains (Malm, Portlandian) exceeds the hydrostatic pressure at the pockmark locations and thus confirms that LGD is hydraulically possible.
With this study we took another step forward in understanding the functioning of the giant pockmarks in Lake Neuchatel. In addition, our results contribute to the research subject of the connectivity of lakes and oceans with groundwater systems, and thus on the importance of groundwater discharge for their hydrological and also chemical (ions, nutrients) balance. Accordingly, the next research objective for Lake Neuchatel will be the quantification of LGD via the giant pockmarks, thus the assessment of their lake-wide relevance.
Data Availability Statement
The datasets presented in this study can be found in online repositories: https://doi.org/10.1594/PANGAEA.918633, https://doi.org/10.1594/PANGAEA.918634, and https://doi.org/10.1594/PANGAEA.918656.
Author Contributions
SW designed research, conducted fieldwork and laboratory analyses, and was leading manuscript writing. DB contributed to fieldwork, data interpretation, and manuscript writing. JZ contributed to laboratory analyses, data interpretation and manuscript writing. All authors contributed to the article and approved the submitted version.
Funding
This research was financed by the overhead funds of the University of Neuchatel (U.01851, project 12.5) and the Swiss National Science Foundation (grant 175820).
Conflict of Interest
The authors declare that the research was conducted in the absence of any commercial or financial relationships that could be construed as a potential conflict of interest.
Acknowledgments
Important thanks go to Anna Reusch and Michael Strasser for openly sharing and discussing previous data collected on the Lake Neuchatel pockmarks. We thank Jörg Mathieu and the lake police in Yverdon for the support during the ROV survey, the Service de l'énergie et de l'environnement' of the Canton of Neuchatel as well as Jean-Blaise Perrenoud and Olivier Besson for making the sampling campaigns possible. Vincent Gruber, Simone Hintze, Amandine Pillonel, and Sébastien Levanchy greatly assisted in the field and in the lab. Many thanks go also to François Straub, Phyco-Eco, for analyzing the organic remains in the pockmark mud, Nathalie Dubois, Eawag, for the 137Cs analysis, and the Geographical Institute of the University of Bern for the use of the Malvern Mastersizer.
Supplementary Material
The Supplementary Material for this article can be found online at: https://www.frontiersin.org/articles/10.3389/frwa.2020.00013/full#supplementary-material
References
Bonhomme, C., Poulin, M., Vinçon-Leite, B., Saad, M., Groleau, A., Jézéquel, D., et al. (2011). Maintaining meromixis in Lake Pavin (Auvergne, France): the key role of a sublacustrine spring. Compt. Rendus Geosci. 343, 749–759. doi: 10.1016/j.crte.2011.09.006
Burnett, W. C., Bokuniewicz, H., Huettel, M., Moore, W. S., and Taniguchi, M. (2003). Groundwater and pore water inputs to the coastal zone. Biogeochemistry 66, 3–33. doi: 10.1023/B:BIOG.0000006066.21240.53
Bussmann, I., Schlömer, S., Schlüter, M., and Wessels, M. (2011). Active pockmarks in a large lake (Lake Constance, Germany): effects on methane distribution and turnover in the sediment. Limnol. Oceanogr. 56, 379–393. doi: 10.4319/lo.2011.56.1.0379
Casamitjana, X., and Roget, E. (1993). Resuspension of sediment by focused groundwater in lake banyoles. Limnol. Oceanogr. 38, 643–656. doi: 10.4319/lo.1993.38.3.0643
Centre d'hydrogéologie (2000). Rapport Hydrogéologique sur les Forages d'exploitations (SA2 et SA3), Commune de St-Aubin - Sauges. Neuchâtel: Université de Neuchâtel.
Church, T. M. (1996). An underground route for the water cycle. Nature 380, 579–580. doi: 10.1038/380579a0
Cline, J. D. (1969). Spectrophotometric determination of hydrogen sulfide in waters. Limnol. Oceanogr. 14, 454–458. doi: 10.4319/lo.1969.14.3.0454
Colomer, J., Ross, J. A., and Casamitjana, X. (1998). Sediment entrainment in karst basins. Aquat. Sci. 60, 338–358. doi: 10.1007/s000270050045
Colomer, J., Serra, T., Soler, M., and Casamitjana, X. (2002). Sediment fluidization events in a lake caused by large monthly rainfalls. Geophys. Res. Lett. 29, 101–103. doi: 10.1029/2001GL014299
Del Don, C., Hanselmann, K. W., Peduzzi, R., and Bachofen, R. (2001). The meromictic alpine lake cadagno: orographical and biogeochemical description. Aquat. Sci. 63, 70–90. doi: 10.1007/PL00001345
Fleury, P., Bakalowicz, M., and De Marsily, G. (2007). Submarine springs and coastal karst aquifers: a review. J. Hydrol. 339, 79–92. doi: 10.1016/j.jhydrol.2007.03.009
Foley, L. J. (2018). Karst-channelled intertidal submarine groundwater discharge (SGD) conditions the form of the rock pool sessile assemblage. Estuarine Coastal Shelf Sci. 213, 236–244. doi: 10.1016/j.ecss.2018.08.014
Gorin, G., Morend, D., and Pugin, A. (2003). Bedrock, Quaternary sediments and recent fault activity in central lake neuchâtel, as derived from high-resolution reflection seismics. Eclogae Geol. Helv. 96, 3–10. doi: 10.1007/978-3-0348-7992-7_2
Granin, N. G., and Granina, L. Z. (2002). Gas hydrates and gas venting in Lake Baikal. Geol. Geofizika 43, 629–637. doi: 10.31951/2658-3518-2019-A-6-316
Hammer, Ø., and Webb, K. E. (2010). Piston coring of inner oslofjord pockmarks, Norway: constraints on age and mechanism. Norwegian J. Geol. 90, 79–91.
Hovland, M., Gardner, J. V., and Judd, A. G. (2002). The significance of pockmarks to understanding fluid flow processes and geohazards. Geofluids 2, 127–136. doi: 10.1046/j.1468-8123.2002.00028.x
Ibele, T. (2011). Tectonics of the Western Swiss Molasse Basin during Cenozoic Times. Thesis No. 1714. Fribourg: University of Fribourg.
Judd, A., and Hovland, M. (2007). Seabed Fluid Flow – Impact of Geology, Biology and the Marine Environment. Cambridge: Cambride University Press. doi: 10.1017/CBO9780511535918
King, L. H., and Maclean, B. (1970). Pockmarks on the scotian shelf. Geol. Soc. Am. Bull. 81, 3141–3148. doi: 10.1130/0016-7606(1970)81[3141:POTSS]2.0.CO;2
Komada, T., Anderson, M. R., and Dorfmeier, C. L. (2008). Carbonate removal from coastal sediments for the determination of organic carbon and its isotopic signatures, δ13C and Δ14C: comparison of fumigation and direct acidification by hydrochloric acid. Limnol. Oceanogr. Methods 6, 254–262. doi: 10.4319/lom.2008.6.254
Lambert, P. (1999). La sédimentation dans Ie Lac de Neuchâtel (Suisse): Processus Actuels et Reconstitution Paléoenvironnementale de 1500BP à nos Jours. Neuchâtel: Institut de Géologie, Université de Neuchâtel.
Lewandowski, J., Meinikmann, K., Nützmann, G., and Rosenberry, D. O. (2015). Groundwater – the disregarded component in lake water and nutrient budgets. Part 2: effects of groundwater on nutrients. Hydrol. Process. 29, 2922–2955. doi: 10.1002/hyp.10384
Loher, M., Reusch, A., and Strasser, M. (2016). Long-term pockmark maintenance by fluid seepage and subsurface sediment mobilization – sedimentological investigations in lake neuchâtel. Sedimentology 63, 1168–1186. doi: 10.1111/sed.12255
Mathey, B. (1976). Hydrogéologie des Bassins de la Serrière et du Seyon. Neuchâtel: Université de Neuchâtel.
Matthey, B. (1997). Délimitation des zones de protection des puits de Treytel, Rapport. Ingénieurs-Conseils S.A., Montezillon.
Mazzini, A., Svensen, H. H., Planke, S., Forsberg, C. F., and Tjelta, T. I. (2016). Pockmarks and methanogenic carbonates above the giant Troll gas field in the Norwegian North Sea. Mar. Geol. 373, 26–38. doi: 10.1016/j.margeo.2015.12.012
Meteoswiss (2018). The Climate of Switzerland. Available online at: https://www.meteoswiss.admin.ch/home/climate/the-climate-of-switzerland.html (accessed 03, 2020).
Muralt, R. (1999). Processus Hydrogéologiques et Hydrochimiques Dans les Circulations Profondes des Calcaires du Malm de l'arc Jurassien (zones de Delémont, Yverdon-les-Bains, Moiry, Genève et Aix-les-Bains. Neuchâtel: Université de Neuchâtel.
Ndiaye, M., Clerc, N., Gorin, G., Girardclos, S., and Fiore, J. (2014). Lake Neuchâtel (Switzerland) seismic stratigraphic record points to the simultaneous Würmian deglaciation of the Rhone Glacier and jura ice cap. Q. Sci. Rev. 85, 1–19. doi: 10.1016/j.quascirev.2013.11.017
Nickel, J. C., Di Primio, R., Mangelsdorf, K., Stoddart, D., and Kallmeyer, J. (2012). Characterization of microbial activity in pockmark fields of the SW-Barents Sea. Mar. Geol. 332–334, 152–162. doi: 10.1016/j.margeo.2012.02.002
Oehler, T., Mogollón, J. M., Moosdorf, N., Winkler, A., Kopf, A., and Pichler, T. (2017). Submarine groundwater discharge within a landslide scar at the French mediterranean coast. Estuarine Coastal Shelf Sci. 198, 128–137. doi: 10.1016/j.ecss.2017.09.006
Pasquier, F., Bouzelboudjen, M., and Zwahlen, F. (1999). Carte hydrogéologique de la Suisse 1:100000: No 6 Sarine/Saane. Schweizerische Geotechnische Kommission und Landeshydrologie und -geologie (LHG).
Pasquier, F., Zwahlen, F., and Bichet, V. (2006). Carte hydrogéologique de la Suisse 1:100000: No 8 Vallorbe - Léman nord. Schweizerische Geotechnische Kommission SGTK.
Pau, M., Hammer, Ø., and Chand, S. (2014). Constraints on the dynamics of pockmarks in the SW Barents Sea: evidence from gravity coring and high-resolution, shallow seismic profiles. Mar. Geol. 355, 330–345. doi: 10.1016/j.margeo.2014.06.009
Pearson, F. J. Jr, Balderer, W., Loosli, H. H., Lehmann, B. E., Matter, A., et al. (1991). Applied isotope hydrogeology – a case study in northern Switzerland. Stud. Environ. Sci. 43:85.
Pralle, N., Külzer, M., and Gudehus, G. (2003). “Experimental evidence on the role of gas in sediment liquefaction and mud volcanism,” in Subsurface Sediment Mobilization, eds P. Van Rensbergen, R. R. Hillis, A. J. Maltman, and C. K. Morley (London: Geological Society, Special Publications), 159–171. doi: 10.1144/GSL.SP.2003.216.01.11
Preusser, F., Reitner, J. M., and Schlüchter, C. (2010). Distribution, geometry, age and origin of overdeepened valleys and basins in the Alps and their foreland. Swiss J. Geosci. 103, 407–426. doi: 10.1007/s00015-010-0044-y
Reusch, A. (2016). Sublacustrine paleoseismology and fluid flow in the Western Swiss Molasse Basin: New constraints from the sedimentary archive of Lake Neuchâtel (Mass-transport deposits, subsurface sediment mobilization and geomorphology) (Diss.) Zurich: ETH Zurich.
Reusch, A., Loher, M., Bouffard, D., Moernaut, J., Hellmich, F., Anselmetti, F. S., et al. (2015). Giant lacustrine pockmarks with subaqueous groundwater discharge and subsurface sediment mobilization. Geophys. Res. Lett. 42, 3465–3473. doi: 10.1002/2015GL064179
Reusch, A., Moernaut, J., Anselmetti, F. S., and Strasser, M. (2016). Sediment mobilization deposits from episodic subsurface fluid flow—a new tool to reveal long-term earthquake records? Geology 44, 243–246. doi: 10.1130/G37410.1
Rosenberry, D. O., Lewandowski, J., Meinikmann, K., and Nützmann, G. (2015). Groundwater - the disregarded component in lake water and nutrient budgets. Part 1: effects of groundwater on hydrology. Hydrol. Process. 29, 2895–2921. doi: 10.1002/hyp.10403
Roy, S., Hovland, M., and Braathen, A. (2016). Evidence of fluid seepage in grønfjorden, spitsbergen: implications from an integrated acoustic study of seafloor morphology, marine sediments and tectonics. Mar. Geol. 380, 67–78. doi: 10.1016/j.margeo.2016.07.002
Ryzak, M., and Bieganowski, A. (2011). Methodological aspects of determining soil particle-size distribution using the laser diffraction method. J. Plant Nutr. Soil Sci. 174, 624–633. doi: 10.1002/jpln.201000255
Schaller, T., and Wehrli, B. (1997). Geochemical-focusing of manganese in lake sediments - an indicator of deep-water oxygen conditions. Aquat. Geochem. 2, 359–378. doi: 10.1007/BF00115977
Schwalb, A. (1992). Die Sedimente des Lac de Neuchatel (Schweiz): Rekonstruktion spät- und postglazialer Klima- und Umweltveränderungen. Université de Neuchâtel.
Schwalb, A., Lister, G. S., and Kelts, K. (1994). Ostracode carbonate δ18O- and δ13C-signature of hydrological and climatic changes affecting Lake Neuchâtel, Switzerland, since the latest pleistocene. J. Paleolimnol. 11, 3–17. doi: 10.1007/BF00683267
Stookey, L. L. (1970). Ferrozine—a new spectrophotometric reagent for iron. Anal. Chem. 42, 779–781. doi: 10.1021/ac60289a016
Straub, F. (1993). “Diatoms and their preservation in the sediments of Lake Neuchâtel (Switzerland) as evidence of past hydrological changes,” in Proceedings of 12th International Diatom Symposium, Renesse 1992, Hydrobiologia 269/270, ed H. Van Dam (Renesse), 167–178. doi: 10.1007/BF00028016
Tribovillard, N., Algeo, T. J., Lyons, T., and Riboulleau, A. (2006). Trace metals as paleoredox and paleoproductivity proxies: an update. Chem. Geol. 232, 12–32. doi: 10.1016/j.chemgeo.2006.02.012
Ussler Iii, W., Paull, C. K., Boucher, J., Friederich, G. E., and Thomas, D. J. (2003). Submarine pockmarks: a case study from Belfast Bay, Maine. Mar. Geol. 202, 175–192. doi: 10.1016/S0025-3227(03)00261-5
Wessels, M., Bussmann, I., Schloemer, S., Schlüter, M., and Böder, V. (2010). Distribution, morphology, and formation of pockmarks in Lake Constance, Germany. Limnol. Oceanogr. 55, 2623–2633. doi: 10.4319/lo.2010.55.6.2623
Keywords: pockmark, LGD lacustrine groundwater discharge, SGD submarine groundwater discharge, Lake Neuchatel, chimney, sediment fluidization, karst, ROV remotely operated vehicle
Citation: Wirth SB, Bouffard D and Zopfi J (2020) Lacustrine Groundwater Discharge Through Giant Pockmarks (Lake Neuchatel, Switzerland). Front. Water 2:13. doi: 10.3389/frwa.2020.00013
Received: 20 March 2020; Accepted: 26 May 2020;
Published: 30 June 2020.
Edited by:
Heye Reemt Bogena, Helmholtz Association of German Research Centers (HZ), GermanyReviewed by:
Ingeborg Bussmann, Alfred Wegener Institute Helmholtz Centre for Polar and Marine Research (AWI), GermanyAndreas Panagopoulos, Institute of Soil and Water Resources (ISWR), Greece
Copyright © 2020 Wirth, Bouffard and Zopfi. This is an open-access article distributed under the terms of the Creative Commons Attribution License (CC BY). The use, distribution or reproduction in other forums is permitted, provided the original author(s) and the copyright owner(s) are credited and that the original publication in this journal is cited, in accordance with accepted academic practice. No use, distribution or reproduction is permitted which does not comply with these terms.
*Correspondence: Stefanie B. Wirth, c3RlZmFuaWUud2lydGhAYWx1bW5pLmV0aHouY2g=